 Carsten Simon
 Vanessa-Nina Roth1,2
 Thorsten Dittmar
 Gerd Gleixner
- 1Molecular Biogeochemistry, Department Biogeochemical Processes, Max Planck Institute for Biogeochemistry, Jena, Germany
- 2Abteilung Umweltanalytik, Thüringer Landesanstalt für Umwelt und Geologie, Jena, Germany
- 3ICBM-MPI Bridging Group for Marine Geochemistry, Institute for Chemistry and Biology of the Marine Environment, University of Oldenburg, Oldenburg, Germany
- 4Helmholtz Institute for Functional Marine Biodiversity, University of Oldenburg, Oldenburg, Germany
Terrestrial dissolved organic matter (DOM) interlinks large carbon reservoirs of soils, sediments, and marine environments but remains largely uncharacterized on the molecular level. Fourier transform mass spectrometry (FTMS) has proven to be a powerful technique to reveal DOM chemodiversity and potential information encrypted therein. State-of-the-art FT-ICR MS (ion cyclotron resonance) instruments are yet inaccessible for most researchers. To evaluate the performance of the most recent Orbitrap analyzer as a more accessible alternative, we compared our method to an established 15 T FT-ICR MS on a diverse suite of 17 mainly terrestrial DOM samples regarding (1) ion abundance patterns, (2) differential effects of DOM type on information loss, and (3) derived biogeochemical information. We show that the Orbitrap provides similar information as FT-ICR MS, especially for compound masses below 400 m/z, and is mainly limited by its actual resolving power rather than its sensitivity. Ecosystems that are dominated by inputs of plant-derived material, like DOM from soil, bog, lake, and rivers, showed remarkably low average mass to charge ratios, making them also suitable for Orbitrap measurements. The additional information gained from FT-ICR MS was highest in heteroatom-rich (N, S, P) samples from systems dominated by internal cycling, like DOM from groundwater and the deep sea. Here FT-ICR MS detected 37% more molecular formulae and 11% higher ion abundance. However, the overall information content, which was analyzed by multivariate statistical methods, was comparable for both data sets. Mass spectra-derived biogeochemical trends, for example, the decrease of DOM aromaticity during the passage through terrestrial environments, were retrieved by both instruments. We demonstrate the growing potential of the Orbitrap as an alternative FTMS analyzer in the context of challenging analyses of DOM complexity, origin, and fate.
Introduction
Dissolved organic matter (DOM) links the organic matter pools of terrestrial and marine ecosystems through transport of material derived from biota, degrading plant litter, and soil organic matter (SOM) to the ocean (Marín-Spiotta et al., 2014; Ward et al., 2017). Taken together, both pools hold about four times more carbon than the atmospheric carbon pool and minor changes in their oxidation or mobilization rates may have major climatic impacts (Heimann and Reichstein, 2008; Carlson and Hansell, 2014). Therefore, it is necessary to better understand and identify the underlying processes that control organic matter dynamics. Molecular-level investigations greatly improved our understanding of carbon dynamics in the recent years and highlighted the importance of high resolution analytical techniques in Earth Science (Marschner et al., 2008; Kujawinski, 2011; Schmidt et al., 2011; Gleixner, 2013; Kallenbach et al., 2016; Medeiros et al., 2016; Zark et al., 2017). Ultrahigh resolution mass spectrometry like Fourier-transform mass spectrometry (FTMS) coupled to soft ionization techniques as electrospray ionization (ESI, ESI-FTMS) uniquely enables, for example, the identification of thousands of intact (non-fragmented) individual molecular formulae from complex mixtures like DOM (Hertkorn et al., 2008). The observed structural heterogeneity in terms of molecular formulae, which is larger in terrestrial DOM than in marine DOM, encodes source materials, transforming processes and their controling environmental and biological factors (Kellerman et al., 2014; Marín-Spiotta et al., 2014; Roth et al., 2014; Seifert et al., 2016; Bailey et al., 2017; Ward et al., 2017; Zark and Dittmar, 2018). Unfortunately, the advances in our understanding of the molecular DOM “code” are small as the access to ultrahigh resolution mass spectrometry is limited.
So far ultrahigh resolution analyses have been limited to ion cyclotron resonance (ICR) instruments (Marshall et al., 1998; Hertkorn et al., 2008; Qi and O’Connor, 2014) and only few of these systems are available due to the high instrument and maintenance costs of the superconducting magnets needed to achieve ultrahigh resolution. The Orbitrap mass analyzer, which uses electrostatic fields for ion trapping instead of magnetic fields (Supplementary Table S1; Zubarev and Makarov, 2013), is a more economical alternative to FT-ICR MS instruments as they, for example, require no extensive cooling. However, Orbitrap mass analyzers have a ∼10-fold lower mass resolution that limits separation of peaks in the higher mass range (Supplementary Table S1). Even so, Orbitrap instruments have been successfully applied for characterizing complex natural organic materials (Supplementary Table S2), including DOM (Pomerantz et al., 2011; Cortés-Francisco and Caixach, 2015; Hawkes et al., 2016), humic and fulvic acids (Galindo and Del Nero, 2015; Nebbioso and Piccolo, 2015), petroleum and bio-oil-related material (Pomerantz et al., 2011; Zhurov et al., 2013; Rowland et al., 2014; Staš et al., 2015), and extraterrestrial organic materials (Danger et al., 2013; Smith et al., 2014), yet it remains unclear how comparable the results of both instrument types are. Addressing this question is even more pivotal when aiming to compare trends in larger-scale DOM sample sets achieved on different instruments (Swenson et al., 2014).
Previous studies that compared both instrument types used only one or two samples, or their mixtures, for the comparison (Supplementary Table S2). The authors underlined the potential of the Orbitrap analyzer and demonstrated general data comparability. While several authors state that the lower resolving power of their Orbitrap instruments limits the application for detailed molecular analysis (Supplementary Table S2), they generally proved that fast sample characterization using molecular indicators or fingerprints of the most abundant signals is feasible (Pomerantz et al., 2011; Smith et al., 2012; Hawkes et al., 2016; Mangal et al., 2016). One of the more recent technical developments is the Orbitrap Elite featuring a resolution up to 240,000 at m/z 400 (Supplementary Table S1; Denisov et al., 2012; Zhurov et al., 2013). It includes a modified version of the analyzer cell (high-field Orbitrap) and an enhanced FT algorithm (“eFT”), ultimately leading to a significant increase in analytical capacities compared to earlier instruments by reducing the difference in resolution to ICR instruments to a factor of four. ICR instruments undoubtedly have the overall better analytical performance, especially in the higher mass range. However, for the analysis of the molecular composition of terrestrial DOM, which has an intensity maximum of masses around 400 Da, Orbitrap Elite analyzers might be a cost-effective alternative.
The molecular composition of terrestrial DOM, which is a snapshot of the sum of all ecosystem activities, is highly diverse between ecosystems and highly dynamic within ecosystems (Kellerman et al., 2014; Roth et al., 2014, 2015; Seifert et al., 2016; Bailey et al., 2017). The reproduction of this complexity has so far not been the focus of previous studies that compared mainly the analytical performance of both analyzers. It is nevertheless necessary to evaluate whether the Orbitrap analyzer resolves the important signals that are needed to separate DOM samples based on their origin and if both analyzers use the same mass signals to retrieve this information. Similarly, it is also necessary to assess whether the sensitivity of the instruments affects the obtained discrimination, as smaller signals may be undetected by the Orbitrap analyzer. These questions, which are centered on the information content of the samples, can only be solved using multiple samples that cover a wider range of terrestrial DOM samples. Therefore, we analyzed 17 DOM samples from varying environmental settings (Table 1) with an ICR analyzer and an improved Orbitrap analyzer and used statistical methods to compare their information content. In detail, we assessed the following questions:
(a) Does the Orbitrap analyzer detect similar formulae and reproduce the mass abundance patterns of the ICR analyzer in all samples?
(b) Are specific masses missing in the abundance patterns of the Orbitrap analyzer, and is this loss related to sample properties, instrumental resolution or sensitivity?
(c) Does the Orbitrap analyzer reproduce the discriminating information obtained from FT-ICR MS and from multivariate statistical analyses of the samples, and how well are molecular trends retrieved which were found in previous studies?
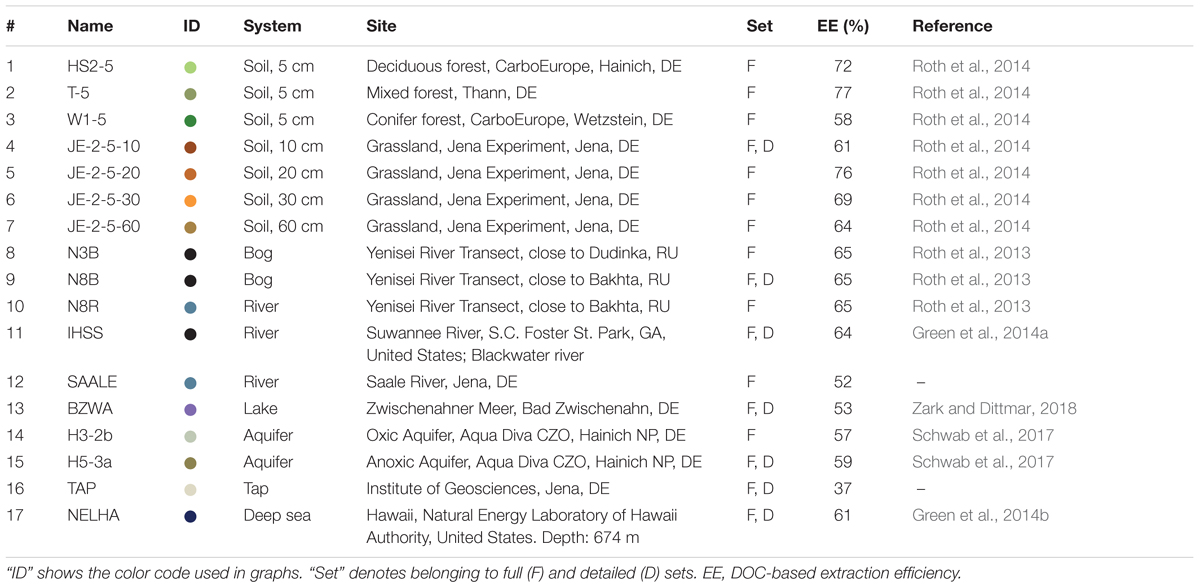
TABLE 1. Overview of water samples.
Materials and Methods
Sample Preparation
We used a diverse set of samples (Table 1), including two frequently used reference samples, a Suwannee river sample provided by the IHSS (International Humic Substances Society, 2R101N, Green et al., 2014a), and a deep sea sample (NEHLA) from North Equatorial Pacific Intermediate Water collected from the Hawaiian deep ocean water well (Green et al., 2014b). The other samples covered a large gradient of environmental settings and included water samples from bogs, soils, aquifers, lakes, rivers, and marine environments. As recommended earlier (Dittmar et al., 2008), all DOM samples were solid phase-extracted using PPL (modified styrene-divinylbenzene polymer) columns, ultrapure methanol (MS grade), ultrapure water, and hydrochloric acid (p.a.).
FT-ICR MS Measurements and Data Processing
FT-ICR MS measurements were performed on a Bruker SolariX equipped with a 15 T cryo-cooled magnet at the Marine Geochemistry group in Oldenburg, Germany (ICBM-MPI-bridging group, Institute for Chemistry and Biology of the Marine Environment, and Max Planck Institute for marine Microbiology in Bremen, Germany). This instrument is routinely used for state-of-the-art analyses of complex DOM samples (Riedel and Dittmar, 2014; Hawkes et al., 2016; Zark et al., 2017). All samples were diluted 1:1 (MeOH/ ultrapure water) at a defined dissolved organic carbon (DOC) concentration of 10 ppm; solely the lake sample (BZWA, Table 1) was measured at a concentration of 5 ppm DOC from solid-phase extraction (SPE-DOC) on instruments. All samples were ionized by electrospray (ESI) in negative mode (Supplementary Table S3). To improve the mass accuracy for subsequent formula assignment, raw data were internally recalibrated with a list of ubiquitous formulae found across environments within the software Data Analysis 5.0 (Bruker).
Orbitrap Measurements and Data Processing
Orbitrap measurements were performed at the Max Planck Institute for Biogeochemistry in Jena, Germany, on a Thermo Orbitrap Elite (Supplementary Table S1). The instrumental settings of the Orbitrap (Supplementary Table S3 and Supplementary Data Sheet S5) were optimized in order to yield a reproducible and stable signal that resembled the apparent spectrum shape and the ion abundance distribution of the IHSS reference material (at 20 ppm DOC) on both the FT-ICRMS (Table 1, Supplementary Figure S1, and Supplementary Table S4). All samples were measured with these optimized instrumental settings. The data processing strategy was similar to the data processing in the ICR system and details are given in short below. External calibration was performed daily to ensure sufficient mass accuracy for the recalibration and alignment (Liu et al., 2014). Data were obtained by the instrument software LTQ Tune Plus 2.7 (Thermo Fisher Scientific). The data were exported from Xcalibur (Thermo Fisher Scientific) and further processed by the open source software mmass (Strohalm et al., 2010), which allows similar processing steps as compared to the Bruker software. We transformed spectrum data into a readable format (mzML) using the open software Proteo Wizard (Chambers et al., 2012). Peak picking for internal recalibration was performed at 80% peak height in mmass. The internal recalibration list was derived from ubiquitous signals found in the FT-ICR MS dataset (Sleighter and Hatcher, 2008).
Processing of Ultrahigh Resolution Mass Data and Comparative Analyses
A method detection limit (MDL) was applied to all exported mass lists (Supplementary Note S1; Riedel and Dittmar, 2014). The individual spectra were aligned by in-house written software to match similar signals, yielding a crosstab with samples in columns and m/z values in rows. Subsequently, molecular formulae were generated for the matched list of peaks. Formula assignment included the following settings: number of C atoms 1–60; H 4–210; N 0–4; S 0–2; P 0–1; O 1–60, maximal O/C = 1, minimal H/C = 0.3, minimal double bond equivalent (DBE) = -0.5. These settings relate to assumptions on the probability to encounter specific elements, governed by, for example, knowledge on the elemental composition of DOC and solubility, but also known boundaries occupied by organic compounds (Petras et al., 2017). Molecular formulae were only assigned if the mass difference between measured and exact formula mass after internal recalibration was below 0.5 ppm. The probability of multiple formulae assignments per m/z value is increasing with m/z (Koch et al., 2007). The assignment rate (expressed as median per formula, Supplementary Figure S2) increased to 2 above m/z 600 for both instruments, but increased to 4 above m/z 950 in the Orbitrap data (Supplementary Figure S2B). Formulae with combinations of more than three heteroatoms N, S, or P were removed (only N3 and N4 being allowed, Rossel et al., 2016). In the following, we only took unambiguous formulae (i.e., single hits) into account. The crosstab was further cleaned for single entries according to published protocols (Rossel et al., 2016; Mostovaya et al., 2017), yielding a final list of formulae. To remove prospective contaminants from the samples, a signal-to-noise (S/N) ratio of blank peaks was defined. The m/z-dependent MDL value at a 99.8% confidence level was chosen as a noise measure. Only blank peaks with an S/N < 20 were kept in the dataset, accounting for the fact that contaminants often show significantly higher ion abundances. For comparison, all mass spectra were normalized to the sum of their peak intensities (including only peaks > S/N 5). The final crosstabs were handled in two ways for each instrument, depending on whether repeated measurements allowed us to further constrain the information:
(1) For a detailed in depth comparison of both instruments, a subset of seven representative samples covering broad ecosystem groups (bog, soil, river, lake, aquifer, etc.) was measured in replicate on both machines and processed separately (Table 1, Figure 1, and Supplementary Data Sheets S2, S4). Only peaks that were detected more than once in all replicates of a sample were included (Riedel and Dittmar, 2014). For Orbitrap data, the MDL estimate, originally developed on the ICR instrument, was increased by a factor of two to overcome the higher noise level of the instrument (Supplementary Note S1 and Supplementary Figure S3). To evaluate the analytical window of our Orbitrap method, we compared the two groups of formulae that were either detected by both methods and in the same sample (“Common”) or only by FT-ICR MS in the respective sample (“FT-ICR MS specific”). The final datasets were used to assess the ion abundance representation (section “Reproducibility of Ion Abundance Patterns”), the resolution of heteroatom-containing formulae, and the analytical window of the Orbitrap (section “Analytical Window: Assessment of Information Loss”).
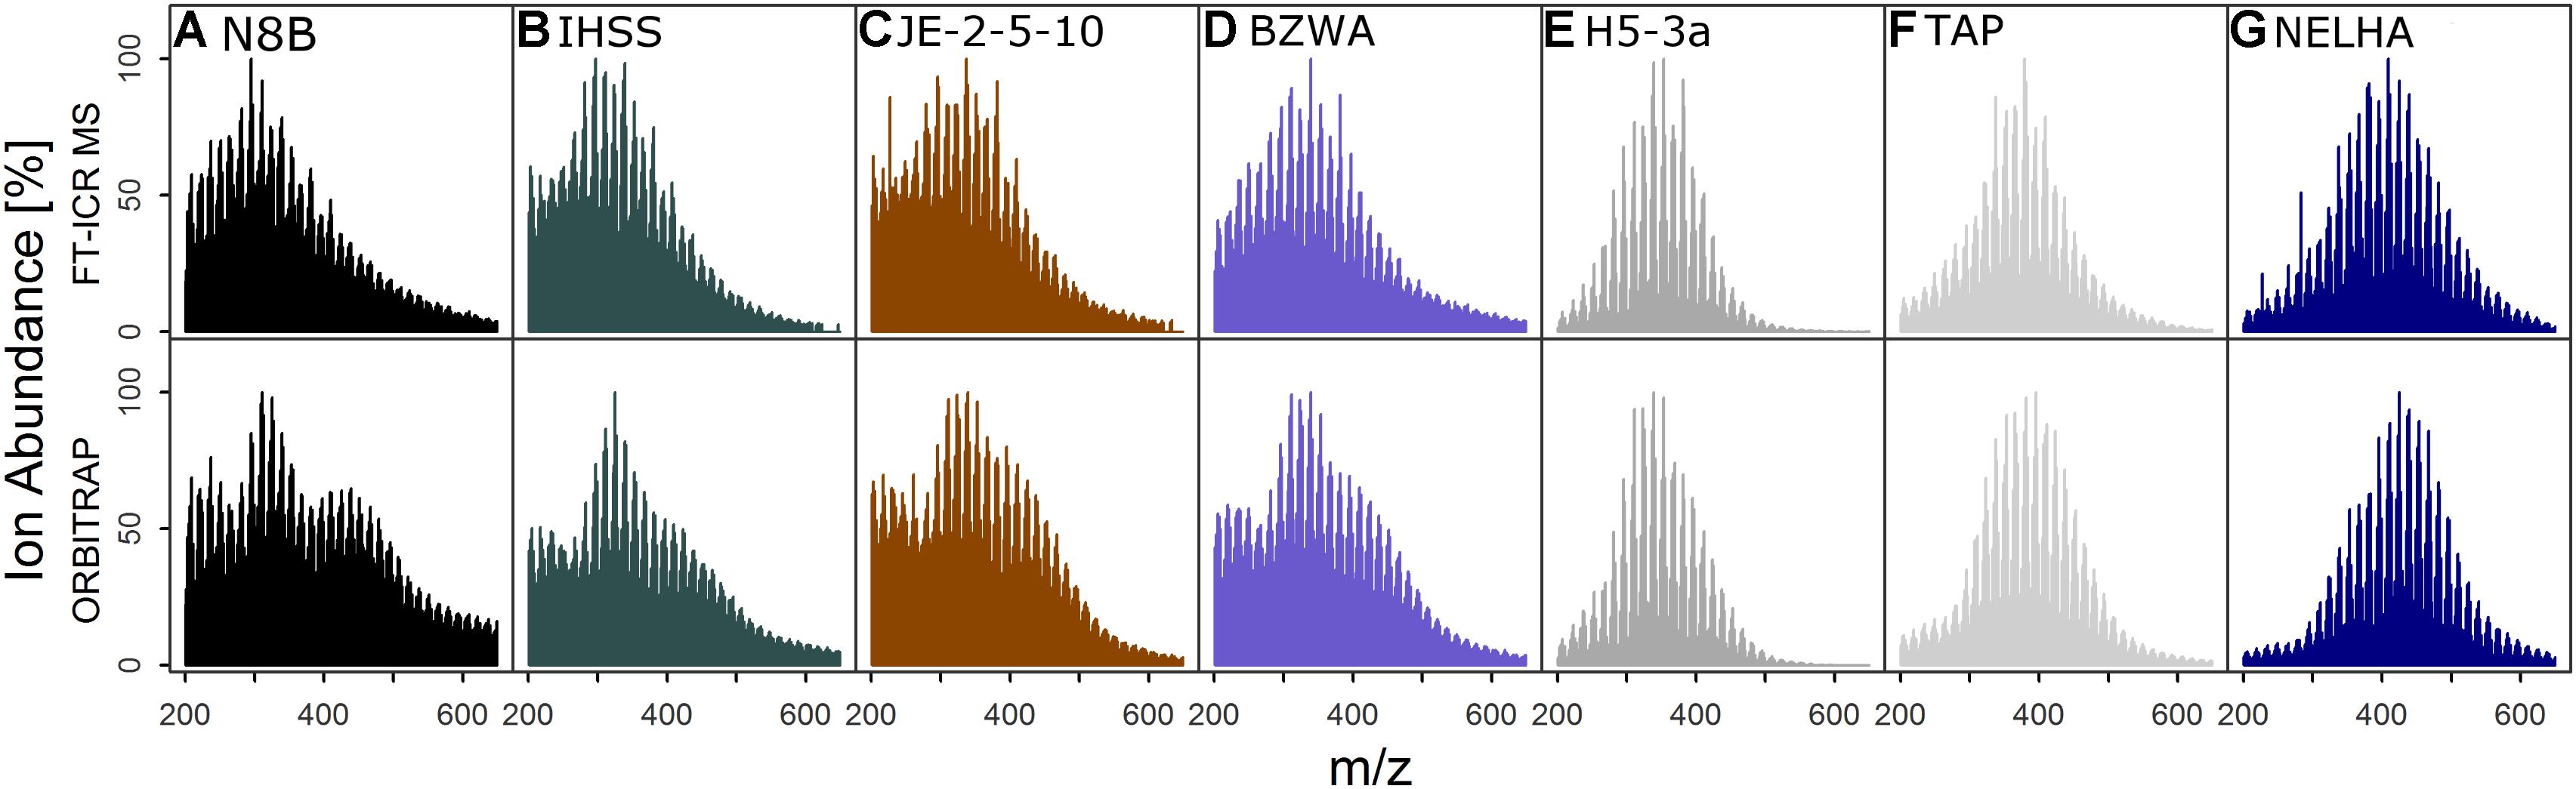
FIGURE 1. Ion abundance patterns of FT-ICR MS and Orbitrap of seven samples (Table 1, set “D”) selected for detailed analyses, showing the general congruence in spectrum shape (only commonly detected signals shown) for samples from (A) a bog, (B) a blackwater river, (C) shallow soil, (D) a lake, (E) an aquifer, (F) tap water, and (G) the deep sea. Colors are for visual guidance.
(2) For a general comparison of all samples (Table 1, Supplementary Figures S6a–q, and Supplementary Data Sheets S1, S3) including those without the additional constraint of a replicate measurement, we removed formulae that were detected in less than 10% across all measurements to conservatively eliminate noise and treat all samples similar. Replicates remained in the sample set to assess measurement variability but their number was same for all analyses. This dataset was used for assessing biogeochemical information by ordination (section “Multivariate Analysis of DOM Molecular Composition and Trend Retrieval”), i.e., principal coordinate’s analysis (PCoA) based on Bray–Curtis dissimilarity and subsequent post-gradient-fitting (envfit function of R package vegan, at 999 permutations, Osterholz et al., 2016). FTMS formula data of DOM were summarized as weighted averages of chemical indices or a priori classifications of formulae according to these indices, and applied to constrain the molecular patterns behind separation (Roth et al., 2014; Rossel et al., 2016). A set of indices was calculated for each sample’s DOM mixture (Supplementary Tables S5, S6).
Assessment of Mass Spectrometric Resolution
We assessed FT-ICR MS formulae that would be unresolved by the Orbitrap, following the approach of Hawkes et al. (2016). For this, we used a series of triplet signals of [CHO]N2O2, [CHO]C5, and [CHO]H4S that are known for their small mass differences. These closely-spaced triplets are distributed over the whole m/z range and provide basis to estimate the actual resolving power of the Orbitrap. In this analysis, we used only full triplets, i.e., the [CHO]N2O2 formula was followed by the other two formulae. [CHO]N2O2 formulae that were found alone or with only the accompanying [CHO]C5 formula and single [CHO]C5 and [CHO]H4S formulae were not taken into account. The resolution of the MS can be estimated from the mass differences between these signals at half intensity applying the full-width at half-maximum (FWHM) criterion of a peak (Hawkes et al., 2016). FWHM data were exported from mmass and a general equation to calculate the FWHM was derived from the six sample types:
Based on this, the mass difference between two peaks that can be resolved is 4.1 mDa at ∼425 m/z and 3.2 mDa at ∼361 m/z, indicating that up to these m/z, the mass differences between the triplet peaks [CHO]N2O2, [CHO]C5, and [CHO]H4S, respectively, can be theoretically resolved in the Orbitrap system.
Results
General Features
The Orbitrap Elite system expectedly had a higher reproducibility, mass accuracy, and resolution than reported for an earlier instrument version (Hawkes et al., 2016), but lower compared to the ICR reference system (Table 2). In the Orbitrap, the absolute deviation from the exact mass of the molecular formula was by a factor of six larger, the interquartile range (IQR) of all mass errors was by a factor of two larger, and the resolution at m/z 401 was about the factor of three lower. The Bray–Curtis dissimilarity between the triplicates was roughly a factor of two lower in the Orbitrap indicating that the replicates were more similar in the Orbitrap system compared to the ICR system.
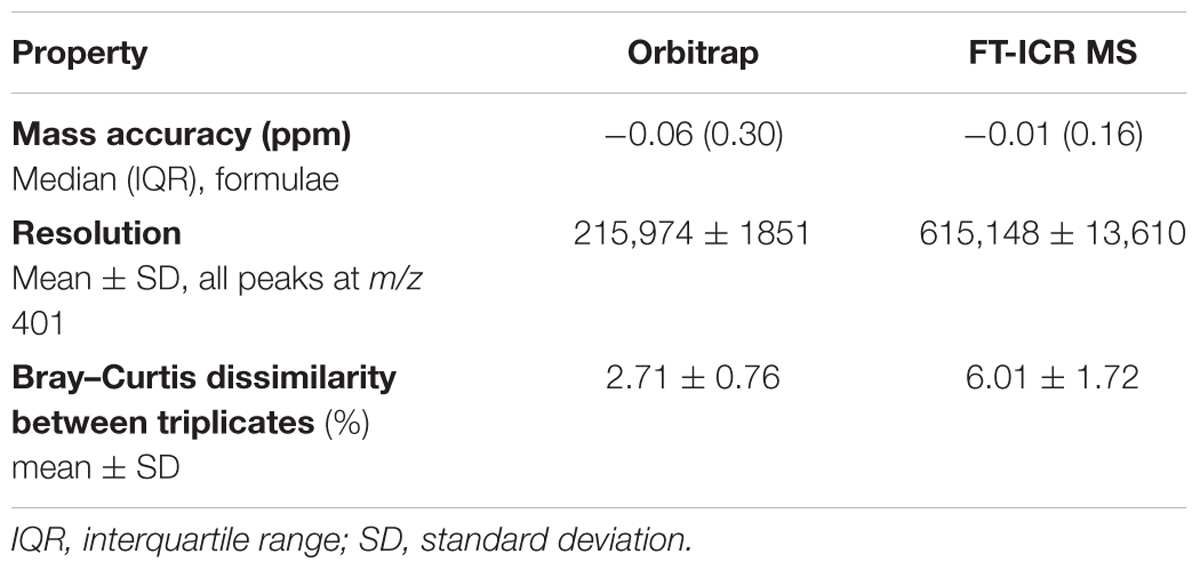
TABLE 2. General properties of both instrument’s datasets.
Reproducibility of Ion Abundance Patterns
The normalized total ion abundance patterns proved to be highly similar between both instruments (mass range m/z 115–1000; Table 3). More than 90% of cumulative ion abundance were covered by a much narrower mass range (m/z 200–650) in all seven samples, with about 70–80% occupied by assigned signals (formulae, forms). A notable deviation between instrumental response was higher numbers of unassigned signals (noRefs) in the mass range above m/z 200 for the Orbitrap, especially for the three samples with high input of fresh and freshly degrading plant material (bog, N8B; blackwater river, IHSS; and upper soil, JE-2-5-10). When only looking at the assigned signals in the mass range m/z 200–650, which forms the basis of the present analysis, the general picture was the same. More than 90% of information (ion abundance) was shared among instruments (Table 3, common signals, “Coms”), although the numbers of formulae shared varied broadly from 2687 (H5-3a) to up to 4931 (BZWA). Although similar in number on each instrument, the shared formulae showed more ion abundance on FT-ICR MS in the mass range m/z 200–400 (up to 12% more, depending on sample), and showed more ion abundance on the Orbitrap in the mass range m/z 400–650 (up to 15% more, depending on sample). In contrast, the ion abundance distribution was remarkably similar in case of the tap water sample (TAP). Regarding specific formulae (“Specs,” Table 3), numbers were higher in the Orbitrap but cumulative ion abundance was higher in the FT-ICR MS data, being somewhat congruent to the observation made for the whole mass range. Again, this was especially pronounced in the three samples with high inputs of fresh and freshly degrading plant material (N8B; IHSS; JE-2-5-10, Supplementary Figure S3). Samples BZWA, H5-3a, TAP, and NELHA showed higher numbers of FT-ICR MS specific formulae detected above m/z 400, going along with a higher ion abundance compared to number and ion abundance of specific formulae detected below m/z 400.
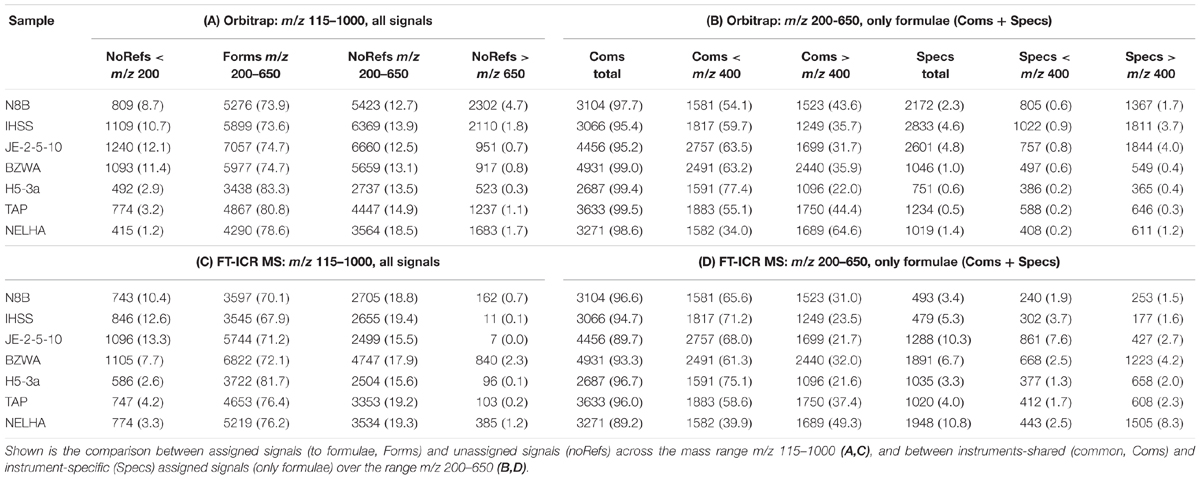
TABLE 3. Absolute numbers and relative intensity contribution (in brackets, in % of total) of different groups of signals of seven selected DOM samples measured by Orbitrap (A,B) and FT-ICR MS (C,D).
The shapes of normalized total ion abundance patterns were in good agreement between both instruments (Figure 1). This analysis considered only formulae detected by both instruments, which also constituted the majority of ion abundance on both instruments, as explained above. Whereas the deep sea (NELHA), aquifer (H5-3a), and tap (TAP) water samples had almost identical patterns, lake (BZWA), bog (N8B), soil (JE-2-5-10), and Suwannee river (IHSS) samples showed slight deviations in the m/z range centered at m/z ∼225 and at m/z ∼450, which was also reflected by a higher mean Bray–Curtis dissimilarity among instruments (13.9 ± 3.5 vs. 19.9 ± 1.7). The shared molecular formulae, which represented the majority of detected signals as measured by their contribution to the overall ion abundance, agreed also very well (Figure 2 and Supplementary Figure S3). For the aquifer, deep sea, tap water, and lake samples, R2 of the regression line was larger than 0.9. For samples that were more directly influenced by inputs of fresh and initially decomposing plant litter and thus also showed higher overall DOC concentrations (IHSS, N8B, and JE-2-5-10), R2 varied between 0.85 and 0.89. The slope coefficients obtained for most samples were within 10% range of the 1:1-line, which corresponded to the slope variability (per instrument) for replicated measurements. In contrast, the slope coefficients of the remaining three samples (BZWA, IHSS, and NELHA) deviated stronger from their replicate slopes (1.2, 0.8, and 0.9). A general feature observed on both instruments was the apparent increase in average mass to charge ratio in the order: Bog ∼ Suwannee river ∼ grassland soil (10 cm) < lake water < aquifer ∼ tap water < deep sea.
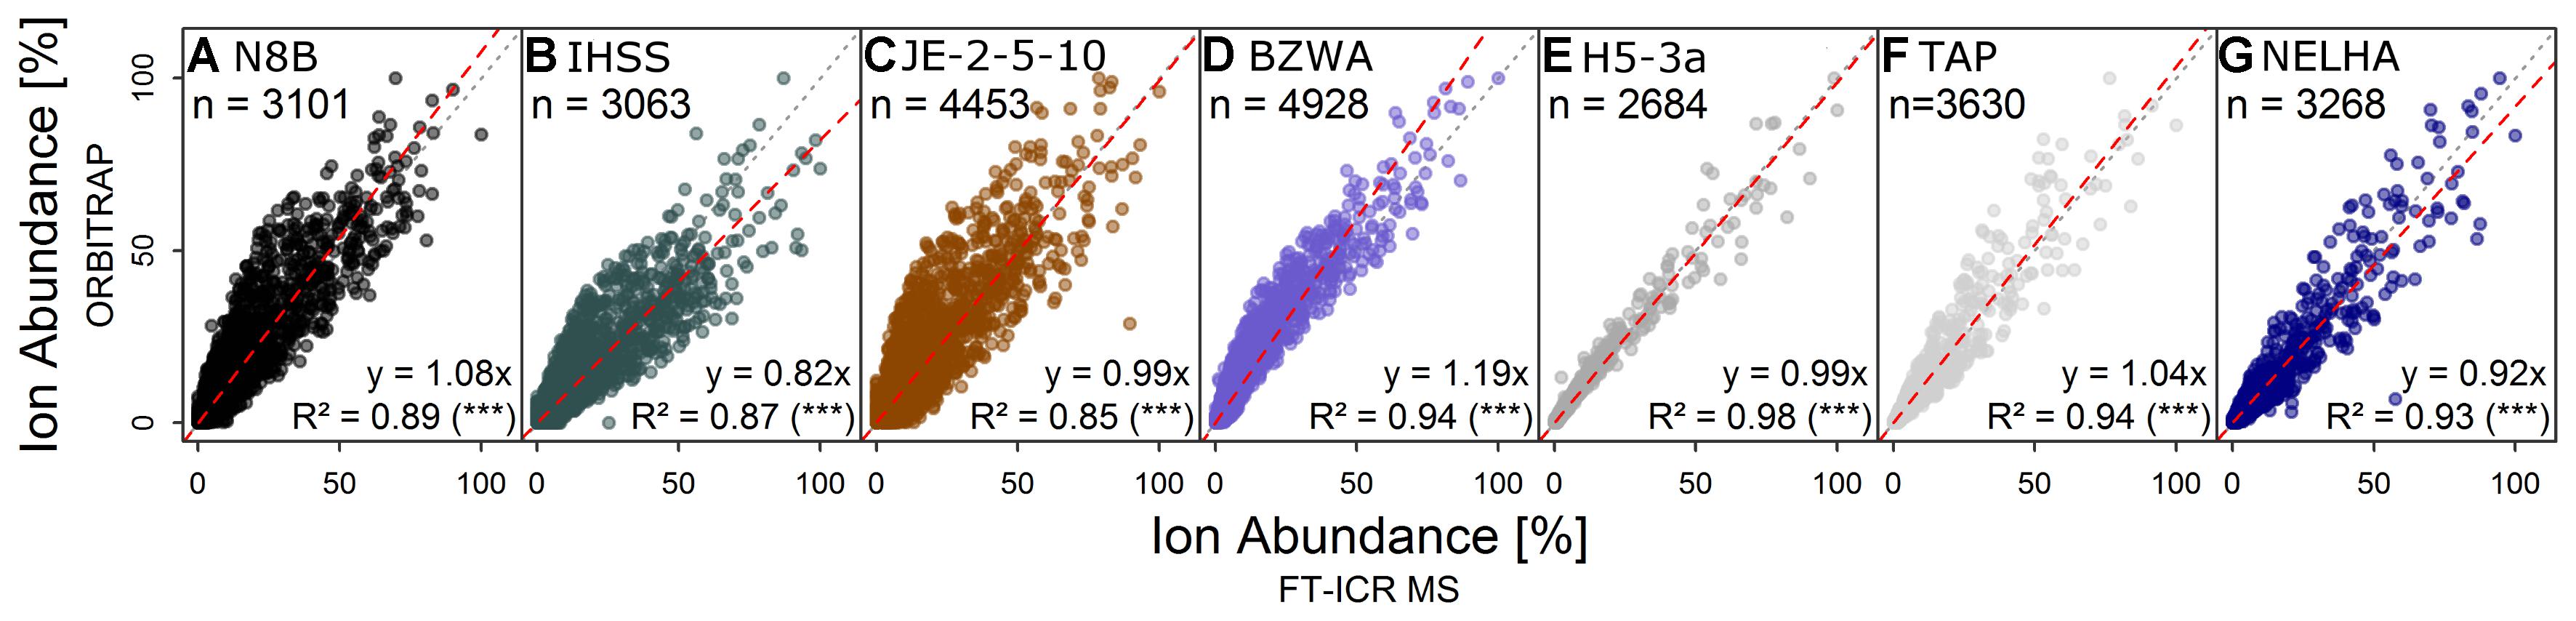
FIGURE 2. Direct comparison of relative ion abundance data of formulae detected by both instruments for samples from (A) a bog, (B) a blackwater river, (C) shallow soil, (D) a lake, (E) an aquifer, (F) tap water, and (G) the deep sea (the same as in Figure 1), approving the overall similarity of spectrum shapes at the formula level. Colors are for visual guidance.
Analytical Window: Assessment of Information Loss
The IHSS sample was characterized by lowest contribution of heteroatom formulae including N, S, and P atoms within the subset of samples used for detailed analyses (mean molecular formula: C17.3H18.2O7.4N0.1S0.05; 38.7% NSP-containing formulae), whereas the samples from deep sea (NELHA, C20.1H25.8O8.9N0.4S0.04P0.02; 61.0%) and an anoxic aquifer (H5-3a; C17.4H22.0O7.9N0.2S0.02P0.01; 61.3% NSP-containing formulae) showed highest contributions marking the “endmembers” of elemental diversity in the detailed sample set (Supplementary Table S5). The number of formulae that were specific for FT-ICR MS was lower in the IHSS sample (n = 497, ∼13%) than in the other samples (H5-3a, n = 1035, ∼28%; NELHA, n = 1948, ∼37%) and the specific formulae were differently distributed in van Krevelen space (Figure 3). Three distinct clusters of FT-ICR MS-specific formulae were found in van Krevelen space of the IHSS sample (Figure 3A). (1) The very saturated (high H/C, low O/C) region commonly referred to as lipid- or peptide-like substances (D’Andrilli et al., 2015). (2) The highly oxygenated formula region (high O/C, variable H/C) often termed as “carbohydrate-like” substances (D’Andrilli et al., 2015). (3) The region of formulae relatively poor in both H and O (low H/C, low O/C) that is linked to highly (poly-) aromatic, phenolic, or black carbon-like substances (Figure 3A; Koch and Dittmar, 2006, 2016). These clusters differed also in their mass distribution patterns (Figure 3B). While members of cluster 1 reached molecular weights of up to m/z 350, the rather moderately saturated second cluster reached up to m/z 500. The hydrogen depleted third cluster spread over the whole mass range with a center at m/z 400.
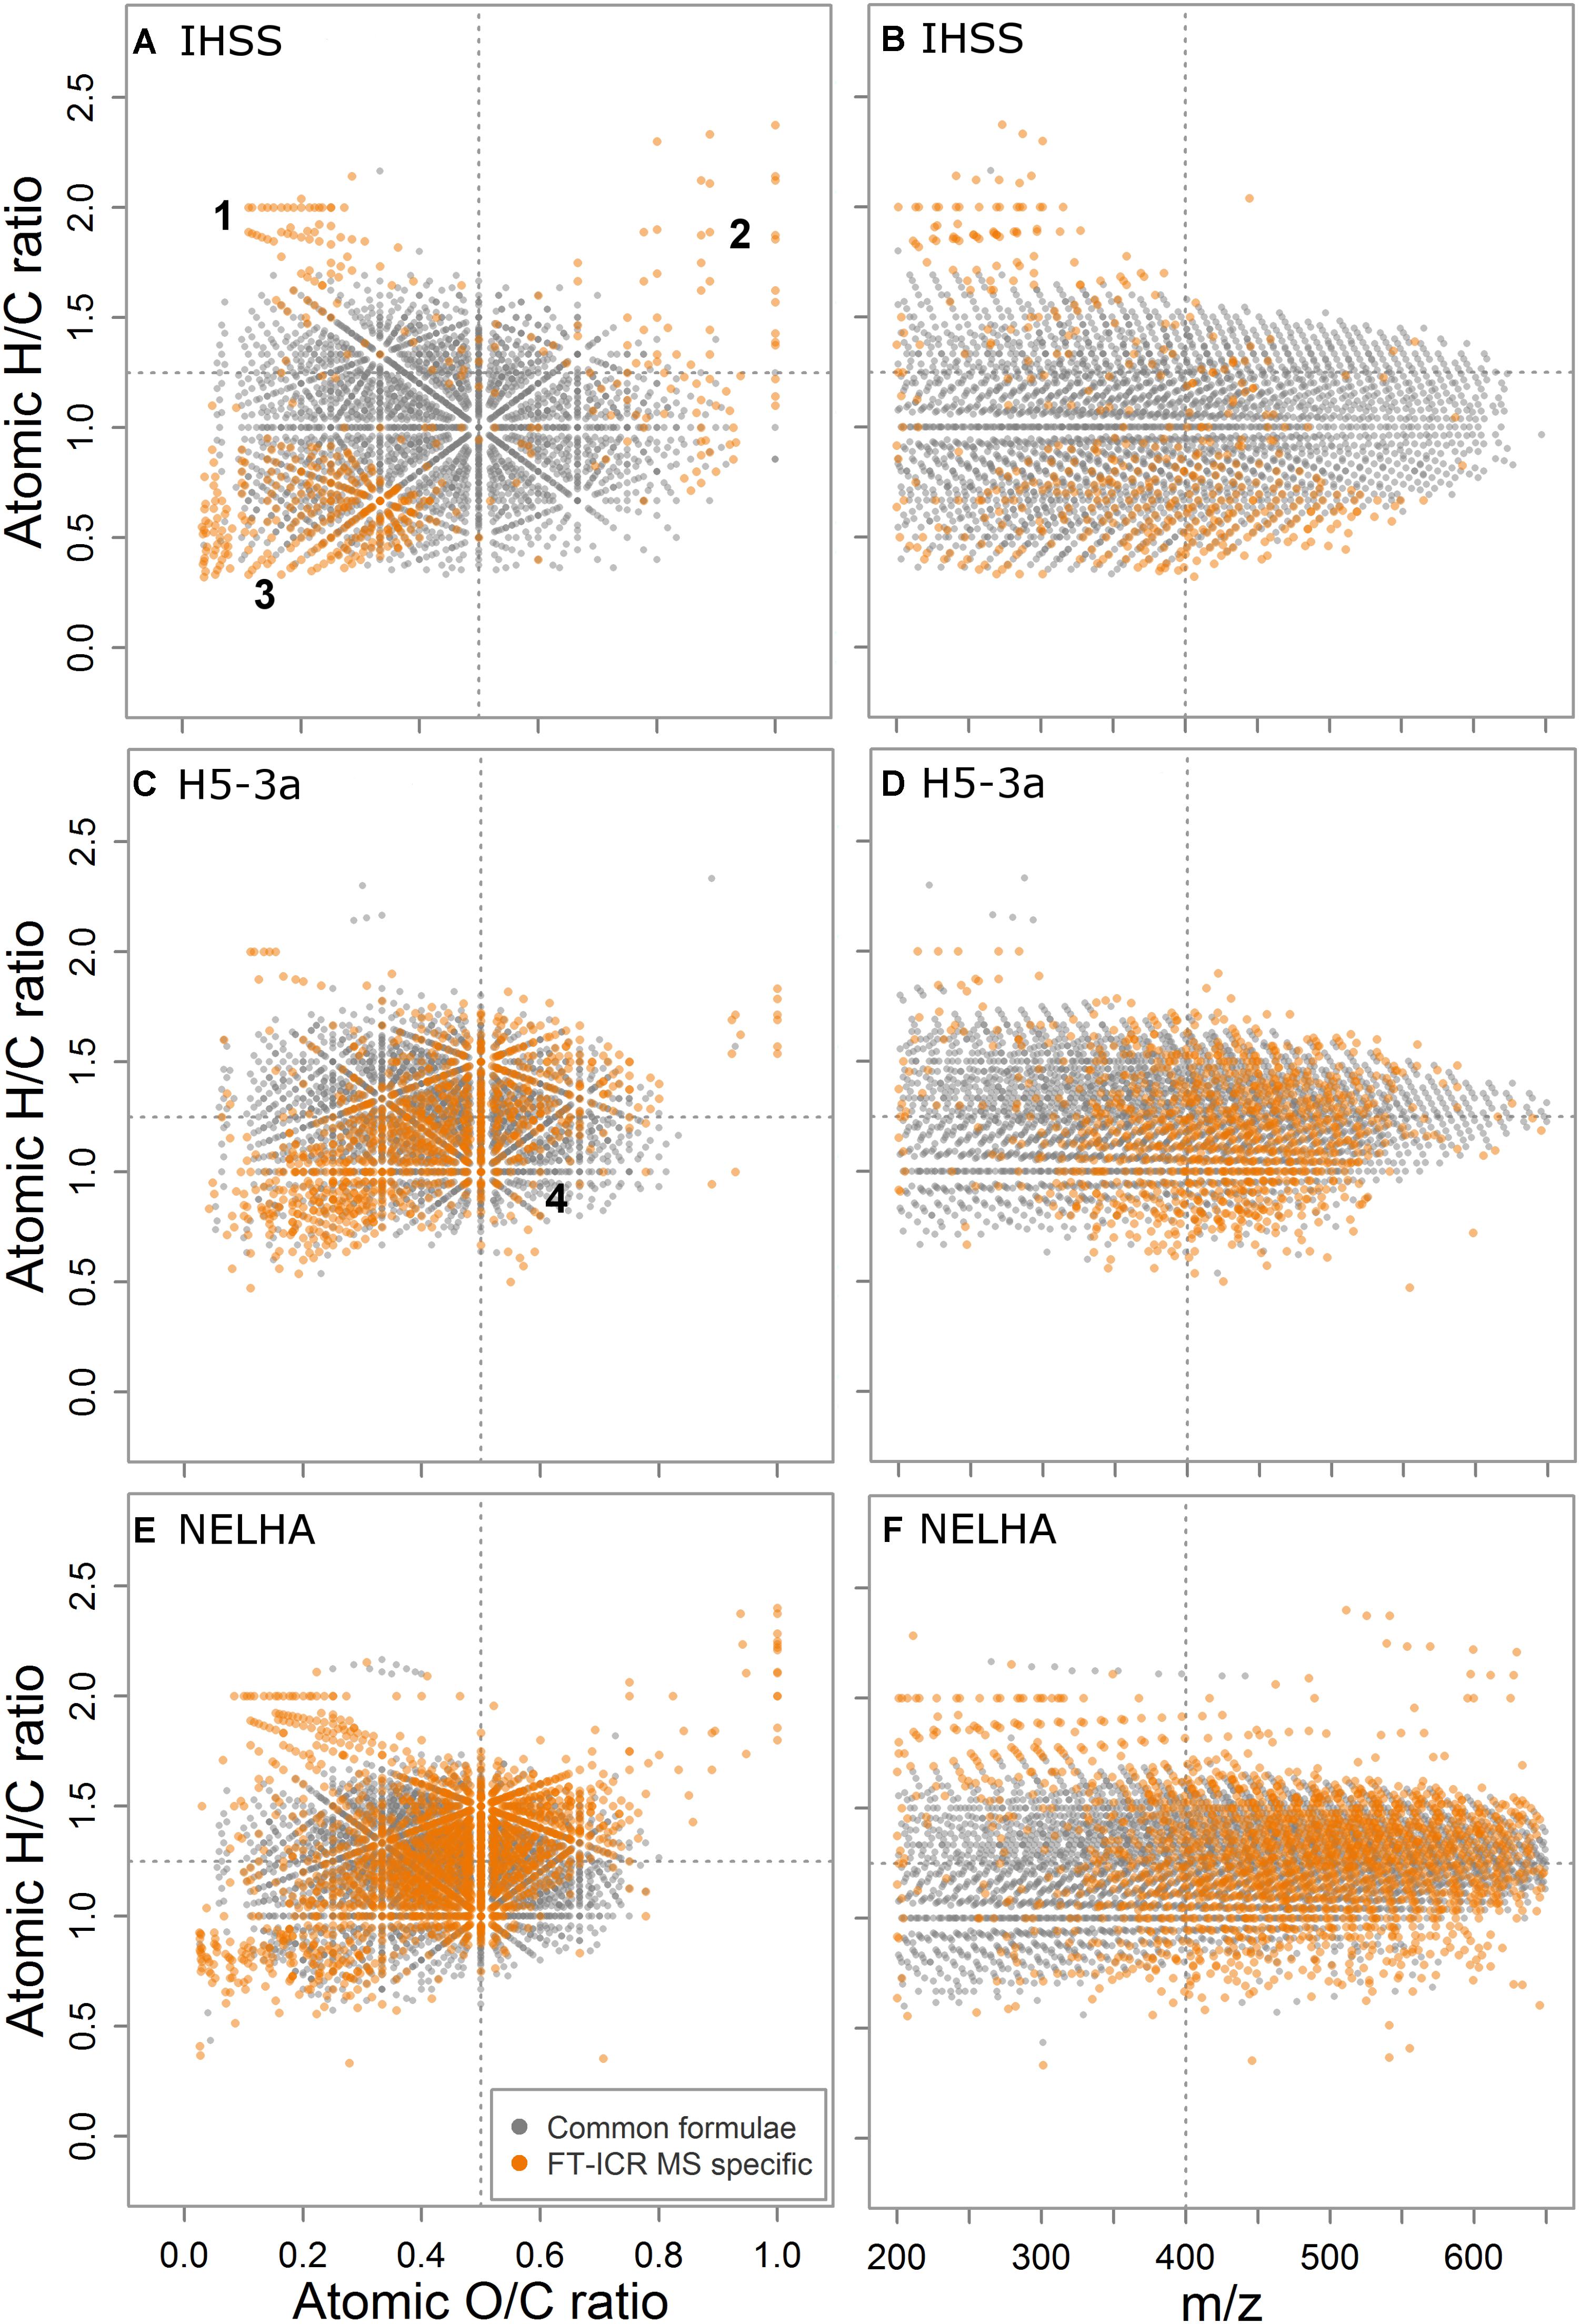
FIGURE 3. Comparison of common (gray) and FT-ICR MS-specific formulae (orange), by their van Krevelen fingerprints (A,C,E) and saturation state over mass (H/C vs. m/z, B,D,F), here shown for three samples spanning a heteroatom gradient from the Suwannee river (IHSS) over the aquifer (H5-3a) to the deep sea (NELHA) sample. Four dedicated formula clusters (1–4) were found to be additionally detected by FT-ICR MS.
In the heteroatom-rich samples (Figures 3C,E) a fourth formula cluster of FT-ICR MS-specific signals was observed in the region commonly assigned to carboxyl-rich alicyclic molecules (CRAM; Hertkorn et al., 2006) and materials derived from linear terpenoids (MDLT; Lam et al., 2007). In contrast to the black-water river (IHSS) sample, we found clear differences in contribution of the first three clusters to the overall pool of FT-ICR MS-specific formulae, being linked to a shift in the center of ion abundance distribution. The anoxic aquifer (H5-3a, Figures 3C,D) was characterized by a DOM ensemble showing only minor contribution of the three first groups while the deep sea sample (NELHA, Figures 3E,F) was very rich in all of them, as compared to the IHSS sample. High molecular weight carbohydrate like-compounds and elongated series of higher-molecular weight lipid- and peptide-like formulae were detected additionally, along with unsaturated formulae showing the same shift to higher m/z values.
We assessed small mass differences by a peak width-estimation approach (Hawkes et al., 2016). Based on the datasets prepared for our detailed analyses (set of seven samples), the FT-ICR MS detected 328 full triplets distributed over the mass range m/z 195–611; of these, the Orbitrap was able to detect 72 (mass range m/z 225–593) across the whole sample set. The NELHA sample provided best test conditions due to its richness in heteroatom-containing formulae (Supplementary Table S5). The FT-ICR MS did detect in total 547 single peaks belonging to the list of all triplet signals in the dataset (based on the [CHO]N2O2 analysis), of which 213 represented full triplets (n = 71) and covered a mass range from m/z 297–611. In the respective Orbitrap data, we found 380 of the considered signals in total, of which 36 represented full triplets (n = 12). In the H5-3a (anoxic aquifer) sample, the total number of FT-ICR MS triplet signals was lower (440 in total, 36 full triplets, m/z 269–457), and the Orbitrap also resolved lower numbers (of those considered, 337 in total, 8 full, m/z 297–357), in good agreement with our calculated upper resolving limit. For the relatively heteroatom-poor IHSS sample, the FT-ICR MS only found two full triplets (441 signals in total), of which the Orbitrap resolved one (of those FT-ICR MS formulae considered, 402 signals were found, and one triplet at m/z 325).
Multivariate Analysis of DOM Molecular Composition and Trend Retrieval
The separation of samples based on their molecular composition yielded highly similar results and the scores of the samples were highly correlated: The explained variance (R2) of the scores decreased with coordinate rank from 0.98 over 0.69 to 0.59 (Figure 4). For the first coordinates, the regression slope did not differ significantly from the 1:1 line (within 95% confidence intervals). The first three axis explained 88 and 82% of the summed variability in the datasets of the Orbitrap and the FT-ICR MS, respectively. The first coordinate of the Orbitrap data explained 11 % more of the internal variation (Figure 4A) and the second axis 6% less than the coordinates from the FT-ICR MS data (Figure 4B). IHSS, bog (N3B, N8B), and forest soil DOM types (H2S-5, T-5, W1-5, and JE-2-5-10) were clearly separated from deeper soil waters (JE-2-5; 20, 30, and 60 cm depth), aquifer (H5-3a, H3-2b), tap (TAP), or deep sea (NELHA) DOM.
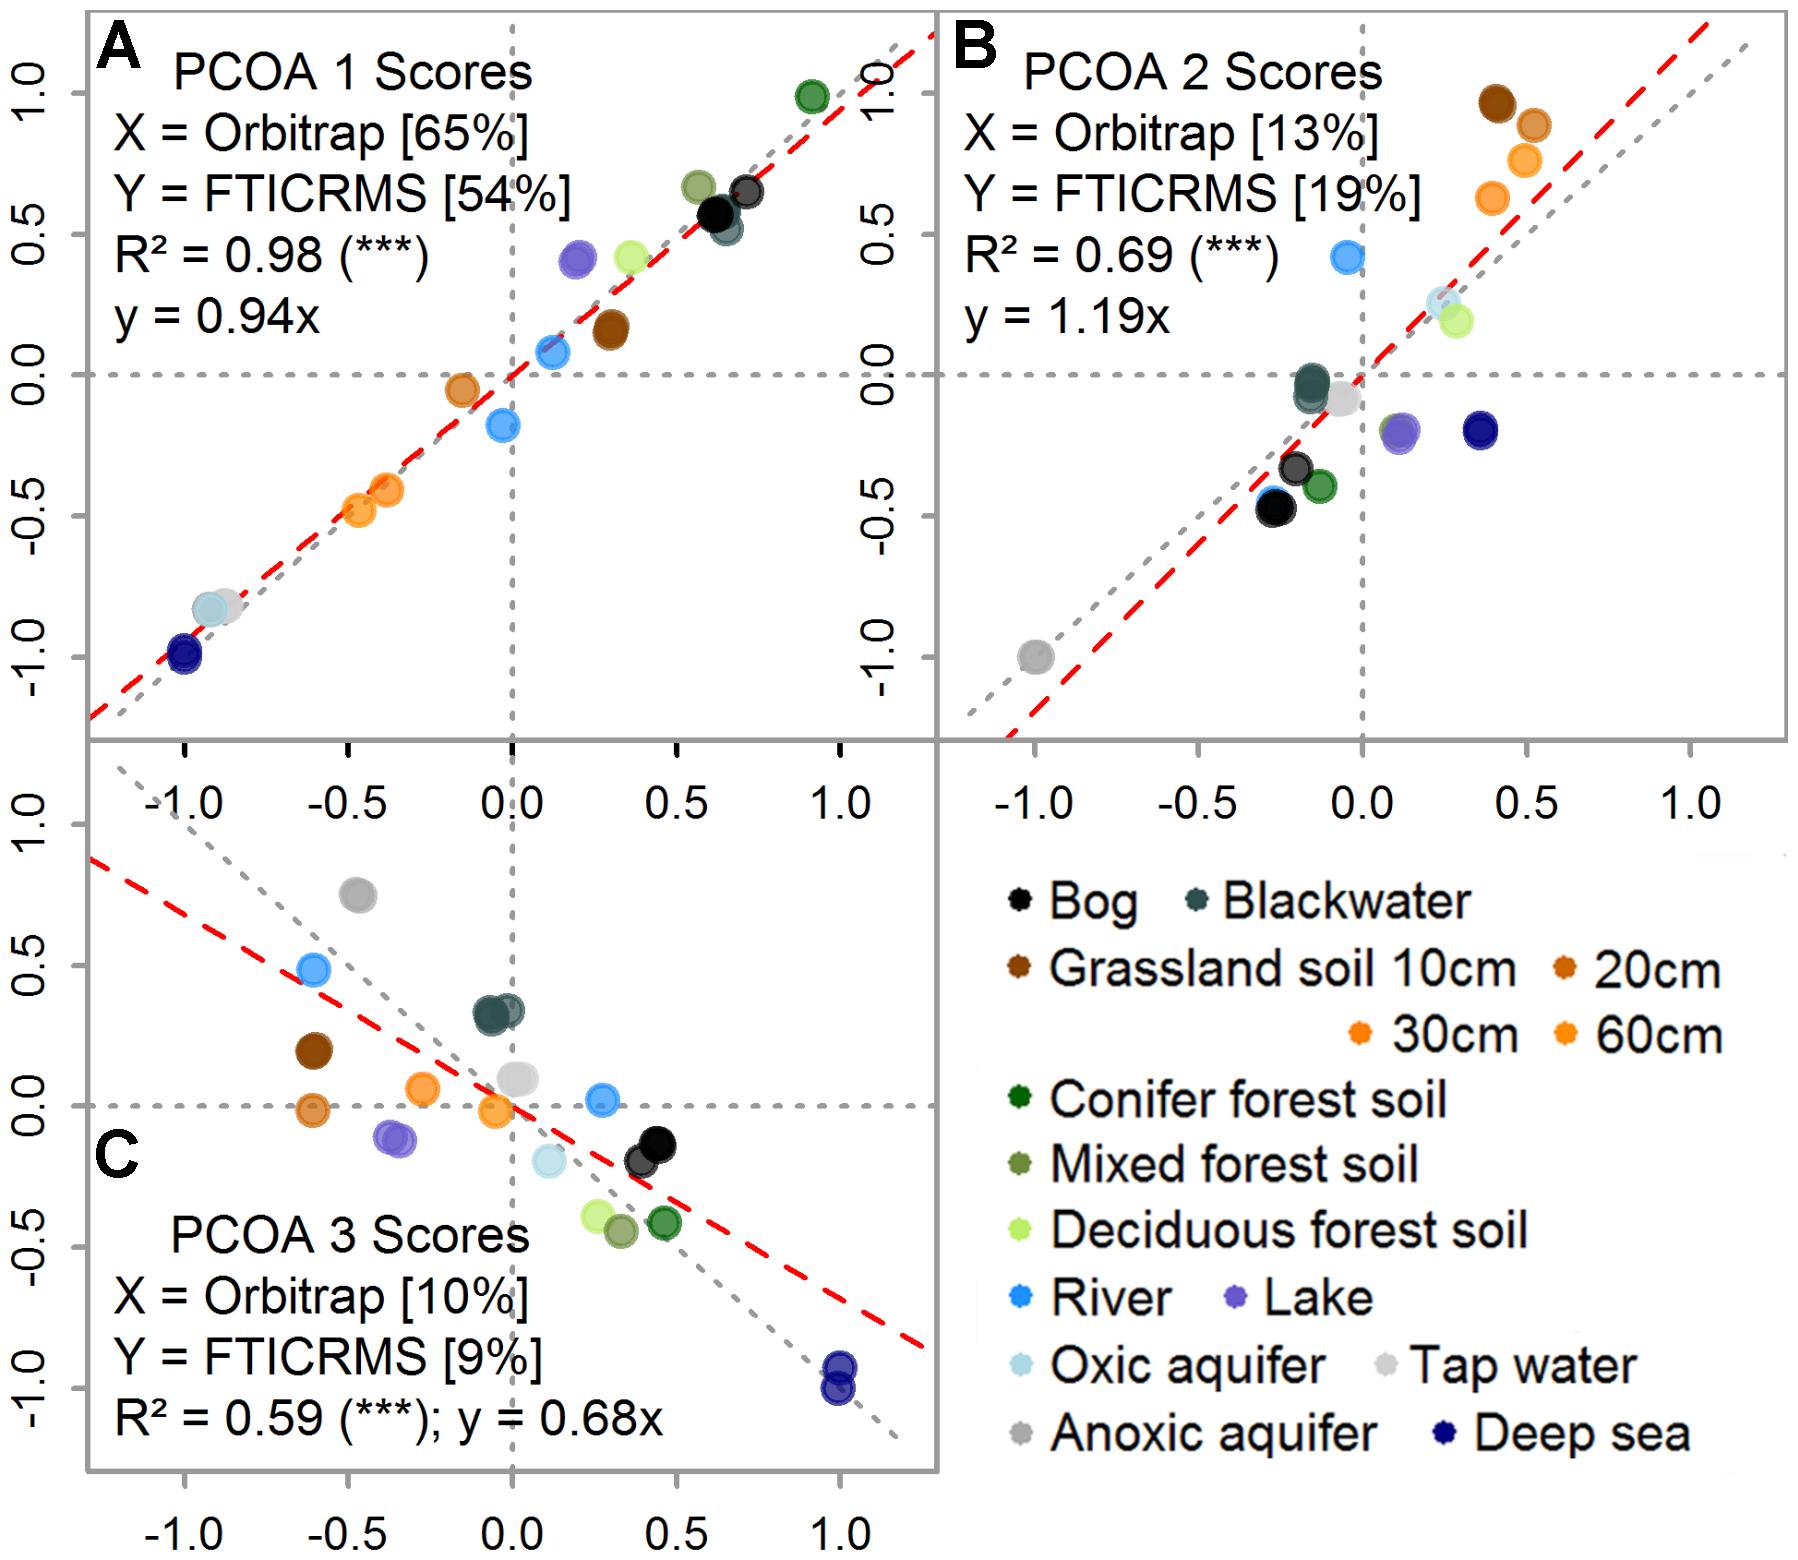
FIGURE 4. Direct comparison of the first (A), second (B), and third (C) ordination scores for each sample determined by principal coordinates analysis (PCoA). Note that axis notations are given within the figure, including the explained variability in percent. Replicate measurements are included (set of seven samples). Color indicates sample origin (see legend, in accordance with colors in Figures 1, 2).
The derived linear gradients of indices (Figure 5) and molecular classes (Supplementary Figure S5) also were highly similar in the ordination plots for both instruments, confirming the results from the abundance patterns. In general, samples connected to positive scores on the first coordinate, like the bog, the black-water river IHSS and the forest soil water samples, were strongly linked to higher values of the aromaticity index (AIMOD), the number of DBEs, and the formula’s nominal oxidation state. These samples also showed larger amounts of formulae classified as black carbon-, polyphenol-, and carbohydrate-like (BC, PP, and SUG), whereas their number of H atoms and average H/C ratio were reduced. Subsequently, more formulae classified as “highly unsaturated” molecules, unsaturated aliphatics, and peptide-like (HU, UA, and PEP) were found in aquifer, tap water, and deep sea water samples. These groups of formulae show a higher degree of saturation compared to aromatic or phenolic entities. The opposite trend of the chemical composition on the first coordinate was interestingly linked to different ion abundance distributions. Samples with positive scores on the first axis showed a bi- or multi-modal distribution (Supplementary Figures S5k, S6a–h) whereas samples with negative scores had a unimodal distribution with an average center at higher m/z values (Supplementary Figures S6i,j,l–q). The separation on the second axis was mainly explained by the content of heteroatoms including oxygen and the number of formulae (Figure 5 and Supplementary Figure S5). Besides general congruence in the observed separation pattern and linear trends explaining it both from the perspective of indices and molecular classes, we also observed clear differences in the ordination patterns. In the ICR system, N and S had a positive loading and O and O/C a negative loading. In the Orbitrap system, N also had a positive loading and O/C a negative loading, but O and S had no significant impact on the separation of the samples, which may explain the overall lower explained variance of the Orbitrap data on the second coordinate. Differences in multivariate response based on DOM composition were also linked to increased detection of mainly CHO formulae at higher m/z due to differences in fine-tuning of both instruments used in this study (Supplementary Figures S7–S9).
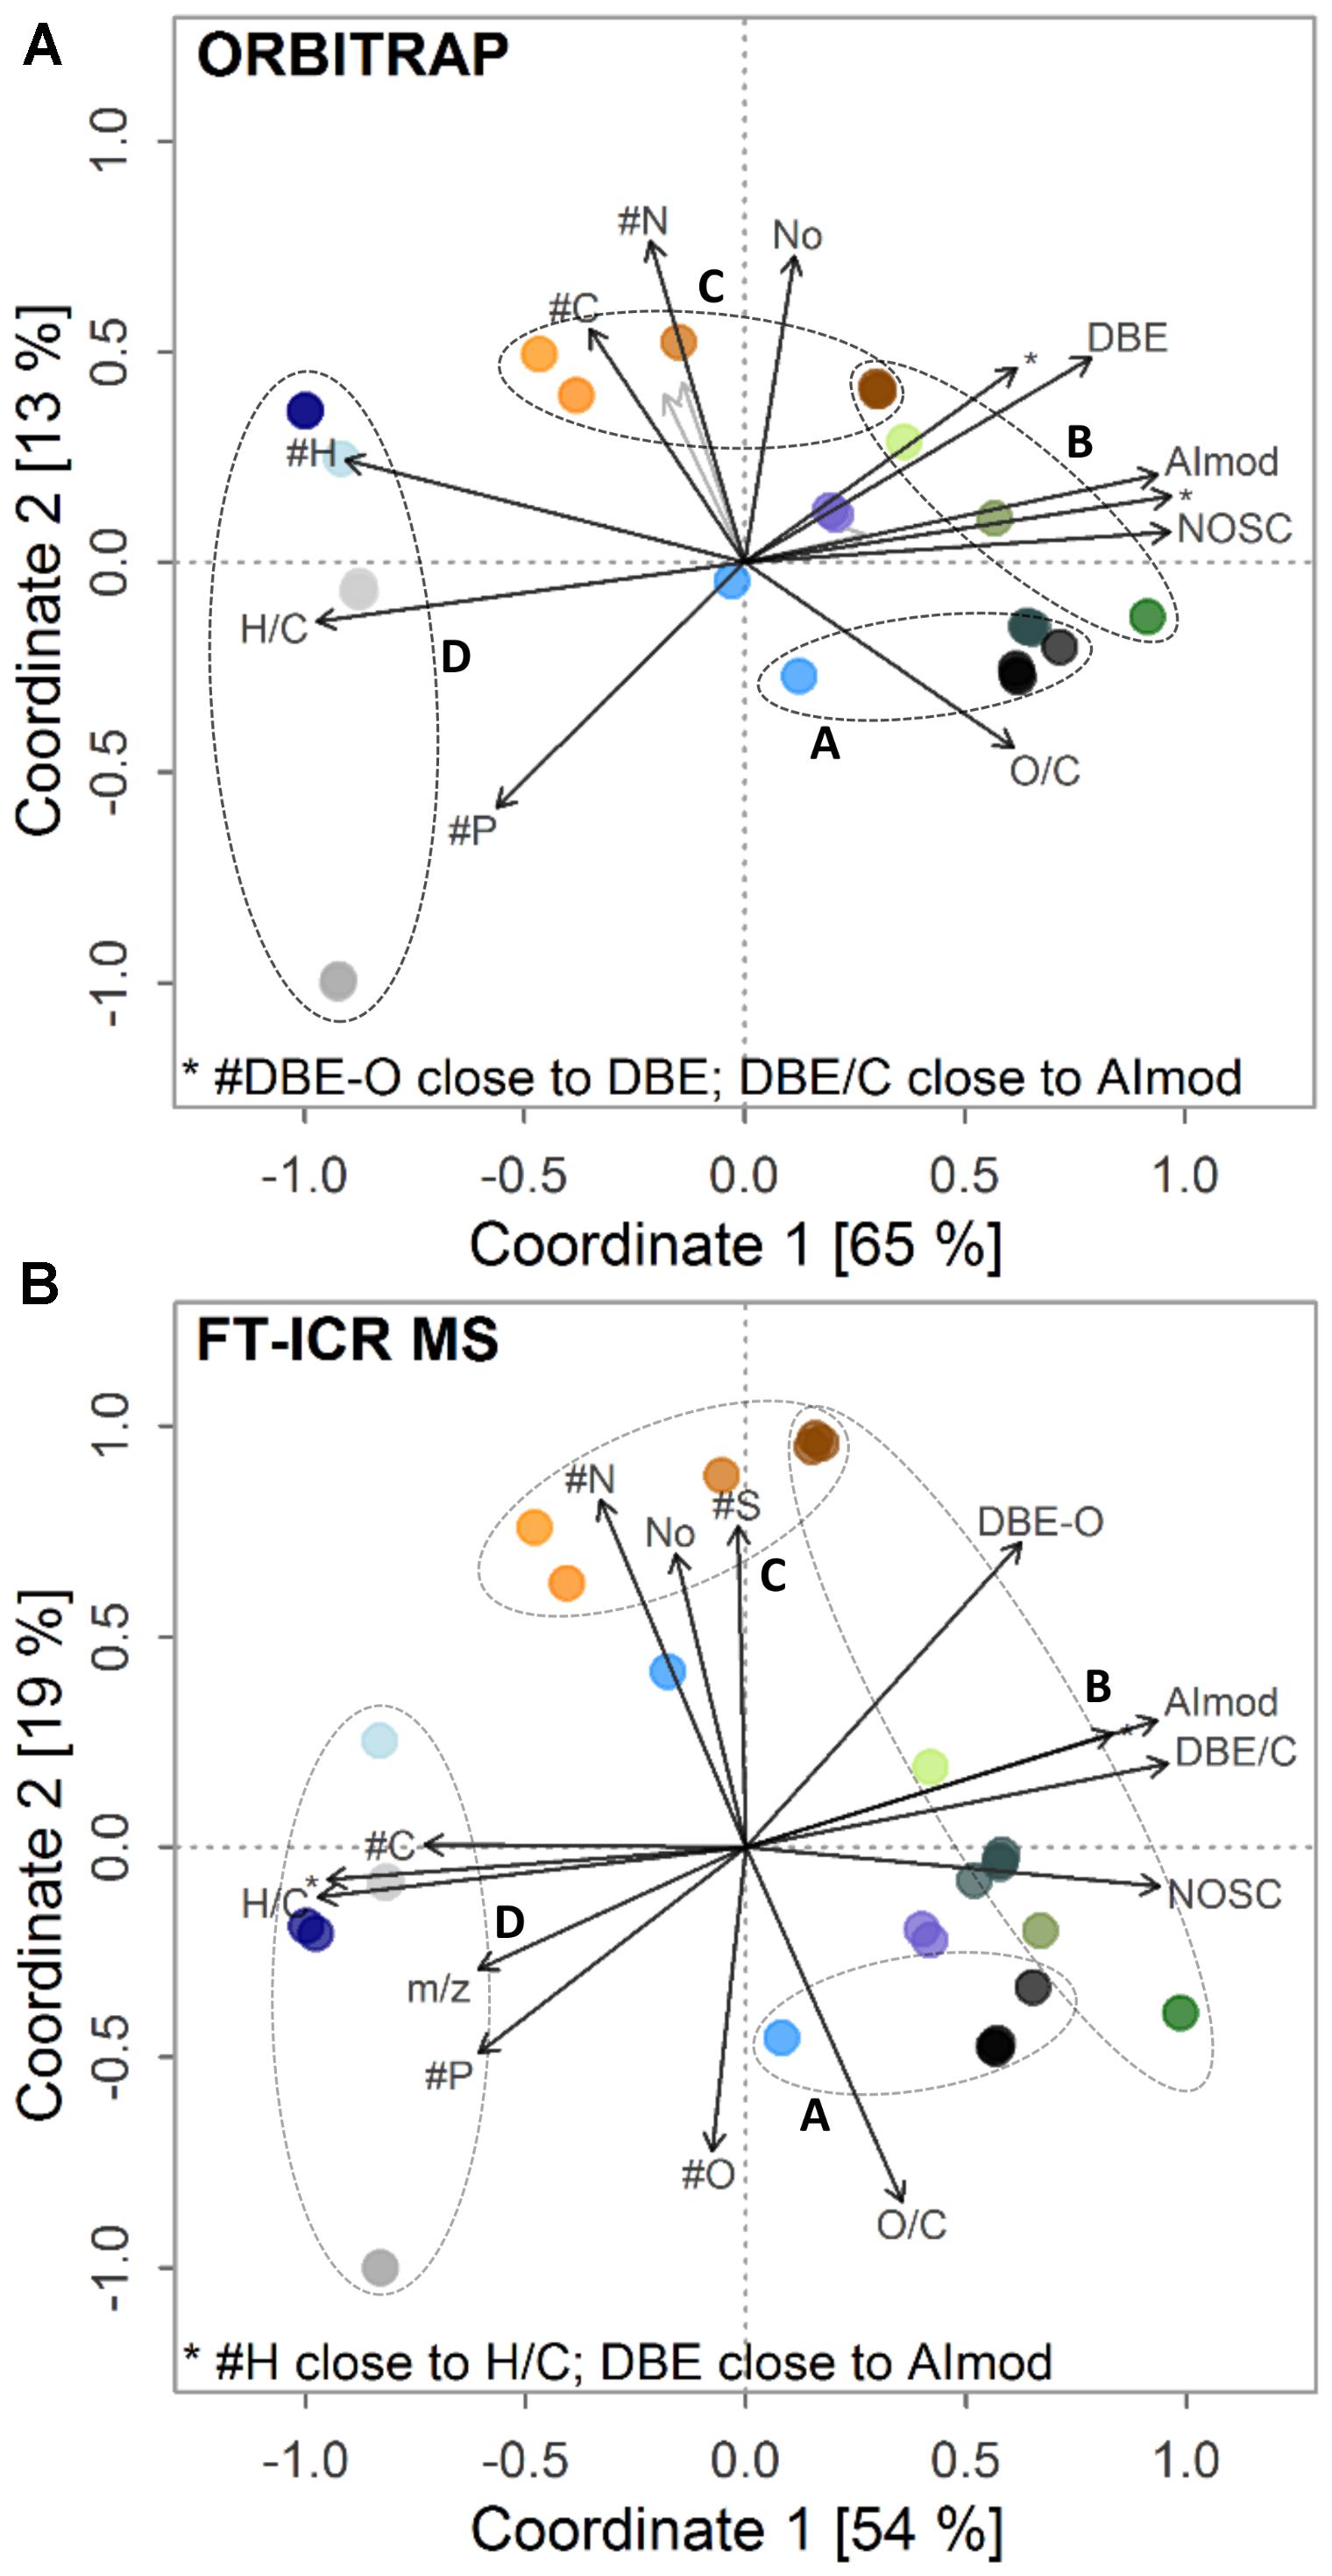
FIGURE 5. Post-gradient fitting on ordination obtained by (A) Orbitrap and (B) FT-ICR MS. Fitted gradients are abundance-weighted averages of indices. H/C, hydrogen-to-carbon ratio; O/C, oxygen-to-carbon ratio; AImod, aromaticity index; DBE, double bond equivalents; DBE-O, DBE minus oxygen atoms; DBE/C, DBE-to-carbon ratio; NOSC, nominal oxidation state of carbon; #C, #H, #O, #N, #S, #P, number of respective atoms. Circles A–D depict sets of retrieved trends (see text) among samples. For color legend, see Figure 4.
Discussion
Comparison of Mass Abundance Patterns Between the Orbitrap and the ICR Analyzer
The agreement of mass abundance patterns and abundance-weighted indices has been investigated by several studies (Supplementary Table S2) and is believed to be instrument-dependent, hindering direct inter-comparison (Pomerantz et al., 2011). The spectra described herein showed a good fit between both instruments (Figure 1 and Table 3). Small deviations in congruence among mass abundance patterns of bog or IHSS samples agree with previous reports of similar effects for dystrophic lake water (Hawkes et al., 2016), but had no large effect on multivariate separation and derived conclusions (Figure 5, section “Retrieval of Discriminating Information and Biogeochemical Trends”).
Both instruments yielded highly similar responses, as can be seen from overall distribution of ion abundance (Table 3), with very similar amounts of information covered by assigned formulae in the mass range m/z 200–650 (70–80%), and a majority of ion abundance being commonly detected (>90%, up to 99% in single cases for the Orbitrap). The higher number of unassigned Orbitrap signals above m/z 200 can be largely explained by slight differences in sensitivity of our Orbitrap method in the higher mass range, which may be due to differential tuning and instrument design, but may also point toward higher probability of taking false positives (noise) into account (Table 3). However, only signals detected more than once in replicates were included, which strongly minimizes this type of error (Riedel and Dittmar, 2014). Our observations are thus subject to future and ongoing work within our group, to further improve the method (Supplementary Figures S3, S4 and Supplementary Note S1). Higher numbers of peaks may also arise from the difference in concentration (10 ppm, FT-ICR MS; 20 ppm, Orbitrap), which was due to the exchange of the ICR analyzer cell by a more sensitive type (Supplementary Table S2). Similarly, increased contribution of simple CHO and CHNO formulae caused an increased annotation of Orbitrap-“specific” formulae (Supplementary Figure S3), mainly linked to slightly higher sensitivity of the Orbitrap in the upper mass range. However, total ion abundance of those signals was often less than 3% and reached 5% only in case of JE-2-5-10 and IHSS samples. These formulae were treated as “falsely”-categorized specific formulae as they were part of the FT-ICR MS dataset, but not found within similar samples and thus, categorized “specific.” After subtraction of the “falsely” categorized specific formulae, the remaining ion abundance was close to being insignificant (Supplementary Figure S3) and thus was not further taken into account.
Together, our results indicate that Orbitrap deviations in ion abundance of common formulae (Figure 1) might be linked to sample-specific DOM constituents that influence ionization and detection in this FTMS analyzer. Samples that were less affected by fresh and decomposing organic matter inputs, such as the marine deep sea sample (NELHA), showed a remarkably good fit in mass abundance patterns (Figures 1D, 2D). The same NELHA sample did not show signal suppression effects that were previously observed in another Orbitrap system (Hawkes et al., 2016). Besides sample effects, bi- or multi-modal abundance distribution could also indicate unwanted source effects, such as adduct formation, or biases in the detector. All signals shown in Figure 1 are common formulae defined by their simultaneous detection and annotation by both instruments in the same samples (holding > 70–80% total ion abundance in both instruments, Table 3). In turn, differences in spectrum shapes among instruments seen here can only be caused by abundance variation. Furthermore, adduct formulae including chloride, the most common adduct in negative-mode ESI, would be detected at m/z values not within the 0.5 ppm mass error criterion or only in formulae with unlikely combinations of heteroatoms N, S, and P (compositions were checked with MIDAS Formula Calculator v.1.2.6, National High Magnetic Field Laboratory, Tallahassee, United States). Dimer formation as a source of ion abundance variation was effectively suppressed by use of source-induced dissociation (SID). Tests with the IHSS sample showed that the use of SID alone did not explain the presence of a lower m/z hump centered at ∼m/z 225. Intensities and number of detected signals below m/z 200 were indeed increased by SID. However, this was not reflected by a simultaneous decrease in number or abundance of higher m/z ions (<m/z 800), altogether pointing toward better ionization of low molecular weight compounds in DOM. Potential analyzer effects cannot be ruled out and need further insight as they seem to be inherent to specific samples and Orbitrap-type instruments but were not within the scope of this paper. As noted above, slightly better sensitivity of the Orbitrap method in the higher mass range led to increased rates of formulae assigned only by the Orbitrap (>m/z 400, mainly simple CHO and CHNO compounds, Table 3 and Supplementary Figure S3). Although this effect is likely caused by differences in instrument architecture similar to above reported deviations in intensities below m/z 400, the underrepresentation of higher mass ions in the FT-ICR MS spectra is not a consequence of instrument capabilities but rather a tradeoff in adjusting and fine-tuning the mass spectrometer response to individual user needs, as these formula compositions are easily resolvable by FT-ICR MS performance.
Our results indicate a strong preservation of the ion abundance information in both instruments, with only slight deviations discussed above, pointing toward representation of inherent sample characteristics by ESI-FTMS instruments. Note that the measurement settings of each instrument were the same for all samples (Supplementary Table S3). By establishing an Orbitrap method that minimized differences in ion abundance representation (and thus differences in ionization and detection), we were able to estimate the analytical window determined mainly by lower resolution and detection limits. However, a perfect overlap in instrument response may be difficult to achieve and would require similar tuning for each “type” of sample, which is costly and inflexible, if many different samples are compared. Specific signals only observed by the Orbitrap were in all cases close to the noise threshold (Supplementary Figure S3). This implies that FT-ICR MS-generated formula lists can be used to annotate the big majority of peaks detected in typical DOM datasets obtained by the Orbitrap. Of course, the Orbitrap has to be fine-tuned for this purpose. As demonstrated, this can be achieved by tuning the MS response (mainly ion abundance distribution) of one or two representative samples or available reference materials (as the ones used in this study, see section “Sample Preparation”) that span the environmental/experimental gradient of interest. Likewise, the baseline formula list for Orbitrap peak annotation could be obtained based on a representative but small subset of samples.
Interplay of Sample Type and Instrumental Resolution on the Gained Information
In this study, we observed distinct clusters of formulae that were outside of the Orbitrap’s analytical window as determined by FT-ICR MS (Figure 3). The degree to which these formulae groups contributed to the gained information depended strongly on sample type. This observation was clearly linked to the general shift in abundance distribution (Figures 1, 3B,D,F). A higher contribution of additional information by the fourth cluster translated into a stronger ion abundance deviation observed for the marine sample (11% of FT-ICR MS total abundance, Figure 6C). The region of the fourth cluster contributes substantially to a group of abundant signals that are ubiquitously found (Kellerman et al., 2014; Lechtenfeld et al., 2014; Roth et al., 2014) and are assigned to a maximum number of possible isomers (Hertkorn et al., 2007; Zark et al., 2017). Therefore, the full complexity of marine samples is not fully captured by recent Orbitrap instruments. Strong similarity of ion abundance patterns suggests that reasons for information loss are mainly due to limitations in resolving power and not sensitivity (i.e., detection limit). This is especially true for compounds of the fourth cluster, as this region usually contributes to abundant signals. In contrast, the allover contribution of FT-ICR MS-specific formulae to total ion abundance (FT-ICR MS data) only accounted for 5 and 3% in the IHSS and H5-3a, reflecting additional detection of more peripheral compound groups (clusters 1–3, Figure 3A) or lower numbers of formulae associated with the fourth cluster (Figure 3C). Our results indicate that the better representation of DOM chemodiversity by FT-ICR MS is sample-specific and related to distinct groups of similarly composed compounds. Low-molecular-weight signals, indicative of fresh inputs of organic matter (Roth et al., 2016), were well captured by the Orbitrap. These results demonstrate the suitability of Orbitrap instruments for studying the individual composition of terrestrial DOM and its transformation during early stages of decomposition.
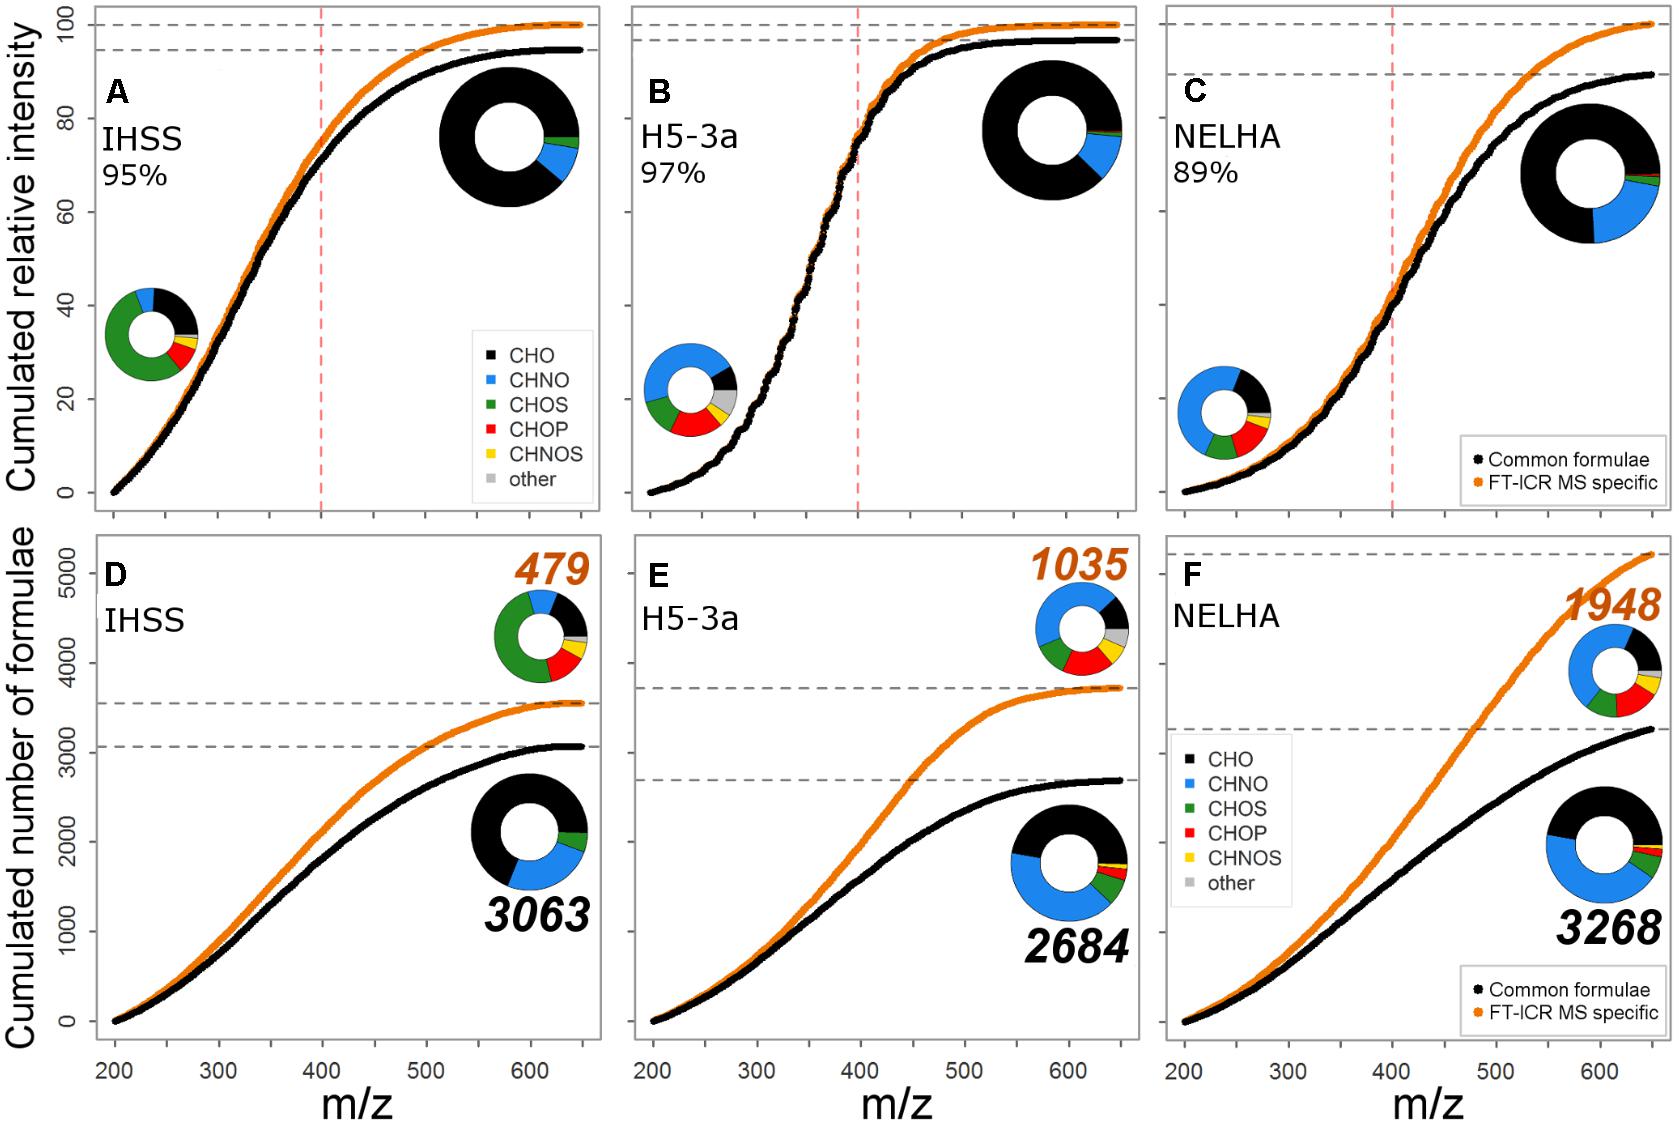
FIGURE 6. Comparison in coverage of ion abundance (A–C) and formula number (D–F) for FT-ICR MS and Orbitrap. Cumulated curves indicate a gradual increase of information gain (through FT-ICR MS in orange, vs. black line representing commonly detected formulae) in formula number and abundance information. The red vertical dotted line marks ∼m/z 400 where resolving power increasingly determines full coverage. Formula class ensembles covered by common and FT-ICR MS specific formulae are shown for the three specific samples in pie charts, indicating contribution to allover ion abundance (A–C) or formula number (D–F); the bigger pie always refers to the common set. Color encodes for compound class. CHNO includes N1-4, CHOS includes S1-2, “other”: CHNOP/ CHOSP formulae.
An assessment of the formulae lost from the Orbitrap’s analytical window showed additional indication of sample-specific differences among instruments linked to DOM complexity. The group of commonly detected formulae was represented by a majority of CHO, CHNO, and CHOS compounds (Figures 6D–F), and FT-ICR MS-specific formulae often belonged to additional heteroatom-containing compound classes (e.g., CHNOS). We observed a clear gradient of FT-ICR MS-added information from NSP-poor to increasingly NSP-rich samples (Figures 6A–C). Likewise, the total number of additionally detected compounds increased, together with their relative contribution to the total formula number: IHSS (13.5%) < H5-3a (27.8%) < NELHA (37.3%). This was also reflected by a parallel shift toward higher average m/z. However, the increased resolving power of modern Orbitrap instruments allowed detection of a wide array of CHNO and CHOS compounds, and even small numbers of CHOP and CHNOS formulae (Figures 6D–F insets, big pie charts). The Orbitrap thus can identify samples with more diverse heteroatom formula ensembles worth an FT-ICR MS investigation (Figures 6D–F insets, small pie charts). However, the additional FT-ICR MS information made up only a small portion of the overall ion abundance (Figures 6A–C, max. 11%), confirming previous findings (Supplementary Table S2). The majority of geochemically important formulae were retrieved, but low-abundance peaks, possibly encoding to a higher degree for ecosystem-specific processes and nutrient dynamics (Kellerman et al., 2014; Roth et al., 2014), were captured more comprehensively by the FT-ICR MS. The correct abundance representation of common formulae (Figures 1, 2) and the distribution of additionally resolved compound classes above ∼m/z 400 (in accordance with m/z shift observed in H/C vs. m/z space; Figures 3B,D,F point to information loss mainly due to insufficient resolving power above that threshold. A manual search for FT-ICR MS-specific formulae in the Orbitrap data showed that the majority of peaks were either lost due to insufficient resolution of small peaks (rather flat shapes) or overlap by larger, neighboring signals, both becoming increasingly important at mass ranges above m/z 300. Below this value, the preferential loss of a small group of signals with mass defects above 0.17 Da indicated low sensitivity of our Orbitrap method for these signals.
Our analysis of triplet information proved the increasing capacity of the most modern Orbitrap instruments to resolve bottleneck mass differences in complex DOM mass spectra rich in heteroatoms. Surprisingly, the last triplet in the NELHA sample was found at m/z 413, well above the calculated resolution limit for the triplets at ∼m/z 361, probably due to the relatively high intensities obtained in this specific sample. In principle, the lower coverage of triplet peaks in the Orbitrap data may also be due to insufficient sensitivity for certain signals. As noted above, (1) general accordance of ion abundance patterns of common formulae and (2) a broad limit in detection of heteroatom-rich compound groups above ∼m/z 400 points toward the expected decrease in Orbitrap performance due to insufficient resolving power. Moreover, the missing NELHA triplet signals in the Orbitrap data often remained unassigned due to peak interference as pointed out above. A group of interfering signals subsequently identified as the 13C-isotopomers of CHNO formulae influenced [CHO]H4S peak annotation. This interfering series of signals is found approximately 1 mDa away (toward higher m/z) from the prospective sulfur signal and is thus even harder to resolve by the Orbitrap. The balance of both peak intensities influenced centroid positioning during peak picking, which subsequently affects peak alignment and formula assignment.
Taken together, ion abundance pattern and DOM complexity, which have been found to be important aspects of sample type in our study, influence the degree to which Orbitrap instruments keep up with FT-ICR MS performance. These results are important for Orbitrap use in future DOM studies and are even more promising as nominal resolving powers of 480.000 are achievable with a beta version of the Orbitrap’s instrument software allowing for increased transient length (Zhurov et al., 2013). By analyzing two heteroatom-rich petroleum samples of even higher complexity, Zhurov et al. (2013) showed that increased resolving power was sufficient in the lower mass range up to ∼m/z 500, being somewhat higher than on the previous generation of Orbitrap cells (∼m/z 300, Smith et al., 2012). FT-ICR MS is still needed for a comprehensive analysis, even more so with FT-ICR MS improvements in place (Supplementary Table S1), but is less necessary when heteroatom-poor DOM samples are analyzed.
Retrieval of Discriminating Information and Biogeochemical Trends
Multivariate statistics revealed a separation of ecosystem DOM types according to their proximity to recent inputs of fresh or freshly decomposing organic matter (Figure 5). Bog (N3B, N8B), IHSS and topsoil water samples (H2S-5, T-5, W1-5, and JE-2-5-10) showed strong contribution of aromatic and phenolic-type formulae in the lower mass range. During potential passage through deeper soil, aquifers, and downstream aquatic systems, these signal become less dominant and NOSC, AIMOD, and DBE of DOM decrease simultaneously with a shift from bi- or multi-modal ion abundance patterns to unimodal ones. Similar losses of aromatic constituents have been described for soils and rivers by other techniques (Creed et al., 2015; Klotzbücher et al., 2016). This implies that freshly decomposing materials can be traced by their contribution of aromatic- and phenolic-type formulae (Roth et al., 2013, 2014, 2016; Nowak et al., 2017; Schwab et al., 2017). In short, Roth et al. (2014) described several trends in a study including different sets of ecosystem samples. We found reproducible separation of a subset of these samples (water samples from forest soils, grassland soil, bogs, and rivers) on both instruments. This encompassed (a) differentiation of surface and soil water samples, which were paralleled by changes in pH and vegetation type (clusters A and B in Figure 5A; Roth et al., 2013, 2014), (b) retrieval of a depth trend found for grassland soils (JE-2-5 samples) including an increase in molecular similarity to river and marine samples with depth mainly due to vanishing aromatic-type formulae in the lower mass range (cluster C) (Roth et al., 2016), and (c) discrimination of anoxic (H5-3a) and oxic (H3-2b) aquifer environments (cluster D, Nowak et al., 2017; Schwab et al., 2017). Unique formulae of forest sites showed a higher aromaticity compared to unique formulae found in less acidic grassland sites, supporting the finding that aromatic signals < m/z 300 might be linked to fresh and less decomposed organic matter inputs (Roth et al., 2014, 2016). Contrastingly, unique formulae found in grassland sites indicated stronger contribution of N and S formulae to DOM. Similarly, we found a significant link between the number of N atoms and the second coordinate. A paralleling trend regarding the sulfur content of formulae was only observed in the FT-ICR MS analysis. This may depict the surplus of information gained by higher resolution, where subtle differences in heteroatom contribution are still better constrained. The major separation showed high degree of robustness and was driven by commonly detected signals. All in all, the strong differentiation among samples of the set was corroborated by the retrieval of previously published trends with extended sets of similar samples.
Implications
The Orbitrap Elite has proven to be powerful for the challenging analysis of complex DOM fingerprints and the associated subtle differences in molecular composition that need to be resolved. Depending on the sample type, the additional information gained by the FT-ICR MS was either minor for samples that held mainly CHO formulae and had a lower average m/z, like the IHSS sample, or somewhat higher for samples that were NSP-rich and had higher average m/z, like the marine NELHA sample. The Orbitrap provided similar information compared to the FT-ICR MS, with the obvious aspect of lower resolving power being the main limitation in higher mass range. Accordingly, Orbitrap performance seems sufficient for the analysis of terrestrial samples that show abundance maxima in the lower mass range, and might soon even overcome this limitation through further increases in resolving power. Even under these circumstances, the Orbitrap is able to reproduce observed trends in molecular composition and allows separation of ecosystem types based on their DOM fingerprints. Drawbacks in resolving power can be tackled by increasing the specificity for analytes of interest during extraction (Tfaily et al., 2015; Li et al., 2016; Lv et al., 2016; Raeke et al., 2016), ionization (Hertkorn et al., 2008; Hockaday et al., 2009), or instrumental detection (Sleno, 2012; Cao et al., 2016). Although not comprehensive, broad trends in heteroatom content were also captured by the Orbitrap (Figure 6 and Supplementary Table S1). With regard to drawbacks in resolution of heteroatom-containing formulae, the Orbitrap may thus still be used as a tool to inform researchers about which samples would require regular or even improved FT-ICR MS performance. Our study provides an improved baseline for application of lower-resolution instruments. The open-source software used herein and published algorithms for molecular formula assignment and data analysis (e.g., Kujawinski and Behn, 2006; Kunenkov et al., 2009; Green and Perdue, 2015; Kew et al., 2017) will likely assist more researchers in contributing to DOM research in future. With analytical developments being available already now, FT-ICR MS and Orbitrap systems are of utmost importance to reveal full detail of the molecular composition, the origin and dynamics of DOM in both space and time. We finally recommend the use of internationally recognized reference materials that will help to decrease the instrument dependent tuning factors and simultaneously increase the comparability of the retrieved ion abundance patterns.
Author Contributions
CS, V-NR, GG, and TD conceived the study. TD contributed NELHA and BZWA extracts. CS and V-NR performed SPE of all other samples. CS performed measurements and data analysis and interpretation with the help of TD, V-NR and GG and drafted the manuscript with significant contributions from all authors. All authors approved the final version of the manuscript.
Funding
We are grateful to the Max-Planck-Gesellschaft (MPG) and the Deutsche Forschungsgemeinschaft (DFG) for financial support as part of GRK 1257 “Alteration and Element Mobility at the Microbe-Mineral Interface” and CRC 1076 “AquaDiva.” V-NR acknowledges additional funding by the Zwillenberg-Tietz-Stiftung. CS received a Ph.D. stipend from the International Max Planck Research School for Global Biogeochemical Cycles (IMPRS-gBGC).
Conflict of Interest Statement
The authors declare that the research was conducted in the absence of any commercial or financial relationships that could be construed as a potential conflict of interest.
Acknowledgments
The authors thank Jeffrey Hawkes and Benjamin Jacob for generously sharing data and Matlab routines and Katrin Klaproth for FT-ICR MS assistance. Markus Lange, Yan Li, and Heiko Moossen are acknowledged for valuable discussions and feedback on an earlier version of the manuscript. The authors thank Andrew Durso for language editing. The authors also like to thank the reviewers for their helpful comments which improved the final manuscript.
Supplementary Material
The Supplementary Material for this article can be found online at: https://www.frontiersin.org/articles/10.3389/feart.2018.00138/full#supplementary-material
References
Bailey, V. L., Smith, A. P., Tfaily, M., Fansler, S. J., and Bond-Lamberty, B. (2017). Differences in soluble organic carbon chemistry in pore waters sampled from different pore size domains. Soil Biol. Biochem. 107, 133–143. doi: 10.1016/j.soilbio.2016.11.025
Cao, D., Lv, J., Geng, F., Rao, Z., Niu, H., Shi, Y., et al. (2016). Ion accumulation time dependent molecular characterization of natural organic matter using electrospray ionization-Fourier transform ion cyclotron resonance mass spectrometry. Anal. Chem. 88, 12210–12218. doi: 10.1021/acs.analchem.6b03198
Carlson, C. A., and Hansell, D. A. (2014). “DOM sources, sinks, reactivity, and budgets,” in Biogeochemistry of Marine Dissolved Organic Matter, eds C. A. Carlson and D. A. Hansell (Amsterdam: Elsevier), 65–126.
Chambers, M. C., Maclean, B., Burke, R., Amodei, D., Ruderman, D. L., Neumann, S., et al. (2012). A cross-platform toolkit for mass spectrometry and proteomics. Nat. Biotechnol. 30, 918–920. doi: 10.1038/nbt.2377
Cortés-Francisco, N., and Caixach, J. (2015). Fragmentation studies for the structural characterization of marine dissolved organic matter. Anal. Bioanal. Chem. 407, 2455–2462. doi: 10.1007/s00216-015-8499-3
Creed, I. F., McKnight, D. M., Pellerin, B. A., Green, M. B., Bergamaschi, B. A., Aiken, G. R, et al. (2015). The river as a chemostat: fresh perspectives on dissolved organic matter flowing down the river continuum. Can. J. Fish. Aquat. Sci. 72, 1272–1285. doi: 10.1139/cjfas-2014-0400
D’Andrilli, J., Cooper, W. T., Foreman, C. M., and Marshall, A. G. (2015). An ultrahigh-resolution mass spectrometry index to estimate natural organic matter lability. Rapid Commun. Mass Spectrom. 29, 2385–2401. doi: 10.1002/rcm.7400
Danger, G., Orthous-Daunay, F. R., de Marcellus, P., Modica, P., Vuitton, V., Duvernay, F., et al. (2013). Characterization of laboratory analogs of interstellar/ cometary organic residues using very high resolution mass spectrometry. Geochim. Cosmochim. Acta 118, 184–201. doi: 10.1016/j.gca.2013.05.015
Denisov, E., Damoc, E., Lange, O., and Makarov, A. (2012). Orbitrap mass spectrometry with resolving powers above 1,000,000. Int. J. Mass Spectrom. 325, 80–85. doi: 10.1016/j.ijms.2012.06.009
Dittmar, T., Koch, B., Hertkorn, N., and Kattner, G. (2008). A simple and efficient method for the solid-phase extraction of dissolved organic matter (SPE-DOM) from seawater. Limnol. Oceanogr. Methods 6, 230–235. doi: 10.4319/lom.2008.6.230
Galindo, C., and Del Nero, M. (2015). Chemical fractionation of a terrestrial humic acid upon sorption on alumina by high resolution mass spectrometry. RSC Adv. 5, 73058–73067. doi: 10.1039/C5RA12091H
Gleixner, G. (2013). Soil organic matter dynamics: a biological perspective derived from the use of compound-specific isotopes studies. Ecol. Res. 28, 683–695. doi: 10.1007/s11284-012-1022-9
Green, N. W., Mcinnis, D., Hertkorn, N., Maurice, P. A., and Perdue, E. M. (2014a). Suwannee River natural organic matter: Isolation of the 2R101N reference sample by reverse osmosis. Environ. Eng. Sci. 32, 38–44. doi: 10.1089/ees.2014.0284
Green, N. W., and Perdue, E. M. (2015). Fast graphically inspired algorithm for assignment of molecular formulae in ultrahigh resolution mass spectrometry. Anal. Chem. 87, 5086–5094. doi: 10.1021/ac504166t
Green, N. W., Perdue, E. M., Aiken, G. R., Butler, K. D., Chen, H., Dittmar, T., et al. (2014b). An intercomparison of three methods for the large-scale isolation of oceanic dissolved organic matter. Mar. Chem. 161, 14–19. doi: 10.1016/j.marchem.2014.01.012
Hawkes, J. A., Dittmar, T., Patriarca, C., Tranvik, L., and Bergquist, J. (2016). Evaluation of the Orbitrap mass spectrometer for the molecular fingerprinting analysis of natural dissolved organic matter. Anal. Chem. 88, 7698–7704. doi: 10.1021/acs.analchem.6b01624
Heimann, M., and Reichstein, M. (2008). Terrestrial ecosystem carbon dynamics and climate feedbacks. Nature 451, 289–292. doi: 10.1038/nature06591
Hertkorn, N., Benner, R., Frommberger, M., Schmitt-Kopplin, P., Witt, M., Kaiser, K., et al. (2006). Characterization of a major refractory component of marine dissolved organic matter. Geochim. Cosmochim. Acta 70, 2990–3010. doi: 10.1016/j.gca.2006.03.021
Hertkorn, N., Frommberger, M., Witt, M., Koch, B. P., Schmitt-Kopplin, P., and Perdue, E. M. (2008). Natural organic matter and the event horizon of mass spectrometry. Anal. Chem. 80, 8908–8919. doi: 10.1021/ac800464g
Hertkorn, N., Ruecker, C., Meringer, M., Gugisch, R., Frommberger, M., Perdue, E. M., et al. (2007). High-precision frequency measurements: indispensable tools at the core of the molecular-level analysis of complex systems. Anal. Bioanal. Chem. 389, 1311–1327. doi: 10.1007/s00216-007-1577-4
Hockaday, W. C., Purcell, J. M., Marshall, A. G., Baldock, J. A., and Hatcher, P. G. (2009). Electrospray and photoionization mass spectrometry for the characterization of organic matter in natural waters: a qualitative assessment. Limnol. Oceanogr. Methods 7, 81–95. doi: 10.4319/lom.2009.7.81
Kallenbach, C. M., Grandy, A., and Frey, S. D. (2016). Direct evidence for microbial-derived soil organic matter formation and its ecophysiological controls. Nat. Commun. 7:13630. doi: 10.1038/ncomms13630
Kellerman, A. M., Dittmar, T., Kothawala, D. N., and Tranvik, L. J. (2014). Chemodiversity of dissolved organic matter in lakes driven by climate and hydrology. Nat. Commun. 5:3804. doi: 10.1038/ncomms4804
Kew, W., Blackburn, J. W. T., Clarke, D. J., and Uhrín, D. (2017). Interactive van Krevelen diagrams - Advanced visualisation of mass spectrometry data of complex mixtures. Rapid Commun. Mass Spectrom. 31, 658–662. doi: 10.1002/rcm.7823
Klotzbücher, T., Kalbitz, K., Cerli, C., Hernes, P. J., and Kaiser, K. (2016). Gone or just out of sight? The apparent disappearance of aromatic litter components in soils. Soil 2, 325–335. doi: 10.5194/soil-2-325-2016
Koch, B. P., and Dittmar, T. (2006). From mass to structure: an aromaticity index for high-resolution mass data of natural organic matter. Rapid Commun. Mass Spectrom. 20, 926–932. doi: 10.1002/rcm.2386
Koch, B. P., and Dittmar, T. (2016). From mass to structure: an aromaticity index for high-resolution mass data of natural organic matter. Rapid Commun. Mass Spectrom. 30:250. doi: 10.1002/rcm.7433
Koch, B. P., Dittmar, T., Witt, M., and Kattner, G. (2007). Fundamentals of molecular formula assignment to ultrahigh resolution mass data of natural organic matter. Anal. Chem. 79, 1758–1763. doi: 10.1021/ac061949s
Kujawinski, E. B. (2011). The impact of microbial metabolism on marine dissolved organic matter. Ann. Rev. Mar. Sci. 3, 567–599. doi: 10.1146/annurev-marine-120308-081003
Kujawinski, E. B., and Behn, M. D. (2006). Automated analysis of electrospray ionization Fourier transform ion cyclotron resonance mass spectra of natural organic matter. Anal. Chem. 78, 4363–4373. doi: 10.1021/ac0600306
Kunenkov, E. V., Kononikhin, A. S., Perminova, I. V., Hertkorn, N., Gaspar, A., and Schmitt-Kopplin, P. (2009). Total mass difference statistics algorithm: a new approach to identification of high-mass building blocks in electrospray ionization Fourier transform ion cyclotron mass spectrometry data of natural organic matter. Anal. Chem. 81, 10106–10115. doi: 10.1021/ac901476u
Lam, B., Baer, A., Alaee, M., Lefebvre, B., Moser, A., Williams, A., et al. (2007). Major structural components in freshwater dissolved organic matter. Environ. Sci. Technol. 41, 8240–8247. doi: 10.1021/es0713072
Lechtenfeld, O. J., Kattner, G., Flerus, R., McCallister, S. L., Schmitt-Kopplin, P., and Koch, B. P. (2014). Molecular transformation and degradation of refractory dissolved organic matter in the Atlantic and Southern Ocean. Geochim. Cosmochim. Acta 126, 321–337. doi: 10.1016/j.gca.2013.11.009
Li, Y., Harir, M., Lucio, M., Kanawati, B., Smirnov, K., Flerus, R., et al. (2016). Proposed guidelines for solid phase extraction of Suwannee River dissolved organic matter. Anal. Chem. 88, 6680–6688. doi: 10.1021/acs.analchem.5b04501
Liu, X., Ser, Z., Cluntun, A. A., Mentch, S. J., and Locasale, J. W. (2014). A strategy for sensitive, large scale quantitative metabolomics. J. Vis. Exp. 27:87. doi: 10.3791/51358
Lv, J., Zhang, S., Luo, L., and Cao, D. (2016). Solid-phase extraction-stepwise elution (SPE-SE) procedure for isolation of dissolved organic matter prior to ESI-FT-ICR-MS analysis. Anal. Chim. Acta 948, 55–61. doi: 10.1016/j.aca.2016.10.038
Mangal, V., Stock, N. L., and Guéguen, C. (2016). Molecular characterization of phytoplankton dissolved organic matter (DOM) and sulfur components using high resolution Orbitrap mass spectrometry. Anal. Bioanal. Chem. 408, 1891–1900. doi: 10.1007/s00216-015-9295-9
Marín-Spiotta, E., Gruley, K. E., Crawford, J., Atkinson, E. E., Miesel, J. R., Greene, S., et al. (2014). Paradigm shifts in soil organic matter research affect interpretations of aquatic carbon cycling: transcending disciplinary and ecosystem boundaries. Biogeochemistry 117, 279–297. doi: 10.1007/s10533-013-9949-7
Marschner, B., Brodowski, S., Dreves, A., Gleixner, G., Gude, A., Grootes, P. M., et al. (2008). How relevant is recalcitrance for the stabilization of organic matter in soils? J. Plant Nutr. Soil Sci. 171, 91–110. doi: 10.1002/jpln.200700049
Marshall, A. G., Hendrickson, C. L., and Jackson, G. S. (1998). Fourier transform ion cyclotron resonance mass spectrometry: a primer. Mass Spectrom. Rev. 17, 1–35. doi: 10.1002/(SICI)1098-2787(1998)17:1<1::AID-MAS1>3.0.CO;2-K
Medeiros, P. M., Seidel, M., Niggemann, J., Spencer, R. G. M., and Hernes, P. J. (2016). A novel molecular approach for tracing terrigenous dissolved organic matter into the deep ocean. Global Biogeochem. Cycles 30, 1–11. doi: 10.1002/2015GB005320
Mostovaya, A., Hawkes, J. A., Koehler, B., Dittmar, T., and Tranvik, L. J. (2017). Emergence of the reactivity continuum of organic matter from kinetics of a multitude of individual molecular constituents. Environ. Sci. Technol. 51, 11571–11579. doi: 10.1021/acs.est.7b02876
Nebbioso, A., and Piccolo, A. (2015). Modification of chemical and conformational properties of natural organic matter by click chemistry as revealed by ESI-Orbitrap mass spectrometry. Anal. Bioanal. Chem. 407, 8515–8523. doi: 10.1007/s00216-015-9005-7
Nowak, M. E., Schwab, V. F., Lazar, C. S., Behrendt, T., Kohlhepp, B., Totsche, K. U., et al. (2017). Carbon isotopes of dissolved inorganic carbon reflect utilization of different carbon sources by microbial communities in two limestone aquifer assemblages. Hydrol. Earth Syst. Sci. 21, 4283–4300. doi: 10.5194/hess-21-4283-2017
Osterholz, H., Singer, G., Wemheuer, B., Daniel, R., Simon, M., Niggemann, J., et al. (2016). Deciphering associations between dissolved organic molecules and bacterial communities in a pelagic marine system. ISME J. 10, 1717–1730. doi: 10.1038/ismej.2015.231
Petras, D., Koester, I., Da Silva, R., Stephens, B. M., Haas, A. F., Nelson, C. E., et al. (2017). High-resolution liquid chromatography tandem mass spectrometry enables large scale molecular characterization of dissolved organic matter. Front. Mar. Sci. 4:405. doi: 10.3389/fmars.2017.00405
Pomerantz, A. E., Mullins, O. C., Paul, G., Ruzicka, J., and Sanders, M. (2011). Orbitrap mass spectrometry: a proposal for routine analysis of nonvolatile components of petroleum. Energy Fuels 25, 3077–3082. doi: 10.1021/ef200359n
Qi, Y., and O’Connor, P. B. (2014). Data processing in Fourier transform ion cyclotron resonance mass spectrometry. Mass Spectrom. Rev. 33, 333–352. doi: 10.1002/mas.21414
Raeke, J., Lechtenfeld, O. J., Wagner, M., Herzsprung, P., and Reemtsma, T. (2016). Selectivity of solid phase extraction of freshwater dissolved organic matter and its effect on ultrahigh resolution mass spectra. Environ. Sci. Process. Impacts 18, 918–927. doi: 10.1039/c6em00200e
Riedel, T., and Dittmar, T. (2014). A method detection limit for the analysis of natural organic matter via Fourier transform ion cyclotron resonance mass spectrometry. Anal. Chem. 86, 8376–8382. doi: 10.1021/ac501946m
Rossel, P. E., Bienhold, C., Boetius, A., and Dittmar, T. (2016). Dissolved organic matter in pore water of Arctic Ocean sediments: environmental influence on molecular composition. Org. Geochem. 97, 41–52. doi: 10.1016/j.orggeochem.2016.04.003
Roth, V.-N., Dittmar, T., Gaupp, R., and Gleixner, G. (2013). Latitude and pH driven trends in the molecular composition of DOM across a north south transect along the Yenisei River. Geochim. Cosmochim. Acta 123, 93–105. doi: 10.1016/j.gca.2013.09.002
Roth, V.-N., Dittmar, T., Gaupp, R., and Gleixner, G. (2014). Ecosystem-specific composition of dissolved organic matter. Vadose Zone J. 13:vzj2013.09.0162. doi: 10.2136/vzj2013.09.0162
Roth, V.-N., Dittmar, T., Gaupp, R., and Gleixner, G. (2015). The molecular composition of dissolved organic matter in forest soils as a function of pH and temperature. PLoS One 10:e0119188. doi: 10.1371/journal.pone.0119188
Roth, V.-N., Lange, M., Dittmar, T., and Gleixner, G. (2016). Broadband molecular composition of dissolved organic matter in grassland soil as a function of depth. Geophys. Res. Abstr. 18, 8840.
Rowland, S. J., Pereira, A. S., Martin, J. W., Scarlett, A. G., West, C. E., Lengger, S. K., et al. (2014). Mass spectral characterisation of a polar, esterified fraction of an organic extract of an oil sands process water. Rapid Commun. Mass Spectrom. 28, 2352–2362. doi: 10.1002/rcm.7024
Schmidt, M. W. I., Torn, M. S., Abiven, S., Dittmar, T., Guggenberger, G., Janssens, I. A., et al. (2011). Persistence of soil organic matter as an ecosystem property. Nature 478, 49–56. doi: 10.1038/nature10386
Schwab, V. F., Hermann, M., Roth, V.-N., Gleixner, G., Lehmann, R., Pohnert, G., et al. (2017). Functional diversity of microbial communities in pristine aquifers inferred by PLFA- and sequencing-based approaches. Biogeosciences 14, 2697–2714. doi: 10.5194/bg-14-2697-2017
Seifert, A.-G., Roth, V.-N., Dittmar, T., Gleixner, G., Breuer, L., Houska, T., et al. (2016). Comparing molecular composition of dissolved organic matter in soil and stream water: influence of land use and chemical characteristics. Sci. Total Environ. 571, 142–152. doi: 10.1016/j.scitotenv.2016.07.033
Sleighter, R. L., and Hatcher, P. G. (2008). Molecular characterization of dissolved organic matter (DOM) along a river to ocean transect of the lower Chesapeake Bay by ultrahigh resolution electrospray ionization Fourier transform ion cyclotron resonance mass spectrometry. Mar. Chem. 110, 140–152. doi: 10.1016/j.marchem.2008.04.008
Sleno, L. (2012). The use of mass defect in modern mass spectrometry. J. Mass Spectrom. 47, 226–236. doi: 10.1002/jms.2953
Smith, E. A., Park, S., Klein, A. T., and Lee, Y. J. (2012). Bio-oil analysis using negative electrospray ionization: comparative study of high resolution mass spectrometers and phenolic vs. sugaric Components. Energy Fuels 26, 3796–3802. doi: 10.1021/ef3003558
Smith, K. E., Callahan, M. P., Gerakines, P. A., Dworkin, J. P., and House, C. H. (2014). Investigation of pyridine carboxylic acids in CM2 carbonaceous chondrites: potential precursor molecules for ancient coenzymes. Geochim. Cosmochim. Acta 136, 1–12. doi: 10.1016/j.gca.2014.04.001
Staš, M., Chudoba, J., Kubička, D., and Pospíšil, M. (2015). Chemical characterization of pyrolysis bio-oil: application of orbitrap mass spectrometry. Energy Fuels 29, 3233–3240. doi: 10.1021/acs.energyfuels.5b00407
Strohalm, M., Kavan, D., Novák, P., Volnı, M., and Havlček, V. (2010). mmass 3: a cross-platform software environment for precise analysis of mass spectrometric data. Anal. Chem. 82, 4648–4651. doi: 10.1021/ac100818g
Swenson, M. M., Oyler, A. R., and Minor, E. C. (2014). Rapid solid phase extraction of dissolved organic matter. Limnol. Oceanogr. 12, 713–728. doi: 10.4319/lom.2014.12.713
Tfaily, M. M., Chu, R. K., Tolić, N., Roscioli, K. M., Anderton, C. R., Paša-Tolić, L., et al. (2015). Advanced solvent based methods for molecular characterization of soil organic matter by high-resolution mass spectrometry. Anal. Chem. 87, 5206–5215. doi: 10.1021/acs.analchem.5b00116
Ward, N., Bianchi, T., Medeiros, P., Seidel, M., Richey, J., Keil, R., et al. (2017). Where carbon goes when water flows: carbon cycling across the aquatic continuum. Front. Ecol. Environ. 4:7. doi: 10.3389/fmars.2017.00007
Zark, M., Christoffers, J., and Dittmar, T. (2017). Molecular properties of deep-sea dissolved organic matter are predictable by the central limit theorem: evidence from tandem FT-ICR-MS. Mar. Chem. 191, 9–15. doi: 10.1016/j.marchem.2017.02.005
Zark, M., and Dittmar, T. (2018). Universal molecular structures in natural dissolved organic matter. Nat. Commun. 9:3178. doi: 10.1038/s41467-018-05665-9
Zhurov, K. O., Kozhinov, A. N., and Tsybin, Y. O. (2013). Evaluation of high-field Orbitrap Fourier transform mass spectrometer for petroleomics. Energy Fuels 27, 2974–2983. doi: 10.1021/ef400203g
Keywords: FT-ICR MS, Orbitrap, metabolomics, ecosystem, chemodiversity, soil organic matter, DOM
Citation: Simon C, Roth V-N, Dittmar T and Gleixner G (2018) Molecular Signals of Heterogeneous Terrestrial Environments Identified in Dissolved Organic Matter: A Comparative Analysis of Orbitrap and Ion Cyclotron Resonance Mass Spectrometers. Front. Earth Sci. 6:138. doi: 10.3389/feart.2018.00138
Received: 29 March 2018; Accepted: 04 September 2018;
Published: 25 September 2018.
Edited by:
Timothy Ferdelman, Max Planck Institute for Marine Microbiology (MPG), GermanyReviewed by:
Kai Mangelsdorf, Helmholtz-Zentrum Potsdam Deutsches Geoforschungszentrum, Helmholtz-Gemeinschaft Deutscher Forschungszentren (HZ), GermanyKarl Kaiser, Texas A&M University, United States
Copyright © 2018 Simon, Roth, Dittmar and Gleixner. This is an open-access article distributed under the terms of the Creative Commons Attribution License (CC BY). The use, distribution or reproduction in other forums is permitted, provided the original author(s) and the copyright owner(s) are credited and that the original publication in this journal is cited, in accordance with accepted academic practice. No use, distribution or reproduction is permitted which does not comply with these terms.
*Correspondence: Gerd Gleixner, Z2VyZC5nbGVpeG5lckBiZ2MtamVuYS5tcGcuZGU= orcid.org/0000-0002-4616-0953