 Jean-Pierre Brun
 Xavier Fort
- 1Univ Rennes, CNRS, Géosciences Rennes-UMR 6118, Rennes, France
- 2g. o. Logical Consulting, Cesson-Sévigné, France
Whereas, salt margins are rather common, the growth of continental shelves on top of salt margins is a topic that has seldom been considered. In such settings, the sediments coming from the nearby continental areas are deposited on a viscous substratum and therefore a continental shelf can form and stabilize only if the salt layer underlying sediments does not flow or stops flowing. The present study that combines evidence from the northern Gulf of Mexico and laboratory modeling concerns more particularly those salt tectonic settings where the direction of sediment supply is oblique to the direction of salt flow because this allows to decipher between the relative effects of sedimentation and salt flow. It is shown, in both northern Gulf of Mexico and experiment, that: (i) shelf growth is controlled by an association of normal faults and transfer zones, (ii) shelf breaks, controlled by normal faults, and transfer zones trend perpendicular and parallel to salt flow, respectively, (iii) the rate of shelf break migration is faster in areas of higher sedimentation rates, (iv) even at late stages of shelf growth, when the role of salt flow tends to decrease, transfer zones still remain controlled by the direction of salt flow, and (v) transfer zones that participated to the shaping of a continental shelf provide a precious tool to map the direction of salt flow and its variations in space and time. The interaction between salt flow and sediment supply controls the trend of the shelf envelope during shelf growth. Because the rate of salt flow decreases with time, a constant or increasing rate of sediment supply results in a rotation of the shelf envelope trend from perpendicular to salt flow direction at early stages toward perpendicular to sediment supply direction at the late stages.
Introduction
Continental shelves of passive margins correspond to shallow water and very low dipping surfaces, located between the coastline and the slope, and underlain by shallow marine sequences (Swift and Thorne, 1991). The growth of continental shelves as documented by subsurface data results from repeated regressive-transgressive transits of deltas and other shoreline systems down to the edge of a pre-existing shelf that are controlled by sea level changes (Posamentier et al., 1988; Steckler et al., 1999; Galloway, 2001; Steel et al., 2008) and sediment supply (Carvajal et al., 2009). Growth processes in action at shelf break are either purely sedimentary or result from interactions between sedimentary and deformation processes (Helland-Hansen et al., 2012). A particular example of the latter occurs at passive margins where salt tectonics is active (Brun and Fort, 2011; Fort and Brun, 2012) because the sediments coming from the nearby continental areas are deposited on flowing evaporites.
The present paper is devoted to the deformation patterns related to continental shelf growth in salt tectonic environments, a topic that has seldom been considered. Our study focuses more particularly on those salt passive margins where the direction of sediment supply is oblique to the direction of salt flow as this allows deciphering of structural and dynamic effects related to sediment supply and salt flow, respectively. The northern Gulf of Mexico that is one of the largest salt basin worldwide provides a remarkable and well-documented example of a large migration of the shelf break (i.e., several hundred km) during the Neogene (Galloway et al., 2000; Galloway, 2001), in association with the development of transfer zones (Fort and Brun, 2012). Laboratory analogue modeling is used to illustrate the mechanisms of deformation involved in the continental shelf growth when, like in the northern Gulf of Mexico, the direction of sedimentary supply trends at 60° to the regional direction of salt flow. Simple rules governing the deformation patterns that control the growth of continental shelves in a salt tectonic setting are deduced from experimental evidence and comparison with the northern Gulf of Mexico.
Shelf Break Migration In Active Salt Tectonic Settings
In a salt basin, a continental shelf can form and stabilize only if the underlying salt layer is not flowing or flows at very low rate. In most passive margins, sediments coming from the onshore domain are transported almost parallel to margin dip. On the other hand, gravity gliding of the salt and the overlying sediments down margin dip generates extensional structures in the salt margin landward part with normal faults trending approximately perpendicular to the direction of salt flow, parallel to margin dip (see review by Brun and Fort, 2011). In other words, salt flow and sediment transport most often trend nearly parallel.
As long as the salt layer is thick enough to allow easy flow, the overlying sedimentary layers undergo extensional faulting and fault blocks are transported seaward (Figure 1A). The shelf first forms on the landward side of the salt layer pinch-out and progressively extends seaward as a function of the interaction between (i) the input of sediments and (ii) the salt flow rate. Gravity driven salt tectonics at passive margins is a process whose rate does not vary strongly (strain rates in the range 10−15 to 10−16 s−1). Laboratory experiments (Mauduit et al., 1997; Fort et al., 2004b) show that the gliding rate increases with the thickness of the sediments deposited on top of the salt. On the contrary, sedimentation rates at passive margins can vary over several orders of magnitude with the highest values generally corresponding to delta-type environments. Therefore, the dynamics of continental shelf growth in a salt margin depends on the rate of sedimentary supply. In salt margins with low rates of sedimentary input, the seaward migration of the boundary between non-flowing and still flowing salt domains can be faster than shelf break migration. In such a situation, the continental shelf growth interacts with salt tectonics but only at very early stages of development. In salt margins with high rates of sediment supply, the shelf break corresponds to the boundary between an updip domain of non-flowing salt (or salt flowing at very low rate) and a seaward domain where salt is flowing more vigorously. In terms of sediment deformation, the shelf break separates a landward domain with no or very weak (i.e., the shelf) faulting from a seaward domain where stronger faulting controls the deposition of incoming sediments.
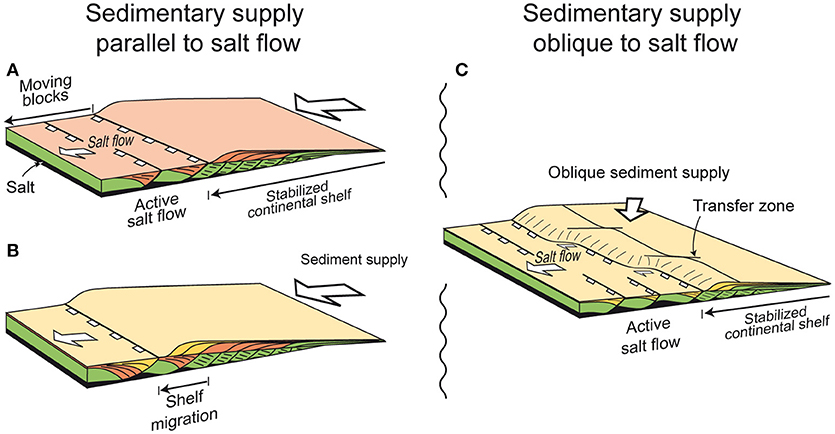
Figure 1. Conceptual models for the development of a continental shelf at a passive margin involving active salt tectonics [Modified after (Fort and Brun, 2012)]: (A) and (B) show two successive stages of shelf break migration at a passive margin where sediment supply (Thick arrows) is parallel to salt flow (Thin arrows). Green, orange and yellow: successive depositional episodes. Normal faults trend parallel to the direction of salt flow. The position of shelf break for each episode is controlled by an active normal fault. Each new depositional episode seals the faults that were active during a previous depositional episode on the landward side of the shelf break. Below the stabilized continental shelf salt stopped flowing. Sediments deposited on the seaward side of the shelf break contribute to the growth of fault blocks that displace seaward on top of the flowing salt. (C) Tri-dimensional structure of a passive margin where sediment supply is oblique to salt flow. The shelf break is, like in (A) and (B), controlled by normal faulting but it is offset by transfer zones trending parallel to the salt flow.
With ongoing seaward displacement of faulted sedimentary blocks, the salt layer progressively thins, thus allowing the continental shelf to stabilize and the shelf break to migrate seaward (Figure 1B). The strongly thinned basal salt layer can still flow below the continental shelf but at very low rate. This is illustrated in the north margin of the northern Gulf of Mexico where the very flat seafloor indicates that any fault-induced irregularity is rapidly smoothed by sedimentation whereas, in neighboring onshore areas, active ground deformations can be observed and measured (e.g., Dokka et al., 2006; Engelkemeir et al., 2010).
In summary, in an active salt tectonics environment, the shelf break corresponds to a mechanical boundary between low and high strain rates in the deforming basal salt layer.
If the direction of sediment supply trends oblique to margin dip, sediment thickness is not constant in a direction perpendicular to the salt flow direction. Consequently, the gliding rate varies along strike, resulting in a segmentation of the extensional domain by transfer zones parallel to the salt flow direction (Figure 1C). Where sediments are thicker, the gliding rate is faster and salt layer thinning is stronger. Consequently, the rate of shelf break migration is faster. Across several neighboring extensional domains with different gliding rates, the map contour of the shelf break then becomes undulated (Figure 1C).
Remark: In Figure 1, we represented the extension affecting the sediments above salt only as series of normal faults and related block tilting. Note that this is done for the sake of simplicity and that, in nature, other types of salt tectonics structures, like rollovers, horsts and grabens or diapirs, can contribute as well to salt layer thinning and shelf stabilization.
Continental Shelf Growth In The Northern Gulf Of Mexico
To produce a detailed map of the Cenozoic continental shelf at whole Gulf of Mexico (GoM) scale, Galloway et al. (2000) have compiled in a Geographic Information System (GIS) the following data sources: (i) 241 publications and theses, (ii) 800 well data sets, and (iii) deep-basin seismic lines of UTIG (University of Texas Institute for Geophysics). This database allowed the identification of 18 major depositional episodes and the differentiation of 31 depositional facies associations used to construct paleogeographic maps. Then, the Cenozoic history of the GoM sedimentary filling was summarized by a map pattern of shelf-margin migration, based on 25 depositional systems.
For the purpose of the present paper, only the map part concerning the northern GoM salt basin is redrawn showing each depositional system with an arbitrary color (Figure 2). The terminations of depositional episodes represent the successive positions of the shelf break. They are identified by their age (in My) according to the time scale of Berggren et al. (1995). For an easier appraisal of the progressive growth of the continental shelf, each depositional episode is shown separately in Figure 3.
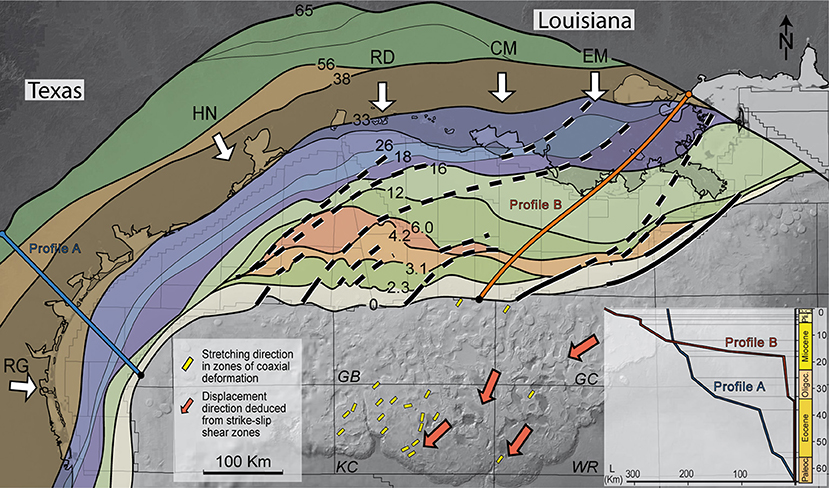
Figure 2. Kinematics of continental shelf growth in the northern Gulf of Mexico [Modified after (Fort and Brun, 2012)]. Contours and ages (in My) of depositional episodes and main axes of sediment supply (White arrows) after Galloway et al. (2000). Solid black lines: Recent transfer zones (see Figure 1C). Dashed lines: trace of previous transfer zones. The five main extrabasinal axes from which sediments filled the northern GoM margins are: RG, palaeo Rio Grande; HN, Houston; RD, Red; CM, Central Mississippi; EM, East Mississippi. Lower right insert: Curves of shelf break migration in the Northwestern margin (Profile A) and North margin (Profile B).
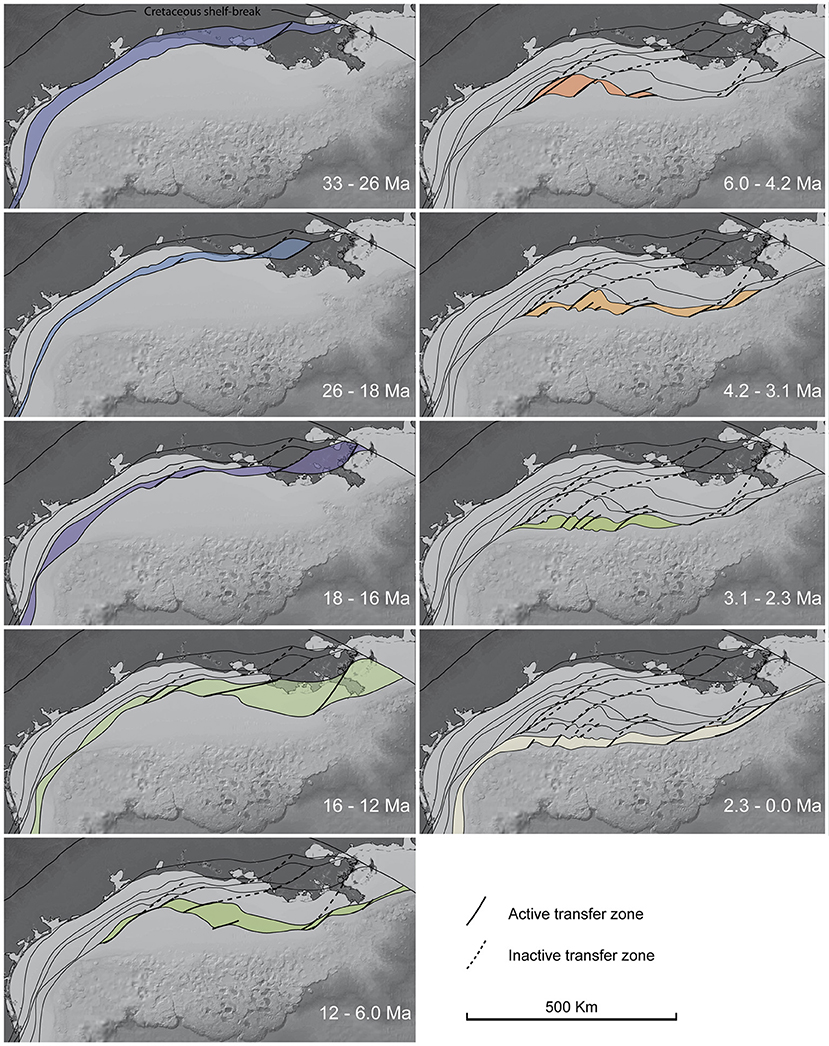
Figure 3. Step-by-step growth of the continental shelf in the northern Gulf of Mexico. Shelf break contours, colors of depositional episodes (growth increments) and ages like in Figure 2. Solid black lines: Transfer zones active during a shelf growth increment; dashed lines: trace of transfer zones that developed during previous shelf growth increments.
Throughout the Cenozoic, the bulk of the sediments that filled the northern GoM margins have been provided by five main extrabasinal axes (Figure 2): the palaeo Rio Grande (RD), Houston (HN), Red (RD), Central Mississippi (CM), and East Mississippi (EM). For more details see Galloway (2001).
Shelf Break Migration
Between Cretaceous (65 Ma) and base Oligocene (33 Ma), the mean shelf break trend was stable, from SW-NE in Texas (Northwest margin) to E-W in Louisiana (North margin) (Figure 2). During this time interval, the shelf break migrated ~150 km, on average, toward the S or SE in Northwest margin (blue curve in insert of Figure 2).
Since Oligocene, the shelf has displayed a 2 fold evolution. In the Northwest margin, it continued to migrate toward the SE with almost the same SW-NE trend. In the North margin, its evolution became rather complex. A major change in the orientation and position of the shelf break occurred in the Middle Miocene (from 16 to 12 Ma in Figures 2, 3). To the East, the shelf break trend rotated from an E-W to a WNW-ESE trend. To the West, the shelf break jumped close to its present-day position, keeping its SW-NE trend.
Amounts and rates of shelf break migration have varied in space and time (red curve in insert of Figure 2). In the Northwest margin, the overall displacement reached approximately 230 km and the migration history alternated between accelerations and decelerations, with a mean rate of 0.35 cm y−1. Low rates of shelf migration occurred in Early to Middle Eocene, Late Oligocene to Early-Miocene and since Middle Miocene. The highest rate of shelf migration occurred from Late Eocene to Early Oligocene. In the North margin, the overall displacement reached approximately 400 km. The rate of shelf migration has slowly increased from Late Eocene to Lower Miocene. A strong and sudden acceleration occurred in early middle Miocene. Since Middle Miocene (16 Ma), the mean migration rate has remained almost constant at approximately 1.8 cm y−1–i.e., more than five times faster than in the West margin.
Transfer Zones
During the Neogene, the shelf break contours became meandering, defining numerous NE-SW trending transfer zones (Dashed lines in Figure 2) (Fort and Brun, 2012). In Figure 3, solid black lines represent the transfer zones that were active during each depositional episode and dashed lines the trace of those that were active in previous episodes. The whole trajectories (2.3–0.0 Ma in Figure 3) are curved showing a NE-SW trends prior to 16 Ma and after 6 Ma and an ENE-WSW trend between 16 and 6 Ma. This temporal anomaly, from Middle Miocene to Late Miocene, corresponds to the period during which the shelf break migration reached its maximum rate. Since the end of Oligocene-Lower Miocene (26-18 Ma), the North margin shelf break has migrated as a mean in a SW direction, almost parallel to the Northwest margin shelf and even along it since the end of Middle Miocene (12 Ma).
Fort and Brun (2012), used the structures displayed by digital bathymetry maps of slope and deep margin basin, located South of present day shelf break, to carry out a kinematic analysis of deformation zones between minibasins. Both stretching directions in zones of co-axial deformation (yellow bars in Figure 2) and mean direction of displacement obtained from a statistical analysis of senses of strike-slip shear (Red arrows in Figure 2) trend in a mean NE-SW direction, almost parallel to the mean trend of transfer zones in the continental shelf. This strongly supports the use of transfer zones as a kinematic indicator for the direction of salt flow during the of shelf break migration (Figure 1C), as proposed by Fort and Brun (2012).
In summary, the location, geometry and kinematics of shelf break migration show that the North and West margins have strikingly different histories. Two diachronic major changes occurred, in Late Eocene-Early Oligocene in the West margin and in Middle-Miocene in the North margin. Since Middle Miocene, the North margin shelf break has migrated toward the SW. This indicates that salt was flowing toward the SW at the scale of the northern GoM domain with an obliquity of around 60° with the mean direction of sediment supply (Figure 2).
Laboratory Modeling
As argued above, the transfer zones involved in the migration of the shelf break as well as kinematic indicators from the slope domain and deep basin indicate that, in the northern Gulf of Mexico, salt flow trends at regional scale in a mean NE-SW direction with an obliquity of around 60° to the mean N-S direction of sediment supply. Therefore, the laboratory experiment presented here has been carried out to test the effects of a sedimentation oblique to the salt flow direction and more particularly: (i) the growth of a continental shelf and (ii) the development of transfer zones, in relation with the bulk dynamic evolution of the salt basin. In other words, this experiment does not aim at modeling the complexities of salt tectonics in the Gulf of Mexico but simply at testing the processes at work during the growth of a shelf in an active salt basin. Results should be applicable to other salt basins elsewhere in the world.
Experimental Procedure
The experimental procedure used in the present work is similar to the one currently used for the study of salt tectonic processes in various laboratories (e.g., Austin: Dooley et al., 2007; London: Adam et al., 2012; Rennes: Fort et al., 2004a; Lille: Lymer et al., 2018) using silicone putties and sand to represent salt and sediments, respectively. However, whereas a large number of experiments of salt tectonics type have been carried out, since about four decades, none has been dedicated to the formation of continental shelves in salt basins.
Scaling
The model is scaled using the classical principles defined for the modeling of brittle-ductile systems using sand and silicone putties. For a small-scale model to be representative of a natural example (a prototype), a dynamic similarity in terms of distribution of stresses, rheologies, and densities between the model and the prototype is required (Hubbert, 1937; Ramberg, 1981). Following these principles, it can be shown that in sand-silicone models, the dynamic similarity is respected when the ratios of stresses and lengths are nearly equal (Brun, 1999).
Materials
Sediments are represented by Fontainebleau sand with a density ρ of about 1,400 kg/m3 and an angle of friction ϕ in the range 30–33°, but without significant cohesion C. Salt is represented by a transparent silicone putty (XM RBG-0901 GUM, Dow Corning) with a Newtonian viscosity μ = 104 Pa s and a density ρ = 1,000 kg/m3. The density contrast between silicone putty and sand (Δρm = 1.4) is slightly higher than might be expected between salt and sediments in nature (Δρp = 1.05–1.18; according to Weijermars et al., 1993). However, as pointed out by Weijermars et al. (1993) this disparity is acceptable because the density contrast between salt and sediments is not the primary factor responsible for the rise of diapirs.
Model Building
The Figure 4 summarizes the experimental setting. The silicone layer (i.e., salt) has a double wedge shape to simulate salt layer pinch-out at basin edges. Its dimensions are: length: 150 cm, width: 100 cm and maximum thickness: 2 cm. A 0.6 cm thick sand layer (so-called pre-kinematic layer) is deposited on top of the silicone layer prior to the onset of experiment.
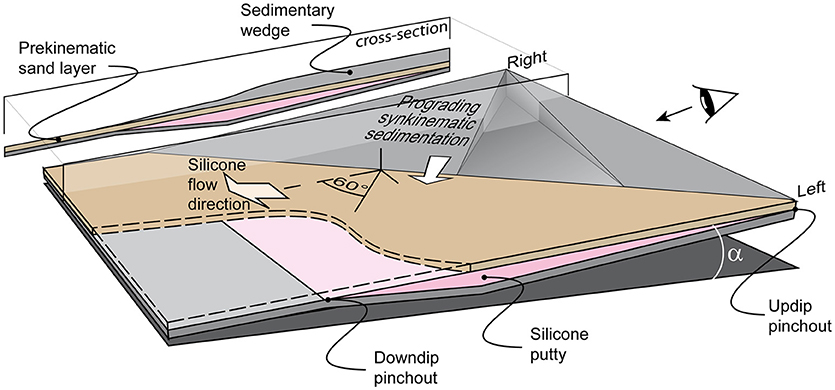
Figure 4. Tri-dimensional sketch of the experimental setting used to study the growth of a continental shelf in a salt tectonic environment where the sediment supply (white arrow) is oblique to salt flow. The basal layer of silicone putty (pink) is double-wedge shaped to simulate salt pinch-out at the updip and downdip ends of the salt basin. A thin sand layer is deposited on top of the silicone layer before the onset of experiment. The direction of salt flow is obtained in inclining the model by an angle α. The obliquity between sediment supply and salt flow is 60°.
Model Run
The experiment duration was 9 days. At the onset of experiment the model was inclined by an angle α = 0.8°. Then this angle was increased once per day to reach an angle α = 2.7° after 7 days. A wedge-shape sand layer, with a thickness of around 1.0 cm at the back and regularly thinning frontward (Figure 4), was deposited with a funnel once per day to simulate a sediment progradation in a direction trending at 60° to basin tilt. Surface photographs were taken at regular time intervals during the experiment.
Results
For the purpose of the present paper, which primarily concerns the development of a continental shelf, the results are summarized in three figures: (i) A selection of top views between 72 and 215 h (Figure 5) showing the progressive deformation at model surface and the progressive growth of a continental shelf in the updip part of the model, (ii) a tracking of surface displacements reported on the last model top view (Figure 6), and (iii) three cross sections to illustrate the style of structures that developed at different places within the model (Figure 7).
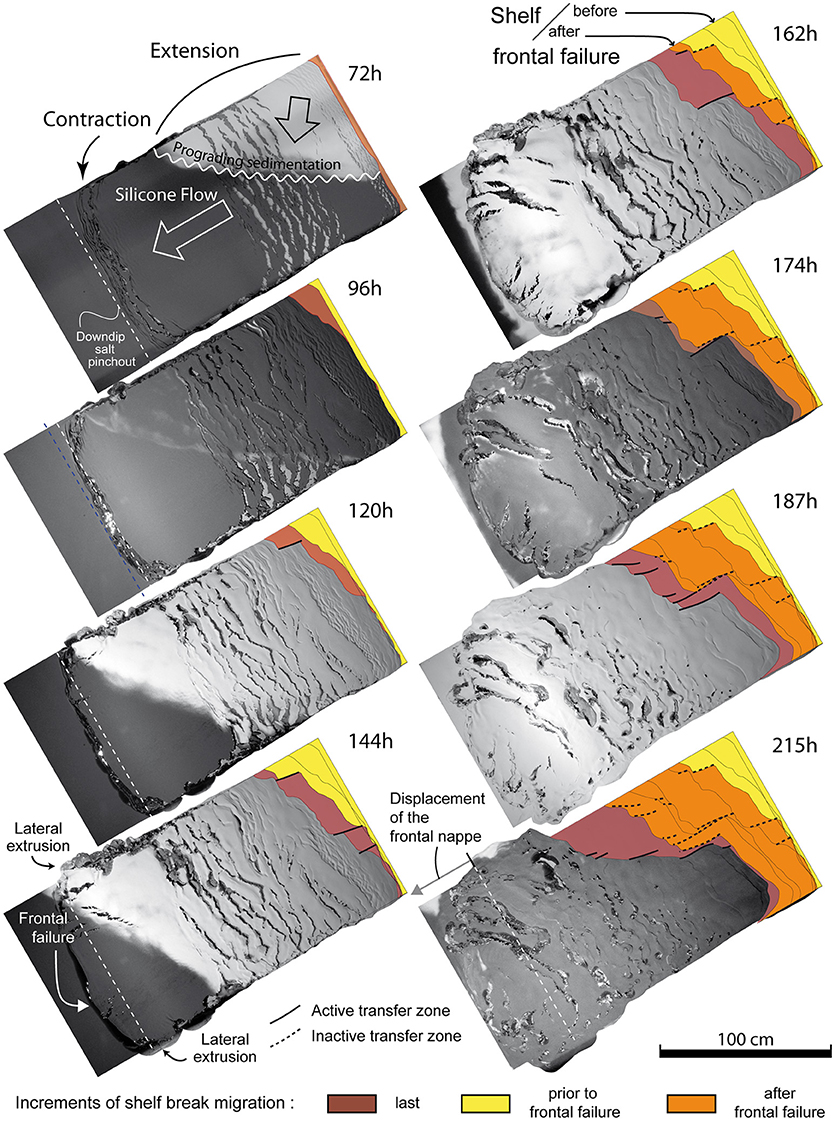
Figure 5. Selection of model top views showing the progressive evolution of surface deformation and growth of the continental shelf. The duration since experiment onset is indicated for each snapshot. White arrows (at 72 h): Directions of silicone (salt) flow and sediment supply.
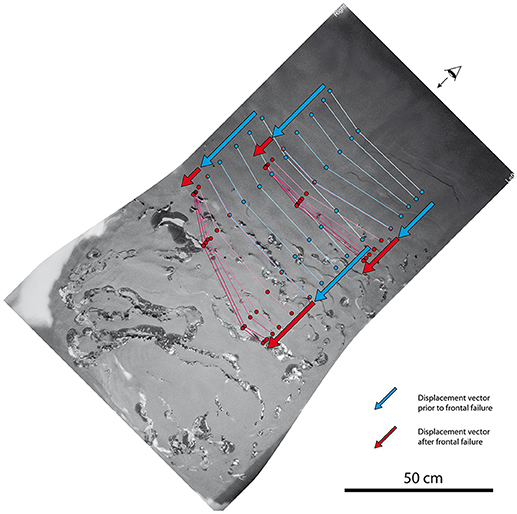
Figure 6. Model top view at the end of experiment (215 h/9 days) with tracking of two series of material points initially located in the updip and downdip parts of the updip extensional domain (See 72 h top view in Figure 5).
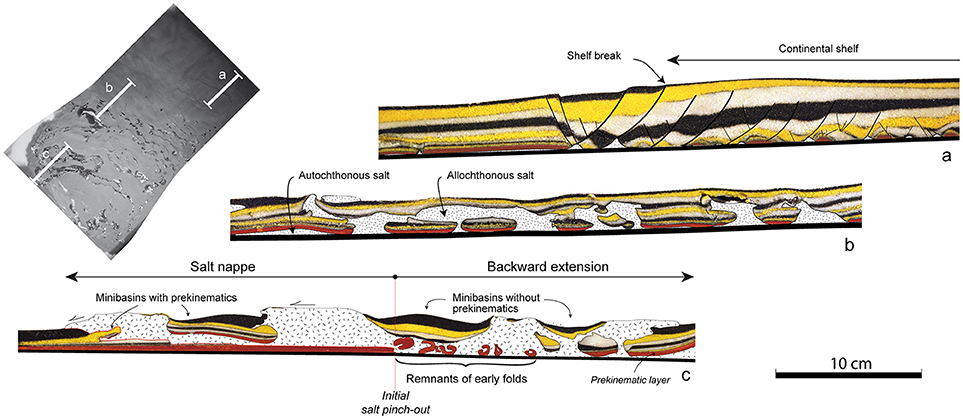
Figure 7. Cross-sections showing the structures that characterize the main deformation domains in the model (See location in the insert: 215 h top view in Figure 5). (a) Growth structure of the continental shelf. SB1 to SB4 correspond to successive shelf break locations. (b) Rafts and salt diapirs in the updip extensional domain. (c) Frontal salt nappe and neighboring backward extensional domain. Red: prekinematic sand layer. White: Silicone putty (salt). Yellow, black, and white: synkinematic sand layers.
Deformation, Displacements and Structures
Deformation History
The observation of model top views (Figure 5) shows that two main stages can be distinguished, prior and after a frontal rupture that occurred at 144 h.
Prior to frontal rupture, a domain of extension developed in the updip part of the model that progressively enlarged to occupy two thirds of the distance between the two salt (silicone putty) pinch-outs (From 72 to 144 h; Figure 5). Simultaneously, a domain of shortening developed close to the down-dip salt pinch-out (144 h; Figure 5). The width of the domain of shortening, which was initially made of several folds and thrusts, progressively decreased to form a single thrust zone that evolved into a frontal rupture.
After rupture, a frontal salt nappe formed whose very fast displacement reached 20 cm (nearly 1/8 of the initial salt basin length) in 67 h (around 1/3 of the total model duration). Soon after the initiation of the salt nappe, lateral salt extrusion occurred on both sides of the model giving a bulk lobate shape to the salt nappe front. Simultaneously, extension started to develop in the whole downdip part of the model that was previously undeformed (i.e., backward extension).
Displacement Pattern
The tracking of material points located along two cross-lines in the updip extensional domain (Figure 6) illustrates the two-stage evolution described above, in terms of displacement history.
Before frontal rupture (blue arrows in Figure 6), the displacements slightly decreased laterally from right to left–i.e., from thicker to synkinematic thinner sediment deposits–in the updip part of the extensional domain. Note that the terms right and left here refer to model sides when looking in the salt flow direction. In direct relation with the variation of displacement rate, extensional structures are more numerous to the right than to the left (compare 72 and 96 h in Figure 5). Conversely, a lateral variation of the displacements in not observed in the downdip part of the extensional domain. In this area, new extensional structures, which participate to an enlargement of the extensional domain, develop parallel to the downdip salt pinch-out and to the domain of frontal shortening. This indicates that, prior to frontal rupture, the downdip part of the extensional domain was less sensible to lateral variations of synkinematic sediment thickness than the updip part and, reciprocally, more sensible to frontal shortening.
After frontal rupture (Red arrows in Figure 6), the reverse effect occurred. In both the updip and downdip parts of the extensional domain, the displacement increased from right to left. In fact, this is due to synkinematic sedimentation at salt nappe front in the right part of the model. The tip of the synkinematic sedimentary wedge reached the right end of the frontal zone of shortening almost simultaneous with frontal rupture. Consequently, further synkinematic sediment deposits occurred to the right part of the salt nappe reducing its rate of displacement with reference to the left part (see 162 to 187 h in Figure 5).
Structures
The thickness to length ratio is too small to allow a single model cross-section parallel to salt flow direction to display all significant structures. Therefore, three smaller cross-sections are shown to illustrate the structures that characterize the main deformation domains and their evolution in time.
The shelf domain (Figure 7a) shows a sequence of normal faulting that progressively accommodated the stabilization of the model updip part leading to a downdip shelf migration. The five top layers (from top to base black, yellow, white, black, and white) successively sealed normal faults in a downdip sense, controlling the successive locations SB1–SB4 of the shelf break. Fault sealing occurred when the basal salt layer became too thin to allow further downdip displacement of the hanging-wall fault block. During the sequential sealing of fault blocks, fault spacing and therefore fault block width increased from right to left as a function of shelf thickness. This syn-sedimentary deformation pattern illustrates the mechanism of continental shelf growth and downdip migration of shelf break.
The updip extensional domain (Figure 7b; see surface views 72 h−144 h in Figure 5) shows the segmentation of sedimentary cover by normal faulting and the formation of rafts on top of the autochthonous salt. Raft separation allowed the formation of diapirs and subsequent sub-horizontal spreading of salt on top of the rafts, forming an irregular allochthonous salt layer. Sediments deposited on top of the allochthonous salt correspond to minibasins.
The frontal salt nappe and the backward extensional domain (Figure 7c) formed after frontal rupture (144 h in Figure 5). The section shows the advance of the salt nappe with reference to the downdip pinch-out. The salt nappe has transported a raft whose basal layer is the pre-kinematic layer deposited on top of salt prior to the onset of experiment. To the right of the salt nappe, the sedimentary cover was not previously submitted to extension (up to 144 h in Figure 5). Extension occurred in an updip direction (i.e., backward) as a result of frontal rupture and emplacement of the salt nappe. This downdip extensional domain displays rafts with a prekinematic layer at the base above the autochthonous salt, an allochthonous salt layer, and minibasins above the allochthonous salt. Folds that formed prior to frontal rupture in the downdip domain of contraction (72 h in Figure 5), close to the salt pinch-out, were disrupted by thrust faults and encapsulated in the salt layer (Figure 7c).
Shelf Growth
The updip domain that progressively stabilized illustrates the progressive shelf growth in map view (Figure 5) and in cross-section (Figure 7a). Thin black lines (in Figure 5) correspond to successive map contours of the shelf. Three colors display the growth history of the continental shelf: (i) brown corresponds to the last depositional episode in each snapshot, (ii) yellow and orange represent the two main growth periods prior and after frontal rupture, respectively.
Shelf Breaks and Transfer Zones
The shelf contours show two main trends. One is almost parallel to the extensional structures and corresponds to the shelf break strictly speaking (i.e., normal faults; see Figure 7a). The other one is almost parallel to the direction of salt flow and corresponds to a lateral offset of the shelf break. To the right side of contours trending parallel to salt flow, the shelf is stabilized as demonstrated by the absence of normal faults at surface indicating that the underlying salt stopped flowing. The left side displays normal faults indicating that underlying salt is still flowing. Therefore, these contours parallel to the displacement correspond to transfer zones–i.e., zones that connect two shelf breaks and that transfer extension from one to the other. It is noteworthy that at whole model-scale they trend parallel or nearly parallel to the direction of salt flow.
History of Shelf Growth
Figure 8 shows shelf break migration along two profiles (red and yellow dots) and advance of the deforming system front (blue dots), including frontal rupture.
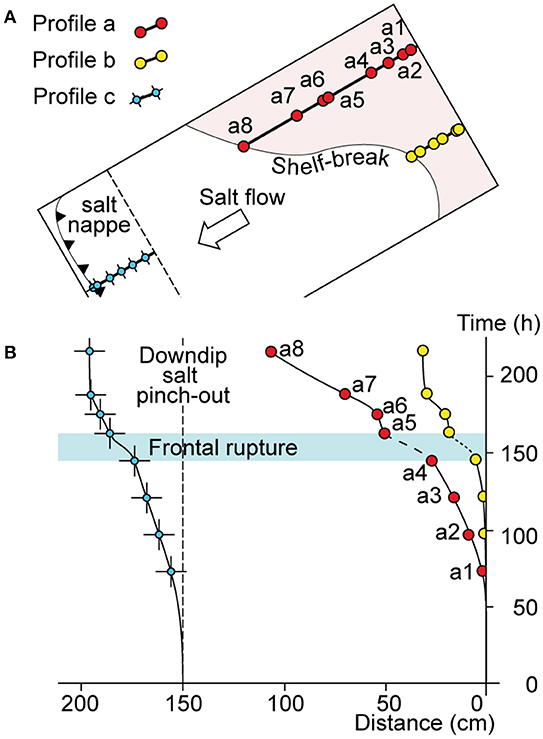
Figure 8. Relation between shelf break migration along two profiles (red and yellow dots) and advance of the deforming system front (blue dots) in the model. (A) Model top view with location of profiles. (B) Shelf migration profiles and displacement of deforming system front.
Prior to frontal rupture, the sand layer at deforming system front underwent thrusting and folding, giving a complex imbrication of sand and silicone (72 h in Figure 5). This frontal shortening ultimately lead to the emergence at surface of a continuous silicone layer that allowed acceleration of the process (i.e., “Frontal rupture” at 144 h in Figure 5). During this first period shelf break migration was faster where sedimentation rate was higher (red dots a1 to a4 in Figure 8B). An acceleration of shelf break migration in both model sides (red and yellow dots) occurs during frontal rupture.
Frontal displacement being limited by the apparatus length, it is unfortunately not possible to follow shelf growth long after frontal rupture. However, on model right side (red dots) shelf break continued to migrate, even faster than before frontal rupture. This intriguing effect results from the interaction between high sedimentation rate and stop of model front displacement that inhibits silicone flow (see last sub-section of section Deformation History). Interestingly, this shows that if salt is still present but unable to flow due to boundary conditions a shelf can stabilize and grow.
Progressive Rotation of the Overall Shelf Envelope
The shelf started to develop prior to frontal rupture (96 h −144 h in Figure 5) but it is only after this major change in the system dynamics that shelf growth became really significant. The overall shelf envelope that integrates both normal faults and transfer zones displays a trend that started parallel to the mean trend of normal faults and that progressively rotated counter-clockwise to become almost perpendicular to the direction of sediment supply–i.e., parallel to the front of synkinematic sedimentary wedge (see the progressive evolution from 144 to 215 h in Figure 5). This indicates (i) that deformation played a major role on shelf development at early stages when the gravity potential driving salt tectonics was maximum and (ii) that, as the gravity potential progressively reduced, salt flow velocity progressive decreased, whereas the rate of sedimentation remained constant. In other words, the shelf envelope trend became progressively more influenced by the direction of sediment supply. However, even at the latest stages (e.g., 187–215 h in Figure 5), when the influence of sedimentation became stronger, transfer faults still remained parallel to salt flow direction.
Transfer Zones: A Tool For Kinematic Analysis In Salt Tectonics
The laboratory experiment presented in this paper provides, for the first time, a mechanical basis to explain how transfer zones develop during the growth of a continental shelf at a salt margin. The experimental model confirmed the conceptual model of Fort and Brun (2012) that was developed only from available data sets in the northern Gulf of Mexico (Figure 1C).
It is interesting to compare the transfer zones that develop during shelf growth in a salt basin to transform faults that offset oceanic spreading centers (Figure 9). At a spreading center, the transform fault whose active part is located between two oceanic rifts provides the direction of displacement between the two separating plates (Wilson, 1965; Morgan, 1968). The segments of transform faults that became inactive are recorded in the oceanic crust outside the active ridge. Their changes of direction are records of previous directions of plate displacement. Similarly, in salt tectonics, the transfer zones offset the shelf break that separates an active domain where salt is still flowing from a stable shelf domain below which salt has stopped flowing. Like transform faults in plate tectonics, the transfer zones that develop during shelf growth give the direction of displacement between the inactive and active domains–i.e., the direction of salt flow. The transfer zones that became inactive are fossilized in the continental shelf and therefore provide a record of changes in the direction of salt flow during shelf break migration.
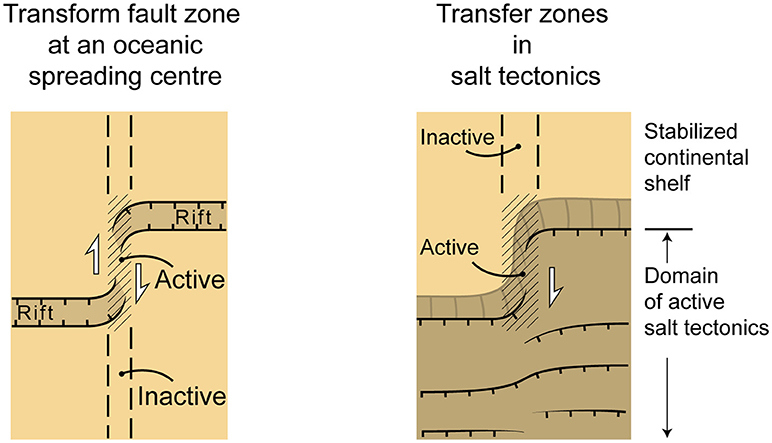
Figure 9. Comparison between the offset (i) of an oceanic spreading ridge by a transform fault (left) and (ii) of a shelf break by a transfer zone in salt tectonics (right).
In conclusion, the transfer zones that participate to the shaping of a continental shelf provide a precious tool for mapping the direction of salt flow and its variations in space and time at basin scale.
Discussion: Comparison Between Model and Northern Gulf Of Mexico
Whereas, the model presented above did not intend to directly model the northern Gulf of Mexico, several structural and kinematic features of the model are directly comparable to the tectonic evolution of the northern Gulf of Mexico. They can be summarized in three main points.
Transfer Zones in the Shelf as Markers of the Salt Flow Direction
As exemplified by the model and already mentioned in the previous section, transfer zones that develop during shelf growth are excellent markers of the salt flow direction that can be used for kinematic analysis in salt tectonics.
Fort and Brun (2012) interpreted the irregular contours of the depositional episodes mapped in the continental shelf of the northern GoM (Galloway et al., 2000) as a shelf break offset by transfer zones indicating a regional NE-SW trending direction of salt flow (Figures 1, 2). This interpretation is supported by the similar NE-SW trend of the stretching directions deduced from the kinematic analysis of structures observed on the bathymetric map in the nearby slope and deep basin.
Frontal Rupture at Salt Basin Edge and Onset of Fast Shelf Growth
The model exemplifies that fast shelf growth started after frontal rupture and subsequent formation of a salt nappe close to the downdip salt pinchout (Figures 5, 7c, 8). With the release of salt flow at basin front, the whole salt basin became submitted to extension creating favorable conditions, through salt flow and thinning, to stabilize synkinematic sediments and shelf growth.
A very similar sequence of events occurred in the northern GoM. The onset of fast shelf break migration that occurred around the Oligocene-Miocene boundary (Figure 3) was contemporaneous to the formation of a salt nappe (in Keathley Canyon; KC in Figure 2) displacing toward the SW (Fort and Brun, 2012).
Interaction Between Sedimentation and Salt Flow
The model shows that the migration rate of the shelf break is a direct function of synkinematic sediment accumulation: faster in areas of thick sedimentation than in areas of thin sedimentation. As a direct consequence, the overall envelope of the shelf contour underwent a counterclockwise rotation from perpendicular to strongly oblique to the direction of salt flow at early stages toward perpendicular to the direction of sediment supply at late stages (Figure 5).
The step-by-step evolution of the shelf break migration in the GoM displays a comparable kinematic pattern (Figure 3). The overall envelope of the shelf contour that was trending WNW-ESE trend, strongly oblique to the mean NE-SW salt flow direction, at 12 Ma progressively rotated toward an EW trend, almost perpendicular to the direction of sediment supply at 3.1 Ma (Figure 10). In the GoM, like in the model and like in almost all salt tectonic systems, the gravity potential progressively reduced with time. But, at variance with the model, the flux of sediments in the GoM did not remain constant but even significantly increased since late Miocene-Pliocene (Galloway et al., 2000) increasing the effect of sediment supply in the observed rotation of the shelf break envelope.
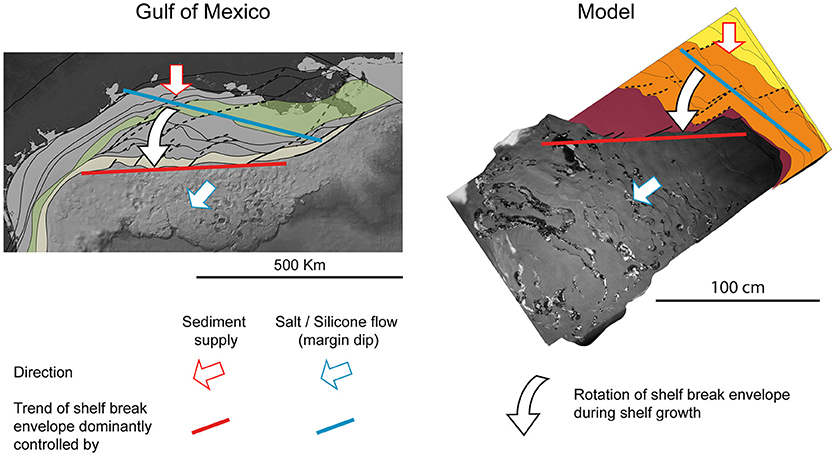
Figure 10. Counterclockwise rotation of the shelf envelope in the Gulf of Mexico and in the model. The rotation results from the interaction between salt flow whose rate reduces with time and sediment supply whose rate is either constant (model) or increasing with time (Gulf of Mexico). Whereas, the role of salt flow decreases with time, transfer zones remain parallel to salt flow.
In both model and GoM, even at late stages of shelf growth, the transfer zones are still controlled by the direction of salt flow. This indicates that in the GoM like in the model, even if the accumulation of sediments strongly influences the system response, the main driving force remains the salt flow.
Applicability to Other Salt Margins
It is the obliquity between trends of salt flow and sediment supply observed in the GoM (Fort and Brun, 2012) that motivated the experimental approach presented here. In other salt margins of our knowledge, salt flow and sediment supply are in general parallel or close to parallel as in salt margins of South Atlantic (e.g., Angola: Fort et al., 2004a; Hudec and Jackson, 2004; Brazil: Mohriak et al., 2012; Kukla et al., 2018). In these margins, some geological features indicate significant amounts of shelf break migration controlled by salt tectonics but no specific study of shelf growth in relation with salt tectonics is available. The inner Kwanza basin of Angolan margin shows that the coastline displaced seaward of up to 130 km (see map of Figure 1, Hudec and Jackson, 2004) since middle Miocene (see cross-section restoration in Figures 9F–I, Hudec and Jackson, 2004) during an extreme thinning of the basal salt layer. Along the Brasil margin, cross sections (Figure 6 in Kukla et al., 2018) show that in the North, in the Espirito Santo Basin, the shelf break, whose location is controlled by a basement fault, has not migrated whereas southward, in the southern Campos Basin and central Santos Basin, the shelf break has migrated between 50 and 100 km.
Even if salt flow and sediment supply are parallel, it cannot be excluded that in such margins transfer zones could develop during shelf migration due lateral variations in the rock pile like, for example, variations of salt thickness along margin strike that can be responsible for lateral differences in rates of salt flow. But this remains to be documented.
To our knowledge the dynamics of shelf growth in salt basins has never been considered to bring an additional understanding of salt tectonics. The GoM as well as the above lines of evidence suggest that it could be extremely informative to systematically carry out an analysis of shelf growth in salt margins as it provides a fine recording of the history of salt basin dynamics.
Conclusions
Laboratory modeling of shelf growth at a salt margin and comparison with the northern Gulf of Mexico leads to the following conclusions:
1. In a basin affected by salt tectonics, the growth of a continental shelf is controlled by salt layer thinning that strongly reduces with ongoing basin updip extension and can even stop further salt flow.
2. The shelf break corresponds to a normal fault or a series of normal faults trending perpendicular to the direction of salt flow. It separates an updip domain in which salt has stopped flowing, or that still flows but at very low strain rates, from a downdip domain of active salt tectonics. The migration of a shelf break records the overall downdip flow of salt at basin scale.
3. In salt tectonic systems, in which the direction of sediment supply is oblique to the salt flow direction, the shelf break is offset by transfer zones parallel or close to parallel to salt flow. Therefore, transfer zones that participated to the shaping of a continental shelf provide a precious tool to map the direction of salt flow and its variations in space and time.
4. During long-term growth of a continental shelf, in a basin where sediment supply is oblique to salt flow, the overall shelf envelope undergoes a rotation from almost perpendicular to the direction of salt flow at early stages toward perpendicular to the direction of sediment supply at late stages. This rotation occurs because with time (i) the potential of gravity driven salt tectonics decreases (i.e., salt flow) and (ii) the sediment supply either remains constant or increases. However, even at late stages of shelf growth, transfer zones are still controlled by the direction of salt flow. In other words, whereas the accumulation of sediments strongly influences the system response, salt flow remains the dominant driving force.
From a general point of view, it is worth emphasizing that both model experiment and natural system, studied in this work, exemplify for the first time that continental shelves developing at salt margins provide a fine recording of basin-scale salt tectonics events, in terms of timing and bulk kinematics.
Author Contributions
J-PB and XF conceived the modeling procedure and ran the experiments, discussed the results, and shared the writing of the paper.
Funding
This work has been carried out in the frame of a consulting contract between g.o. logical consulting and Equinor (previously Statoil).
Conflict of Interest Statement
The authors declare that the research was conducted in the absence of any commercial or financial relationships that could be construed as a potential conflict of interest.
Acknowledgments
We are extremely grateful to Equinor (previously Statoil) for support throughout the years, freedom of action, access to data and positive interactions with numerous people in Houston and Oslo. We address our special thanks to R. Hunsdale and E. Blanc for numerous discussions and help at various stages of this work. Great thanks to the two reviewers Luis E. Lara and Frank Strozyk whose remarks and suggestions help improve the paper.
References
Adam, J., Ge, Z., and Sanchez, M. (2012). Post-rift salt tectonic evolution and key control factors of the Jequitinhonha deepwater fold belt, central Brazil passive margin: insights from scaled physical experiments. Mar. Petrol. Geol. 37, 70–100. doi: 10.1016/j.marpetgeo.2012.06.008
Berggren, W. A., Kent, D. V., Swisher, C. C., and Aubry, M. P. (1995). “A revised Cenozoic geochronology and chronostratigraphy,” in Geochronology, Time Scales and Global Stratigraphic Correlation, eds W. A. Berggren, D. V. Kent, M. P. Aubry, and J. Hardenbol (Tulsa, OK: Society for Sedimentary Geology, Special Publications), 129–212.
Brun, J. P. (1999). Narrow rifts versus wide rifts: inferences for the mechanics of rifting from laboratory experiments. Philos. Transact. R. Soc. 357, 695–712. doi: 10.1098/rsta.1999.0349
Brun, J. P., and Fort, X. (2011). Salt tectonics at passive margins: geology versus models. Mar. Petrol. Geol. 28, 1123–1145. doi: 10.1016/j.marpetgeo.2011.03.004
Carvajal, C., Steel, R. J., and Petter, A. (2009). Sediment supply: the main driver of shelf margin growth. Earth Sci. Rev. 96, 221–248. doi: 10.1016/j.earscirev.2009.06.008
Dokka, R. K., Sella, G. F., and Dixon, T. H. (2006). Tectonic control of subsidence and southward displacement of southeast Louisiana with respect to stable North America. Geophys. Res. Lett. 33:L23308. doi: 10.1029/2006GL027250
Dooley, T. P., Jackson, M. P. A., and Hudec, M. R. (2007). Initiation and growth of salt-based thrust belts on passive margins: results from physical models. Basin Res. 19, 165–177. doi: 10.1111/j.1365-2117.2007.00317.x
Engelkemeir, R., Khan, S. D., and Burke, K. (2010). Surface deformation in Houston, Texas using GPS. Tectonophysics 490, 47–54. doi: 10.1016/j.tecto.2010.04.016
Fort, X., and Brun, J. P. (2012). “Kinematics of regional salt flow in the northern Gulf of Mexico,” in Salt Tectonics, Sediments and Prospectivity, eds G. I. Alsop, S. G. Archer, A. J. Hartley, N. T. Grant, and R. Hodgkinson (London: Geological Society; Special Publication), 265–287. doi: 10.1144/SP363.12
Fort, X., Brun, J. P., and Chauvel, F. (2004a). Salt tectonics on the Angolan margin, synsedimentary deformation processes. Bull. Amer. Assoc. Petrol. Geol. 88, 1523–1544. doi: 10.1306/06010403012
Fort, X., Brun, J. P., and Chauvel, F. (2004b). Contraction induced by block rotation above salt. Mar. Petrol. Geol. 21, 1281–1294. doi: 10.1016/j.marpetgeo.2004.09.006
Galloway, W. E. (2001). Cenozoic evolution of sediment accumulation in deltaic and shore-zone depositional systems, northern Gulf of Mexico Basin. Mar. Petrol. Geol. 18, 1031–1040. doi: 10.1016/S0264-8172(01)00045-9
Galloway, W. E., Ganey-Curry, P. E., Li, X., and Buffler, R. T. (2000). Cenozoic depositional history of the Gulf of Mexico basin. Bull. Amer. Assoc. Petrol. Geol. 84,1743–1774. doi: 10.1306/8626C37F-173B-11D7-8645000102C1865D
Helland-Hansen, W., Steel, R. J., and Sømme, T. O. (2012). Shelf genesis revisited. J. Sediment. Res. 82, 133–148. doi: 10.2110/jsr.2012.15
Hubbert, M. K. (1937). Theory of scale models as applied to the study of geologic structures. Bull. Geol. Soc. Am. 48, 1459–1520. doi: 10.1130/GSAB-48-1459
Hudec, M., and Jackson, M. P. A. (2004). Regional restoration across the Kwanza Basin, AngolaSalt tectonics triggered. Bull. Amer. Assoc. Petrol. Geol. 88, 971–990. doi: 10.1306/02050403061
Kukla, P. A., Strozyk, F., and Mohriak, W. U. (2018). South Atlantic salt basins–witnesses of complex passive margin evolution. Gondwana Res. 53, 41–57. doi: 10.1016/j.gr.2017.03.012
Lymer, G., Vendeville, B. C., Gaullier, V., Chanier, F., and Gaillard, M. (2018). Using salt tectonic structures as proxies to reveal post-rift crustal tectonics: the example of the Eastern Sardinian margin (Western Tyrrhenian Sea). Mar. Petrol. Geol. 96, 214–231. doi: 10.1016/j.marpetgeo.2018.05.037
Mauduit, T., Guerin, G., Brun, J. P., and Lecanu, H. (1997). Raft tectonics: the effects of basal slope value and sedimentation rate on progressive extension. J. Struct. Geol. 19, 1219–1230. doi: 10.1016/S0191-8141(97)00037-0
Mohriak, W. U., Szatmari, P., and Anjos, S. (2012). “Salt: geology and tectonics of selected Brazilian basins in their global context,” in Salt Tectonics, Sediments and Prospectivity, Vol. 363, eds G. I. Alsop, S. G. Archer, A. J. Hartley, N. T. Grant, and R. Hodgkinson (London: Geological Society; Special Publication), 131–158. doi: 10.1144/SP363.7
Morgan, W. J. (1968). Rises, trenches, great faults, and crustal blocks. J. Geophys. Res. 73, 1959–1982. doi: 10.1029/JB073i006p01959
Posamentier, H. W., Jervey, M. T., and Vail, P. R. (1988). “Eustatic controls on clastic deposition: I, conceptual framework,” in Sea-Level Changes: An Integrated Approach, eds C. K. Wilgus, B. S. Hastings, C. A. Ross, H. W. Posamentier, J. Van Wagoner, and C. G. St.C. (Kendall, FL: Special Publication), 109–124. doi: 10.2110/pec.88.01.0109
Steckler, M. S., Mountain, G. S., Miller, K. G., and Christie-Blick, N. (1999). Reconstruction of tertiary progradation and clinoform development on the New Jersey passive margin by 2-D backstripping. Mar. Geol. 154, 399–420. doi: 10.1016/S0025-3227(98)00126-1
Steel, R. J., Carvajal, C., Petter, A., and Uroza, C. (2008). “The growth of shelves and shelf margins,” in Recent Advances in Shallow-Marine Stratigraphy; Perspectives and Applications, eds G. J. Hampson, R. J. Steel, P. M. Burgess, and R. W. Dalrymple (Tulsa, OK: SEPM, Special Publication), 47–71.
Swift, D. J. P., and Thorne, J. A. (1991). “Sedimentation on continental margins l: a general model for shelf sedimentation,” in Shelf Sand and Sandstone Bodies, eds D. J. P. Swift, G. F. Oertel, R. W. Tillman, and J. A. Thorne (Oxford: International Association of Sedimentologists; Special Publication), 199–219.
Weijermars, R., Jackson, M. P. A., and Vendeville, B. (1993). Rheological and tectonic modeling of salt provinces. Tectonophysics 217, 143–174. doi: 10.1016/0040-1951(93)90208-2
Keywords: continental shelf, salt margin, salt tectonics, laboratory modeling, Gulf of Mexico
Citation: Brun J-P and Fort X (2018) Growth of Continental Shelves at Salt Margins. Front. Earth Sci. 6:209. doi: 10.3389/feart.2018.00209
Received: 29 June 2018; Accepted: 31 October 2018;
Published: 19 November 2018.
Edited by:
Christoph Von Hagke, RWTH Aachen Universität, GermanyCopyright © 2018 Brun and Fort. This is an open-access article distributed under the terms of the Creative Commons Attribution License (CC BY). The use, distribution or reproduction in other forums is permitted, provided the original author(s) and the copyright owner(s) are credited and that the original publication in this journal is cited, in accordance with accepted academic practice. No use, distribution or reproduction is permitted which does not comply with these terms.
*Correspondence: Jean-Pierre Brun, amVhbi1waWVycmUuYnJ1bkB1bml2LXJlbm5lczEuZnI=