 Rachel M. Wilson1*
 Rebecca B. Neumann2*Kelsey B. Crossen3Nicole M. Raab3Suzanne B. Hodgkins3Scott R. Saleska4Ben Bolduc3
 Ben J. Woodcroft5
 Gene W. Tyson5Jeffrey P. Chanton1
 Virginia I. Rich3
- 1Department of Earth, Ocean and Atmospheric Science, Florida State University, Tallahassee, FL, United States
- 2Department of Civil and Environmental Engineering, University of Washington, Seattle, WA, United States
- 3Department of Microbiology, The Ohio State University, Columbus, OH, United States
- 4Department of Soil, Water, and Environmental Science, The University of Arizona, Tucson, AZ, United States
- 5Australian Centre for Ecogenomics, School of Chemistry and Molecular Biosciences, The University of Queensland, Brisbane, QLD, Australia
The mechanisms, pathways, and rates of CO2 and CH4 production are central to understanding carbon cycling and greenhouse gas flux in wetlands. Thawing permafrost regions are of particular interest because they are disproportionally affected by climate warming and store large reservoirs of organic C that may be readily converted to CO2 and CH4 upon thaw. This conversion is accomplished by a community of microorganisms interacting in complex ways to transform large organic compounds into fatty acids and ultimately CO2 and CH4. While the central role of microbes in this process is well-known, geochemical rate models rarely integrate microbiological information. Herein, we expanded the geochemical rate model of Neumann et al., (2016, Biogeochemistry 127: 57–87) to incorporate a Bayesian probability analysis and applied the result to quantifying rates of CO2, CH4, and acetate production in closed-system incubations of peat collected from three habitats along a permafrost thaw gradient. The goals of this analysis were twofold. First, we integrated microbial community analyses with geochemical rate modeling by using microbial data to inform the best model choice among equally mathematically feasible model variants. Second, based on model results, we described changes in organic carbon transformation among habitats to understand the changing pathways of greenhouse gas production along the permafrost thaw gradient. We found that acetoclasty, hydrogenotrophy, CO2 production, and homoacetogenesis were the important reactions in this system, with little evidence for anaerobic CH4 oxidation. There was a distinct transition in the reactions across the thaw gradient. The collapsed palsa stage presents an initial disequilibrium where the abrupt (physically and temporally) change in elevation introduces freshly fixed carbon into anoxic conditions then fermentation products build up over time as the system transitions through the acid phase and electron acceptors are depleted. In the bog, fermentation slows, while methanogenesis increases. In the fully thawed fen, most of the terminal electron acceptors are depleted and the system becomes increasingly methanogenic. This suggests that as permafrost regions thaw and dry palsas transition into wet fens, CH4 emissions will rise, increasing the warming potential of these systems and accelerating climate warming feedbacks.
Introduction
More than 1650 Pg of organic carbon (OC) is currently sequestered in boreal regions, where it is frozen in permafrost unavailable for microbial decomposition (Hugelius et al., 2013). Climate change—and the resulting warmer temperature—leads to permafrost thaw which makes previously stable OC available to microbial decomposition (Schädel et al., 2016). The decomposition of OC by microorganisms produces the greenhouse gasses CO2 and CH4, which can then escape to the atmosphere exacerbating warming effects in a positive feedback. However, the magnitude of C released and the relative proportion of each gas (which have very different radiative forcings) remains poorly constrained in global models, contributing to uncertainty in climate trajectories (Frolking et al., 2006). Constraining these rates is critical for improving global climate change models and requires understanding of the geochemical and microbiological controls on CO2 and CH4 production rates.
Stordalen Mire, Sweden, lies above the Arctic Circle, in the discontinuous permafrost zone, in a region that is disparately affected by climate warming (Kattsov et al., 2005). Indeed, recent studies have highlighted accelerated permafrost thaw within the mire which, over the recent decades, is visually observed as changes in habitat type, hydrology, and vegetation cover (Johansson et al., 2006; Kokfelt et al., 2009). The portions of Stordalen Mire peat that are underlain by intact permafrost are elevated as palsas which are populated by shrubs and woody vegetation. Upon thawing, the elevated palsas collapse and flood creating small thaw pools (Johansson et al., 2006). If these pools remain disconnected from the surrounding water table, the ingrowth of Sphagnum moss over time can elevate the collapse pool into an ombrotrophic Sphagnum bog. In some cases, the insulating effects of the Sphagnum cover can allow permafrost to reform, but further warming eventually causes further subsidence and flooding as the landscape falls to the level of the surrounding water table. Alternatively, thawing of palsa directly adjacent to a fen, or the rapid thawing of palsas surrounding a collapse pool, can connect the collapse feature to the surrounding water table before ingrowth of Sphagnum can occur. All of these processes ultimately lead to increasing minerotrophy as the site transitions into a poor and then a rich fen, leading to a shift in vegetation to sedges and other aquatic macrophytes, characteristic of fens (Zoltai, 1993; Vitt et al., 1994; Jorgenson et al., 2001; Malmer et al., 2005) (Figure 1).
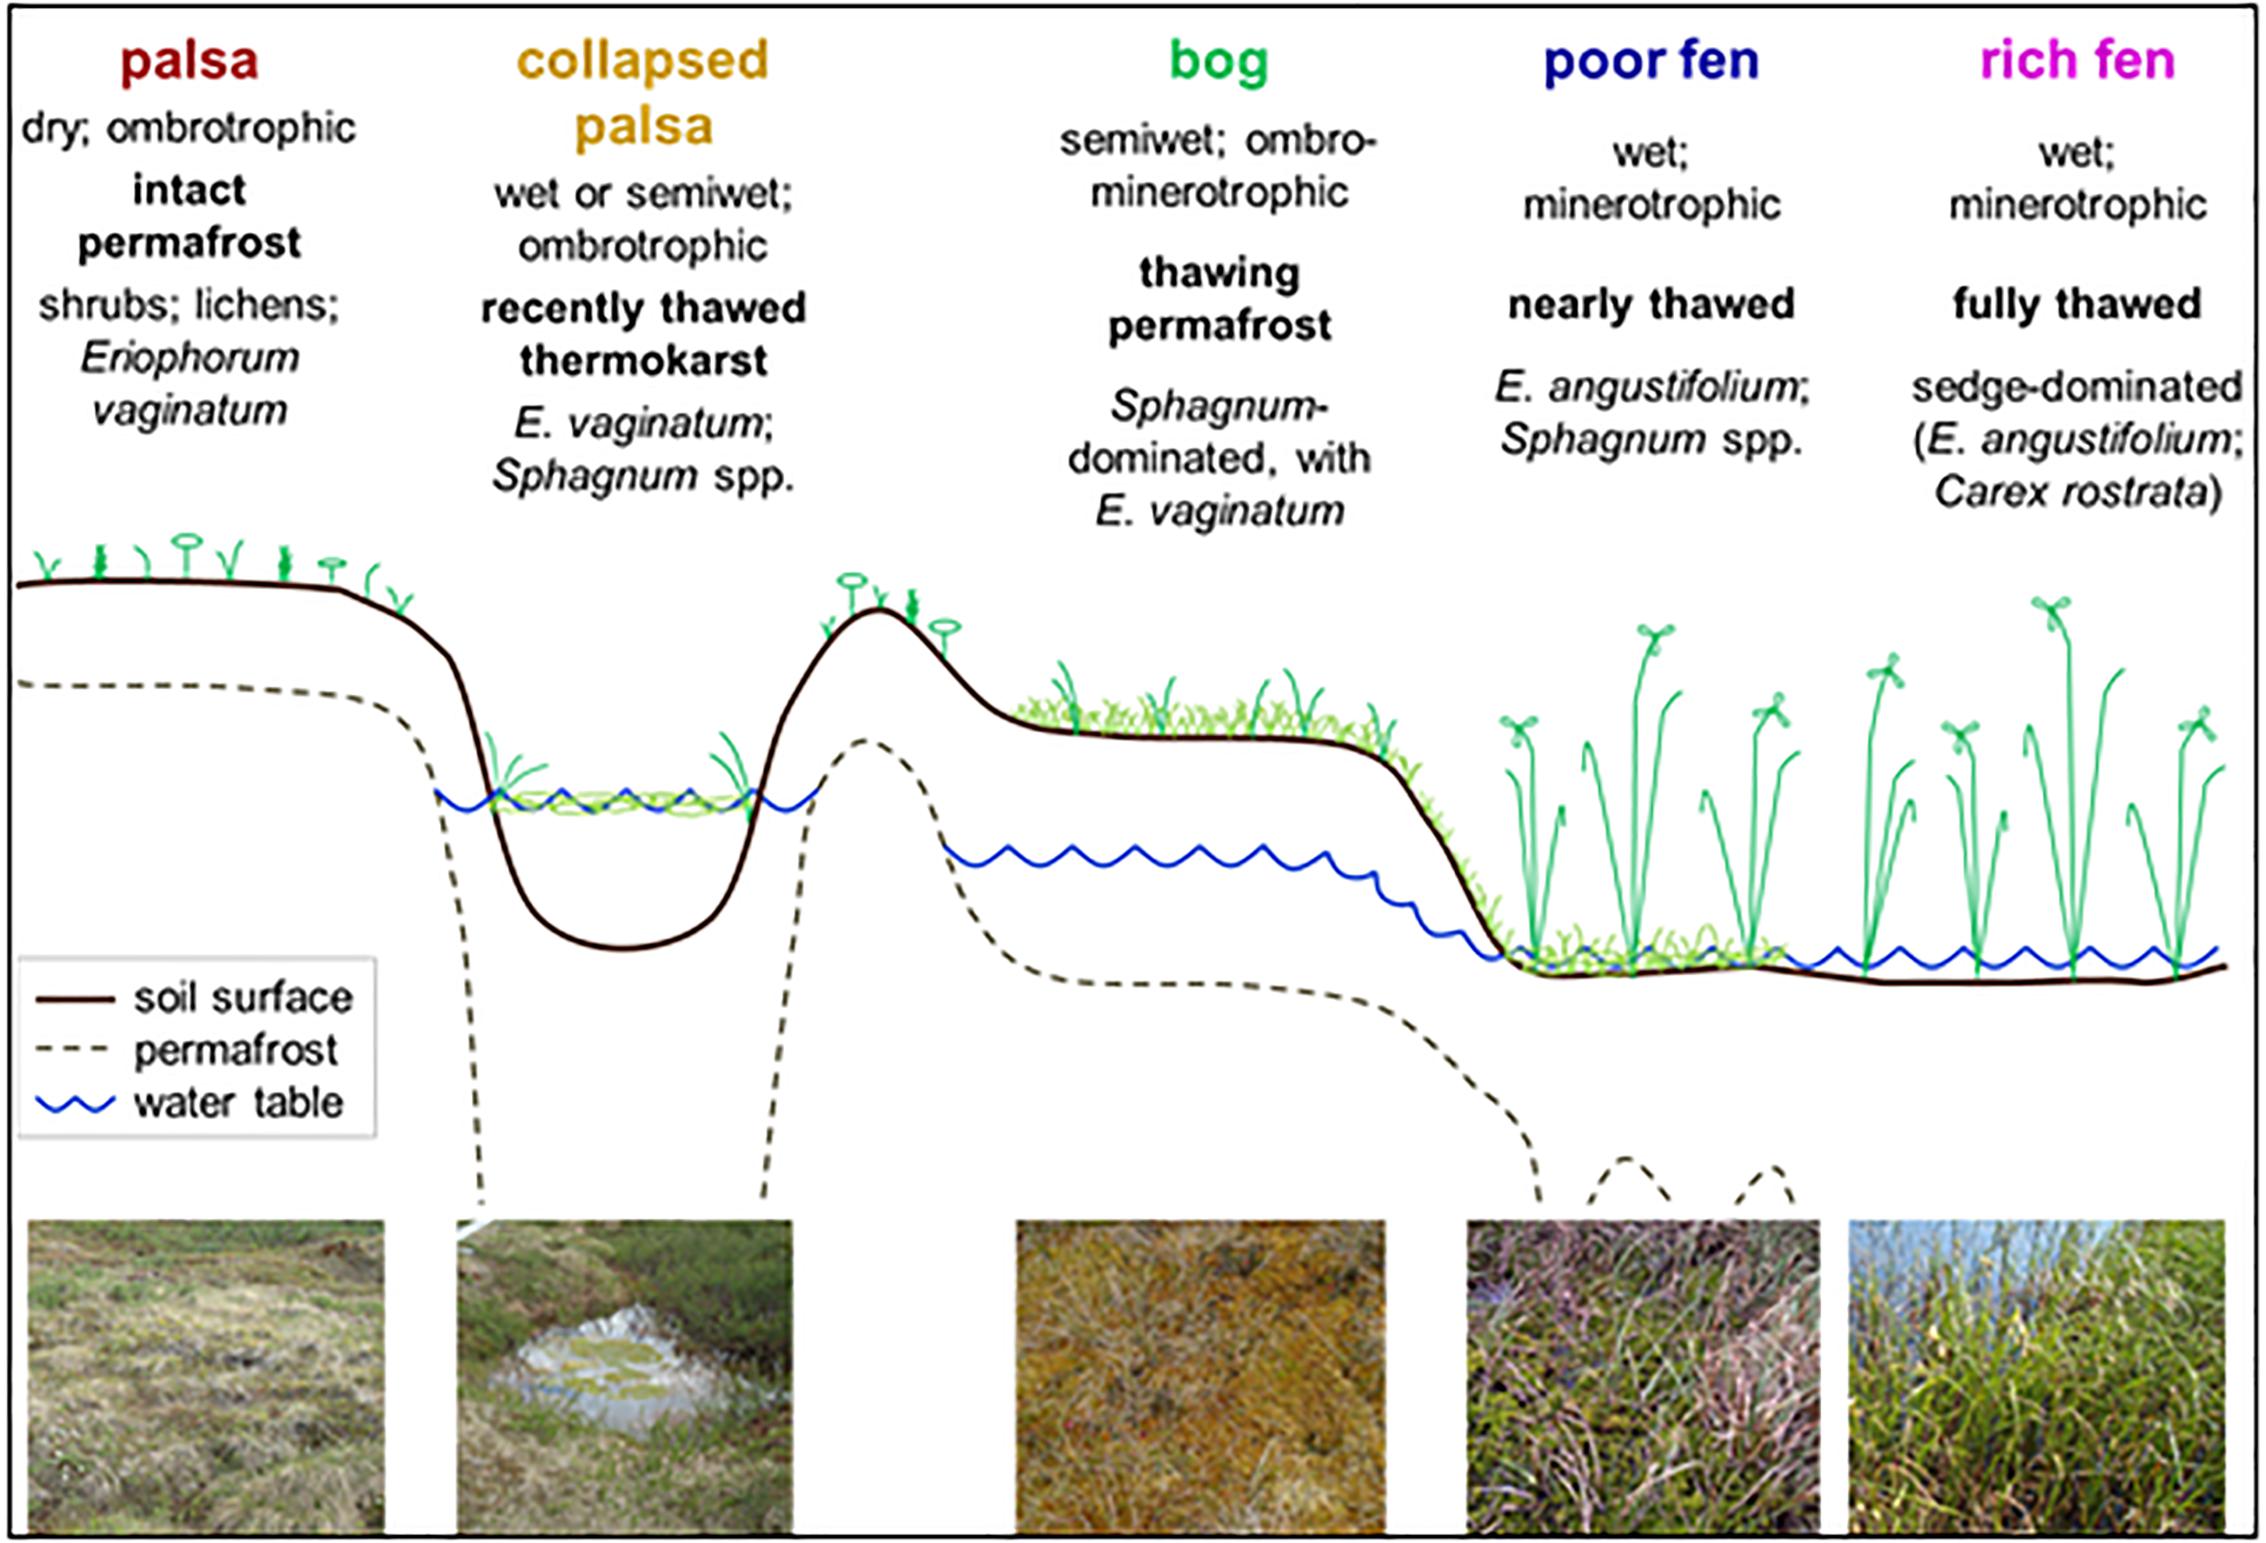
Figure 1. Schematic of the Stordalen chronosequence from the dry palsas sitting atop intact permafrost through recently thawed, inundated, collapse features, more mature, but drier, bogs and fully thawed inundated fens. This figure is from Hodgkins (2016) (used with permission).
Carbon (C) sequestration in peatlands occurs when net primary production (NPP), measured as CO2 uptake, exceeds net ecosystem respiration (NER), measured as CO2 and CH4 emission, forming mostly cellulosic peat (Clymo, 1987) that accumulates over millennia. In the palsas, dry frozen conditions result in low NPP and NER, such that C sequestration rates are generally low. Sphagnum is thought to produce lower quality litter than either the woody vegetation that precedes it in the thaw gradient or the graminoid vegetation that follows in the fully inundated sites (Malmer et al., 2005) and since low-quality litter contributes to low NER, areas with extensive Sphagnum coverage have the highest C sequestration rates. Fens, with their highly productive yet easily decomposable vascular plant vegetation, have the highest NPP in Stordalen Mire. Thus, across the thaw gradient there are large variations in NER, NPP, and C sequestration rates. Since the 1970s, the areal extent of Sphagnum carpet (combined moss hummocks, semiwet, and non-graminoid wet sites) in Stordalen Mire has declined (Malmer et al., 2005), coincident with overall wetter conditions and an increase in the areal extent of fen habitats (Kokfelt et al., 2009; Bäckstrand et al., 2010).
In addition to differences in NER and the quality of OC inputs, the gradient in habitat types created by thawing across the mire coincides with very different geochemical conditions under which OC is degraded. Cumulatively, these differences result in increasing total CO2 and CH4 production rates and decreasing CO2:CH4 ratios across the thaw gradient (McCalley et al., 2014; Hodgkins et al., 2015). In the relatively dry elevated palsas, O2 easily penetrates the top layer suppressing methanogenesis and oxidizing what little CH4 is produced before it can be emitted. The net result is that palsas are very weak net C sinks (Johansson et al., 2006) and may sometimes act as net C sources (Bäckstrand et al., 2010) due to interannual changes in precipitation or hydrology that result in wetter or dryer conditions (e.g., Euskirchen et al., 2012). The wetter conditions of the collapsed palsas and bogs allows some methanogenesis to occur, but rates are generally low compared to more fully thawed and inundated fens such that in the collapsed palsa and bogs CO2 production exceeds CH4 production (Hodgkins et al., 2014). The fully thawed, inundated conditions of the fen stimulate NPP, but also favor methanogenesis with the net result that these habitats emit nearly 1/3 of their net CO2 uptake as CH4 (Johansson et al., 2006).
The transition of an ecosystem between a net C sink and a net C source depends on the balance of NER:NPP, however, because of the higher climate forcing potential of CH4, a habitat that emits CH4 can exert net positive radiative forcing while still remaining a net C sink. CH4 has a shorter half-life than CO2 in the atmosphere and therefore net radiative forcing is timescale-dependent, but for humans that live on an ∼100-year timescale, CH4 forcing remains a relevant consideration. Even on shorter timescales, net radiative forcing could push the ecosystem past a threshold tipping point (e.g., Eppinga et al., 2009) which could have significant impacts including rapid and irreversible shifts in vegetation and landscape structure. Thus, the CO2:CH4 production ratio is an important consideration for understanding climate feedbacks with these systems (Frolking et al., 2006; Neubauer and Megonigal, 2015; Wilson et al., 2017a).
CO2 and CH4 production are mediated by complex microbial transformations that, thus far, are still poorly characterized because of their great diversity. For example, homoacetogenesis (i.e., acetate production via the acetyl-CoA pathway: 2CO2 + 4H2 → CH3COOH + 2H2O) (Diekert and Wohlfarth, 1994a,b; Drake et al., 2006) has typically been considered negligible in peatlands (Megonigal et al., 2004; Drake et al., 2006; Tveit et al., 2015) in part because hydrogenotrophic methanogens are thought to outcompete homoacetogens for H2 substrate under the anaerobic conditions of the peat catotelm (Lovley and Klug, 1983; Jones and Simon, 1985; Hoehler et al., 1999). Recently, however, significant homoacetogenesis rates have been measured in incubations of bog peat suggesting that this pathway of CO2 consumption may be more important than previously considered (Ye et al., 2014). This may be especially true in cool boreal systems (<10°C) where the higher growth rates of homoacetogens compared to methanogens may allow them to successfully compete for substrate (Conrad et al., 1989; Conrad and Wetter, 1990; Kotsyurbenko et al., 1993, 1996, 2001; Nozhevnikova et al., 1994; Liu and Conrad, 2011). Although, Ye et al. (2014) measured appreciable homoacetogenesis rates via isotopic methods, an alternative explanation of their results is that isotopic exchange between 14CO2 and acetate (Eikmanns and Thauer, 1984) may have made it appear as if the microorganisms were incorporating CO2 into acetate at a greater rate than was actually occurring. In any case, homoacetogenesis only affects the ultimate CO2:CH4 production of the system if the produced acetate is not itself disproportionated into CO2 and CH4, but instead accumulates—which does occur in some habitats (Hines et al., 2008). If, on the other hand, the resulting acetate is disproportionated (equation 3), then the net overall reaction is equimolar production of CO2 and CH4:
With hydrogenotrophic methanogenesis as the sole H2 consumption mechanism (i.e., no homoacetogenesis) the set of reactions are:
(equation 1: fermentation)
(equation 2: hydrogenotrophic methanogenesis)
(equation 3: acetoclastic methanogenesis)
Sum of equations 1–3:
With homoacetogenesis as the sole H2 consumption mechanism (i.e., no hydrogenotrophy) the set of reactions are:
(equation 1: fermentation)
(equation 4: homoacetogenesis)
(equation 3: acetoclastic methanogenesis)
Sum of equations 1,4,3:
While it is generally thought that hydrogenotrophic methanogenesis will outcompete homoacetogenesis (except possibly at cooler temperatures, Ye et al., 2012), in cases where the processes do coexist, the equations may be written:.
(equation 1: fermentation)
(equation 2: hydrogenotrophic methanogenesis)
(equation 4: homoacetogenesis)
(equation 3: acetoclastic methanogenesis)
Sum of equations 1,2,3,4:
In each of these three cases, regardless of the reactions involved, the overall net result is the same: equimolar CO2 and CH4 production. However, because these processes fractionate the 13C in CO2 and CH4 to different degrees, the relative importance of these pathways to overall CO2 and CH4 production can influence interpretation of isotope-based mass balance models (e.g., Shoemaker and Schrag, 2010; Corbett et al., 2013, 2015; Neumann et al., 2016). Anaerobic decomposition begins with fermentation (which produces CO2) and proceeds through syntrophic reactions and then methanogenesis (which consumes CO2 while producing CH4). While fermentation does not isotopically fractionate the CO2 relative to the starting organic material, the net CO2 produced by the sum of fermentation followed by methanogenesis is fractionated. This fractionation occurs because both methanogenic CO2 reduction and acetate disproportionation to CO2 and CH4 experience a kinetic isotope effect (Whiticar, 1999). Production of 13C depleted CH4 leaves the remaining CO2 pool 13C enriched relative to the starting organic material (Corbett et al., 2012). Because in a purely methanogenic system, CO2 and CH4 are produced in equal proportions (Conrad, 1999), excess non-fractionated (relative to the starting organic material) CO2 production signifies the presence of alternative electron acceptors and that the system is not at methanogenic steady-state (e.g., continual addition of new bioavailable substrate, biomass production, or a time lag in response to product build-up). This stage is referred to as the acid phase in the waste decomposition literature (O’leary and Tchobanoglous, 2002) due to the high production of volatile fatty acids (VFAs) at this stage of decomposition. As the concentration of VFAs increase in the system, however, thermodynamic equilibrium shifts, increasingly favoring methanogenesis which draws down VFA concentrations until the system reaches a methanogenic steady-state balancing the production of VFAs by the production of CH4 to maintain favorable H2(aq). Differences in CH4 production pathways among the different thaw habitats in the mire may reflect different thermodynamic controls resulting from the changing geochemical conditions across the sites or perhaps changes in the microbial communities mediating these processes. Understanding the source of variation in reaction rates among the different habitats will be critical for modeling CO2 and CH4 production rates from thawing permafrost. To better understand these controls and predict their potential response to further warming, we integrated microbial community analyses with geochemical models to identify the important underlying mechanisms giving rise to CO2 and CH4 production dynamics and to calculate the rates and pathways of CO2 and CH4 production with transition across the thawing permafrost landscape. To accomplish this, we first characterized the rates, ratios and stable isotopic composition of CO2 and CH4 production in incubations of peat collected from habitats undergoing sequential stages of permafrost thaw. In parallel with these gas measurements, we also conducted microbial community profiling of the incubated peat. We then applied a reaction-network model to the CO2 and CH4 measurements in these incubations and used changes in the microbial community composition over time to inform our choice of the best model to describe changes in OC decomposition with increasing thaw maturity.
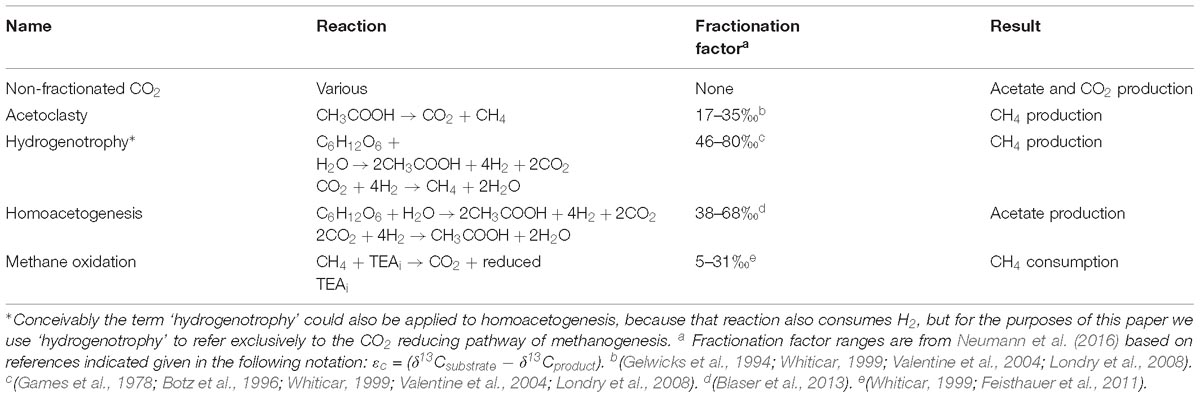
Table 1. Five reactions explicitly considered in rate modeling.
Materials and Methods
Peat Collection and Incubation
Peat was collected from three sites spanning the thaw gradient at Stordalen Mire, Sweden (68.35° N, 19.05° E): collapsed palsa, bog, and fen habitat types. These sites correspond with the sites named “PHB” (collapsed palsa); “S,” “Sphagnum,” or “Bog” (bog); and “E,” “Eriophorum,” or “Fen” (fen) in previous studies at this site (Hodgkins et al., 2014, 2015; McCalley et al., 2014; Mondav et al., 2014; Emerson et al., 2018; Singleton et al., 2018; Woodcroft et al., 2018). Peat (320 g) was collected from each of 8–18 cm and 28–38 cm in the collapsed palsa and bog sites, and from 8 to 18 cm in the fen site. It was not possible to recover peat from deeper in the fen site at the time of sampling because of limitations in the coring device. Peat was stored at 2°C in plastic resealable bags for approximately 4 months before initiation of the incubation experiments. Previous work in our lab demonstrates that incubations of peat treated in this way largely reflect the geochemical and microbiological conditions of the field at the scale of interest in this study and are, therefore, an excellent proxy for studying the controls on CO2 and CH4 dynamics under controlled conditions (Hodgkins et al., 2015; Holmes et al., 2015).
Incubations were conducted at 18°C following previously established protocols (Corbett et al., 2013; Hodgkins et al., 2014, 2015; Tfaily et al., 2014; Holmes et al., 2015; Wilson et al., 2017b). Briefly, peat from each site/depth combination was gently homogenized by hand and then peat was divided into eight separate serum vials (40 g peat in each of 125 mL vials) to make replicates for each incubation experiment. 40 mL of degassed, distilled water was added to each incubation vial and then the vials were sealed with a gas-tight pierceable septum. Each vial was flushed with pure N2 until the headspace measured <0.5% CO2 via GC-FID. Vials were then pre-incubated in the dark for 25 days to allow reduction of any oxidized species created during the sampling and handling of the peat. After 25 days the vials were again flushed with pure N2 until the headspace measured <0.5% CO2. This procedure has been previously shown to be effective at reducing any oxidized species created during the sampling and handling of the peat that could potentially act as terminal electron acceptors, thus ensuring anaerobic methanogenic conditions (Ye et al., 2012). After the second N2 flush, the incubation experiments were considered to have started and this time point constituted day 0 of the incubation experiments described in this study. CO2 and CH4 concentrations were measured daily by GC-FID coupled to a methanizer for the first 5 days until CH4 concentrations were high enough to be measured simultaneously with isotopic composition via a Delta V Finnegan isotope ratio mass spectrometer. Then isotopes and concentrations for both CO2 and CH4 were collected approximately every 3–5 days for the 50-day duration of the experiment. Since sample sizes for direct injections were 50–250 μL out of the total 45 mL headspace (i.e., <1%) we did not do any gas replacement. CO2 and CH4 concentrations were calculated using the respective temperature-corrected Henry’s Law constant to account for dissolved as well as headspace components. Replicates were sacrificed on days 0, 25, and 50 and peat from those replicates was stored in LifeGuard (MoBio) at −80°C for subsequent microbial community analyses.
Isotope Modeling
For the modeling, we built upon the conceptual reaction network rate model of Neumann et al. (2016) to calculate reaction rates in our incubations. The Neumann et al. (2016) model quantifies reaction rates from changes in the concentrations and stable carbon isotopes of CO2 and CH4 resulting from the microbial transformations taking place (Shoemaker and Schrag, 2010; Corbett et al., 2012, 2015; Shoemaker et al., 2012; Holmes et al., 2015; Neumann et al., 2016). During C transformation, microorganisms preferentially use the lighter isotope form leaving behind substrate that is increasingly enriched in the heavy isotope. The extent of the isotopic fractionation between substrates and products varies among the different biochemical pathways. There is little to no fractionation between organic C substrates and anaerobic fermentation or respiration products (Lapham et al., 1999), but the fractionation between CO2 and CH4 can be as much as 80‰ depending on the reactions mediating the transformation (Whiticar, 1999). To estimate microbial rates using temporal changes in the stable C isotope ratio (δ13C) of CH4 and CO2, we considered five possible anaerobic reactions for OC transformation (Table 1). Table 1 provides a list of the modeled reactions as well as the fractionation factors associated with the reactions that we used in the modeling. We modeled the rates of acetoclastic methanogenesis, hydrogenotrophic methanogenesis, non-fractionated CO2 production (i.e., CO2 resulting from respiration, biomass increase, fermentation, or other non-fractioning mechanism), methane oxidation, and homoacetogenesis in each of the incubations over time and leaving out fugitive CH4 since the closed incubations did not allow gasses to escape.
Expanding on Neumann et al. (2016), we took a Bayesian approach to specifying parameter values and estimating microbial rates from temporal changes in CO2, CH4, δ13C-CO2, and δ13C-CH4 data from the incubations. More than one million Monte Carlo simulations were performed with varying reaction rates (0–5,000 μmol L−1 day−1) and C fractionation factors (ranges given in Table 1) for each time point during each incubation. Initially, the entire listed ranges of reaction rates and fractionation factors were randomly sampled using a uniform distribution across the range. The likelihood of each parameter combination was then calculated by comparing simulated concentrations and isotopic composition to those measured, assuming measurement errors were normally distributed. Likelihood values were used to calculate the joint probability of the simulation describing the data. The probability of each simulation was normalized by the sum of probabilities from all one million simulations, giving each simulation a normalized value between zero and one. Initially, when the entire range of parameter values (rates and fractionation values) were sampled, only a few simulations accounted for over 99% of the normalized probability, indicating that the parameter ranges were too wide to fully probe with one million simulations. In this instance, ranges for rates and fractionation factors were reduced to the minimum and maximum value associated with parameter values in the 1,000 simulations that had the highest probability, regardless of how low the normalized probability value actually was for those simulations. One million additional Monte Carlo simulations were then performed sampling from the more constrained rate and fractionation factor ranges. This process was continued until there were at least 100 simulations that made up 99% of the normalized probability. Results from these ≥100 simulations were used generate probability distributions for the microbial rate values.
We modeled the incubation data using four variants of the rate model (Figure 2), leaving out various combinations of reactions to evaluate the effect these changes to the reaction network would have on (1) the ability of the model to converge (i.e., find a solution) and (2) the final rate estimations. In the first variant, we included all five reactions (acetoclasty, hydrogenotrophy, non-fractionated CO2 production, CH4 oxidation, and homoacetogenesis) representing the most complex plausible reaction network. In the second modeling variant, we constrained the CH4 oxidation rate to be zero and only allowed non-fractionated CO2 production, hydrogenotrophy, acetoclasty, and homoacetogenesis. In the third modeling variant we constrained the homoacetogenesis rate to zero and only allowed non-fractionated CO2 production, hydrogenotrophy, acetoclasty, and CH4 oxidation. In the final modeling variant, we constrained both the CH4 oxidation and homoacetogenesis rates to zero and only allowed non-fractionated CO2 production, hydrogenotrophy, and acetoclasty in the model. This final model represents the simplest plausible reaction network (e.g., Corbett et al., 2013).
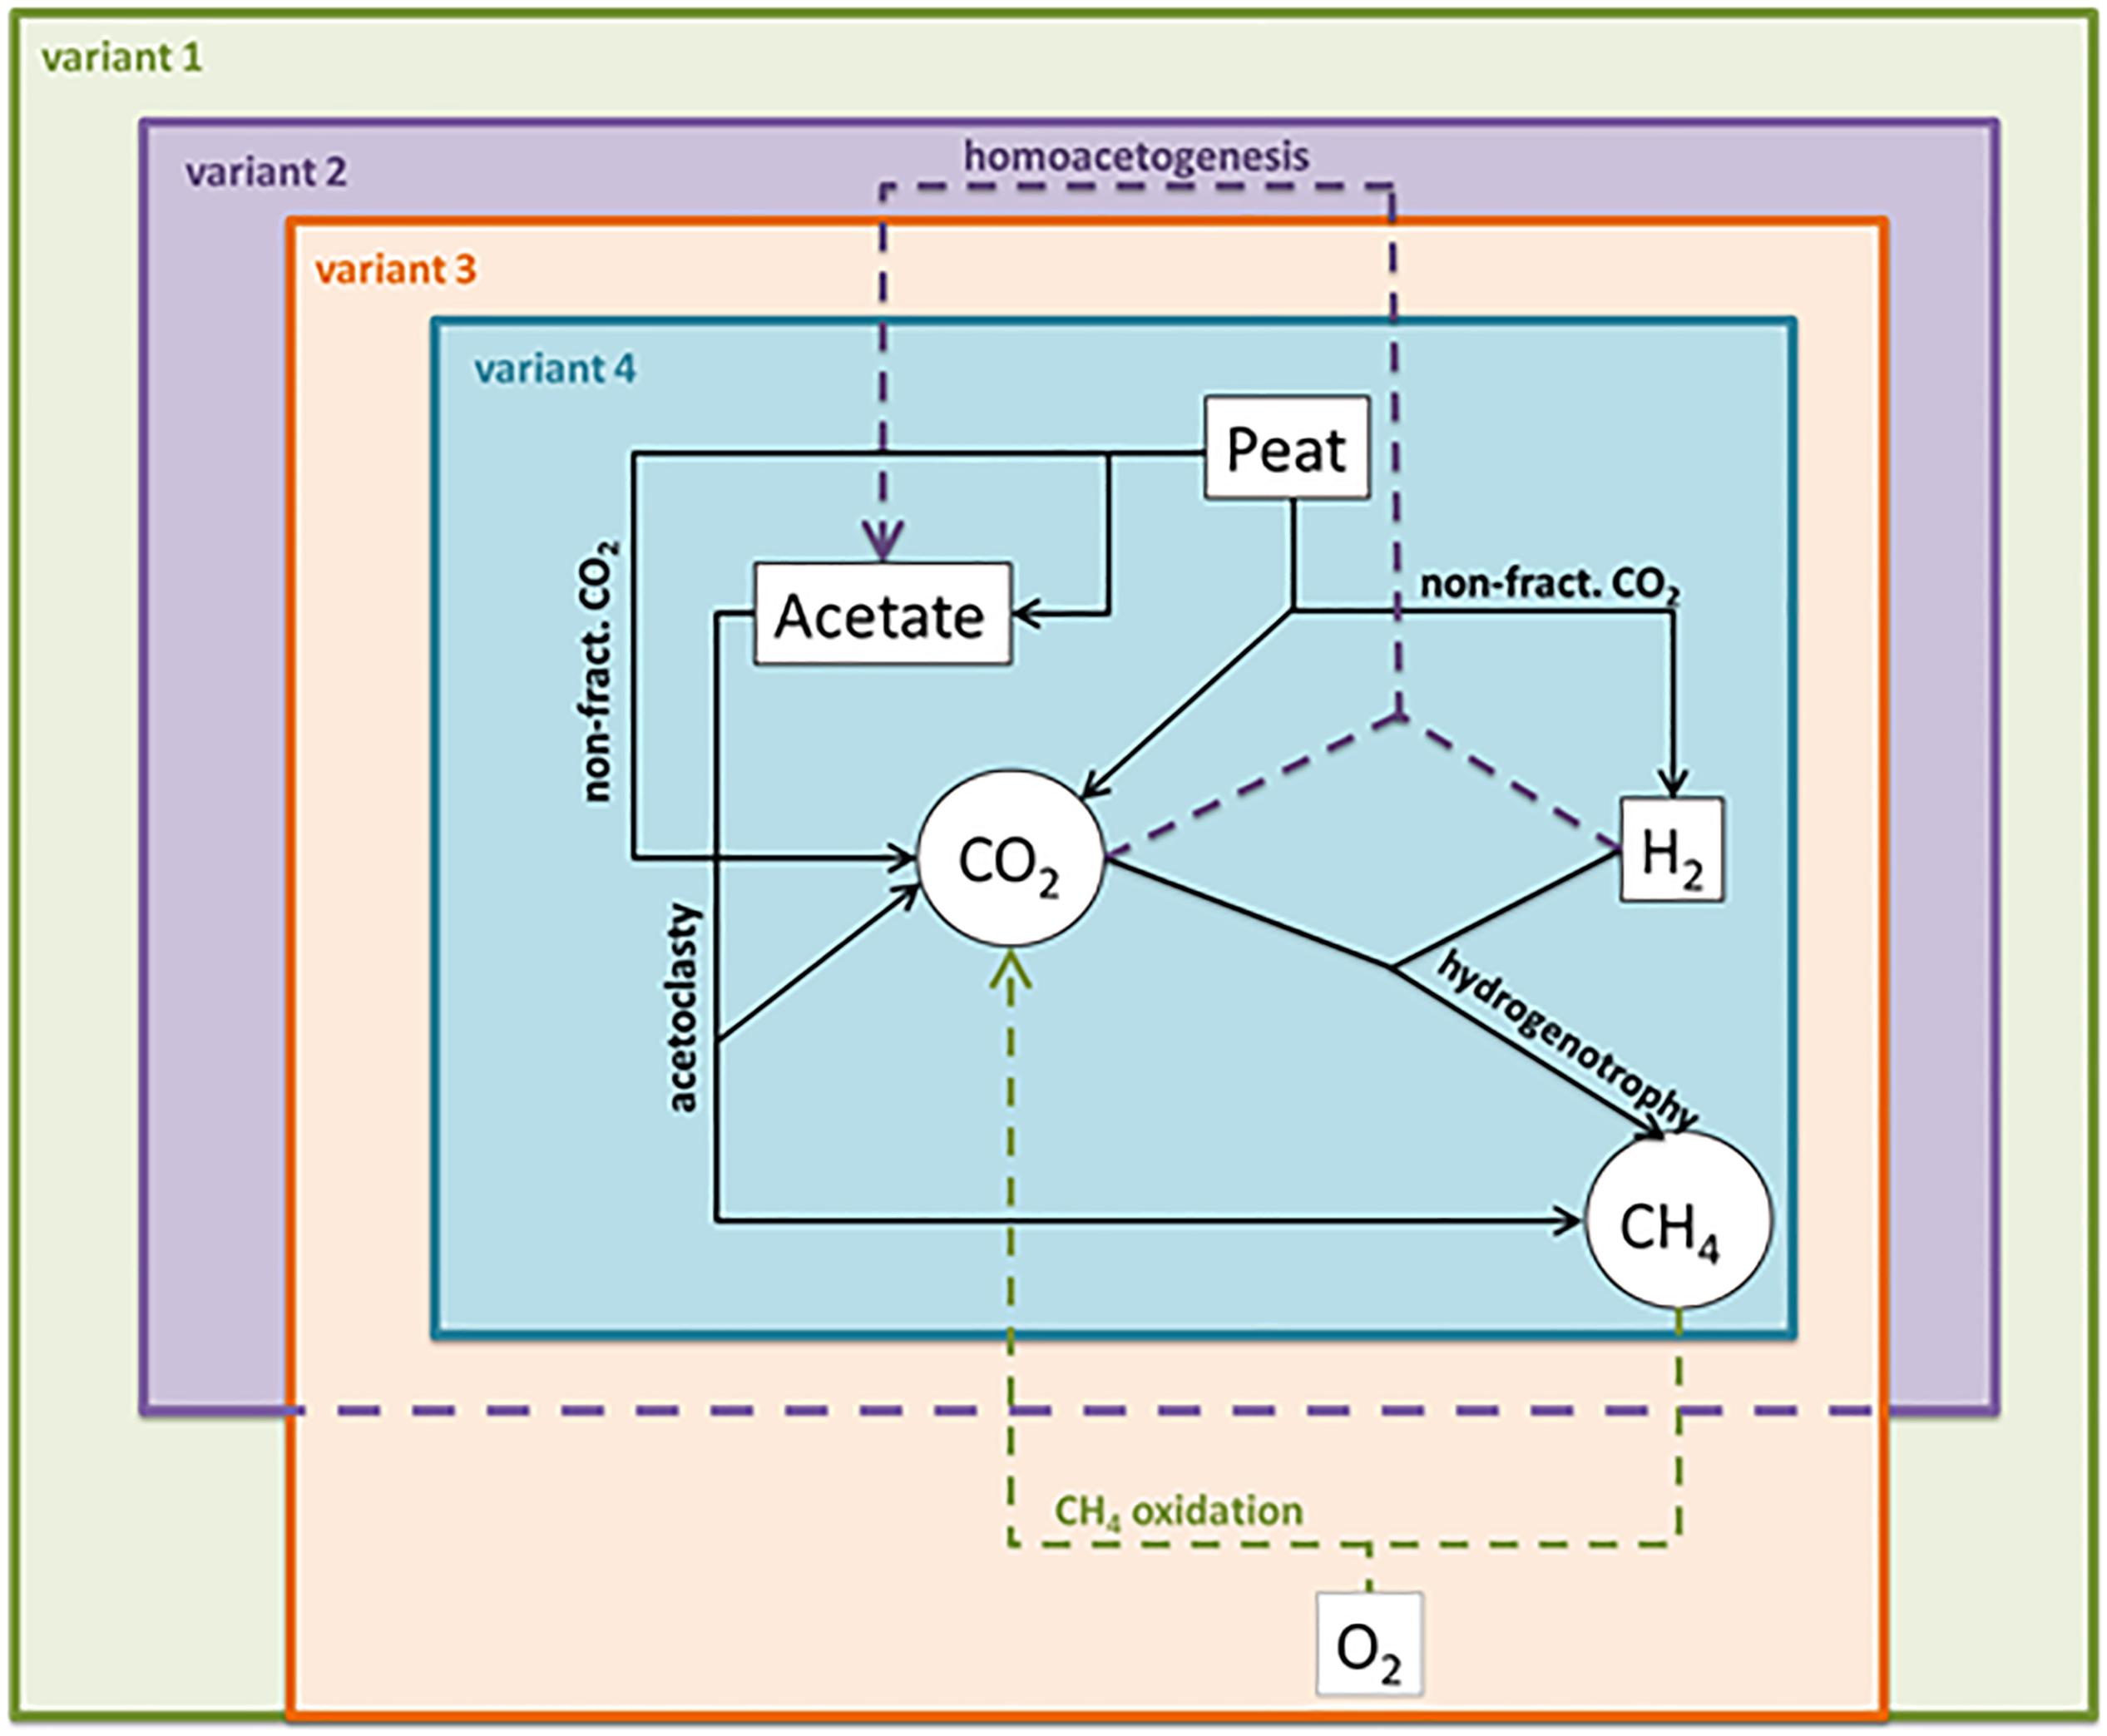
Figure 2. Schematic overview of model variants showing included reaction pathways in each variant. Neumann et al’s. (2016) fugitive methane term was not included in any model variant because the closed incubations should not have allowed gasses to escape the system. Variant 1 is the most inclusive, incorporating all reactions, variant 2 excludes CH4 oxidation, variant 3 includes CH4 oxidation, but excludes homoacetogenesis, and variant 4 excludes both CH4 oxidation and homoacetogenesis.
Microbial Community Analyses
Using 16S rRNA gene amplicon sequencing of the Lifeguard preserved peat samples from each sampling time point, we investigated the relative abundances of microbial community members from each site that are taxonomically affiliated with organisms that are known to perform the modeled microbial reactions. Although 16S alone does not inform microbial function, conservation of functional features among relatives is observed, including those related to these specific modeled functions (Martiny et al., 2015). In particular, methanogenesis as a trait is typically conserved at the order or family level (Martiny et al., 2015), although acetogenesis is not (Drake et al., 2013).
Nucleic Acid Extraction
DNA extractions were performed for replicate peat samples from the field, incubation setup, and days 0, 25, and 50 of the incubations, as described by Mondav et al. (2014) and Woodcroft et al. (2018). Briefly, total nucleic acids were extracted from ∼2 g peat sample using the PowerMax Total Nucleic Acid extraction kit (MoBio), retaining the LifeGuard preservation solution during lysis. DNA was purified by RNaseA digestion, phenol-chloroform-isoamyl alcohol purified and ethanol precipitated. Approximately 15 ng DNA from each sample was used as a template in PCR reactions. Libraries for low concentration DNA samples were created using 1 ng of DNA with the Nextera XT DNA Sample Preparation Kit.
Quantitative PCR
To measure microbial cell abundances, based on 16S rRNA gene copies, quantitative polymerase chain reaction (qPCR) was conducted for each community. Each reaction contained 5 μl of 2X SYBR Green PCR Master Mix (Applied Biosystems, Carlsbad, CA, United States), 4 μl of template DNA, and 1 μl of primer mix. Bacterial and archaeal 16S rRNA genes were amplified using the primer set 1406F/1525R (0.4 μM, F - GYACWCACCGCCCGT and R - AAGGAGGTGWTCCARCC). For inhibition control samples, the rpsL primer pair (0.2 μM, F - GTAAAGTATGCCGTGTTCGT and R - AGCCTGCTTACGGTCTTTA) was used to amplify Escherichia coli DH10B only. Each sample and standard were run in triplicate, with three dilutions (1/100, 1/500, and 1/1000) and an inhibition control (1/100 dilution of E. coli DH10B genomic DNA spiked into a 1/100 dilution of the sample). E. coli DH10B genomic DNA dilutions of 10−2, 10−3, 10−4, 10−5, and 10−6 of the 20 ng/μl stock solution were used for the standards. The ViiA7 Real-Time PCR System (Applied Biosystems, Carlsbad, CA, United States) was used for the qPCRs, with the following cycling conditions: 10 min at 95°C, 40 cycles of [15 s at 95°C, then 20 s at 55°C, then 30 s at 72°C]. To produce a melt curve, a cycle of 2 min at 95°C was run, and then a final cycle of 15 s at 60°C. The cycle threshold (Ct) values were recorded and analyzed using ViiA7 v1.2 software, and 16S rRNA gene copy numbers were calculated for each sample. These calculations accounted for the genome size (4,686,137 bp) and 16S rRNA gene copy number (7) of the standard.
16S PCR Amplification and Amplicon Sequencing
The 16S rRNA gene encompassing the V6–V8 regions was targeted using the 926F (5′-AAACTYAAAKGAATTGRCGG-3′) and 1392R (5′-ACGGGCGGTGWGTRC-3′) primers (Engelbrektson et al., 2010) modified to contain Illumina specific adapter sequence (926F:5′TCGTCGGCAGCGTCAGATGTGTATAAGAGACAGAAACT
YAAAKGAATTGRCGG3′ and 1392wR:5′GTCTCGTGGGCTCGGGTCTCGTGGGCTCGGAGATGTGT
ATAAGAGACAGACGGGCGGTGWGTRC3′). The universal primer pair Univ_SSU_926F-1392wR amplifies the small subunit (SSU) ribosomal RNA of prokaryotes (16S), specifically the V6, V7, and V8 regions. In E. coli, it amplifies the 926–1392 region of the 16S gene.
Preparation of the 16S library was performed as described, using the workflow outlined by Illumina (#15044223 Rev.B). In the 1st stage, PCR products of ∼466 bp were amplified according to the specified workflow with an alteration in polymerase used to substitute Q5 Hot Start High-Fidelity 2X Master Mix (New England Biolabs) in standard PCR conditions. Resulting PCR amplicons were purified using Agencourt AMPure XP beads (Beckman Coulter). Purified DNA was indexed with unique 8 bp barcodes using the Illumina Nextera XT 384 sample Index Kit A-D (Illumina FC-131-1002) in standard PCR conditions with Q5 Hot Start High-Fidelity 2X Master Mix. Indexed amplicons were pooled together in equimolar concentrations and sequenced on MiSeq Sequencing System (Illumina) using paired end sequencing with V3 300 bp chemistry in the Australian Centre for Ecogenomics according to manufacturer’s protocol.
iTag Processing
16S amplicons were processed using the Australian Center for Ecogenomics (ACE) mitag pipeline (AMP). The first 20 bases of all fastq files are then trimmed to remove primer sequence, and quality trimmed to remove poor quality sequence using a sliding window of 4 bases with an average base quality above 15 using the software Trimmomatic. All reads are then hard trimmed to 250 bases, and any with less than 250 bases excluded. Fastq files are then converted to fasta files. Fasta files are processed using QIIME’s pick_open_reference_otus.py workflow with default parameters (97% similarity) and taxonomy assignment and alignment features suppressed. The resulting OTU table is filtered to remove any OTU with an abundance of less than 0.005%. Representative OTU sequences are then BLASTed against the reference database (Greengenes version 2013/05 for 16S).
In order to correct the amplicon-based relative abundances for variance in genome copy number of the 16S gene between different lineages, both the OTU data and qPCR data were also processed by CopyRighter (Angly et al., 2014).
Identification and Analysis of Microbial Functional Groups
From the 16S rRNA community profiles, lineages known to perform hydrogenotrophic methanogenesis, acetoclastic methanogenesis, and anaerobic CH4 oxidation were manually identified through literature review and included those identified at this site by previous molecular characterization of Stordalen Mire microbial communities (Mondav et al., 2017; Woodcroft et al., 2018). The copy-corrected relative abundances of these lineages were calculated within each microbial community. Aerobic CH4 oxidizing lineages (families Methylocystaceae, Methylococcaceae, Beijerinckiaceae, and Hyphomicrobiaceae) detected at Stordalen Mire by Singleton et al. (2018) were also searched for in the incubation communities. Since both methanogenesis and CH4 oxidation are fairly taxonomically conserved, inferring function based on 16S rRNA-inferred taxonomy is relatively robust. Acetogens, on the other hand, are phylogenetically diverse, spanning at least 20 genera (Drake et al., 2008). Since homoacetogenesis is not a monophyletic trait, a curated list was developed of demonstrated homoacetogenic lineages that have been isolated, cultured, and experimentally observed to form acetate from CO2 and H2 (Supplementary Table S1). Putative homoacetogens in this work are lineages affiliated at either the genus or family level with experimentally verified homoacetogenic lineages. One caveat with this analysis is that some sister taxa diverge in their laboratory ability to perform homoacetogenesis, so inferring function based solely on 16S data is less robust than inferences about CH4 production and oxidation.
Results
CO2 and CH4 Production
CO2 and CH4 concentrations increased throughout all incubations indicating the production of these gases over time (Figure 3). CO2 and CH4 in both depths from the bog and in the fen were linear over time indicating constant production rates. Concentrations in the collapsed palsa increased exponentially over time indicating that production rates increased during the incubation. Isotopic ratios of the CO2 and CH4 varied over time in all incubations, though the variation was not consistent among treatments. In some cases, the stable isotope ratio became more enriched over time and in some cases the isotope ratio became more depleted over time. The shifts in the isotope ratio indicate temporal changes in the reaction rates and the complex nature of the changes make it difficult to estimate which reaction rates are changing without using a reaction network model. For example, if this isotopic shift was purely the result of substrate fractionation due to the closed-system incubations, one could expect that the direction of the isotopic fractionation would be the same for each of the habitats (becoming more enriched with 13C over time), but since the direction of the fractionation differs (e.g., CH4 becomes lighter while CO2 becomes heavier in the fen, but both CO2 and CH4 become heavier over time in the collapsed palsa), substrate alteration cannot fully explain this result. Implementation of the reaction network model allows us to calculate the relative rates and understand how the C decomposition dynamics are changing over time and across sites.
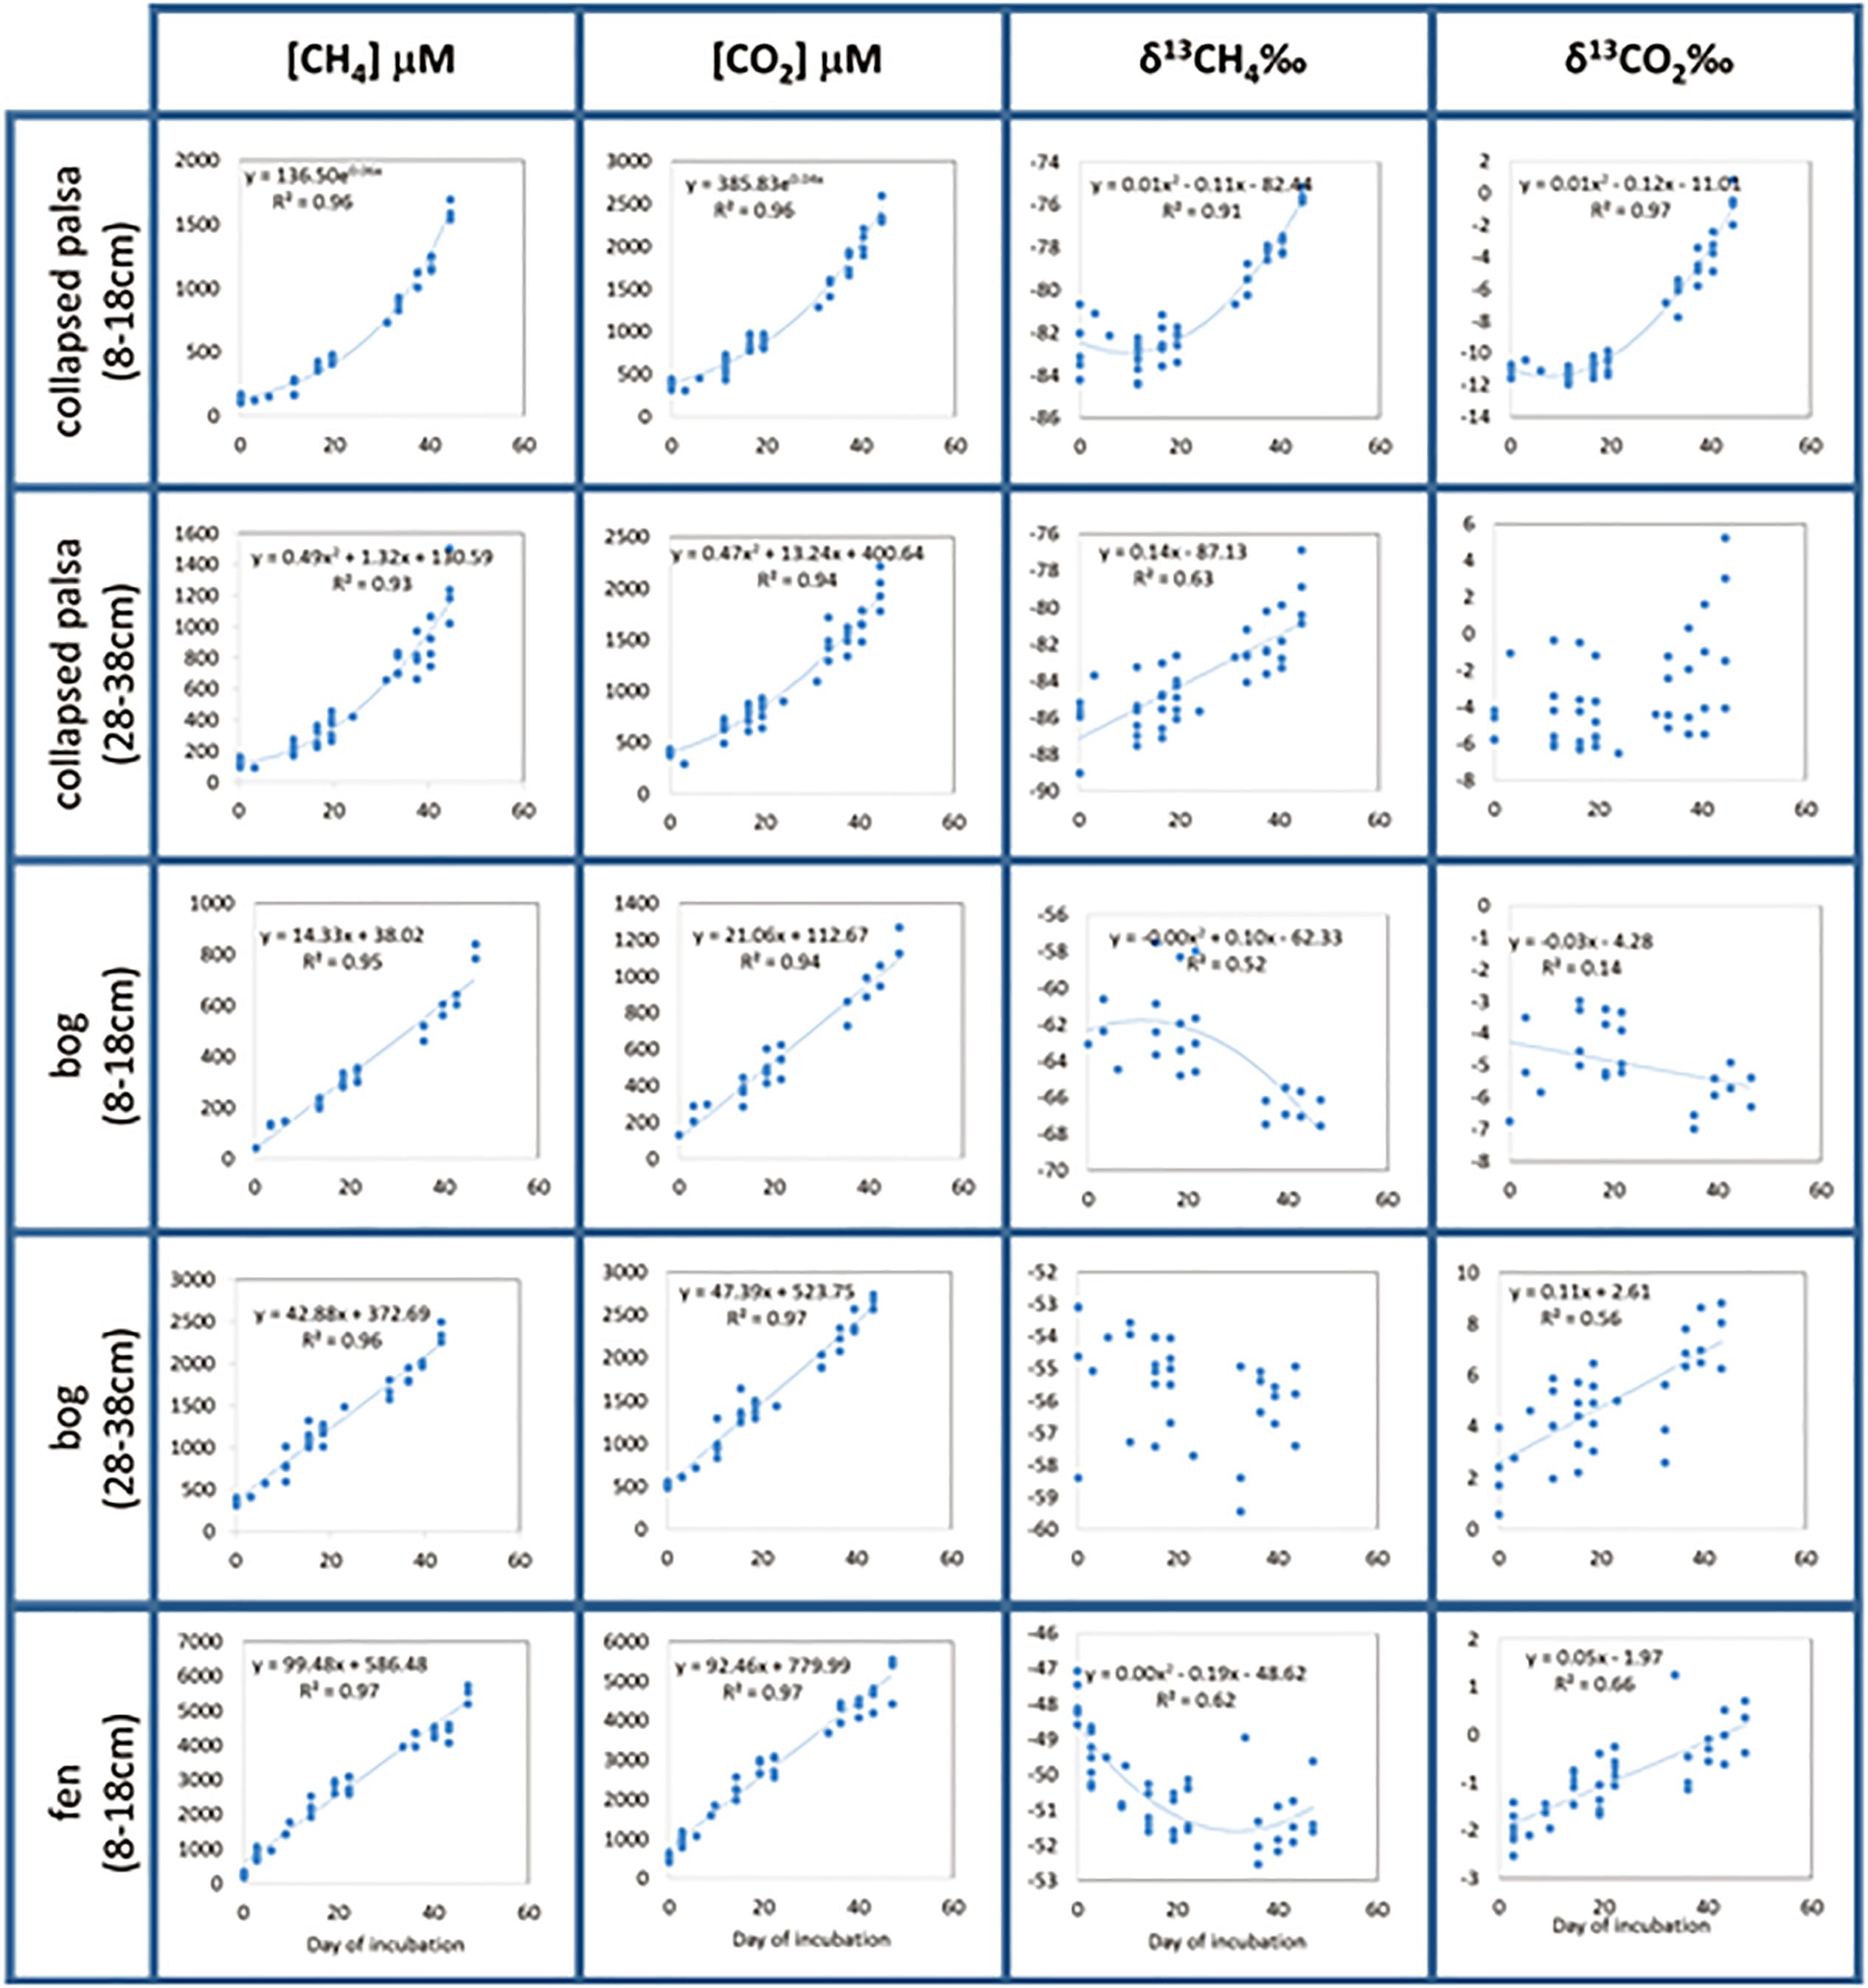
Figure 3. Measured incubation data represented by points and regression equations (dotted lines) used as model input parameters. For the two cases where the isotopic signature of the emitted gas (δ13CH4 in bog deep and δ13CO2 collapse palsa deep) did not change regularly with time [i.e., the regression equations explained less than 50% of the variability in the data (R2 < 0.5)], we used the average value of the data as the model input parameters.
Modeling Results
Because incubation data were variable both among replicates and with time, we fit the data with linear or polynomial regressions (as indicated on Figure 3) and used the results of the regressions as input data for the model. Regression types were chosen such that linear regressions were preferred, but when linear regressions explained less than 50% of the variation in the data, we then chose exponential regressions, and if those, too explained less than 50% of the data we then chose polynomial regressions. In two cases, (δ13CO2 in collapsed palsa 28–38 cm and δ13CH4 in bog 28–38cm), not even polynomial regressions explained a satisfactory amount of the variation in the data and in those cases, we used the simple mean of all time points.
All four model variants (Figure 2) converged for all sites/depths. All model variants produced similar rates for all included reactions (Figure 4), which contributed to the difficulty in discerning among them. However, some slight differences in rate results among variants were noted. Inclusion of homoacetogenesis and CH4 oxidation altered the ratio of acetoclasty to hydrogenotrophic methanogenesis in each site (Figure 5). In particular, excluding the homoacetogenesis term increased the relative proportion of hydrogenotrophy in most incubations.
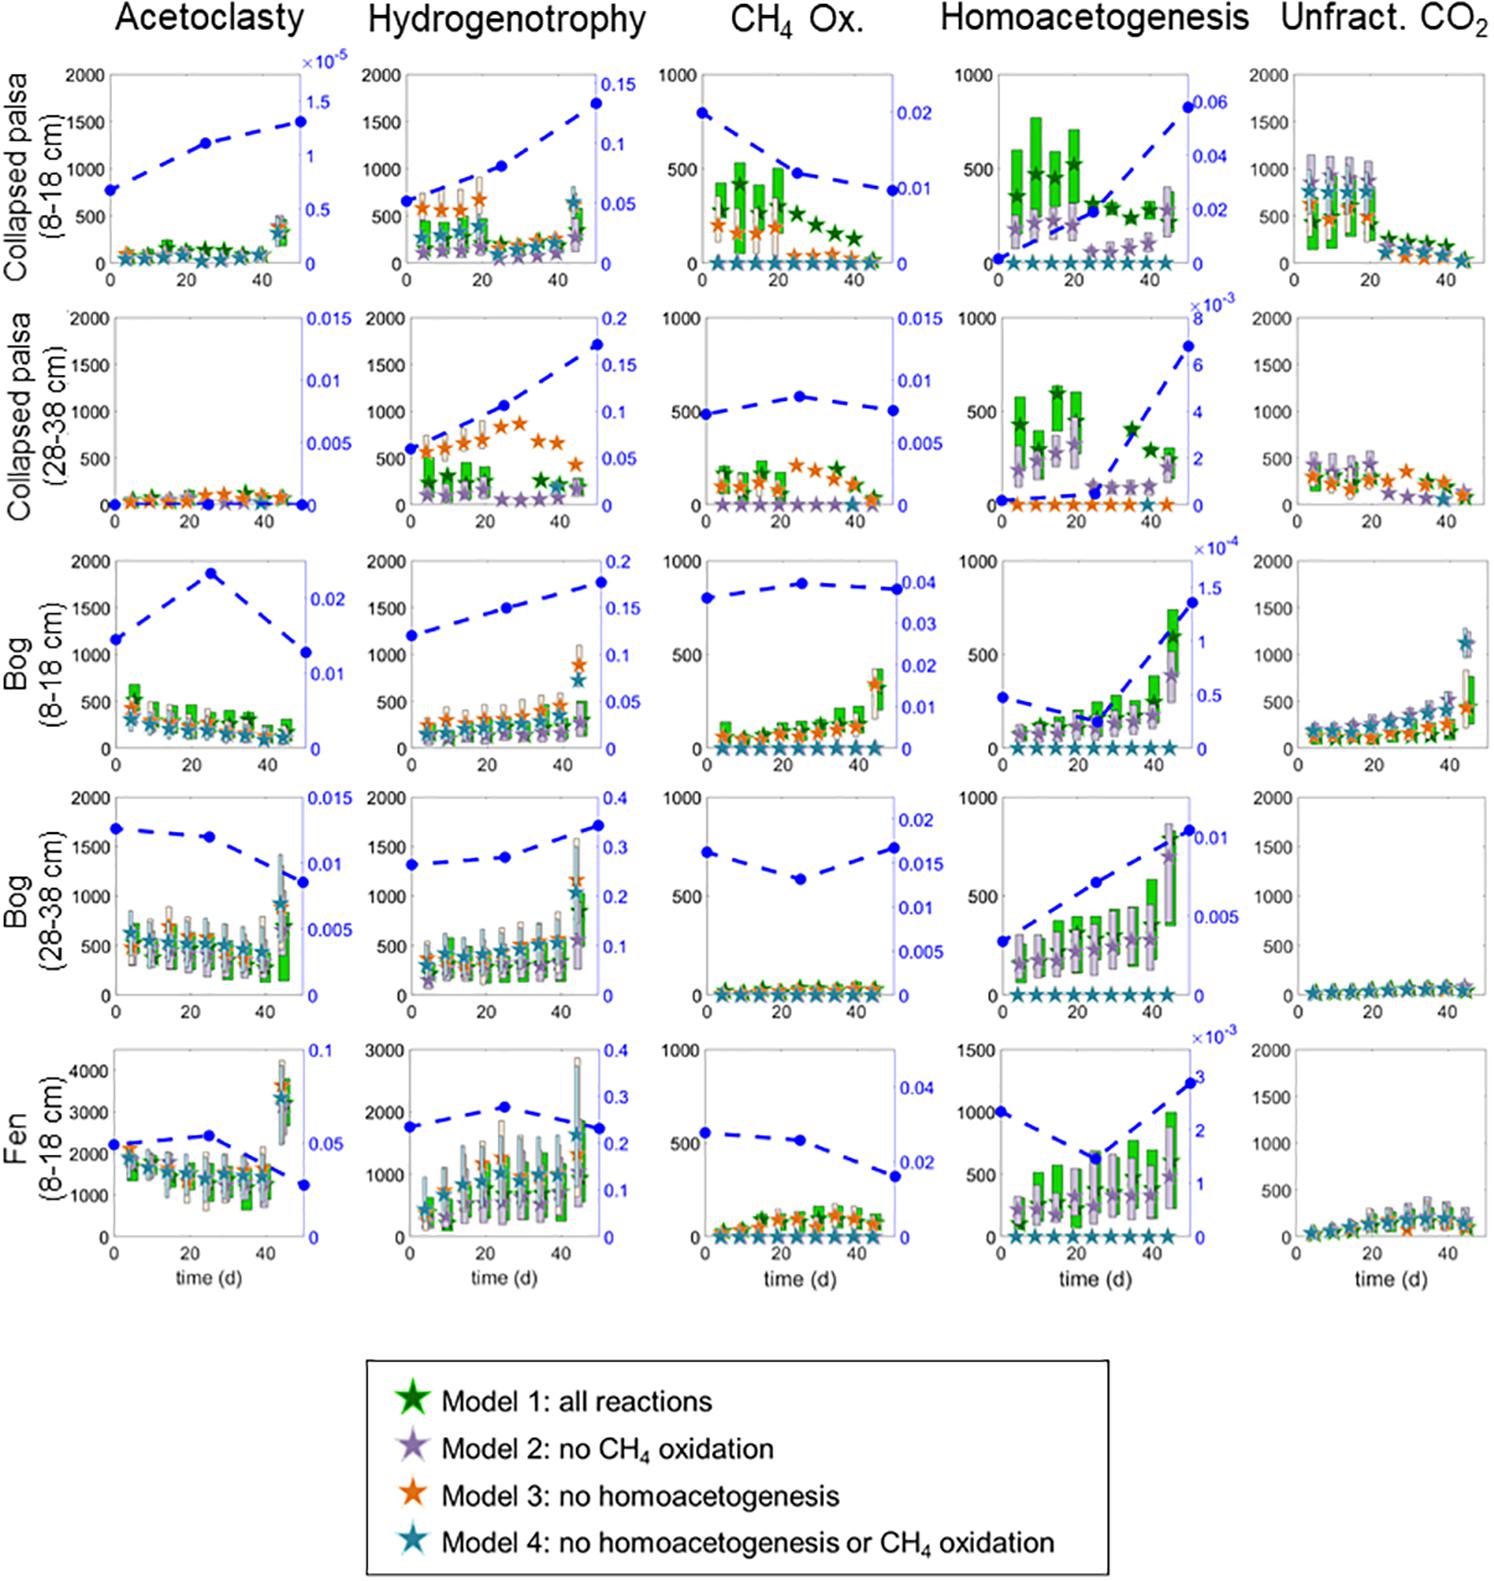
Figure 4. Rate results from the four variants of the reaction network model. All rates are in μmol month−1. Stars are medians and boxes vertically outline interquartile ranges of the posterior likelihoods. Box widths are staggered so that overlapping ranges can be visually distinguished. Blue circles with dashed lines indicate abundances of microorganisms thought to perform the relevant reaction (i.e., acetoclasts, hydrogenotrophs, or genus-level homoacetogens) plotted against the secondary right-hand axis. Aerobic methane oxidizers are also included on the CH4 Ox. graph for comparison. Note that the scale on the fen acetoclasty, hydrogenotrophy, and homoacetogenesis results differ from other habitats due to the higher overall rates in this habitat.
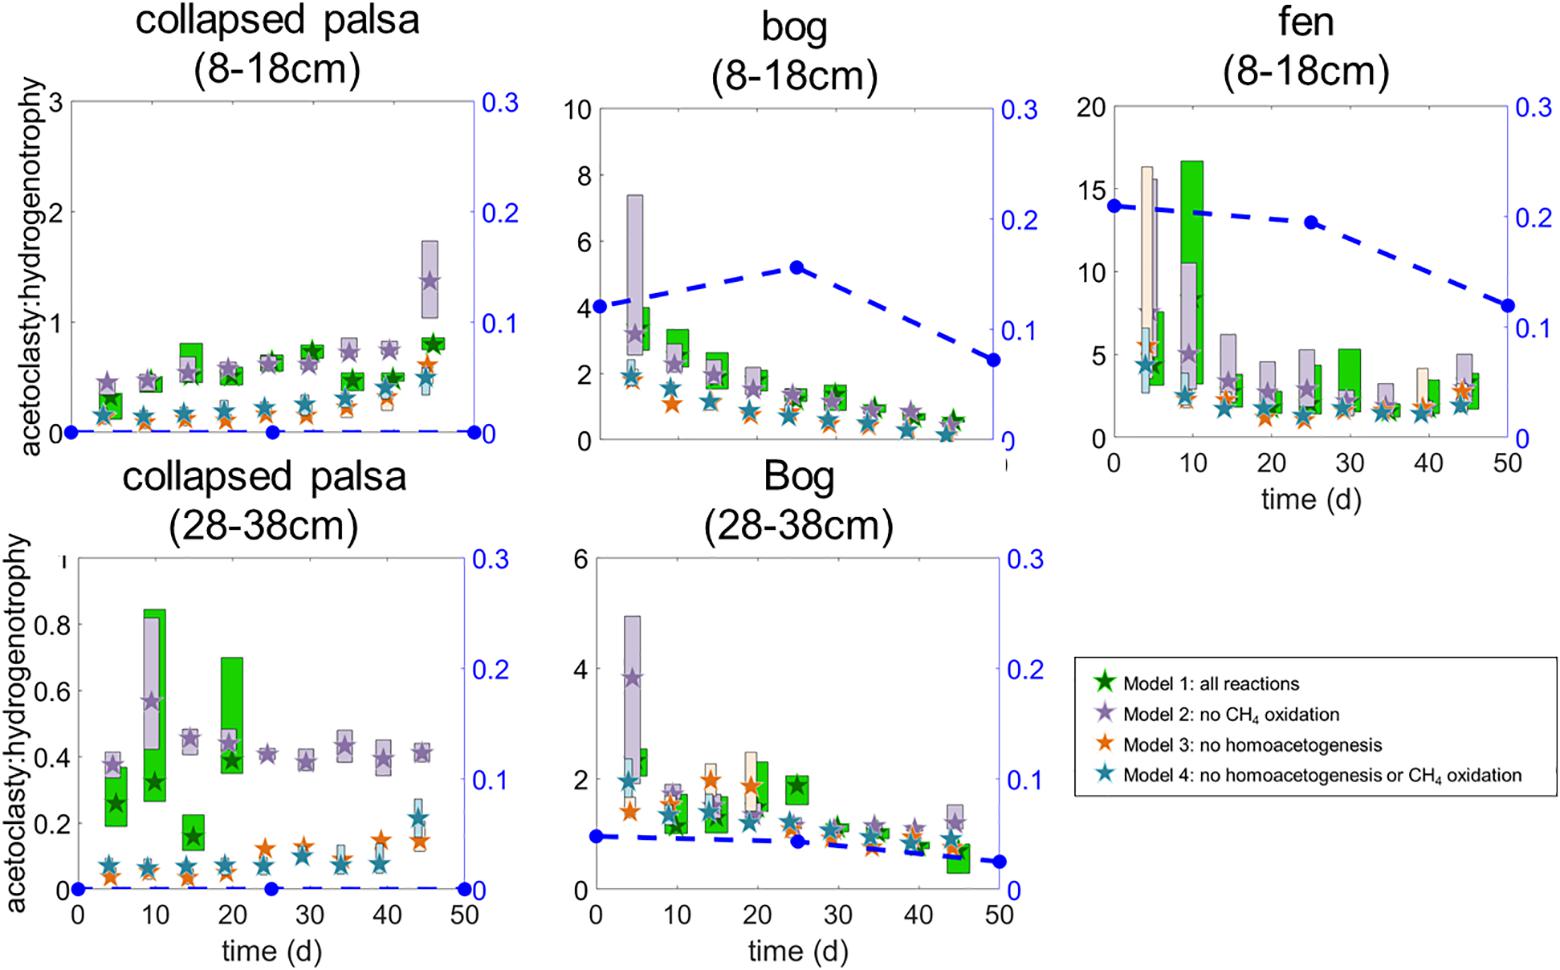
Figure 5. Ratio of modeled rates of acetoclasty:hydrogenotrophic methanogenesis for each of the four model variants. Stars indicate medians and box heights outline interquartile ranges of posterior likelihoods. Box widths are staggered so that overlapping ranges can be visually distinguished. Blue symbols with dashed lines indicate the ratio of acetoclast to hydrogenotroph abundances in the incubations. In the collapsed palsa (28–38 cm) the hydrogenotrophy rate at days 25 and 30 was 0 μmol month−1 (i.e., acetoclasty:hydrogenotrophy was undefined) which prevented us from calculating ratios after day 20 for that incubation.
Microbial Results
We examined microbial functional guilds to identify the most likely reaction networks giving rise to the observed CO2 and CH4 concentrations and isotopes, and to inform model choice. The 16S rRNA copy-corrected relative abundances of microbial community members taxonomically affiliated with hydrogenotrophic methanogens, acetoclastic methanogens, methanotrophs, and homoacetogens were summed in the incubations and compared over time within incubations and across habitats (Figure 6 and Supplementary Table S2). qPCR confirmed that 16S rRNA gene copy numbers – a proxy for cell abundances – did not vary appreciably among habitats, and remained within the same order of magnitude over time in each (data not shown). These observations of fairly equal and stable absolute abundances of microbes in these samples strengthen comparisons of their relative abundances.
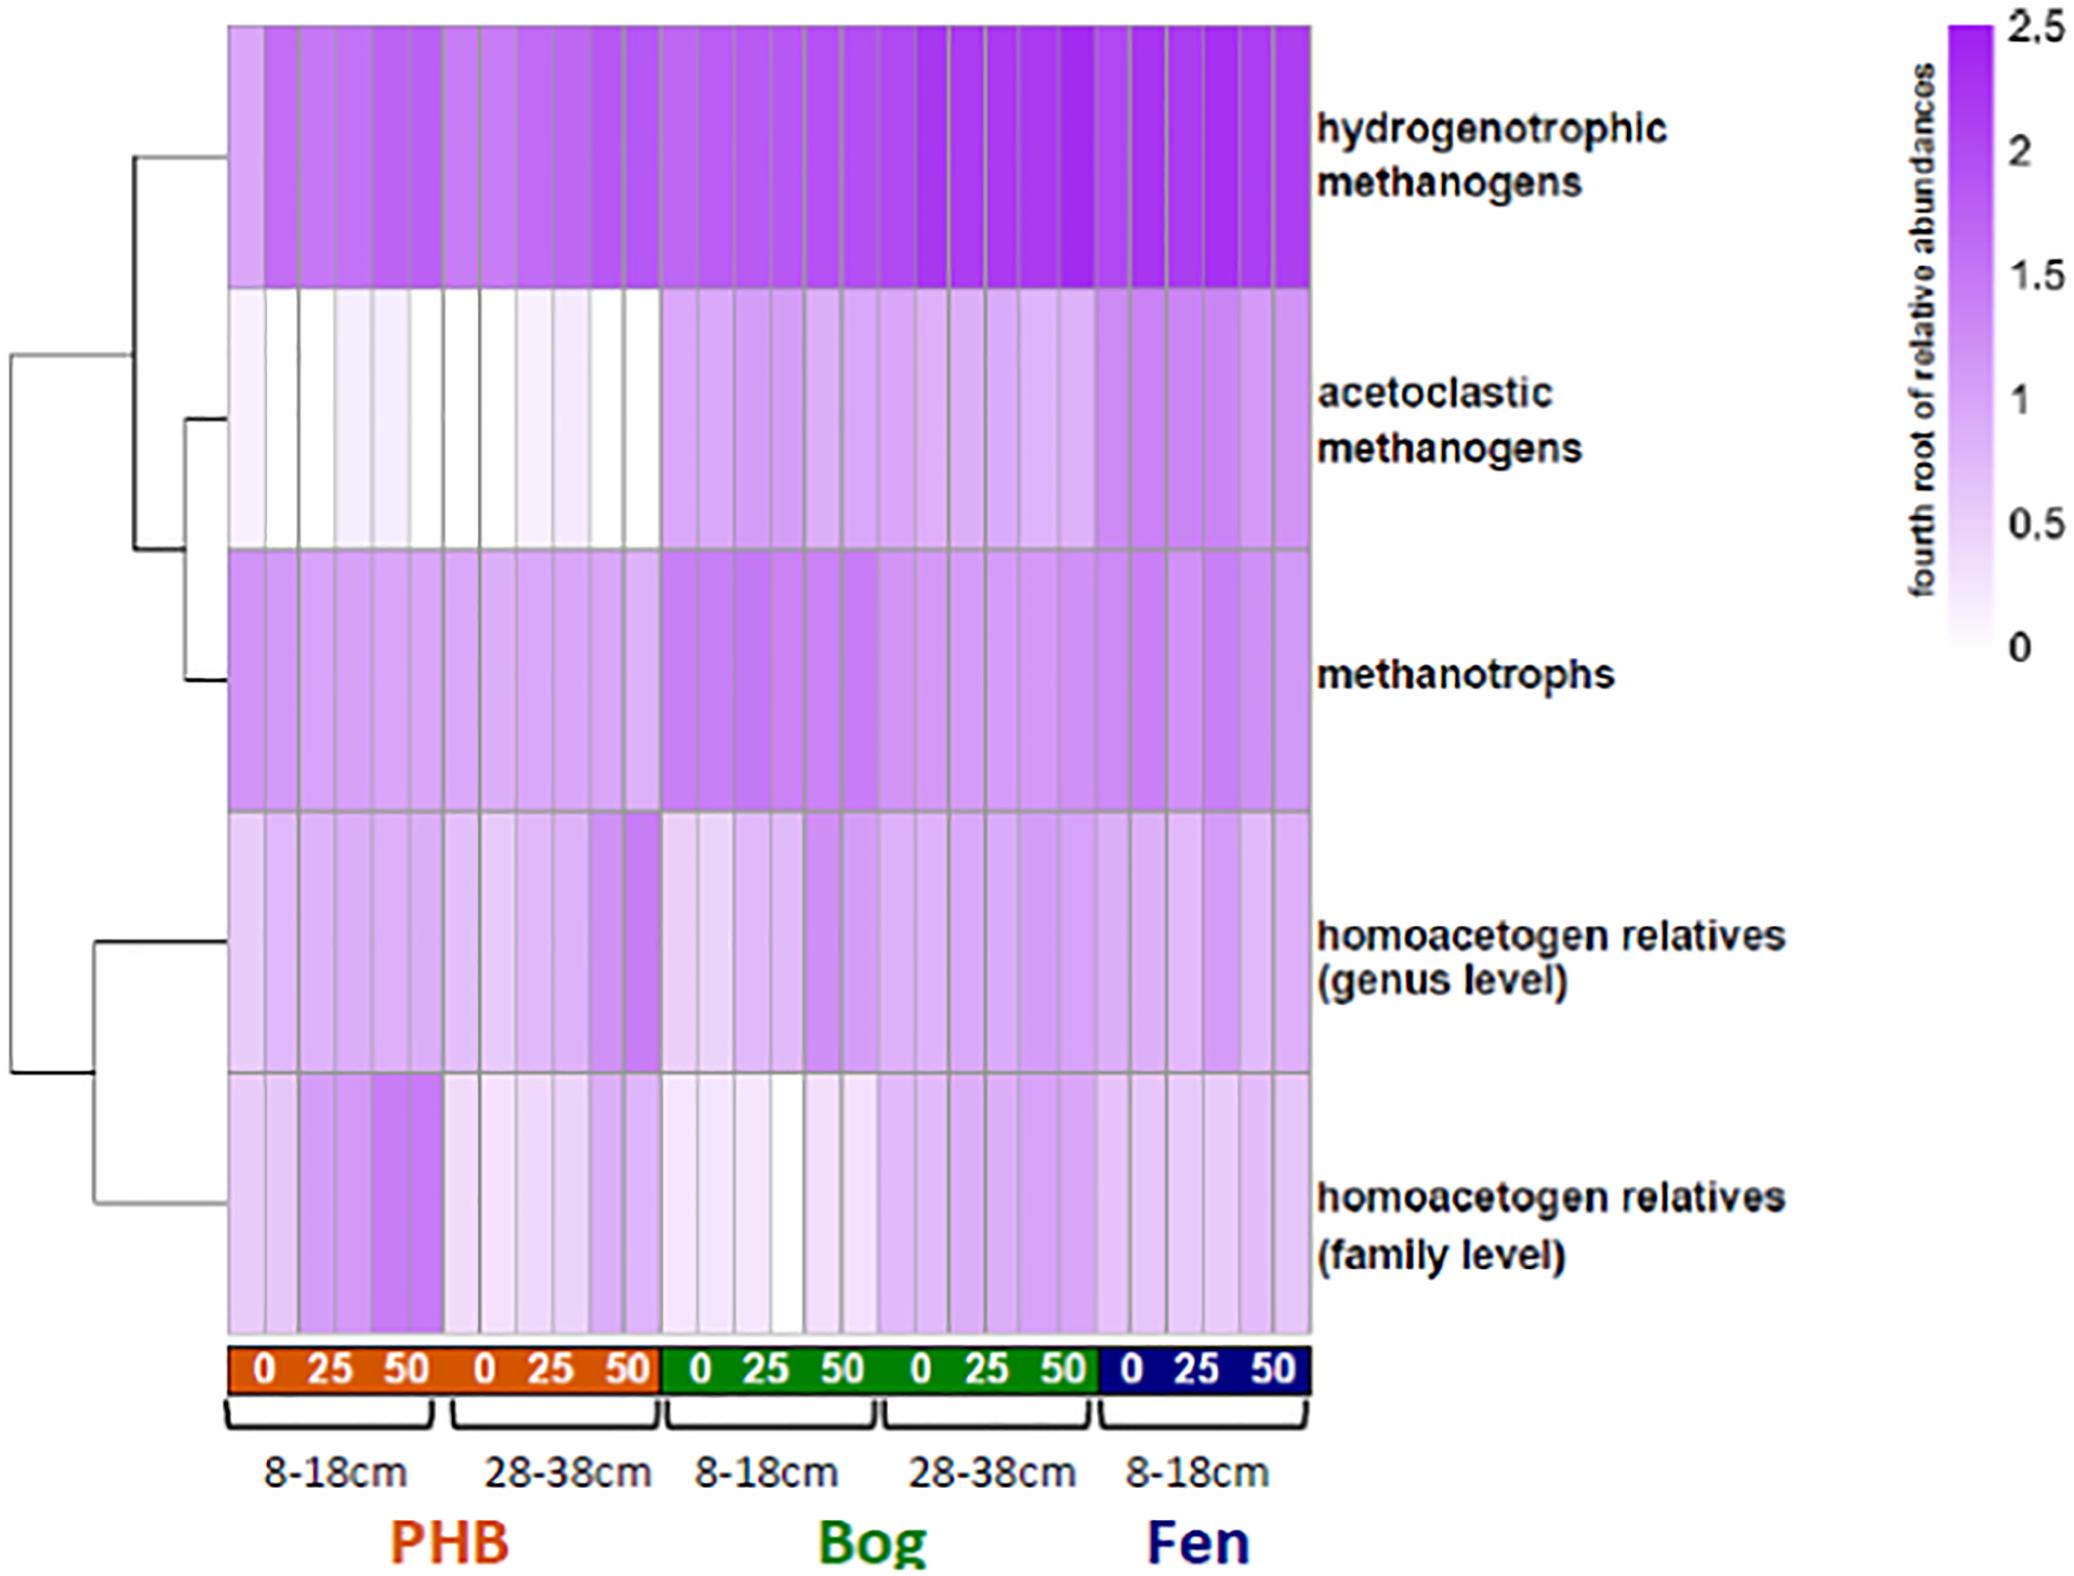
Figure 6. Heat map of relative abundances of microbial functional groups in incubations. For each time point, the two replicates are shown separately. For better visualization across a broad range of abundances for these groups, the color intensity is scaled to the fourth root of the abundances (untransformed relative abundances are provided in Supplementary Table S2).
In almost all samples, the hydrogenotrophic methanogens were the most abundant functional group. No known lineages of anaerobic methane oxidizers were identified in any of the samples, consistent with their absence in profiles of the microbiota in the field (Mondav et al., 2017; Woodcroft et al., 2018). While OTUs belonging to aerobic methane oxidizers from Methylocystaceae and Methylococcaceae were present in the incubations, at approximately constant or slightly declining relative abundances over time, the highly anoxic conditions of the incubations almost certainly precluded any aerobic methane oxidation activity.
OTUs affiliated with known acetogenic lineages at the genus or family level were present in the incubations in varying abundances (Figure 6). Here, “homoacetogen” refers to an organism whose growth is known to be supported solely by CO2 + H2, creating acetate using the acetyl-CoA pathway (Diekert and Wohlfarth, 1994b). Though homoacetogenesis as a trait is not strongly phylogenetically conserved (Drake et al., 2008), OTUs that were taxonomically affiliated with known homoacetogenic lineages (i.e., isolated and experimentally verified to grow on CO2 and H2; Supplementary Table S2) at the genus or family level were identified as putative homoacetogens, only ∼30% of the OTUs in the dataset could be assigned genus-taxonomy, compared to ∼70% at the family level. Putative homoacetogens in the incubations were affiliated with each of the following genera: Clostridium, Moorella, or Treponema, within the families Thermoanaerobaceae or Spirochaetaceae. Overall in the incubations, lineages that are taxonomically affiliated with these experimentally verified homoacetogens are present in every sample. At the genus level, these putative homoacetogens increase in relative abundance over time in the collapsed palsa and bog samples (Figure 4). The family level putative homoacetogens are most abundant in the 8–18 cm collapsed palsa samples, where they increase notably over time (Figure 6).
Model Variant 2 and Microbial Differences Across Thaw Gradient
No markers for anaerobic CH4 oxidizers were identified in any of the samples consistent with other observations at Stordalen Mire (Woodcroft et al., 2018). Lineages that matched to aerobic CH4 oxidizers from Methylocystaceae and Methylococcaceae were present in the incubations, but the 25-day pre-incubation period should have ensured anaerobic conditions (Ye et al., 2012), therefore, it’s unlikely that the aerobic methanogens were active. Based on these considerations, we rejected the modeling variants that included CH4 oxidation (variants 1 and 3). To decide between the two remaining model variants (2 and 4) we conducted a regression analysis of the median rates of acetoclasty, hydrogenotrophy, and homoacetogenesis versus the relevant microbial abundances at the corresponding timepoint over all incubations (Figure 7). Regressions of acetoclasty and hydrogenotrophy vs. the relevant microbial abundances were significant (p < 0.05) for both model variants, however, the standard error of the regressions (S.E.R) were smaller in both cases for variant 2 which indicates that variant 2 provided a more precise fit of the observed data (Figure 7). The regression of homoacetogenesis vs. homoacetogen (genus-level) abundance was not significant (p = 0.3) and since homoacetogenesis is not modeled by variant 4, we could not compare between the two variants.
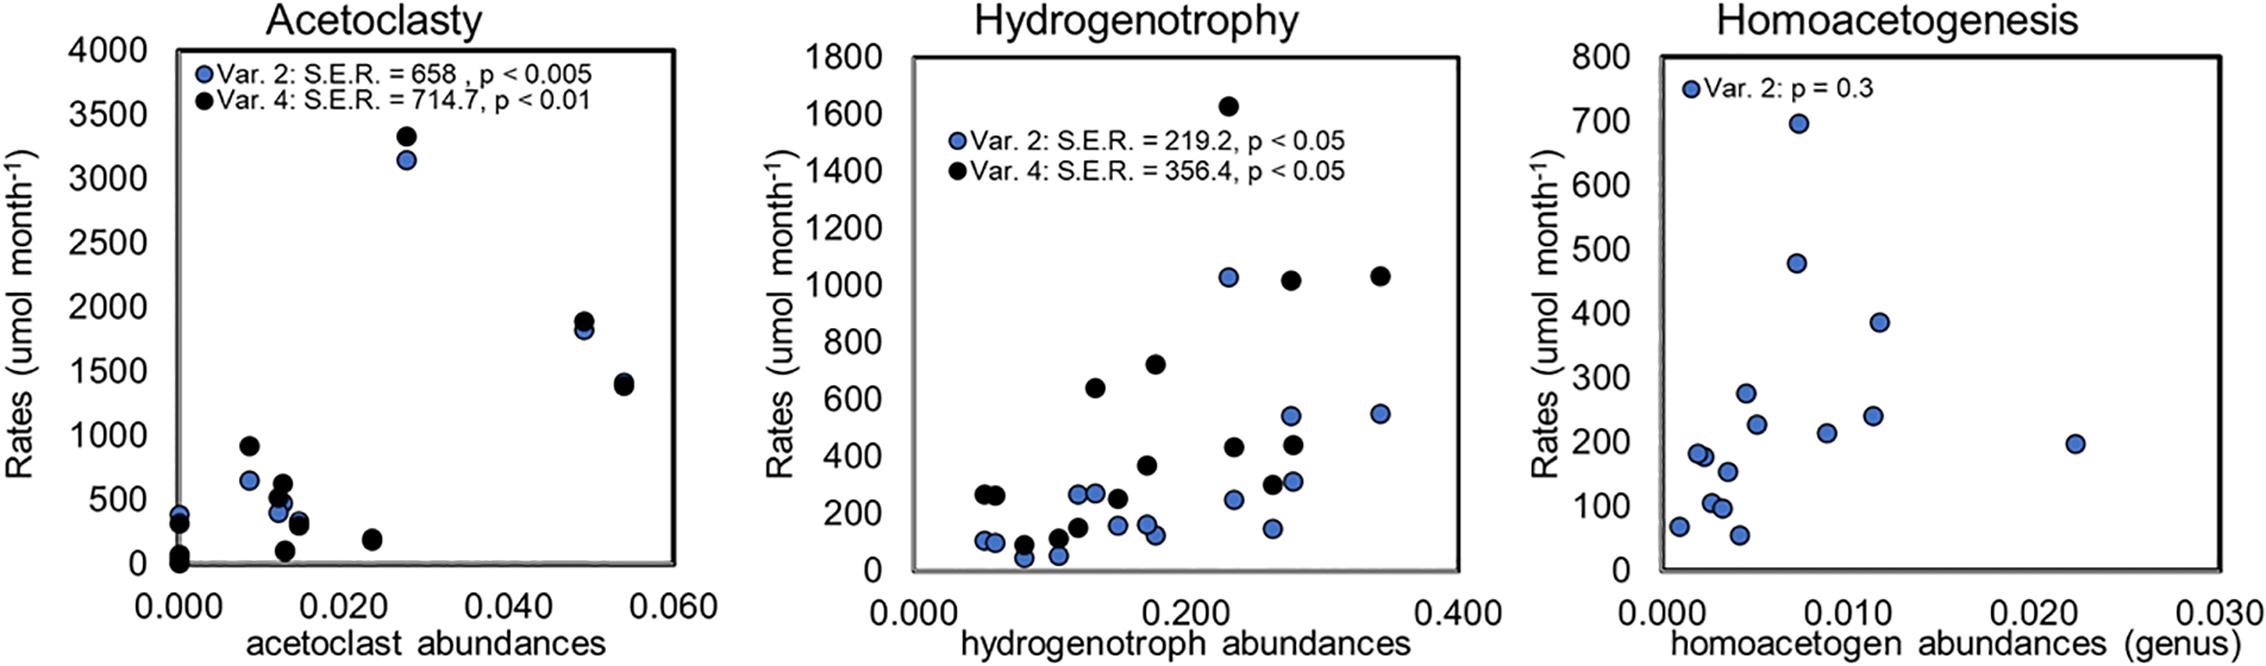
Figure 7. Regression analyses comparing rates with relative microbial abundances for model variants 2 (Var. 2) and 4 (Var. 4). Points are plotted as the median rates calculated for the nearest time-point at which relative microbial abundances were measured across all habitat types. Homoacetogen abundances were considered at the genus-level as described in the text. Regression results are indicated within each panel, where S.E.R. indicates the standard error of the regression. Homoacetogenesis is excluded in variant 4 and is not included on the graph.
Given the better regression results (as indicated by smaller standard error) for acetoclasty and hydrogenotrophy provided by variant 2 (Figure 7) and since microbial analysis revealed evidence of putative homoacetogens in the incubations we rejected variant 4 (which did not include homoacetogenesis). Thus, the microbial data allowed us to narrow our reaction network choices to variant 2 for exploring differences in microbial rates among the various sites and across the thaw gradient.
Collapsed Palsa Results
The variant 2 reaction network estimated that methanogenesis in the collapsed palsa was dominated by hydrogenotrophy (i.e., acetoclasty:hydrogenotrophy < 1 in Figure 5) until the last time point in the 8–18 cm collapsed palsa incubations (Figure 5). In agreement, the microbial methanogen community at this site was dominated by hydrogenotrophs in both shallow and deep samples, to the near exclusion of acetoclasts; this was observed at all time points examined (days 0, 25, and 50) (Figure 4).
Of the three studied habitats, the collapsed palsa had the greatest abundance of putative homoacetogens (Figure 6). Estimated rates of homoacetogenesis were higher in the collapsed palsa than in the other sites over the first 25 days of the incubations; rates dropped sharply after day 25 (Figure 4) as signaled by the inflection point in the measured rates and isotope ratios (Figure 3). At the same time, the estimated ratio of hydrogenotrophy:homoacetogenesis in the collapsed palsa increased over time approaching 1:1 (Figure 5) by day 50 in the 8–18 cm depth. On day 25, the rates of acetoclasty, hydrogenotrophy, and homoacetogenesis all decreased in this incubation (Figure 4), apparently signifying that as less acetate was produced from homoacetogenesis, less acetate was available to be consumed by acetoclasty. The microbial data indicated that this shift was accompanied by an increase in hydrogenotrophic methanogens (Figure 4).
Over the first 20 days of the incubations, the model estimated that non-fractioned CO2 production was highest in the collapsed palsa incubation compared to incubations of material from the other sites, but this rate declined over time (Figure 4). In the beginning of the collapsed palsa incubations, non-fractionated CO2 dominated total CO2 production, but over time, the relative proportion of non-fractionated CO2 declined leading to an increase in the proportion of methanogenic CO2 for both depths (Figure 4). Concomitantly, the observed and modeled CO2:CH4 ratio declined over time consistent with the system becoming more methanogenic (Figure 8). The change in modeled CO2:CH4 ratios over time was greatest in the collapsed palsa incubations (>45%) compared to other sites (Figure 8).
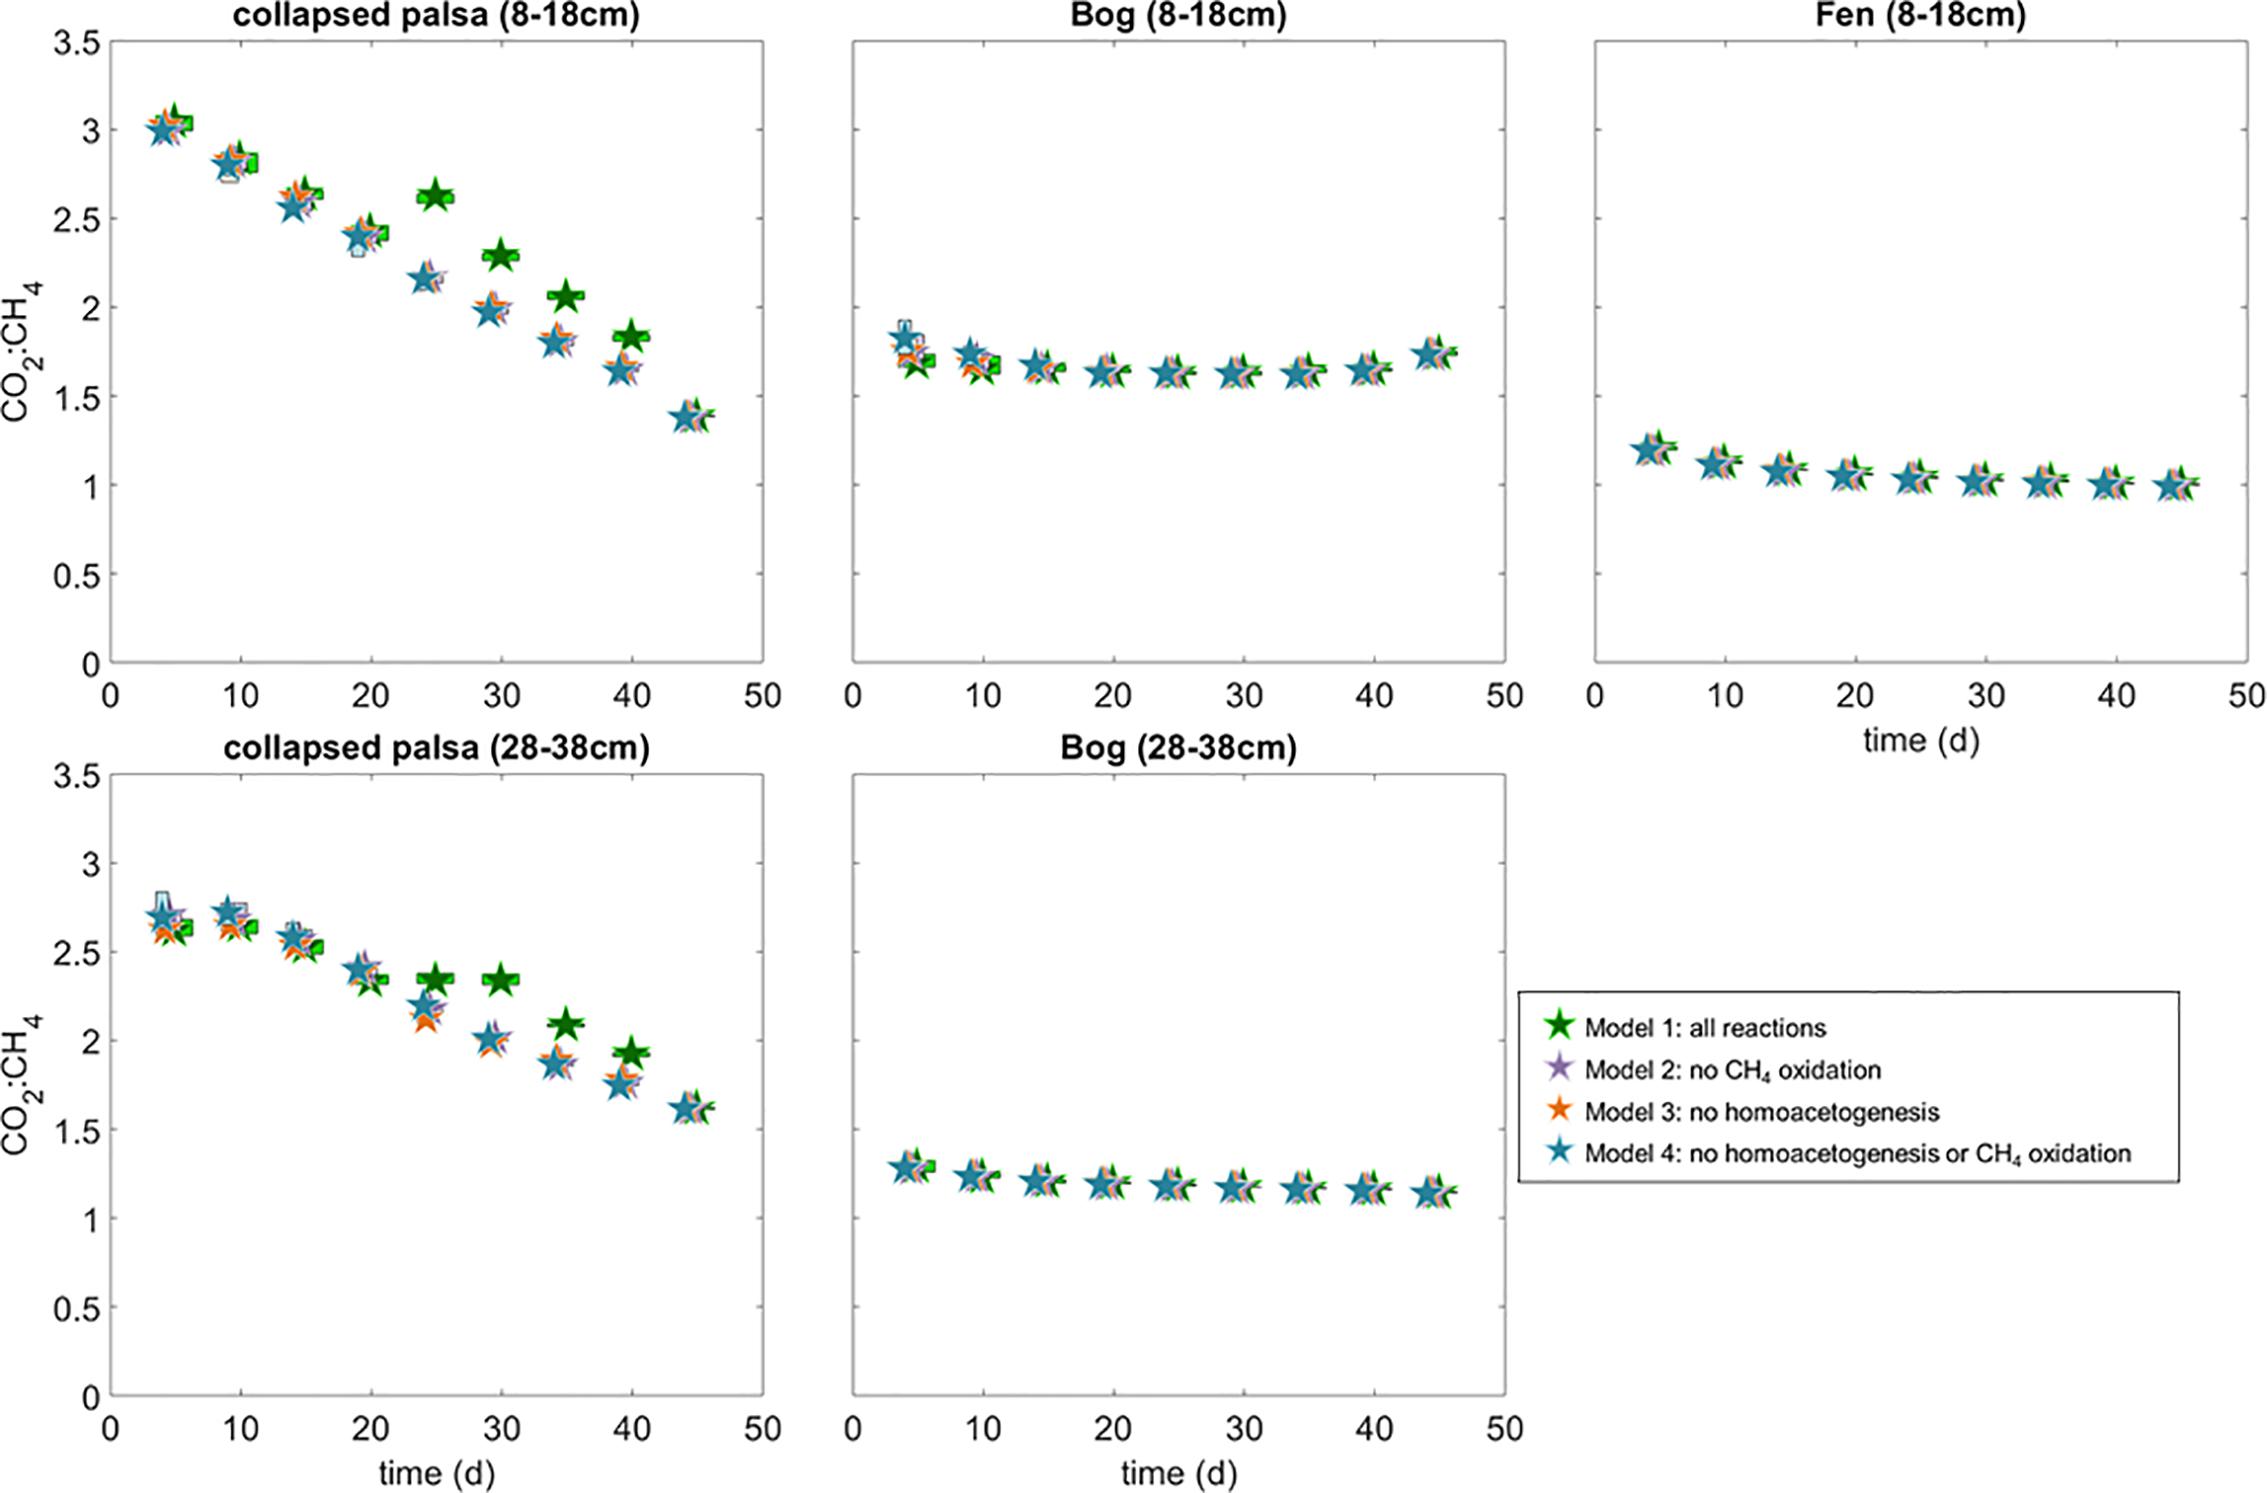
Figure 8. Ratio of modeled rates of CO2 and CH4 production for each of the incubations and model variants. Box widths are staggered as in Figures 5, 6, but interquartile ranges of the CO2:CH4 are tightly constrained and often smaller than the size of the median symbols at this resolution.
Sphagnum-Dominated Bog Results
In the bog, estimated rates of acetoclasty decreased over time (until the last time point in the deep bog), while estimated rates of hydrogenotrophic methanogenesis increased over time (Figure 4). The relative abundance of acetoclasts in the bog did not reflect the trend in acetoclasty rates (Figure 4). A low level of acetoclasts were present in the bog incubations, ranging from <5% of methanogens in the deeper section to 8–21% in shallower bog samples (Figure 6). Thus, in this incubation, acetoclast abundance did not reflect the modeled rates of acetoclasty. For hydrogenotrophy, however, which increased over the course of the incubations there was a corresponding increase in the abundance of hydrogenotrophs (Figure 4). Indicating a good agreement between hydrogenotroph abundance and rates of hydrogenotrophic methanogenesis. The ratio of acetoclasty:hydrogenotrophy in the bog declined over time and approached 1 near the end of the incubations. At the same time, the overall the ratio of acetoclast to hydrogenotroph abundances declined from days 0 to 50 (Figure 5). The deep bog samples had lower proportions of acetoclasts:hydrogenotrophs than the shallow bog samples, though it was not clear that the deep bog had correspondingly lower acetoclasty:hydrogenotrophy rates (Figure 5).
Homoacetogenesis rates were lower in the shallow bog on day 0 than in any of the other sites, but the estimated rate increased over time in both the shallow and deep bog incubations achieving the highest homoacetogenesis rate of any of the sites by day 50 (Figure 4). Consistent with this finding, the relative abundance of genus-level homoacetogens in the bog incubations also increased over time (Figure 4). Paucity of data precluded a statistical analysis of this correlation but there was a visual correlation between homoacetogen abundances and modeled rate distributions (Figure 4).
Non-fractionating CO2 production was low in the bog incubations compared to the collapsed-palsa incubations and was near zero throughout the deeper bog incubations (Figure 4). But, over the course of the shallow bog incubations, rates of non-fractionating CO2 production increased and acetoclastic methanogenesis rates decreased such that the proportion of CO2 produced by non-fractionating mechanisms increased over time (Figure 4). This is the only incubation where there was an increase in non-fractionating CO2 production. In all other incubations the proportion of CO2 produced by non-fractionating mechanisms was relatively stable or declined over time (Figure 4). Despite this increase in non-fractionated CO2 production, the ratio of CO2:CH4 production in incubations with material from both bog depths was relatively stable over time, although it was higher in the shallow bog incubation compared to the deep bog incubation (Figure 8) indicating that the increase in non-fractionating CO2 production was offset by a decrease in methanogenesis rates.
In the shallow bog archaeal community, the hydrogenotrophic methanogens increased in abundance over time and the acetoclastic methanogens decrease (Figure 4) consistent with the overall modeled decline in acetoclasty:hydrogentrophy over time (Figure 5). The increasing rates of homoacetogenesis over time in the bog incubations was in agreement with the increasing relative abundance of homoacetogens observed over time in the bog incubations (Figure 4).
Fen Results
The fen incubation had the highest estimated rate of methanogenesis of any of the sites (Figure 4). In the fen, even more than in the bog, acetoclastic methanogenesis dominated over hydrogenotrophic methanogenesis (Figure 6) although hydrogenotrophy increased over time (Figure 5). Concurrent with the rates of acetoclasty, the fen had the highest proportion of acetoclastic methanogens of any of the sites; yet the proportion of acetoclasts:hydrogenotrophs decreased during incubation from >0.20 on day 0 to just 0.12 on day 50 (Figure 5). This decrease in acetoclasts coincided with an overall decline in the estimated ratio of acetoclasty:hydrogenotrophy rates over time (Figure 5).
Estimated rates of homoacetogenesis in the fen incubation were similar to the other sites and remained fairly constant over time (Figure 4). There was no increase in homoacetogen abundance in the fen incubations over time. While the abundance of homoacetogens was highest on day 25, the relative abundance declined over time such that over the 50 days of incubation, homoacetogen abundances stayed constant or declined only slightly (Figure 4). The ratio of non-fractionating CO2 in the fen incubation, and consequently the CO2:CH4 ratio, was the lowest of any incubation suggesting the fen was the most methanogenic of the sites (Figures 4, 8). The ratio of CO2:CH4 produced in the fen incubations declined slightly over time from 1.25 to approaching the predicted 1:1 ratio consistent with a methanogenic steady-state (Figure 8).
Discussion
Microbial Results Inform Model Choice
Quantifying rates of greenhouse gas (such as CO2 and CH4) production is useful for understanding the C budgets of peatlands and the changes induced by global and environmental change. Additionally, correctly accounting the factors that alter isotopic distributions in CO2 and CH4 will better constrain modeling efforts based on isotope mass balance (e.g., Corbett et al., 2012; McCalley et al., 2014; Neumann et al., 2016) as well as improve global inverse models (e.g., Houweling et al., 2017). All variants of the reaction rate model we applied to model CO2 and CH4 production pathways and rates account for the isotopic fractionation that occurs as microorganisms process organic material into CO2 and CH4. Since all four model variants converged (i.e., a solution was found for all 4 model variants), all of the model variants were mathematically plausible and all five pathways (acetoclasty, hydrogenotrophy, homoacetogenesis, CH4 oxidation, and non-fractionating CO2 production) are plausibly utilized in wetland systems to some degree. Given the similarity in rate results among the four models, and since it was not possible to mathematically choose the best variant to model these data, we used the microbial data to help inform the best model variant for inferring whether homoacetogenesis and CH4 oxidation were occurring among the different habitats.
Mathematically, under methanogenic conditions, homoacetogenesis should not ultimately affect net radiative forcing because homoacetogenesis increases the production of acetate which should, in turn, stimulate the relative proportion of the acetoclastic pathway relative to the hydrogenotrophic CH4 production pathway. However, the net ratio of CO2:CH4 production should be the same whether homoacetogenesis occurs or not (see equations 1–4). In our models we observed this most strongly in the collapsed palsa (both depths) and the bog 8–18 cm incubations where model variants that included homoacetogenesis (variants 1 and 2) had higher acetoclasty:hydrogenotrophy rates than model variants that excluded homoacetogenesis (Figure 5). In the incubations of the deeper bog and fen peat, differences among the model variants were much less pronounced (Figure 5) while the CO2:CH4 ratios were similar among all model variants except in the case of the collapsed palsa where the variant that included both homoacetogenesis and CH4 oxidation had the highest CO2:CH4 ratio after 25 days of incubation (Figure 8). Given the temperature sensitivity of homoacetogenesis (Ye et al., 2012), it is possible that homoacetogenesis may be disproportionally sensitive to temperature potentially leading to mechanistic shifts in CO2 and CH4 production with climate warming that may alter the ecosystem net radiative forcing. Thus, understanding the importance of homoacetogenesis as well as the subsequent fermentation of acetate produced in this way is a critical gap in understanding CO2 and CH4 production dynamics. This is especially true in peatlands because more fully thawed habitats (e.g., fens) tend to utilize more acetate in the production of CH4 than the collapsed palsa and bogs. This trend has been observed at this and other peatlands spanning different continents (Corbett et al., 2012; Tfaily et al., 2013; Hodgkins et al., 2014) and is exemplified in our incubations by the lower acetoclasty:hydrogenotrophy ratios in the bogs and collapsed palsa relative to the fen (Figure 5).
Rates of CH4 production in the incubations increased along the thaw gradient consistent with observations from field CH4 fluxes (e.g., McCalley et al., 2014). There was also an increase in total methanogen abundance from palsa to bog to fen (Figure 6). As expected, we found microbial evidence of both hydrogenotrophic and acetoclastic methanogens. There are seven known orders of methanogens within the phylum Euryarchaeota, of which, five were identified in our samples: Methanomicrobiales, Methanobacteriales, Methanocellales, Methanosarcinales, and Methanomassiliicoccales (Vanwonterghem et al., 2016) (Figure 3). The first three are only known to produce CH4 via the hydrogenotrophic pathway. The fourth order, Methanosarcinales, is acetoclastic, however, only the genus Methanosaeta is obligately acetoclastic while Methanosarcina can perform both hydrogenotrophic and acetoclastic methanogenesis under favorable conditions. The fifth order, Methanomassiliicoccales, is a methylotrophic methanogen that has been observed at low abundance in the field at the fen site (Mondav et al., 2017; Woodcroft et al., 2018). The methanogen community was dominated by hydrogenotrophs in all incubations, with the collapsed palsa being almost exclusively hydrogenotrophic and an increasing presence of acetoclastic methanogens across the thaw gradient. The higher abundance of acetoclasts in the fen environment is consistent with observations at other peatlands that fens, with their more microbially available organic material generally have higher rates of acetoclastic methanogenesis than adjacent bogs (e.g., Chanton et al., 2008).
The presence of aerobic CH4 oxidizers in the community profiles likely represents inactive community members awaiting reinstatement of oxic condition such as might occur in the field through water table fluctuations or intrusion of sedge roots. Although not conclusive, we have also failed to find an appropriate inorganic terminal electron acceptor to support CH4 oxidation if it is occurring. Organic matter itself serves as an electron acceptor for microbial respiration in a variety of aquatic environments including peatlands, but the exact mechanism or extent to which this occurs is poorly understood (Lovley et al., 1996; Coates et al., 2002; Kappler et al., 2004; Keller et al., 2009; Roden et al., 2010; Smemo and Yavitt, 2011; Keller and Takagi, 2013; Tfaily et al., 2013, 2014; Wilson et al., 2017b). Porewater sulfate is below detection while nitrate (Hodgkins pers comm) and iron (Chanton unpublished data) concentrations are typically sub-millimolar to below detection limits in the field at these sites. Additionally, the pre-incubation period in our experiment is sufficient to reduce any small amounts of inorganic TEAs that may have been present before the start of the incubations (Ye et al., 2012). This coupled with the dearth of ANME-1,-2,-3 and Methylomirabilis is inconsistent with a significant contribution of anaerobic methane oxidation in our experiments. Based on these considerations, we eliminated model variants that included CH4 oxidation.
We did find evidence of putative homoacetogens in the microbial analyses at both the genus and family level. While homoacetogenesis is not well-conserved and therefore inferences about homoacetogenic activity based purely on taxonomic similarity are tenuous, we generally observed good agreement between changes in genus-level homoacetogen abundances and variability in rate results in all incubations (Figure 4) suggesting that in this system, taxonomic similarity usefully identified putative homoacetogens.
Based on the microbial data indicating that homoacetogenesis could occur in the samples, but that anaerobic CH4 oxidation was unlikely, we chose variant 2, which included all reactions except CH4 oxidation, as the best variant to describe differences in rates across the thaw gradient. Thus, the microbial data allowed us to eliminate potential reactions from the modeling network when geochemical data could not distinguish among the different variants.
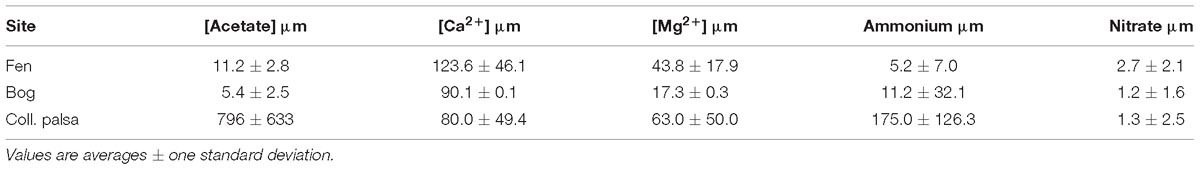
Table 2. Acetate and nutrient concentrations in porewater from Hodgkins (2016).
Model Variant 2 Describes Changes Across the Thaw Gradient
Collapsed Palsa
Peat in permafrost settings is elevated into palsas above the surrounding landscape by ice expansion and accretion. When the supporting ice thaws and drains, the palsa collapses and frequently floods creating a heavily inundated thaw feature. This collapse results in an abrupt transition from elevated aerobic conditions in the surface of the palsa, to depressed inundated, anaerobic conditions in the resulting surface peat. Thus, permafrost collapse features may best be understood in the context of other early stage organic-rich organic environments (such as landfills) (Tchobanoglous and Kreith, 2002). In our collapsed palsa site, acetate concentrations were the highest of any of the thaw features (Table 2). This may reflect an early acid-phase as is seen in other early stage anaerobic environments such as covered landfills or lake sediments (Burdige, 2006). The identification of these processes as “acid phase” is supported by the increasing rates of both acetoclastic and hydrogenotrophic methanogenesis over time in the collapsed palsa incubations after day 20 (Figure 4) and the decline in CO2:CH4 production rates (Figure 8) suggesting that the system was becoming increasingly methanogenic as the incubations progressed, possibly due to the depletion of microbially available organic polysaccharides and the resulting build-up of acetate. Concomitantly, excess non-fractionated CO2 (e.g., heterotrophic respiration products) decreased over time suggesting declining fermentation rates.
Initially, homoacetogenesis rates in the collapsed palsa were greater than hydrogenotrophic methanogenesis rates, but this ratio declined over time, until the last time point when hydrogenotrophic methanogenesis rates were greater than homoacetogenesis in the shallow collapsed palsa (Figure 4). This finding was similar to results observed by Ye et al. (2014) for other peatlands and was interpreted to indicate direct competition for H2 between homoacetogens and hydrogenotrophs. Our results differ from Ye et al. (2014) in that, while hydrogenotrophy became increasingly important relative to homoacetogenesis over time, the absolute rates of both processes also increased over time after day 20. The high homoacetogenesis rates in the collapsed palsa incubation may suggest that the partial pressure of H2 was elevated (Ye et al., 2014) allowing homoacetogens to effectively compete with hydrogenotrophic methanogens for substrate. If this dynamic is reflective of that occurring in the field at the collapsed palsa site, such elevated H2 could contribute to the high levels of acetate found at this habitat (Table 2), and also suggests that something may be inhibiting acetoclastic methanogenesis which was very low compared to the other habitat types (Figure 4). Ye et al. (2014) suggested that declining fermentation rates resulted in a decrease in both acetate and H2 production which limited both homoacetogenesis and hydrogenotrophic methanogenesis. The increase in the rates of both reactions as well as the increase in homoacetogens throughout our incubations, however, cannot be easily reconciled with this interpretation. Instead, we infer, that the declining excess of non-fractionated CO2 over time in our incubations supported increasing rates of hydrogenotrophic methanogenesis, which also drew down excess H2 concentrations. At some point (i.e., approximately 35 days) the H2 concentrations were low enough that hydrogenotrophy outcompeted homoacetogenesis rates and after that shift, the peats became increasingly methanogenic.
Microbial abundances and productions rates do not always correlate strongly (e.g., collapsed palsa 28–38 cm Figure 4). This may reflect that the microbial community is not comprehensively and exhaustively characterized. For example, large portions of the microbial community have not been isolated in pure culture in the laboratory and their function is unknown, or microorganisms which are classified as homoacetogens may also be able to generate methane acetoclastically even if this activity has not been documented under laboratory culture conditions. Additionally, some microorganisms may alter their activity depending on environmental conditions such as homoacetogens which reverse the reaction to produce CO2 under certain thereby actually decreasing acetogenesis rates (Pierce et al., 2008). Taken on their own, neither the geochemical data nor the microbial data is capable of fully explaining the system, when considered as complementary data, however, a clearer picture of CO2 and CH4 production dynamics emerges.
Sphagnum-Dominated Bog
At Stordalen Mire, the intermediate stage of peatland permafrost thaw is characterized by a Sphagnum-dominated bog feature. This site is elevated relative to the collapsed palsa but still below intact palsa such that the surface of the peat is intermittently inundated. The surface peat at these sites is influenced by the oscillating water table that alters O2 availability over time, and the release of sphagnum acid from the moss that reduces the pH and inhibits microbial activity. In contrast to the collapsed palsa, the estimated rates of acetoclastic methanogenesis in the bog were higher than that for hydrogenotrophic methanogenesis at all time points. This result is in contrast to what was estimated in the field from isotopic mass balance of chamber flux measurements (McCalley et al., 2014), wherein McCalley et al. (2014) concluded that the bog was dominated by hydrogenotrophic methanogenesis. The difference between our calculations and those by McCalley et al. (2014) possibly occurred because we included fractionation from homoacetogenesis in our rate modeling which McCalley et al. (2014) did not. Consistent with this is the higher acetoclasty:hydrogenotrophy ratios in our model variants which included homoacetogenesis in the bog 8-18 cm incubation (Figure 5). However, the ratio of acetoclasty to hydrogenotrophy in the bog incubation was always lower than in the fen incubation, consistent with field findings that hydrogenotrophy was relatively more important in the bog than in the fen (Figure 5). However, in our study, the estimated acetoclasty to hydrogenotrophy ratio in the bog incubation declined over time as did the ratio of acetoclastic to hydrogenotrophic methanogens suggesting that the bog incubations were becoming more hydrogenotrophic over time. The shift from acetoclastic to more hydrogenotrophic methanogenesis is consistent with thermodynamic considerations that acetoclastic methanogenesis is more energy yielding than hydrogenotrophic methanogenesis (at standard conditions, Conrad, 1999) thus rates of hydrogenotrophy increase after more energetic pathways have been exhausted. Measured acetate levels in the bog are low: 5–9 μM (Table 2), which is at the lower limit of what is considered the threshold for acetate uptake even for the acetoclastic methanogens in Methanosaeta (Griffin et al., 1998), thus we suggest that as the incubations progressed, the organic matter became more decomposed, acetoclasty became substrate limited and diagenesis proceeded through the next energetically favorable reaction (i.e., CO2 reduction).
In addition to substrate limitation, the declining ratios of acetoclasty:hydrogenotrophy and corresponding declines in acetoclast:hydrogenotroph abundance in the bog (Figures 5, 6) could indicate inhibition of acetoclastic methanogens in the bog. For example, the acetoclastic methanogen genus Methanosaeta (which was least abundant in the bog) is inhibited by ammonia, high concentrations of VFAs (Karakashev et al., 2006), and glycine (Sherwood, 1972), the latter thought to occur by the competitive uptake of Ca2+ (Sherwood, 1972). Ammonia concentrations are higher in the bog than in the fen, while Ca2+ concentrations are lower (Table 2), possibly indicating inhibition of Methanosaeta in the bog relative to the other sites.
Fen
Fens are typically considered the most mature thaw features at Stordalen Mire (Hodgkins et al., 2014). They are characterized by high water table and the predominance of sedge vegetation. Sedges are important conduits for conducting gasses between anaerobic peat depths and the atmosphere. They can transport O2 to otherwise oxygen-depleted depths possibly promoting CH4 oxidation and allowing CH4 and CO2 to transit directly to the atmosphere (e.g., Chanton, 1991; Whiting and Chanton, 1993; Bhullar et al., 2013). The closed incubations that we used in our study, however, prevent CH4 loss and so the influence of vegetation as a conduit was controlled for in this experiment. However, differences in the microbial availability of organic matter deposited by sedge vegetation versus Sphagnum mosses still remains. Estimated rates of CH4 production were highest in the fen incubations compared to the other habitat types, consistent with previous incubation studies (Hodgkins et al., 2014, 2015) and field observations of habitat emissions (McCalley et al., 2014). While the modeled rates of hydrogenotrophic methanogenesis in the fen were higher than the other sites, the fen incubations also had much higher rates of acetoclasty than the other sites (3–4 times higher during some phases of the incubations), such that the acetoclasty:hydrogenotrophy ratio was highest in the fen of all the sites (Figure 5). This is consistent with observations from other peatlands that the more biologically available organic matter in fens stimulates acetoclastic methanogenesis (Chanton et al., 2008).
Metagenomic analyses of the microbial carbon degradation capacity in the field at this same site, has indicated that not only does the fen have 2–3 times more microbial biomass per g of peat relative to the other habitats, but that the fen also has the most diverse range of microorganisms capable of degrading polysaccharides (the first step in cellulose decomposition) (Woodcroft et al., 2018). While there are still more hydrogenotrophs than acetoclasts in the fen, the fen does have the highest abundance of acetoclasts of all the sites (Figure 6). One possible explanation for the apparent discrepancy between the microbial abundances and the modeled rates is that all microbial acetoclasts and hydrogenotrophs may not yet be comprehensively and exhaustively characterized. There may exist microorganisms accomplishing either of these reactions that have not yet been discovered or microorganisms that have been characterized as hydrogenotrophic may also be able to produce methane acetoclastically, but that function has not yet been documented. However, there have been previous extensive metagenomic studies conducted at our field site from which metagenome-assembled genomes for methanogens, including deeply branching lineages were assembled (Supplementary Table S2; Mondav et al., 2014; Woodcroft et al., 2018). Given this extensive characterization, it is unlikely that there are large numbers of previously undescribed acetoclasts at the site. Alternatively, the mismatch between microbial abundances and reaction rates may have a thermodynamic explanation. Under the non-standard conditions of our experiment, it is possible that high CO2, H2 and or low acetate concentrations (e.g., see bog and fen concentrations Table 2) may create conditions under which hydrogentrophic methanogenesis actually becomes more energetically favorable than acetoclasty. While, at standard conditions, acetoclasty is a higher energy yielding reaction than hydrogenotrophy (on a mol per mol basis), at high CO2, H2, and/or low acetate concentrations (e.g., see bog and fen Table 2) hydrogenotrophy can become more energy yielding thereby favoring the proliferation of hydrogenotrophic methanogens and forcing acetoclasts to produce CH4 at higher rates to fulfill the same energy demands. Additionally, methanogens may simply be poorly characterized and some putative hydrogenotrophs may actually be capable of disproportionating acetate as well. For example, Methanosarcina are capable of acetoclastic methanogenesis, but they can also produce CH4 via hydrogenotrophy. On the other hand, Methanosaeta are considered obligate acetoclasts (Karakashev et al., 2006) and their exclusive presence in the fen is consistent with the high rates of acetoclasty estimated for the fen incubation relative to the others incubations (Figure 4).
Although hydrogenotrophic CH4 production was once observed in a culture of Methanosaeta via direct interspecies electron transfer from Geobacter metallireducens to Methanosaeta harundinacea, which allowed the reduction of CO2 (Rotaru et al., 2014), the Rotaru et al. (2014) study is the only observation of such a process, and in our incubations, there was a near-zero abundance of Geobacter spp. Methanosaeta have lower threshold acetate requirements than Methanosarcina (5–20 μM vs. 1 mM) and are only known to outcompete Methanosarcina at low acetate concentrations (Griffin et al., 1998). Thus, the low acetate concentrations in the fen (11.0 ± 2.8 μM) may have allowed Methanosaeta to compete under the conditions of the fen habitat. The estimated ratio of hydrogenotrophy to homoacetogenesis was consistently high in the fen incubation suggesting that H2 concentrations were low. Excess unfractionated CO2 concentrations were also low, and CO2:CH4 production ratios approached 1, suggesting that the system was tending toward a methanogenic steady-state. In this way, the fen most closely approximates the theoretical thermodynamic limitation for TEA-depleted anaerobic cellulose degradation. Cumulatively our results suggest that the organic matter in the fen was the most microbially available of the three sites.
Changes Across the Thaw Gradient
There is evidence in the incubations that the collapsed palsa is not at a theoretical methanogenic steady-state (i.e., CO2:CH4 did not = 1). The high CO2:CH4 ratio in this habitat (Figure 8) suggests that the rate of fermentation is in excess of methanogenesis. High rates of fermentation without subsequent methanogenesis would lead to increased H2(aq) which in turn would favor homoacetogens (Weimer, 1998; Drake et al., 2006; Ye et al., 2014) explaining the high rates of homoacetogenesis in this habitat type. However, the rates shifted over time such that by the end of the incubations, hydrogenotrophic methanogenesis started to dominate over homoacetogenesis (Figure 5). These results suggest that initially there were organic electron acceptors present in the collapsed palsa incubations that got used up over the course of the incubations. As respiration rates declined, the rates of both methanogenesis pathways gradually increase in the incubations. This trend is consistent with an exhaustion (titration) of organic electron acceptors and a switch to a more methanogenic system. Without a mechanism for re-oxidation, eventually all terminal electron acceptors in a system will become exhausted—except for CO2 which is produced during anaerobic fermentation. Thus, any reaction pathway in these closed, anaerobic incubations other than CO2 reduction is ultimately unsustainable and the system will tend toward methanogenesis. Once all of the other terminal electron acceptors have been reduced, methanogenesis rates must balance fermentation, because fermentation is self-limiting, i.e., the build-up of fermentation products thermodynamically inhibits further fermentation from occurring. In this way, the incubations of the collapsed palsa were reflecting the transition from an acid-phase-dominated (production of electron-rich hydrocarbons, e.g., butyrate, propionate, etc.) environment into the early-stage methanogenic conditions that will dominate the subsequent thaw features.
In the shallow bog incubation, there was always more CO2 produced than could be accounted for by methanogenesis alone (i.e., CO2:CH4 > 1 Figure 8) suggesting the occurrence of alternative electron acceptors or that the bog, also, was not yet at steady-state (i.e., still in the acid phase). Over the course of the incubations, acetoclastic methanogenesis (particularly at 8–18 cm) decreased slightly corresponding to an increase in the non-fractionated CO2 production over time (Figure 4). Together, these results suggest that fermentation in the shallow bog incubation was slowed relative to the fen which had already progressed through the fermentation-dominated acid phase and was approaching a methanogenic steady-state. The slowing of fermentation that held the bog in the acid phase possibly resulted from the action of Sphagnum-derived acids, which are thought to inhibit the microorganisms responsible for breaking down complex cellulose into the substrates needed for fermentation (Woodcroft et al., 2018).
In the fen incubation, the estimated CO2:CH4 ratio declined slightly but it was relatively stable near the predicted 1:1 ratio consistent with the fen being at methanogenic steady-state. The fen feature is similar to the collapsed palsa feature in that it is fully inundated and it has an abundance of sedge vegetation, fens develop as the active layer deepens over time (more thawing) and eventually the feature floods becoming fully inundated and connected with the surrounding water table. Thus, the fen is a more mature thaw feature than the collapsed palsa. Over time the collapsed palsa incubations proceed through the acid phase and toward the end of the incubations, approach methanogenic steady state, whereas the more mature fen material had already achieved this steady state by the start of the incubations. We suggest this progression through the acid-phase as a possible conceptual model for the field thaw transition: the newly thawed immature collapse features have high fermentation and homoacetogenesis rates as fresh organic material is suddenly subjected to anaerobic conditions. The excess substrate is rapidly depleted, however, and eventually, in the absence of other TEAs or further inputs, the system progresses toward a methanogenic steady-state as the thaw site matures. This would suggest that upon thawing initially there may be a rapid release of CO2 coincident with the high fermentation rates, but over time (decadal timescale) there will be a shift toward increasingly methanogenic conditions. Because CO2 and CH4 have very different global warming potentials, the implications of this is that models may need to account for maturity of the thaw feature when estimating climate forcing.
How Does Model Variant Choice Influence the Conclusions?
The differences in the rates among the various modeling variants were subtle and overall trends across the thaw gradient discussed above remain unchanged regardless of the model variant choice. The collapsed palsa had the highest estimated CO2:CH4 ratio and the fen had the lowest estimate CO2:CH4 ratio, regardless of the model variant chosen. The relative importance of acetoclasty increased across the thaw gradient regardless of model variant. Finally, CO2:CH4 decreased across the thaw gradient in all variant conditions. Thus, the overall conclusions regarding the stages of anaerobic decomposition and relative bioavailability of organic matter are ultimately unaffected by the model variant choice. However, including homoacetogenesis decreased the relative importance of hydrogenotrophy compared to acetoclasty and somewhat increased the excess unfractionated CO2 production. This change has implications for estimating CO2 and CH4 production dynamics from isotope mass balance approaches in the field where, unlike in a closed incubation bottles, methane can easily escape from porewater and complicate rate estimations. In Neumann et al. (2016), inclusion of homoacetogenesis shifted the estimated acetoclastic:hydrogenotrophy methanogenesis pathway ratio from ∼1 to ∼3 for a thermokarst bog in Interior Alaska when the models allowed for ‘fugitive methane’ or the loss of methane from porewater. Excluding homoacetogenesis from field-based microbial reaction network models results in an increase in the estimation of hydrogenotrophy relative to acetoclastic methanogenesis.
Our modeling results suggested that acetoclasty dominated in the early period of the incubations in particular in the modeling variants that included homoacetogenesis. This is in contrast to previous reports that hydrogenotrophic methanogenesis dominates in situ methane production in the bog (McCalley et al., 2014), however, in situ measurements did not consider the fractionating effect of homoacetogenesis when using carbon stable isotopes to infer pathways. Similar results to McCalley et al. (2014) suggesting the dominance of hydrogenotrophy in bogs abound outside of Stordalen as well (e.g., Chanton et al., 1995; Chasar et al., 2000; Duddleston et al., 2002; Galand et al., 2005; Keller and Bridgham, 2007; Corbett et al., 2012; Zalman et al., 2018). The trade-off between homoacetogenesis and hydrogenotrophy in our model suggests that previous efforts could have overestimated the importance of hydrogenotrophic methanogenesis through an inadequate accounting of the isotopic fractionation introduced by homoacetogenesis. Understanding all of the microbial mechanisms contributing to isotopic fractionation is important for modeling efforts aimed at understanding environmental change, since each mechanism may be accomplished by different microbial consortia that may respond differently to increasing temperature, drought, or changing oxidation conditions.
Conclusion
Estimating microbial rates based purely on CO2 and CH4 concentrations and isotopes could not alone distinguish between multiple reaction network variants. Neumann et al. (2016) similarly could not distinguish among model variants when calculating in situ CO2 and CH4 production rates in Alaska where the fugitive CH4 term was unknown, but assumed to be large. Using closed incubations, where there is no fugitive CH4 term, we were hoping to better constrain the reaction network. While there were small differences in the rates of modeled reactions among variants, these differences were not enough to identify a single best variant. The result is that all reaction networks are equally mathematically plausible. However, by coupling the modeling results with an analysis of the microbial community, we were able to narrow the choices. Because the microbial community suggested homoacetogens were abundant, while CH4 oxidizers were absent, we were able to identify the variant including homoacetogenesis and excluding CH4 oxidation as the most plausible for modeling our incubations. We then used the results from this variant to describe differences in OC decomposition across the thaw gradient. Our coupled approach revealed a progression across the thaw gradient both in terms of the stage of anaerobic decomposition as well as the microbial availability of the organic matter. The earliest thaw stage, the collapsed palsa, had typical early acid-phase anaerobic decomposition with the production of excess CO2 and acetate coupled with high rates of homoacetogenesis. Conditions in the bog appeared to be further along the methanogenic diagenetic gradient but were limited by the biological availability of the available organic matter. Thus, there was a shift over time from acetoclastic toward more hydrogenotrophic methanogenesis. Excess unfractionated CO2 production (in the shallow bog) was higher than expected for a purely methanogenic system consistent with hydrogenation of the aromatic acids released from Sphagnum which would lower H2(aq) without producing CH4 (e.g., Wilson et al., 2017b). The fen had the highest rates of acetoclasty and a nearly 1:1 ratio of CO2:CH4 production suggesting that the fen had the most microbially available organic matter and was nearest a methanogenic steady-state.
As permafrost peatlands thaw, changes in both the dominant vegetation and the geochemical conditions result in changing CO2 and CH4 production dynamics. Cumulatively, our results suggest that upon permafrost thawing there may be an initial rapid release of CO2, but that as the system transitions toward increasingly warm wet habitat, there is a concomitant shift from CO2 to CH4 production. Because of the different global warming potentials of these two products (CO2 and CH4) the implication of this finding is that models may need to account for maturity of the thaw feature when estimating climate forcing.
Homoacetogenesis, which is typically ignored in peatlands, appears from both the microbiology and the rate modeling results to be a critical pathway for CO2 consumption. Ignoring this reaction, which alters the isotopic signature of the CO2 (Neumann et al., 2016), leads to overestimation of the importance of hydrogenotrophic methanogenesis by isotopic mass balance models. Because hydrogenotrophy is the least energetic pathway in anaerobic C degradation, it may be the most sensitive to temperature variation, thus overestimating this pathway may lead to erroneous conclusions regarding the sensitivity of the system to climate warming. Alternatively, warmer temperatures may shift the thermodynamics of the system to favor hydrogenotrophy over homoacetogenesis (Ye et al., 2014) exacerbating the warming effects of CH4 production. Additional work applying this reaction network model in the field and integrating it further with microbial analyses will be key to fully elucidating the critical C cycling pathways and understanding the feedbacks between thawing permafrost landscapes and the atmosphere.
Data Availability
All data is publicly available via the IsoGenie database (https://isogenie-db.asc.ohio-state.edu/). The raw data and MATLAB code for the model supporting the conclusions of this manuscript will be made available by the authors, without undue reservation, to any qualified researcher.
Author Contributions
RW and JC conceived the experiments, contributed to model development, analyzed the data, and drafted the manuscript. RN conceived the experiments, developed and interpreted model results, and contributed to manuscript writing. BW, KC, and NR analyzed microbial data and contributed to writing the manuscript. SH conducted geochemical analyses and contributed to writing the manuscript. SS conceived the experiments and contributed to the manuscript. BB and BW analyzed and interpreted microbial data. GT and VR conceived the experiments, analyzed and interpreted microbial data, and contributed to the manuscript.
Funding
This work was supported, in part by the Genomic Science Program of the United States Department of Energy, Office of Science, Office of Biological and Environmental Research, grants DE-SC0010580 and DE-SC0016440 to VR, SS, JC, and GT, and by grant DE-SC0010338 to RN. Additional support was provided by the Genomic Science Program of the United States DOE Office of Biological and Environmental Research, grants DE-SC0010580 and DE-SC0016440. A portion of the research was performed using the Environmental Molecular Sciences Laboratory (EMSL) (EMSL proposal ID 48467) a DOE Office of Science User Facility and a further portion was performed under the Facilities Integrating Collaborations for User Science (FICUS) initiative (EMSL proposal ID 49521) with resources at the EMSL and the DOE Joint Genome Institute a second DOE Office of Science User Facility. Both facilities are sponsored by the Office of Biological and environmental Research and operated under contract numbers DE-AC02-05CH11231 (JGI) and DE-AC05-76RL01830 (EMSL).
Conflict of Interest Statement
The authors declare that the research was conducted in the absence of any commercial or financial relationships that could be construed as a potential conflict of interest.
Acknowledgments
We would like to thank L. Claire Wilson for analytical assistance and Dylan Cronin for assistance with copy number correction of the 16S microbial data.
Supplementary Material
The Supplementary Material for this article can be found online at: https://www.frontiersin.org/articles/10.3389/feart.2019.00059/full#supplementary-material
References
Angly, F. E., Dennis, P. G., Skarshewski, A., Vanwonterghem, I., Hugenholtz, P., and Tyson, G. W. (2014). Copyrighter: a rapid tool for improving the accuracy of microbial community profiles through lineage-specific gene copy number correction. Microbiome 2:11. doi: 10.1186/2049-2618-2-11
Bäckstrand, K., Crill, P. M., Jackowicz-Korczynski, M., Mastepanov, M., Christensen, T. R., and Bastviken, D. (2010). Annual carbon gas budget for a subarctic peatland, Northern Sweden. Biogeosciences 7, 95–108. doi: 10.5194/bg-7-95-2010
Bhullar, G. S., Iravani, M., Edwards, P. J., and Venterink, H. O. (2013). Methane transport and emissions from soil as affected by water table and vascular plants. BMC Ecol. 13:32. doi: 10.1186/1472-6785-13-32
Blaser, M. B., Dreisbach, L. K., and Conrad, R. (2013). Carbon isotope fractionation of 11 acetogenic strains grown on H2 and CO2. Appl. Environ. Microbiol. 79, 1787–1794. doi: 10.1128/AEM.03203-12
Botz, R., Pokojski, H.-D., Schmitt, M., and Thomm, M. (1996). Carbon isotope fractionation during bacterial methanogenesis by CO2 reduction. Organ. Geochem. 25, 255–262. doi: 10.1016/S0146-6380(96)00129-5
Chanton, J. (1991). “Effects of vegetation on methane flux, reservations, and carbon isotopic composition,” in Trace Gas Emissions from Plants, eds T. D. Sharkey and E. A. Holland (San Diego, CA: Academic), 65–92.
Chanton, J. P., Bauer, J. E., Glaser, P. A., Siegel, D. I., Kelley, C. A., Tyler, S. C., et al. (1995). Radiocarbon evidence for the substrates supporting methane formation within northern Minnesota peatlands. Geochim. Cosmochim. Acta 59, 3663–3668. doi: 10.1016/0016-7037(95)00240-Z
Chanton, J. P., Glaser, P. H., Chasar, L. S., Burdige, D. J., Hines, M. E., Siegel, D. I., et al. (2008). Radiocarbon evidence for the importance of surface vegetation on fermentation and methanogenesis in contrasting types of boreal peatlands. Global Biogeochem. Cycles 22. doi: 10.1029/2008GB003274
Chasar, L. S., Chanton, J. P., Glaser, P. H., Siegel, D. I., and Rivers, J. S. (2000). Radiocarbon and stable carbon isotopic evidence for transport and transformation of dissolved organic carbon, dissolved inorganic carbon, and CH4 in a northern Minnesota peatland. Glob. Biogeochem. Cycles 14, 1095–1108. doi: 10.1029/1999GB001221
Coates, J. D., Chakraborty, R., and McInerney, M. J. (2002). Anaerobic benzene biodegradation—a new era. Res. Microbiol. 153, 621–628. doi: 10.1016/S0923-2508(02)01378-5
Conrad, R. (1999). Contribution of hydrogen to methane production and control of hydrogen concentrations in methanogenic soils and sediments. FEMS Microbiol. Ecol. 28, 193–202. doi: 10.1111/j.1574-6941.1999.tb00575.x
Conrad, R., Bak, F., Seitz, H. J., Thebrath, B., Mayer, H. P., and Schütz, H. (1989). Hydrogen turnover by psychrotrophic homoacetogenic and mesophilic methanogenic bacteria in anoxic paddy soil and lake sediment. FEMS Microbiol. Lett. 62, 285–293. doi: 10.1111/j.1574-6968.1989.tb03382.x
Conrad, R., and Wetter, B. (1990). Influence of temperature on energetics of hydrogen metabolism in homoacetogenic, methanogenic, and other anaerobic bacteria. Arch. Microbiol. 155, 94–98. doi: 10.1007/BF00291281
Corbett, J. E., Burdige, D. J., Tfaily, M. M., Dial, A. R., Cooper, W. T., Glaser, P. H., et al. (2013). Surface production fuels deep heterotrophic respiration in Northern Peatlands. Glob. Biogeochem. Cycles 27, 1163–1174. doi: 10.1002/2013GB004677
Corbett, J. E., Tfaily, M. M., Burdige, D. J., Cooper, W. T., Glaser, P. H., and Chanton, J. P. (2012). Partitioning pathways of CO2 production in peatlands with stable carbon isotopes. Biogeochemistry 114, 327–340. doi: 10.1007/s10533-012-9813-1
Corbett, J. E., Tfaily, M. M., Burdige, D. J., Glaser, P. H., and Chanton, J. P. (2015). The relative importance of methanogenesis in the decomposition of organic matter in northern peatlands. J. Geophys. Res. Biogeosci. 120, 280–293. doi: 10.1002/2014jg002797
Diekert, G., and Wohlfarth, G. (1994a). “Energetics of acetogenesis from C 1 units,” in Acetogenesis, ed. H. L. Drake (Boston, MA: Springer), 157–179.
Diekert, G., and Wohlfarth, G. (1994b). Metabolism of homoacetogens. Antonie van Leeuwenhoek 66, 209–221. doi: 10.1007/BF00871640
Drake, H., Küsel, K., and Matthies, C. (2013). “Acetogenic prokaryotes,” in The Prokaryotes, eds E. Rosenberg, E. DeLong, S. Lory, E. Stackebrandt, and F. Thompson (Berlin: Springer), 3–60.
Drake, H. L., Gößner, A. S., and Daniel, S. L. (2008). Old acetogens, new light. Anna. N. Y. Acad. Sci. 1125, 100–128. doi: 10.1196/annals.1419.016
Drake, H. L., Küsel, K., and Matthies, C. (2006). “Acetogenic prokaryotes,” in The Prokaryotes, eds E. Rosenberg, E. F. DeLong, S. Lory, E. Stackebrandt, and F. Thompson (New York, NY: Springer), 354–420. doi: 10.1007/0-387-30742-7_13
Duddleston, K. N., Kinney, M. A., Kiene, R. P., and Hines, M. E. (2002). Anaerobic microbial biogeochemistry in a northern bog: acetate as a dominant metabolic end product. Glob. Biogeochem. Cycles 16, 1063–1064. doi: 10.1029/2001GB001402
Eikmanns, B., and Thauer, R. K. (1984). Catalysis of an isotopic exchange between CO2 and the carboxyl group of acetate by Methanosarcina barkeri grown on acetate. Arch. Microbiol. 138, 365–370. doi: 10.1007/BF00410905
Emerson, J. B., Roux, S., Brum, J. R., Bolduc, B., Woodcroft, B. J., Jang, H. B., et al. (2018). Host-linked soil viral ecology along a permafrost thaw gradient. Nat. Microbiol. 3, 870–880. doi: 10.1038/s41564-018-0190-y
Engelbrektson, A., Kunin, V., Wrighton, K. C., Zvenigorodsky, N., Chen, F., Ochman, H., et al. (2010). Experimental factors affecting PCR-based estimates of microbial species richness and evenness. ISME J. 4:642. doi: 10.1038/ismej.2009.153
Eppinga, M. B., De Ruiter, P. C., Wassen, M. J., and Rietkerk, M. (2009). Nutrients and hydrology indicate the driving mechanisms of peatland surface patterning. Am. Nat. 173, 803–818. doi: 10.1086/598487
Euskirchen, E. S., Bret-Harte, M. S., Scott, G. J., Edgar, C., and Shaver, G. R. (2012). Seasonal patterns of carbon dioxide and water fluxes in three representative tundra ecosystems in northern Alaska. Ecosphere 3, 1–19. doi: 10.1890/ES11-00202.1
Feisthauer, S., Vogt, C., Modrzynski, J., Szlenkier, M., Kruger, M., Siegert, M., et al. (2011). Different types of methane monooxygenases produce similar carbon and hydrogen isotope fractionation patterns during methane oxidation. Geochim. Cosmochim. Acta 75, 1173–1184. doi: 10.1016/j.gca.2010.12.006
Frolking, S., Roulet, N., and Fuglestvedt, J. (2006). How northern peatlands influence the Earth’s radiative budget: sustained methane emission versus sustained carbon sequestration. J. Geophys. Res. 111:G01008. doi: 10.1029/2005JG000091
Galand, P. E., Fritze, H., Conrad, R., and Yrjala, K. (2005). Pathways for methanogenesis and diversity of methanogenic archaea in three boreal peatland ecosystems. Appl. Environ. Microbiol. 71, 2195–2198. doi: 10.1128/AEM.71.4.2195-2198.2005
Games, L. M., Hayes, J. M., and Gunsalus, R. P. (1978). Methane-producing bacteria: natural fractionations of the stable carbon isotopes. Geochim. Cosmochim. Acta 42, 1295–1297. doi: 10.1016/0016-7037(78)90123-0
Gelwicks, J. T., Risatti, J. B., and Hayes, J. M. (1994). Carbon isotope effects associated with aceticlastic methanogenesis. Appl. Environ. Microbiol. 60,467–472.
Griffin, M. E., McMahon, K. D., Mackie, R. I., and Raskin, L. (1998). Methanogenic population dynamics during start-up of anaerobic digesters treating municipal solid waste and biosolids. Biotechnol. Bioeng. 57, 342–355. doi: 10.1002/(SICI)1097-0290(19980205)57:3<342::AID-BIT11>3.0.CO;2-I
Hines, M. E., Duddleston, K. N., Rooney-Varga, J. N., Fields, D., and Chanton, J. P. (2008). Uncoupling of acetate degradation from methane formation in Alaskan wetlands: connections to vegetation distribution. Glob. Biogeochem. Cycles 22:GB2017. doi: 10.1029/2006GB002903
Hodgkins, S. B. (2016). Changes in Organic Matter Chemistry and Methanogenesis Due to Permafrost Thaw in a Subarctic Peatland. Doctoral dissertation, The Florida State University, Tallahassee, FL.
Hodgkins, S. B., Chanton, J. P., Langford, L. C., McCalley, C. K., Saleska, S. R., Rich, V. I., et al. (2015). Soil incubations reproduce field methane dynamics in a subarctic wetland. Biogeochemistry 126, 241–249. doi: 10.1007/s10533-015-0142-z
Hodgkins, S. B., Tfaily, M. M., McCalley, C. K., Logan, T. A., Crill, P. M., Saleska, S. R., et al. (2014). Changes in peat chemistry associated with permafrost thaw increase greenhouse gas production. Proc. Natl. Acad. Sci. U.S.A. 111, 5819–5824. doi: 10.1073/pnas.1314641111
Hoehler, T. M., Albert, D. B., Alperin, M. J., and Martens, C. S. (1999). Acetogenesis from CO2 in an anoxic marine sediment. Limnol. Oceanogr. 44, 662–667. doi: 10.4319/lo.1999.44.3.0662
Holmes, M. E., Chanton, J. P., Tfaily, M. M., and Ogram, A. (2015). CO2 and CH4 isotope compositions and production pathways in a tropical peatland. Glob. Biogeochem. Cycles 29, 1–18. doi: 10.1002/2014GB004951
Houweling, S., Bergamaschi, P., Chevallier, F., Heimann, M., Kaminski, T., Krol, M., et al. (2017). Global inverse modeling of CH4 sources and sinks: an overview of methods. Atmospher. Chem. Phys. 17, 235–256. doi: 10.5194/acp-17-235-2017
Hugelius, G., Bockheim, J. G., Camill, P., Eberling, B., Grosse, G., Harden, J. W., et al. (2013). A new data set for estimating organic carbon storage to 3 m depth in soils of the northern circumpolar permafrost region. Earth Syst. Sci. Data 5, 393–402. doi: 10.5194/essd-5-393-2013
Johansson, T., Malmer, N., Crill, P. M., Friborg, T., Aakerman, J. H., Mastepanov, M., et al. (2006). Decadal vegetation changes in a northern peatland, greenhouse gas fluxes and net radiative forcing. Glob. Chang. Biol. 12, 2352–2369. doi: 10.1111/j.1365-2486.2006.01267.x
Jones, J. G., and Simon, B. M. (1985). Interaction of acetogens and methanogens in anaerobic freshwater sediments. Appl. Environ. Microbiol. 49, 944–948.
Jorgenson, M. T., Racine, C. H., Walters, J. C., and Osterkamp, T. E. (2001). Permafrost degradation and ecological changes associated with a warming climate in central Alaska. Clim. Chang. 48, 551–579. doi: 10.1023/A:1005667424292
Kappler, A., Benz, M., Schink, B., and Brune, A. (2004). Electron shuttling via humic acids in microbial iron (III) reduction in a freshwater sediment. FEMS Microbiol. Ecol. 47, 85–92. doi: 10.1016/S0168-6496(03)00245-9
Karakashev, D., Batstone, D. J., Trably, E., and Angelidaki, I. (2006). Acetate oxidation is the dominant methanogenic pathway from acetate in the absence of Methanosaetaceae. Appl. Environ. Microbiol. 72, 5138–5141. doi: 10.1128/AEM.00489-06
Kattsov, V. M., Källén, E., Cattle, H. P., Christensen, J., Drange, H., Hanssen-Bauer, I., et al. (2005). Future Climate Change: Modeling and Scenarios for the Arctic. Maynard, MA: ACIA.
Keller, J. K., and Bridgham, S. D. (2007). Pathways of anaerobic carbon cycling across an ombrotrophic-minerotrophic peatland gradient. Limnol. Oceanogr. 52, 96–107. doi: 10.4319/lo.2007.52.1.0096
Keller, J. K., and Takagi, K. K. (2013). Solid-phase organic matter reduction regulates anaerobic decomposition in bog soil. Ecosphere 4, 1–12. doi: 10.1890/ES12-00382.1
Keller, J. K., Weisenhorn, P. B., and Megonigal, J. P. (2009). Humic acids as electron acceptors in wetland decomposition. Soil Biol. Biochem. 41, 1518–1522. doi: 10.1016/j.soilbio.2009.04.008
Kokfelt, U., Rosén, P., Schoning, K., Christensen, T. R., Förster, J., Karlsson, J., et al. (2009). Ecosystem responses to increased precipitation and permafrost decay in subarctic Sweden inferred from peat and lake sediments. Glob. Chang. Biol. 15, 1652–1663. doi: 10.1111/j.1365-2486.2009.01880.x
Kotsyurbenko, O. R., Glagolev, M. V., Nozhevnikova, A. N., and Conrad, R. (2001). Competition between homoacetogenic bacteria and methanogenic archaea for hydrogen at low temperature. FEMS Microbiol. Ecol. 38, 153–159. doi: 10.1111/j.1574-6941.2001.tb00893.x
Kotsyurbenko, O. R., Nozhevnikova, A. N., Soloviova, T. I., and Zavarzin, G. A. (1996). Methanogenesis at low temperatures by microflora of tundra wetland soil. Antonie van Leeuwenhoek 69, 75–86. doi: 10.1007/BF00641614
Kotsyurbenko, O. R., Nozhevnikova, A. N., and Zavarzin, G. A. (1993). Methanogenic degradation of organic matter by anaerobic bacteria at low temperature. Chemosphere 27, 1745–1761. doi: 10.1016/0045-6535(93)90155-X
Lapham, L., Proctor, L., and Chanton, J. P. (1999). Using respiration rates and stable carbon isotopes to monitor the biodegradation of Orimulsion by marine benthic bacteria. Environ. Sci. Technol. 33, 2035–2039. doi: 10.1021/es981158a
Liu, F., and Conrad, R. (2011). Chemolithotrophic acetogenic H 2/CO 2 utilization in Italian rice field soil. ISME J. 5:1526. doi: 10.1038/ismej.2011.17
Londry, K. L., Dawson, K. G., Grover, H. D., Summons, R. E., and Bradley, A. S. (2008). Stable carbon isotope fractionation between substrates and products of Methanosarcina barkeri. Organ. Geochem. 39, 608–621. doi: 10.1016/j.orggeochem.2008.03.002
Lovley, D. R., Coates, J. D., Blunt-Harris, E. L., Phillips, E. J., and Woodward, J. C. (1996). Humic substances as electron acceptors for microbial respiration. Nature 382:445. doi: 10.1038/382445a0
Lovley, D. R., and Klug, M. J. (1983). Methanogenesis from methanol and methylamines and acetogenesis from hydrogen and carbon dioxide in the sediments of a eutrophic lake. Appl. Environ. Microbiol. 45, 1310–1315.
Malmer, N., Johansson, T., Olsrud, M., and Christensen, T. R. (2005). Vegetation, climatic changes and net carbon sequestration in a North-Scandinavian subarctic mire over 30 years. Glob. Chang. Biol. 11, 1895–1909. doi: 10.1111/j.1365-2486.2005.01042.x
Martiny, J. B., Jones, S. E., Lennon, J. T., and Martiny, A. C. (2015). Microbiomes in light of traits: a phylogenetic perspective. Science 350:aac9323. doi: 10.1126/science.aac9323
McCalley, C. K., Woodcroft, B. J., Hodgkins, S. B., Wehr, R. A., Kim, E. H., Mondav, R., et al. (2014). Methane dynamics regulated by microbial community response to permafrost thaw. Nature 514:478. doi: 10.1038/nature13798
Megonigal, J. P., Hines, M. E., and Visscher, P. T. (2004). “Anaerobic metabolism: linkages to trace gases and aerobic processes,” in Biogeochemistry, ed. W. H. Schlesinger (Oxford, UK: Elsevier-Pergamon), 317–424.
Mondav, R., McCalley, C. K., Hodgkins, S. B., Frolking, S., Saleska, S. R., Rich, V. I., et al. (2017). Microbial network, phylogenetic diversity and community membership in the active layer across a permafrost thaw gradient. Environ. Microbiol. 19, 3201–3218. doi: 10.1111/1462-2920.13809
Mondav, R., Woodcroft, B. J., Kim, E. H., McCalley, C. K., Hodgkins, S. B., Crill, P. M., et al. (2014). Discovery of a novel methanogen prevalent in thawing permafrost. Nat. Commun. 5:3212. doi: 10.1038/ncomms4212
Neubauer, S. C., and Megonigal, J. P. (2015). Moving beyond global warming potentials to quantify the climatic role of ecosystems. Ecosystems 18, 1000–1013. doi: 10.1007/s10021-015-9879-4
Neumann, R. B., Blazewicz, S. J., Conaway, C. H., Turetsky, M. R., and Waldrop, M. P. (2016). Modeling CH 4 and CO 2 cycling using porewater stable isotopes in a thermokarst bog in interior Alaska: results from three conceptual reaction networks. Biogeochemistry 127, 57–87. doi: 10.1007/s10533-015-0168-2
Nozhevnikova, A. N., Kotsyurbenko, O. R., and Simankova, M. V. (1994). “Acetogenesis at low temperature,” in Acetogenesis, ed. H. L. Drake (Boston, MA: Springer), 416–431.
O’leary, P. R., and Tchobanoglous, G., (2002). “Landfilling”, in Handbook of Solid Waste Management, eds G. Tchobanoglous and F. Kreith (New York, NY: McGraw-Hill).
Pierce, E., Xie, G., Barabote, R. D., Saunders, E., Han, C. S., Detter, J. C., et al. (2008). The complete genome sequence of Moorella thermoacetica (f. Clostridium thermoaceticum). Environ. Microbiol. 10, 2550–2573. doi: 10.1111/j.1462-2920.2008.01679.x
Roden, E. E., Kappler, A., Bauer, I., Jiang, J., Paul, A., Stoesser, R., et al. (2010). Extracellular electron transfer through microbial reduction of solid-phase humic substances. Nat. Geosci. 3:417. doi: 10.1038/ngeo870
Rotaru, A. E., Shrestha, P. M., Liu, F., Shrestha, M., Shrestha, D., Embree, M., et al. (2014). A new model for electron flow during anaerobic digestion: direct interspecies electron transfer to Methanosaeta for the reduction of carbon dioxide to methane. Energy Environ. Sci. 7, 408–415. doi: 10.1039/C3EE42189A
Schädel, C., Bader, M. K. F., Schuur, E. A., Biasi, C., Bracho, R., Čapek, P., et al. (2016). Potential carbon emissions dominated by carbon dioxide from thawed permafrost soils. Nat. Clim. Chang. 6, 950–953. doi: 10.1038/nclimate3054
Sherwood, M. T. (1972). Inhibition of Rhizobium trifolii by yeast extracts or glycine is prevented by calcium. Microbiology 71, 351–358.
Shoemaker, J. K., and Schrag, D. P. (2010). Subsurface characterization of methane production and oxidation from a New Hampshire wetland. Geobiology 8, 234–243. doi: 10.1111/j.1472-4669.2010.00239.x
Shoemaker, J. K., Varner, R. K., and Schrag, D. P. (2012). Characterization of subsurface methane production and release over 3 years at a New Hampshire wetland. Geochim. Cosmochim. Acta 91, 120–139. doi: 10.1016/j.gca.2012.05.029
Singleton, C. M., McCalley, C. K., Woodcroft, B. J., Boyd, J. A., Evans, P. N., Hodgkins, S. B., et al. (2018). Methanotrophy across a natural permafrost thaw environment. ISME J. 12:2544. doi: 10.1038/s41396-018-0065-5
Smemo, K. A., and Yavitt, J. B. (2011). Anaerobic oxidation of methane: an underappreciated aspect of methane cycling in peatland ecosystems? Biogeosciences 8, 779–793. doi: 10.5194/bg-8-779-2011
Tchobanoglous, G., and Kreith, F. (2002). Handbook of Solid Waste Management. New York: McGraw Hill, 3067–3068.
Tfaily, M. M., Cooper, W. T., Kostka, J. E., Chanton, P. R., Schadt, C. W., Hanson, P. J., et al. (2014). Organic matter transformation in the peat column at marcell experimental forest: humification and vertical stratification. J. Geophys. Res. 119, 661–675. doi: 10.1002/2013JG002492
Tfaily, M. M., Hamdan, R., Corbett, J. E., Chanton, J. P., Glaser, P. H., and Cooper, W. T. (2013). Investigating dissolved organic matter decomposition in northern peatlands using complimentary analytical techniques. Geochim. Cosmochim. Acta 112, 116–129. doi: 10.1016/j.gca.2013.03.002
Tveit, A. T., Urich, T., Frenzel, P., and Svenning, M. M. (2015). Metabolic and trophic interactions modulate methane production by Arctic peat microbiota in response to warming. Proc. Natl. Acad. Sci. 112, E2507–E2516. doi: 10.1073/pnas.1420797112
Valentine, D. L., Chidthaisong, A., Rice, A., Reeburgh, W. S., and Tyler, S. C. (2004). Carbon and hydrogen isotope fractionation by moderately thermophilic methanogens. Geochim. Cosmochim. Acta 68, 1571–1590. doi: 10.1016/j.gca.2003.10.012
Vanwonterghem, I., Jensen, P. D., Rabaey, K., and Tyson, G. W. (2016). Genome-centric resolution of microbial diversity, metabolism and interactions in anaerobic digestion. Environ. Microbiol. 18, 3144–3158. doi: 10.1111/1462-2920.13382
Vitt, D. H., Halsey, L. A., and Zoltai, S. C. (1994). The bog landforms of continental western Canada in relation to climate and permafrost patterns. Arct. Alpine Res. 26, 1–13. doi: 10.2307/1551870
Weimer, P. J. (1998). Manipulating ruminal fermentation: a microbial ecological perspective. J. Anim. Sci. 76, 3114–3122. doi: 10.2527/1998.76123114x
Whiticar, M. J. (1999). Carbon and hydrogen isotope systematics of bacterial formation and oxidation of methane. Chem. Geol. 161, 291–314. doi: 10.1016/S0009-2541(99)00092-3
Whiting, G. J., and Chanton, J. P. (1993). Primary production control of methane emission from wetlands. Nature 364:794. doi: 10.1038/364794a0
Wilson, R. M., Fitzhugh, L., Whiting, G. J., Frolking, S., Harrison, M. D., Dimova, N., et al. (2017a). Greenhouse gas balance over thaw-freeze cycles in discontinuous zone permafrost. J. Geophys. Res. 122, 387–404. doi: 10.1002/2016JG003600
Wilson, R. M., Tfaily, M. M., Rich, V. I., Keller, J. K., Bridgham, S. D., Zalman, C. M., et al. (2017b). Hydrogenation of organic matter as a terminal electron sink sustains high CO2: CH4 production ratios during anaerobic decomposition. Organ. Geochem. 112, 22–32. doi: 10.1016/j.orggeochem.2017.06.011
Woodcroft, B. J., Singleton, C. M., Boyd, J. A., Evans, P. N., Emerson, J. B., Zayed, A. A., et al. (2018). Genome-centric view of carbon processing in thawing permafrost. Nature 560:49. doi: 10.1038/s41586-018-0338-1
Ye, R., Jin, Q., Bohannan, B., Keller, J. K., and Bridgham, S. D. (2014). Homoacetogenesis: a potentially underappreciated carbon pathway in peatlands. Soil Biol. Biochem. 68, 385–391. doi: 10.1016/j.soilbio.2013.10.020
Ye, R., Jin, Q., Bohannan, B., Keller, J. K., McAllister, S. A., and Bridgham, S. D. (2012). pH controls over anaerobic carbon mineralization, the efficiency of methane production, and methanogenic pathways in peatlands across an ombrotrophic–minerotrophic gradient. Soil Biol. Biochem. 54, 36–47. doi: 10.1016/j.soilbio.2012.05.015
Zalman, C., Keller, J. K., Tfaily, M., Kolton, M., Pfeifer-Meister, L., Wilson, R. M., et al. (2018). Small differences in ombrotrophy control regional-scale variation in methane cycling among Sphagnum-dominated peatlands. Biogeochemistry 139, 155–177. doi: 10.1007/s10533-018-0460-z
Keywords: greenhouse gas flux, peatlands, organic matter decomposition, climate warming, carbon cycling
Citation: Wilson RM, Neumann RB, Crossen KB, Raab NM, Hodgkins SB, Saleska SR, Bolduc B, Woodcroft BJ, Tyson GW, Chanton JP and Rich VI (2019) Microbial Community Analyses Inform Geochemical Reaction Network Models for Predicting Pathways of Greenhouse Gas Production. Front. Earth Sci. 7:59. doi: 10.3389/feart.2019.00059
Received: 21 November 2018; Accepted: 11 March 2019;
Published: 29 March 2019.
Edited by:
Samuel Abiven, University of Zurich, SwitzerlandReviewed by:
Jakob Zopfi, Universität Basel, SwitzerlandDavid E. Graham, Oak Ridge National Laboratory (DOE), United States
Copyright © 2019 Wilson, Neumann, Crossen, Raab, Hodgkins, Saleska, Bolduc, Woodcroft, Tyson, Chanton and Rich. This is an open-access article distributed under the terms of the Creative Commons Attribution License (CC BY). The use, distribution or reproduction in other forums is permitted, provided the original author(s) and the copyright owner(s) are credited and that the original publication in this journal is cited, in accordance with accepted academic practice. No use, distribution or reproduction is permitted which does not comply with these terms.
*Correspondence: Rachel M. Wilson, cm13aWxzb25AZnN1LmVkdQ== Rebecca B. Neumann, cmJuZXVtQHV3LmVkdQ==