 Sophie Fauset1*†
 Manuel Gloor1
 Nikolaos M. Fyllas2
 Oliver L. Phillips1
 Gregory P. Asner3
 Timothy R. Baker1Lisa Patrick Bentley4
 Roel J. W. Brienen1Bradley O. Christoffersen5Jhon del Aguila-Pasquel6Christopher E. Doughty7
 Ted R. Feldpausch8
 David R. Galbraith1Rosa C. Goodman9Cécile A. J. Girardin10Euridice N. Honorio Coronado6Abel Monteagudo11
 Norma Salinas10,12
 Alexander Shenkin10
 Javier E. Silva-Espejo13
 Geertje van der Heijden14Rodolfo Vasquez11
 Esteban Alvarez-Davila15Luzmila Arroyo16Jorcely G. Barroso17Foster Brown18
 Wendeson Castro19Fernando Cornejo Valverde20Nallarett Davila Cardozo21
 Anthony Di Fiore22
 Terry Erwin23Isau Huamantupa-Chuquimaco24,25Percy Núñez Vargas24David Neill26
 Nadir Pallqui Camacho1,13Alexander Parada Gutierrez27Julie Peacock1Nigel Pitman28,29Adriana Prieto30Zorayda Restrepo31,32Agustín Rudas33Carlos A. Quesada33
 Marcos Silveira34
 Juliana Stropp35John Terborgh36,37
 Simone A. Vieira38
 Yadvinder Malhi10
- 1School of Geography, University of Leeds, Leeds, United Kingdom
- 2Biodiversity Conservation Laboratory, Department of Environment, University of Aegean, Mytilene, Greece
- 3Center for Global Discovery and Conservation Science, Arizona State University, Tempe, AZ, United States
- 4Department of Biology, Sonoma State University, Rohnert Park, CA, United States
- 5Department of Biology and School of Earth, Environmental, and Marine Sciences, University of Texas Rio Grande Valley, Edinburg, TX, United States
- 6Instituto de Investigaciones de la Amazonía Peruana, Iquitos, Peru
- 7School of Informatics, Computing, and Cyber Systems, Northern Arizona University, Flagstaff, AZ, United States
- 8Geography, College of Life and Environmental Sciences, University of Exeter, Exeter, United Kingdom
- 9Department of Forest Ecology and Management, Swedish University of Agricultural Sciences (SLU), Umeå, Sweden
- 10Environmental Change Institute, School of Geography and the Environment, University of Oxford, Oxford, United Kingdom
- 11Jardin Botanico de Missouri, Oxapampa, Peru
- 12Pontificia Universidad Católica del Peru, Instituto de Ciencias de la Naturaleza, Territorio y Energías Renovables—San Miguel, Lima, Peru
- 13Universidad Nacional San Antonio Abad del Cusco, Cusco, Peru
- 14School of Geography, University of Nottingham, Nottingham, United Kingdom
- 15Escuela de Ciencias Agrícolas, Pecuarias y Ambientales, Universidad UNAD, Bogotá, Colombia
- 16Museo de Historia Natural Noel Kempff Mercado, Universidad Autonoma Gabriel Rene Moreno, Santa Cruz, Bolivia
- 17Universidade Federal do Acre, Campus Floresta, Cruzeiro do Sul, Brazil
- 18Woods Hole Research Centre, Falmouth, MA, United States
- 19Programa de Pós-Graduação Ecologia e Manejo de Recursos Naturais, Universidade Federal do Acre, Rio Branco, Brazil
- 20Andes to Amazon Biodiversity Program, Puerto Maldonado, Peru
- 21Programa de Mestrado em Biotecnologia e Recursos Naturais, Universidade do Estado do Amazonas, Manaus, Brazil
- 22Department of Anthropology, University of Texas at Austin, Austin, TX, United States
- 23Smithsonian Institution, Washington, DC, United States
- 24Universidad Nacional de San Antonio Abad del Cusco, Cusco, Peru
- 25Programa de Pós-Graduação em Botânica, Escola Nacional de Botânica Tropical, Instituto de Pesquisas Jardim Botânico do Rio de Janeiro, Rio de Janeiro, Brazil
- 26Universidad Estatal Amazónica, Puyo, Ecuador
- 27Museo de Historia Natural Noel Kempff Mercado, Universidad Autónoma Gabriel Rene Moreno, Santa Cruz de la Sierra, Bolivia
- 28Science and Education, The Field Museum, Chicago, IL, United States
- 29Center for Tropical Conservation, Nicholas School of the Environment, Duke University, Durham, NC, United States
- 30Instituto de Ciencias Naturales, Universidad Nacional de Colombia, Bogota, Colombia
- 31Grupo de Servicios Ecosistemicos y Cambio Climático, Corporación COL-TREE, Medellin, Colombia
- 32Grupo GIGA Universidad de Antioquia, Medellin, Colombia
- 33Instituto Nacional de Pesquisas da Amazônia, Manaus, Brazil
- 34Museu Universitário, Universidade Federal do Acre, Rio Branco, Brazil
- 35Institute of Biological and Health Sciences, Federal University of Alagoas, Maceió, Brazil
- 36Department of Biology and Florida Museum of Natural History, University of Florida, Gainesville, FL, United States
- 37College of Science and Engineering, James Cook University, Cairns, QLD, Australia
- 38Núcleo de Estudos e Pesquisas Ambientais, Universidade Estadual de Campinas, Campinas, Brazil
Climate, species composition, and soils are thought to control carbon cycling and forest structure in Amazonian forests. Here, we add a demographics scheme (tree recruitment, growth, and mortality) to a recently developed non-demographic model—the Trait-based Forest Simulator (TFS)—to explore the roles of climate and plant traits in controlling forest productivity and structure. We compared two sites with differing climates (seasonal vs. aseasonal precipitation) and plant traits. Through an initial validation simulation, we assessed whether the model converges on observed forest properties (productivity, demographic and structural variables) using datasets of functional traits, structure, and climate to model the carbon cycle at the two sites. In a second set of simulations, we tested the relative importance of climate and plant traits for forest properties within the TFS framework using the climate from the two sites with hypothetical trait distributions representing two axes of functional variation (“fast” vs. “slow” leaf traits, and high vs. low wood density). The adapted model with demographics reproduced observed variation in gross (GPP) and net (NPP) primary production, and respiration. However, NPP and respiration at the level of plant organs (leaf, stem, and root) were poorly simulated. Mortality and recruitment rates were underestimated. The equilibrium forest structure differed from observations of stem numbers suggesting either that the forests are not currently at equilibrium or that mechanisms are missing from the model. Findings from the second set of simulations demonstrated that differences in productivity were driven by climate, rather than plant traits. Contrary to expectation, varying leaf traits had no influence on GPP. Drivers of simulated forest structure were complex, with a key role for wood density mediated by its link to tree mortality. Modeled mortality and recruitment rates were linked to plant traits alone, drought-related mortality was not accounted for. In future, model development should focus on improving allocation, mortality, organ respiration, simulation of understory trees and adding hydraulic traits. This type of model that incorporates diverse tree strategies, detailed forest structure and realistic physiology is necessary if we are to be able to simulate tropical forest responses to global change scenarios.
Introduction
The Amazon forest is the most extensive tropical forest on Earth. Storing an estimated ~100 Pg C in aboveground woody biomass (Feldpausch et al., 2012), this region accounts for approximately 25% of the global aboveground forest carbon stock (Pan et al., 2011). The Amazon is also hugely diverse, containing many thousands of tree species (ter Steege et al., 2013; Cardoso et al., 2017). Understanding the sensitivity of Amazonia to climate change and anthropogenic disturbance is therefore a research priority, which requires a mechanistic understanding of the processes driving the carbon cycle.
A wide variety of processes act at multiple spatial and temporal scales to influence the Amazon forest carbon cycle. Plot-based measurements of woody biomass, mortality, and species composition across the basin indicate that there are remarkably covarying spatial patterns in forest structure, dynamics and biodiversity. There is a north-east to south-west gradient of declining biomass (Malhi et al., 2006; Quesada et al., 2012; Mitchard et al., 2014; Johnson et al., 2016) coincident in space with declining community mean wood density (WD, Baker et al., 2004; Malhi et al., 2006; ter Steege et al., 2006; Quesada et al., 2012) and increasing tree mortality rates (Phillips et al., 2004; Quesada et al., 2012; Johnson et al., 2016). Soil physical properties are thought to underlie these patterns; the younger, shallower soils of the south-west promoting a composition of short-lived, fast-growing, low WD species due to their poorer structural properties limiting root anchorage (Quesada et al., 2012). Stem mortality rates are not only an important driver of spatial patterns of forest biomass (Johnson et al., 2016), but also temporal patterns of carbon uptake (Brienen et al., 2015). At the tree-level, mortality is linked negatively with WD (Muller-Landau, 2004; King et al., 2006; Kraft et al., 2010; Aubry-Kientz et al., 2013) and positively with growth rate (Chao et al., 2008). Stand-level woody productivity is only weakly related to biomass (Johnson et al., 2016) but may be linked to soil fertility, especially phosphorus (Aragão et al., 2009; Quesada et al., 2012). Drought events can cause forests to shift temporarily from acting as carbon sinks to sources through episodic impacts on tree growth and mortality (Phillips et al., 2009; Gatti et al., 2014; Doughty et al., 2015; Feldpausch et al., 2016) and may be behind a longer-term weakening of the sink (Brienen et al., 2015). Additionally, Malhi et al. (2015) show that variation in gross primary productivity (GPP) between sites is largely driven by variation in the seasonality of precipitation, but this does not follow through to a relationship between climate and net primary productivity (NPP), nor woody productivity, due to differences in autotrophic respiration (Ra) and allocation between sites.
The ecosystem properties of a forest (e.g., biomass, GPP) are the aggregated sum of the individual trees in that forest, so by understanding the life cycle of individual trees and harnessing physical understanding of plant physiology, it is possible to build individual based models from first principles to simulate ecosystem processes (DeAngelis, 1988; Grimm and Berger, 2016; Shugart et al., 2018). In forests, demographic processes (growth, mortality) are linked to size (Lines et al., 2010; Herault et al., 2011; Aubry-Kientz et al., 2013; Bigler, 2016), and hence the size-structured nature of individual-based models allow for inclusion of size-dependent variation in processes. In diverse tropical forests, species show differences in performance linked to their functional traits (e.g., Herault et al., 2011; Ruger et al., 2012). In recognition of these results, recent advances in vegetation modeling have developed new trait-based and individual-based mechanistic models (aDGVM2 Scheiter et al., 2013; TFS Fyllas et al., 2014; LPJmL-FIT Sakschewski et al., 2015) which enable tree size and functional traits to be explicitly combined for the simulation of forest processes. This is particularly useful for tropical forests where the enormous species diversity precludes the use of species-specific models. Models with the inclusion of trait-continua can represent diverse plant strategies, and move beyond the traditional approach of plant functional types (PFTs) which use a limited number of prescribed trait combinations to describe plant strategies.
The Trait-based Forest Simulator (TFS, Fyllas et al., 2014) differs from aDGVM2 and LPJmL-FIT by including locally observed distributions of key functional traits accounting for variation in tree life cycle and productivity [WD, leaf mass per area (LMA), leaf nitrogen (N), and phosphorus (P) concentrations]. This allows TFS to indirectly account for the influence of environmental factors on species composition and leaf nutrients. The use of observed distributions also allows the extent of local co-variation between traits to be accounted for, without assuming that co-variation occurs, nor assuming any underlying theoretical distribution. Trees with high WD typically grow more slowly, live longer and store more biomass for a given size than those with low WD. LMA describes the resource investment in the leaf and is a crucial component of the leaf economics spectrum (Wright et al., 2004), while leaf nutrient concentrations in conjunction with LMA are linked to photosynthetic capacity (Domingues et al., 2010); carbon assimilation per leaf area is expected to increase with LMA and leaf nutrient concentrations. TFS is a non-demographic model that uses inputs of forest structure (tree diameter distribution), trait distributions, local or gridded climate data, and soil type to simulate carbon and water fluxes for specific tropical forest plots. With this array of inputs, the model can account for many of the processes thought to influence Amazonian forest carbon cycling, but currently lacks a dynamic scheme (growth, mortality and recruitment). Here, we add demographics to this model to produce a fully dynamic version of TFS (TFSv.2, Figure 1; Figure S1).
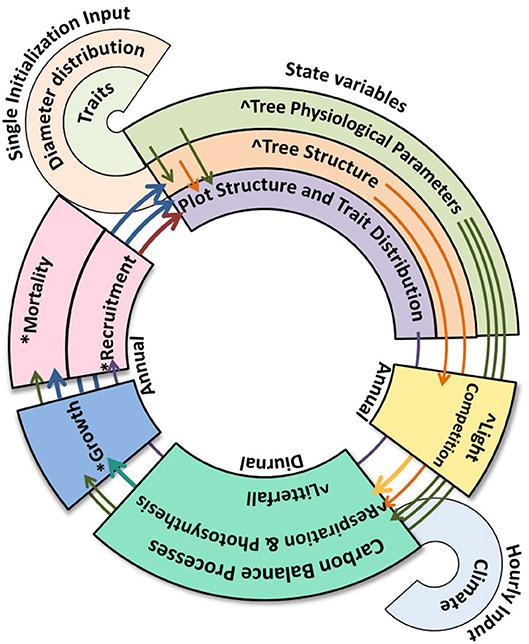
Figure 1. Schematic of the dynamic version of the TFS model. * denotes processes added to the new model version, ∧denotes alterations to the original model. Thin arrows show where state variables are used in model processes or are used in the description of other state variables, thick arrows show where one model process informs a sequential process or the state variables. A more detailed schematic is included in the Figure S1.
To add growth to the model, we include allocation of NPP. Some typical model approaches to allocation are to maintain the originally specified allometries of the tree (e.g., ED, Moorcroft et al., 2001), to use fixed allocation coefficients (e.g., TROLL, Marechaux and Chave, 2017) that can vary with PFT (e.g., ED2, Medvigy et al., 2009), or to consider allocation itself as a trait (e.g., aDGVM2). In TFSv.2 we add the important trade-off between LMA and leaf lifespan (Wright et al., 2004; TROLL, LPJmL-FIT), where trees with higher LMA also have a longer leaf lifespan to account for the greater carbon investment. A consequence of differing leaf turnover rates is that allocation to leaf biomass may also be different. Hence, we allocate carbon between organs based on the losses from these organs, which includes variation due to LMA for leaves. Most individual-based models represent mortality as a function of PFT specific longevity or maximum size (e.g., SEIB-DVGM, Sato et al., 2007; Sato, 2009; LPJ-GUESS, Smith et al., 2001; ED2; FORMIND, Köhler and Huth, 1998; Fischer et al., 2016), and growth rate or carbon balance (e.g., SEIB-DGVM, LPJ-GUESS, ED2, FORMIND, TROLL, SORTIE, Pacala et al., 1996). Here, we include a mortality scheme based on an empirical relationship predicting the probability of mortality from growth rate (an outcome of traits and environment), wood density (to represent life history) and tree size as a fraction of maximum potential size parameterized from a large dataset of Amazon forest plots. For the establishment of new trees, models often produce seeds or saplings from a reproductive biomass pool (e.g., LPJ-GUESS, ED, aDVGM2). PFT specific minimum reproductive threshold diameters are occasionally used (e.g., TROLL, FORMIND) and production of propagules can include PFT specific dispersal distances (e.g., FORMIND, SORTIE). Sapling establishment is typically dependent on light availability, sometimes with PFT specific light requirements (e.g., FORMIND, LPJ-GUESS, SEIB-DGVM). For this version of TFS (where the minimum size of simulated trees is 10 cm diameter) we propose a simple recruitment scheme where all adult trees have the same chance of reproducing and the number of saplings is dependent on light availability.
We use this updated fully dynamic model (Figure 1) to simulate the carbon cycle, forest structure and population dynamics of two contrasting lowland western Amazon sites, Tambopata (TAM, Malhi et al., 2014) and Allpahuayo (ALP, del Aquila-Pasquel et al., 2014). TAM has a much more seasonal climate than ALP (Figure 2), while soils and leaves in TAM have higher nutrient concentrations than ALP (Table 1). These differences allow us to test the relative importance of climate seasonality and plant traits for Amazon ecosystem function. Furthermore, the sites are home to extensive data collection efforts in forest dynamics and detailed measurements of the carbon cycle, enabling far-reaching evaluation of the model against data. We are investigating, through the mechanisms proposed within TFS v.2, the interplay of traits and climate in driving carbon cycling and forest structure, and the reasons differing climates and traits can influence modeled outcomes. The aims of the paper are to assess (i) whether TFSv.2 converges on forest properties (productivity, demographic and structural variables) within the range of observations, (ii) the impact of climate seasonality and plant traits on forest processes with the TFSv.2 framework, and (iii) the relative importance of leaf and stem traits for forest properties. For the latter two aims, we perform experiments using hypothetical trait distributions extracted from the observed distributions, and the different climates of the two study sites. While no model can be perfect, it reflects our current understanding. For aspects that are well simulated, the model may suggest the mechanisms, and for aspects that are not well simulated, the model highlights where improvement in understanding is needed.
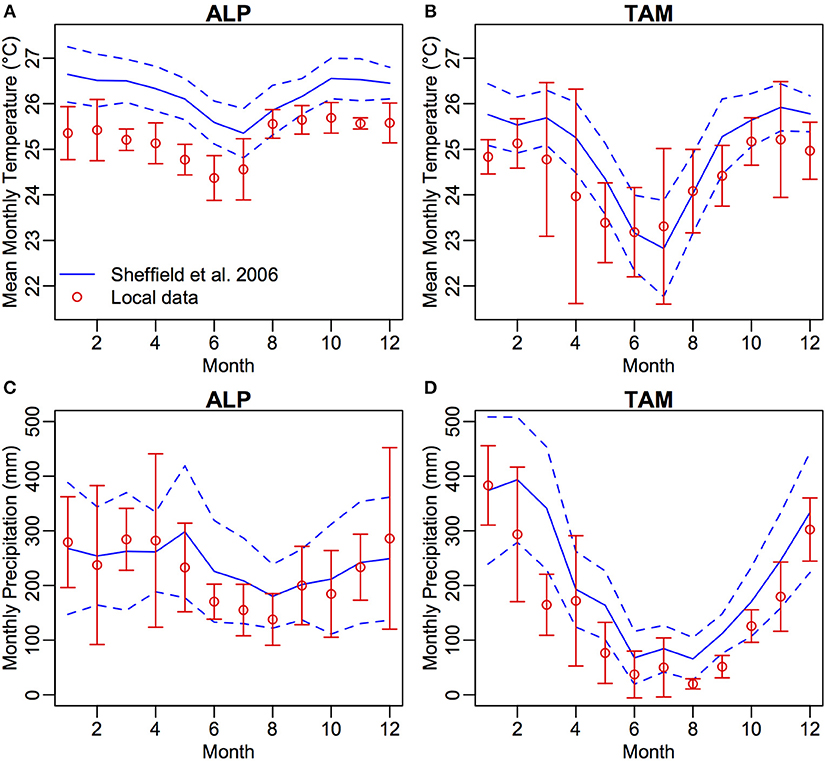
Figure 2. Mean monthly values of temperature (°C) (A,B) and precipitation (mm) (C,D) for Allpahuayo and Tambopata taken from Sheffield et al. (2006) gridded climate data for the years 1983–2012 (blue, solid line: mean, dashed line: standard deviation) and from local data (red, points and error bars, del Aquila-Pasquel et al., 2014, Malhi et al., 2014 obtained with Web Plot Digitizer).
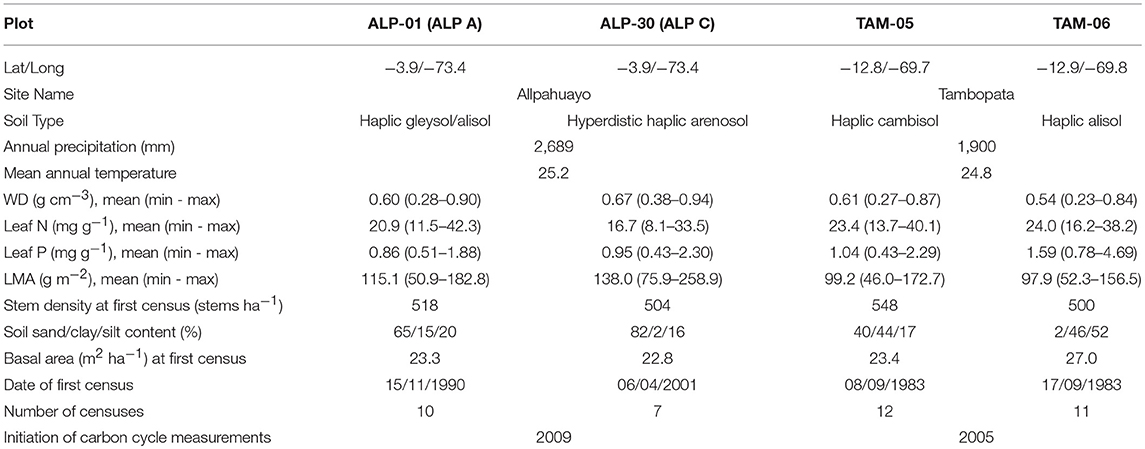
Table 1. Details of intensive carbon cycling plots used to initialize and validate simulations.
Methods
Site Description
Within each site, Allpahuayo and Tambopata, two 1-ha forest inventory plots (ALP-01, ALP-30, TAM-05 and TAM-06) have been established (Table 1). The climate in ALP (mean annual precipitation 2,689 mm) has little seasonality with no dry season and relatively constant temperature, whilst in TAM (mean annual precipitation 1,900 mm) there is a reduction in rainfall below 100 mm during 5 months of the year which coincides with a drop in temperature of approximately 2°C (Figure 2). Substrate varies between and within sites. Soils in TAM are more fertile than ALP, with particularly high total phosphorus in TAM-06, hence the higher leaf P concentrations in TAM-06 (Table 1). Soils in ALP have a high sand content, while those in TAM are more clay rich. Although ALP-30 has a very high sand content and low fertility, fast-draining substrate, tree roots may be able to access deeper, higher fertility soil below (Malhi et al., 2015). To our knowledge, the sites have not been subject to any recent human impacts.
Observations
We use published data (del Aquila-Pasquel et al., 2014; Malhi et al., 2014, 2015) from intensive carbon cycling measurements following the GEM (Global Ecosystems Monitoring) protocol (Marthews et al., 2014) in which wood (NPPW, including coarse roots), leaf (NPPL) and fine root NPP (NPPFR) (measured using dendrometer bands, leaf litter production and root ingrowth cores, respectively) and Ra (RW, RL, RFR; measured using gas analysers on stem surfaces, individual leaves, and soil surfaces and then scaled to the whole plot) are monitored. RFR is separated from soil respiration by comparing measurements from cores where roots are excluded to those with roots included. The NPP and Ra from each organ is summed to estimate the plot-level GPP (GPP = NPP + Ra). All are presented as Mg C ha−1 yr−1. Full methods used for the carbon cycling measurements can be found in the appropriate references (ALP: del Aquila-Pasquel et al., 2014; TAM: Malhi et al., 2014). Because forest demographic rates can vary over small spatial and temporal scales, we calculated stem mortality, biomass mortality and recruitment rates (% yr−1), woody productivity rates (Mg C ha−1 yr−1, differing from NPPW due to exclusion of coarse roots) and mean diameter growth rates (cm yr−1) from a larger dataset from inventory plots located within the same sites as the intensive plots in order to include a broader array of observed dynamic rates (Table S1). We refer to these larger plot datasets as clusters. Inventory data were collected following the RAINFOR protocol (Phillips et al., 2016), whereby all stems ≥ 10cm diameter at breast height (D, cm) are botanically identified and have D measured every 1 to 5 years over several decades. These data are collated in the RAINFOR ForestPlots.net database (Lopez-Gonzalez et al., 2009, 2011). We excluded nearby plots on waterlogged soils (ALP-40, MSH-01, TAM-03) from the clusters. Error statistics for the field data are described in Supplementary Methods S1.
Model Description and Development
Non-demographic Version TFS v.1
TFS uses traits and tree size in the estimation of carbon balance of individual trees. The observed diameter distribution of a forest plot is used to initialize the model, and each input diameter becomes an individual tree. Each tree is randomly assigned a suite of four traits [WD (g cm−3), LMA (g m−2), N (mg g−1), P (mg g−1)] from the observed distribution (retaining any covariation between traits in the observed distribution). Allometry is used to define the individuals' dimensions and biomass pool sizes based on diameter and traits. Trees compete for light using the Perfect Plasticity Approximation (Purves et al., 2007) whereby crown area and height determine the canopy layer in which the tree is situated and the amount of light received. Soil water availability is estimated daily from climate data with a simple bucket model using parameters based on soil type. The leaf traits are used to estimate the photosynthetic parameters Vcmax (the maximum rate of carboxylation, μmol m−2 s−1) and Jmax (the maximum rate of electron transport, μmol m−2 s−1) (Domingues et al., 2010), which together with the light received and a water stress function determine the photosynthetic rate (Farquhar et al., 1980) and GPP. Soil moisture and respiration are simulated on a daily time-step, photosynthesis is simulated on an hourly time-step. Plot-level fluxes are determined by summing the fluxes of each individual tree within the plot. For full details of TFS v.1 see Fyllas et al. (2014).
Developments
A small number of alterations made to improve the realism of the model are presented in the Supplementary Methods S2, along with all new equations and parameter values. Briefly, the spatial scale on which canopy light competition is performed was reduced to 20 × 20 m subplots to improve representation of within plot heterogeneity in canopy height (Bohlman and Pacala, 2012). Leaf lifespan (LL, days) was allowed to vary and assigned to individuals based on their LMA following the known relationship from the leaf economics spectrum (Wright et al., 2004). Further, LL was increased for subcanopy trees based on observations. RL (modeled as a function of Vcmax) was reduced for shaded trees.
Tree mortality
The annual probability of mortality (Pm) was estimated as a logistic function of WD, diameter growth rate (Gr, cm yr−1), and D relative to maximum diameter (Dmax) (Equation 1, Table S2). This approach was used to determine mortality dependent both on the actual circumstances of the tree (low growth rate producing a high probability of mortality, long-standing negative carbon balance resulting in death), the life history strategy of the tree (high WD being associated with low mortality), and how close the tree is to its Dmax (trees closer to their Dmax being more likely to die due to senescence).
Data from 69 forest plots located in the western Amazon from the RAINFOR ForestPlots.net database (Lopez-Gonzalez et al., 2011) were used to fit the model to data using maximum likelihood applied to a binomial process, see Supplementary Methods S3. Dmax (95th percentile diameter) was estimated for all species in the dataset with at least 20 individuals, following the method of King et al. (2006). We used data for all individual trees present (alive or dead) in at least three censuses and for which a Dmax value was available. Maximization of the likelihood function was performed using simulated annealing, following similar methods to Chao et al. (2008), Lines et al. (2010), and Aubry-Kientz et al. (2013). Different models with all possible combinations of the three predictors were compared using AIC, showing that the full model with all predictors had the greatest support (Supplementary Methods S3). WD was the best single predictor, and WD combined with Gr was the best model with two predictor variables. Relationships between the variables and the probability of mortality are shown in Figure S2.
To apply the equation in TFS v.2 a Dmax value was assigned to each simulated tree. From observations (Figure S3), there was a weak relationship between species LMA and Dmax (and no relationship with other traits). Whilst the relationship between LMA and Dmax is not strong, the (log-normal) distributions of Dmax binned by LMA shift to the right (i.e., increase) at higher LMA limits (Figure S3). To maintain the distribution of Dmax values found for Amazonian species and its weak relationship to LMA within the simulated communities, a Dmax value for each tree was taken from the distribution of observed Dmax values in 5 classes of LMA (Figure S3) with LMA from Fyllas et al. (2009). In the model, mortality is performed on an annual timescale. After calculating Pm for each simulated tree using equation 1, death was determined by a simulated random coin toss with a uniform probability function. In addition, trees with a negative Gr for five consecutive years were killed.
Tree recruitment
Each year a maximum number of saplings (Nsap) are established in each 20 × 20 m subplot. Nsap is controlled by the total leaf area index (LAI, m2 m−2) of the subplot with lower sapling densities at higher LAI following a negative exponential function (Fyllas et al., 2010; equation 2),
where A is the subplot area (m2). Parameter a represents the maximum potential number of saplings in one m2. Trait assignment to saplings follows the same method of random vector generation used at initialization (Fyllas et al., 2014), but based on the traits distributions of the mature trees of the stand rather than the input distributions. The saplings are maintained in a pool of potential recruits for 10 years with a 90% annual chance of survival (within the range of sapling survivorship observed over 3 years in Panama, Welden et al., 1991) before being established as mature trees with D = 10 cm.
Closing the carbon cycle
The biomass pool sizes of leaves, stem, fine, and coarse roots were updated annually based on the NPP produced over the year and losses (leaf, root and branch shedding) removed over the year. Losses of coarse and fine roots were not included in TFS v.1 and so were added into the new dynamic version. Fine root lifetime was set at 6 months (Jiménez et al., 2009). Coarse root losses were set equivalent to branch fall with the assumption that coarse root biomass also contains a “labile” component equivalent to the branch component of stems. Given that some individuals would have higher leaf losses than others due to differing LL, it follows that the allocation to leaf biomass should also vary, depending on the tradeoff between LL and LMA. To account for this, allocation was carried out in two stages. First, all losses are replaced using the NPP. The surplus NPP available after replacement of loses is then allocated to wood, root, and leaf biomass pools using static coefficients. Because the majority of losses are derived from roots and leaves, we hypothesized that most of the surplus NPP is allocated to wood (96%) with 2% going each to fine roots and leaves. With the updated biomass values, plant dimensions (D, height, crown area, and leaf area) were updated. Individuals with NPP less than total losses allocate the available NPP to biomass pools in proportion to the amount of losses from each pool, but the pools are not fully replaced and the tree has a negative Gr.
Simulations
Validation Simulations
The forest inventory data from the first census of each plot were used to initialize the model (each diameter becoming an individual tree). Functional traits were taken from Fyllas et al. (2009) and the GEM-TRAIT project (Supplementary Methods S1, Figure S4). Soil depth and texture were taken from Quesada et al. (2010). Soil depths are similar (2.2–2.4 m) in TAM and ALP-30, but shallower in ALP-01.
We ran the model for 500 years to allow ample time to reach an equilibrium forest structure, beginning in 1983 when the first forest inventory data were collected. Gridded climate data with a daily time-step for the period 1983–2012 were taken from Sheffield et al. (2006). The climate data is comparable with local data from the ALP site (del Aquila-Pasquel et al., 2014; Figure 2A); however, it has higher precipitation than the local data at the TAM site (Malhi et al., 2014; Figure 2B), with a shorter dry season. For simulation years post-2012, the 1983–2012 climate was recycled by randomly selecting a year of data. Atmospheric CO2 was kept constant at 380 ppm. Due to inherent stochasticity in the model, 10 runs were performed. The mean of the last 100 years of runs was used to compare with the observed data, with errors calculated as standard deviation from the mean across the 10 runs, accounting for all stochastic processes.
Datasets for Model Validation
We compared observed and simulated GPP, NPP, Ra, and NPP and Ra by organ at the plot-level, and calculated the normalized mean bias (NMB, Equation 3) to evaluate the data-model agreement
where Si is the simulated and Oi the observed value for n plots. In Malhi et al. (2015) canopy NPP is separated into four components (leaf, twig, fruits and flowers, and herbivory); here we combined leaf production and herbivory for NPPL. For NPPW we include NPP stem of trees > 10 cm D, NPP branch, and NPP coarse root. We compared simulated demographic rates and forest structure properties against the observed forest inventory data. Observed and simulated distributions (e.g., size class distributions) were compared with Wilcoxon rank sum tests.
Experimental Simulations
In a second set of simulations to test the impacts of trait distributions and climate on forest processes we ran the model under a range of climates and trait distributions. We use the climate data for the two sites (Figure 2). As the trait distributions from the plots overlap (Table 1; Figure S4) we generated four different trait distributions that varied systematically to use as in model experiments (Figure S5). To do this, we combined all the trait data from all plots and separated it in two ways. First, the samples were split between those with N higher or lower than 20 mg g-1. This produced two opposing traits distributions; higher fertility, lower LMA leaves—“fast” leaf traits, as opposed to lower fertility, higher LMA leaves—“slow” leaf traits. Due to its link with LMA, LL was shorter in simulations with “fast” leaf traits and longer in simulations with “slow” leaf traits. Mean WD was higher for the “slow” leaf traits distributions than the “fast” leaf traits distributions but still showed wide variation and overlapped between the two distributions. Second, the samples were split between those with WD value higher or lower than 0.6 g cm−3. The N, P and LMA values were similar between high and low WD distributions. Simulations were performed using the ALP and TAM climates and each trait distribution (2 climates x 4 trait distributions = 8 combinations), with 10 runs of each. The simulations were initialized with 200, 10 cm D trees to examine the influence of traits and climate on stand development as well as equilibrium forest structure and carbon cycling. We used two-way ANOVA to determine the percentage of variance in simulated variables explained (ω2) by altering the input climate (ALP vs. TAM) or the input traits (“fast” vs. “slow” leaf traits, or high vs. low WD).
All statistical analyses were performed using R 2.15.1 (R Core Team, 2012).
Results
Validation Simulations of Carbon Cycling, Forest Structure, and Demographics
Simulations of the carbon cycle show good agreement with GPP (Figure 3A; Table 2, NMB = −2.6%) and Ra (Figure 3C; Table 2, NMB = 0.6%) observations, where GPP and Ra were higher in ALP than TAM. The NMB of simulated NPP was a little higher (Table 2, NMB = −8.5%), and the simulated values were higher for ALP than TAM (due to a slight underestimation of GPP for TAM-05 and slight overestimation of Ra in TAM-06), whereas the observations were similar for both sites (Figure 3B).
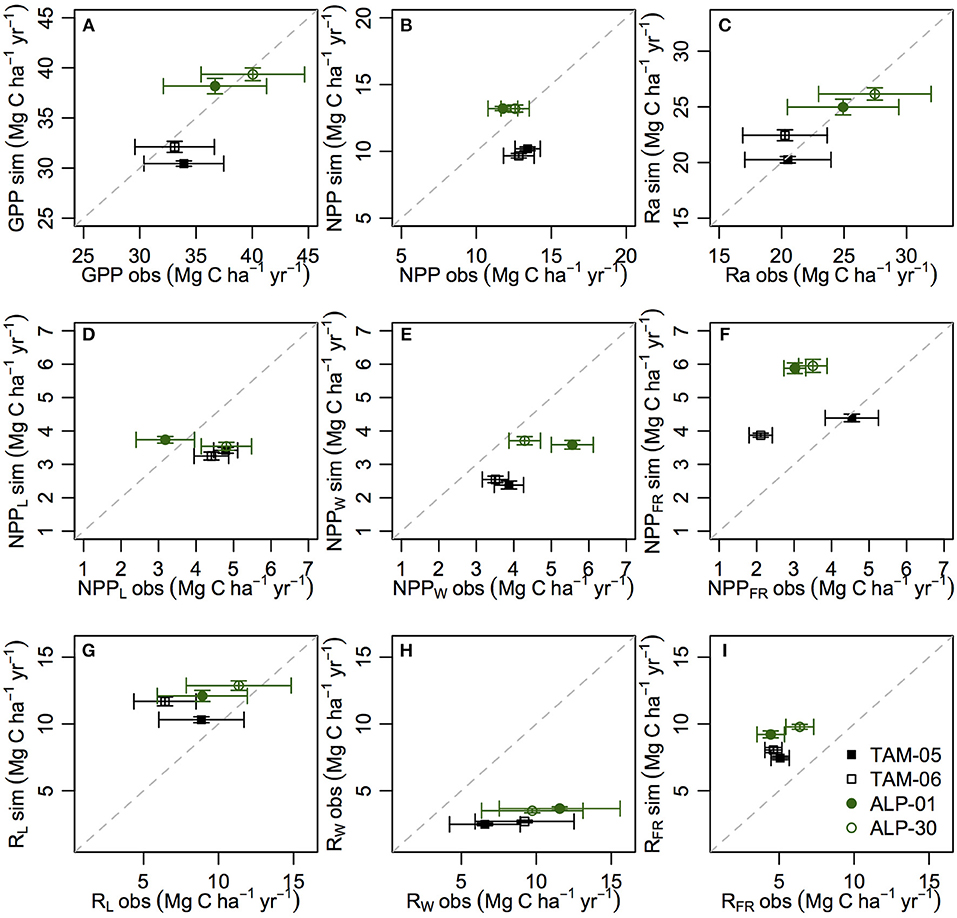
Figure 3. Observed and simulated carbon fluxes for Tambopata and Allpahuayo plots for validation simulations. Total GPP (A), NPP (B) and Ra (C), leaf, wood and fine root NPP (D–F), and leaf, wood and fine root Ra (G–I). All units Mg C ha−1 yr−1. Observations from Malhi et al. (2015) with error bars as standard error.
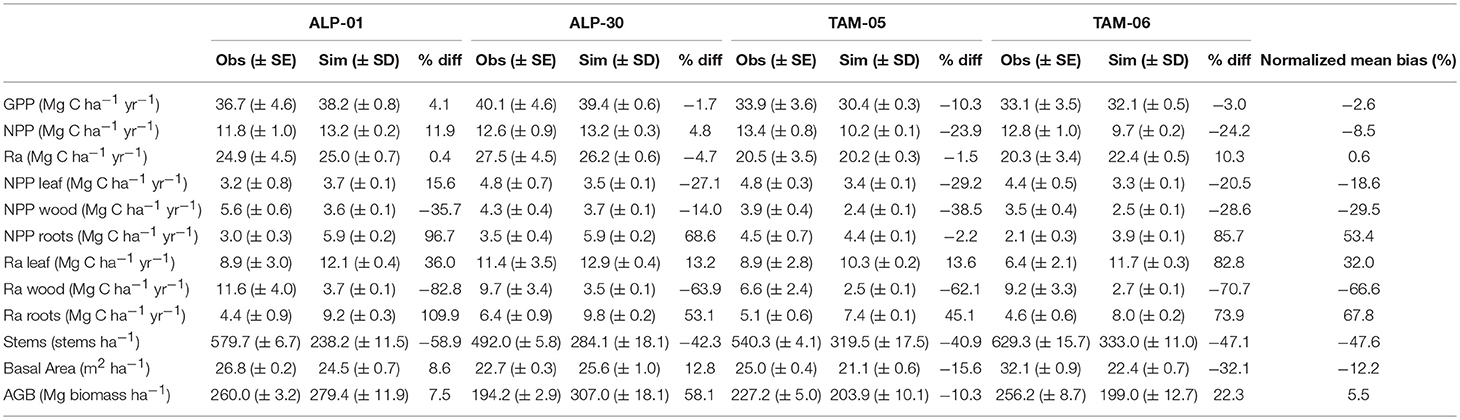
Table 2. Observed and simulated carbon fluxes and forest structure metrics for validation simulations.
Examining NPP by organ (Figures 3D–F; Table 2), NPPFR was overestimated (NMB = 53.4%) whilst NPPW and NPPL were underestimated (NMB = −29.5% and −18.6%, respectively). The observed data show variation in allocation of NPP to different organs between plots, which is not reflected in the model simulations (Figure S6). Simulated respiration by plant organ shows similar patterns to NPP by plant organ, but with higher biases and overestimation of RL (Figures 3G–I; Table 2).
The final steady-state forest structure at the end of simulations is the result of 500 years of drift from the initial (observed) structure due to recruitment, growth and mortality. The final simulated size-class distributions (combined from all runs) for all plots were significantly different from the initial distribution (Figure 4, Wilcoxon rank sum test p < 0.0001). The percentage of large stems (>30 cm diameter) was higher in simulations (33.6–41.9%) compared to observations (13.9–20.1%).
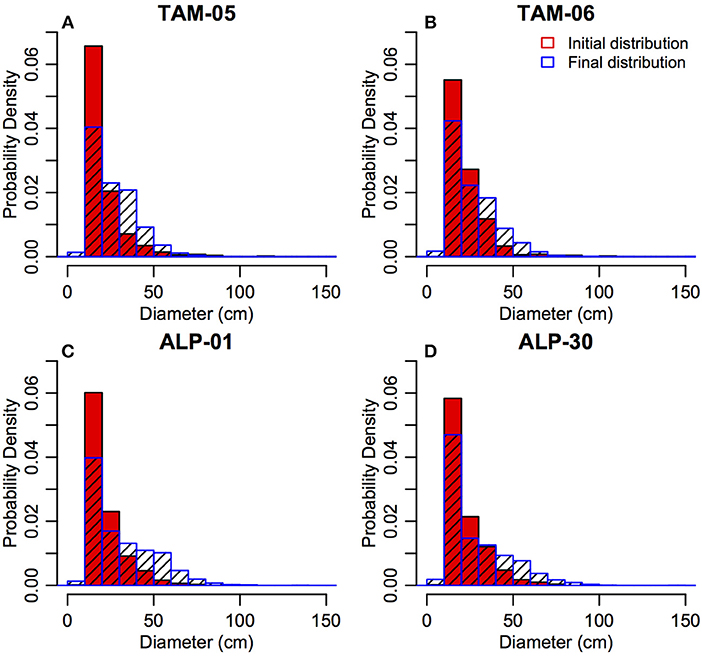
Figure 4. Initial (red, observations from initial census) and final simulated (blue) size class distributions (in 10 cm diameter bins) for all plots (A: TAM-05, B: TAM-06, C: ALP-01, D: ALP-30) for validation simulations.
For all plots, stem numbers initially decreased and reached a steady-state after c. 100–200 years (Figures 5A–D), with stem numbers much lower than observations (NMB = −47.6%, Table 2). Simulated BA initially increased and then reduced in all plots reaching a steady state which was below the cluster mean for TAM plots and similar to the cluster mean for ALP plots (Figures 5E–H; Table 2). Equilibrium above-ground biomass (AGB) was simulated more accurately (NMB = 5.5%, Table 2). Observed temporal patterns of stem numbers and basal area are shown in Figure S7.
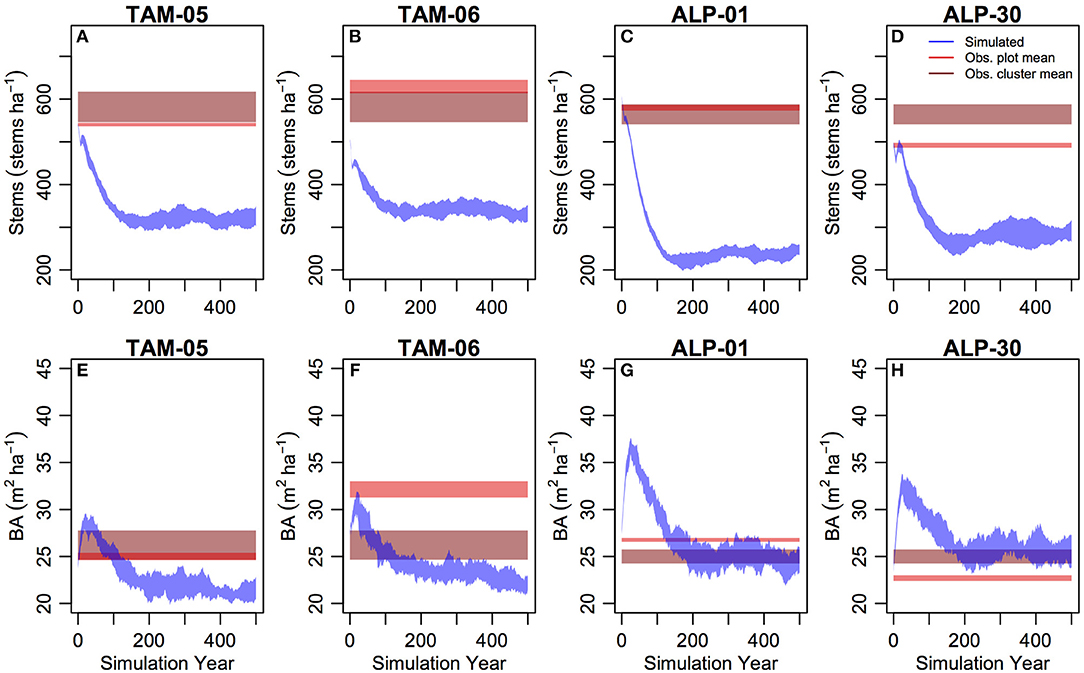
Figure 5. Stem number (A–D, stems ha−1) and basal area (E–H, m2 ha−1) from 500 years of simulation (blue–standard deviation range across all simulations), and data (brown—standard error range across all plots within the site cluster, red—standard error range of the simulated plot) for validation simulations.
The distributions of individual tree growth rates were significantly different between simulations and observations for all plots with growth somewhat overestimated in simulations (Figure 6, Wilcoxon rank sum test, p < 0.0001); however, growth rates were within realistic ranges. A higher proportion of trees were simulated to grow between 0 and 0.1 cm yr−1 than in the data, but the data also showed a number of trees that shrank (from reductions in diameter of stressed trees or measurement error). The simulations produced a higher proportion of trees (14.3–26.1%) growing in 0.5–1 cm yr−1 than in the data (8.2–11.7%), especially in the ALP plots.
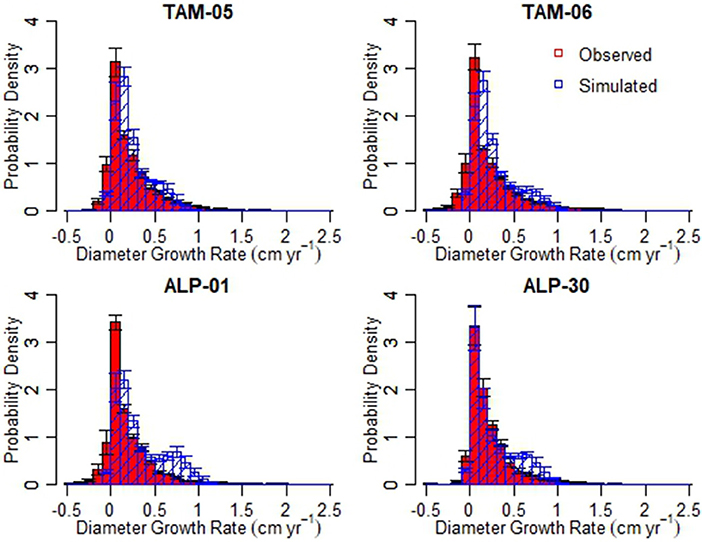
Figure 6. Distributions of stem diameter growth rates (cm yr−1) from observed data (red) and simulations (blue) for validation simulations.
Figure S8 shows the distributions of annual stem and biomass mortality rates across the last 100 simulation years, and observed rates from the site clusters. The observed distributions of stem and biomass mortality were not significantly different between ALP and TAM clusters (Wilcoxon rank sum test, p > 0.18), with the medians c. 2% yr−1 (Table 3). Simulations consistently underestimated mortality rates, with medians c. 1.25% yr−1 (Table 3), and simulated and observed distributions of stem mortality rates were significantly different (Wilcoxon rank sum test, p < 0.001). The observed distributions of biomass mortality (Figure S8) show a positive skew with a long tail to the right, reflecting the occurrence of a small number of high mortality events; simulations also showed this pattern and for TAM-06 the distribution of biomass mortality rates were not significantly different from observations (p > 0.05) and, while differences were significant in other plots, the p-values were higher than for stem mortality (p 0.01–0.04). Simulated stem mortality and recruitment rates (e.g., Figure S9) were not significantly different from each other (paired t-test, p = 0.8), despite not being explicitly linked in the model.
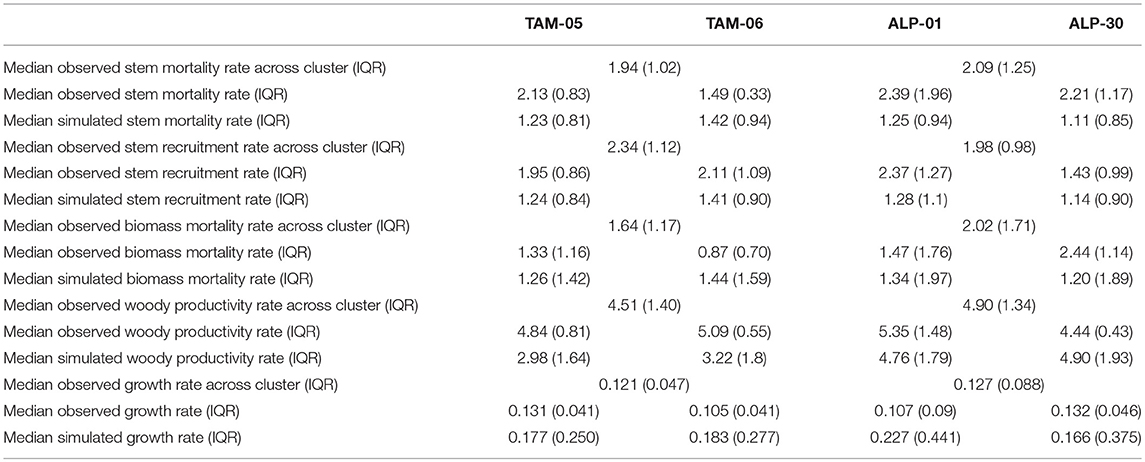
Table 3. Observed and simulated median mortality and recruitment (% yr−1), productivity (Mg C ha−1 yr−1), and diameter growth (cm yr−1) and interquartile ranges (IQR) for validation simulations.
Observed distributions of woody productivity were not significantly different between the ALP and TAM clusters (Figure S10, Wilcoxon rank sum test, p = 0.13), whilst the simulated distributions were significantly different between plots (Wilcoxon rank sum test, p < 0.0001), with higher woody productivity in ALP plots (Figure S10). Compared to the observations, distributions of woody productivity for ALP plots were not significantly different (Wilcoxon rank sum test, p > 0.06), while the simulated productivity rates of TAM plots were underestimated (Wilcoxon rank sum test, p < 0.0001).
Climate and Trait Influence on Experimental Simulations
The influence of climate and traits on simulated GPP, NPP, Ra, stem number, BA, AGB, woody productivity, LAI and demographic rates was tested. Climate was the predominant driver of simulated GPP, NPP, Ra and stem number in both trait experiments (“fast” vs. “slow” leaf traits [leaf traits experiment] and high vs. low wood density [WD experiment], Table 4; Figure 7; Table S3) with higher GPP, NPP and Ra, and lower stem number under the ALP climate. LAI was markedly influenced by climate for the leaf traits experiment (proportion of variance explained ω2 = 0.91), with higher LAI under the ALP climate, but traits had a stronger role in the WD experiment (ω2 = 0.23), with higher LAI under the high WD traits distribution. Although climate was the stronger driver of NPP in both experiments, the importance of the traits distribution was higher for the leaf traits experiment with higher NPP with “slow” leaf traits. AGB was driven mostly by climate, but with a role for traits in both experiments (ω2 = 0.20). The results for BA in the leaf traits experiment was similar to AGB, but in the WD experiment traits became much more important (ω2 = 0.75, Figures 7e–l; Table 4). Interestingly, in the WD experiment the high WD distribution lead to lower BA but higher AGB compared with the low WD distribution, while in the leaf traits experiment the “slow” distribution was associated with higher BA and AGB compared with the “fast” distribution. Climate was the major driver of woody productivity for the leaf traits runs, but traits also had a role in the WD runs (ω2 = 0.22). Demographic rates (stem mortality and recruitment) were driven by trait distributions in both cases, but with a much stronger effect for the WD experiment (Table 4, higher rates with lower WD). Interactions were rarely significant, and explained very little variance (ω2 ≤ 0.02).
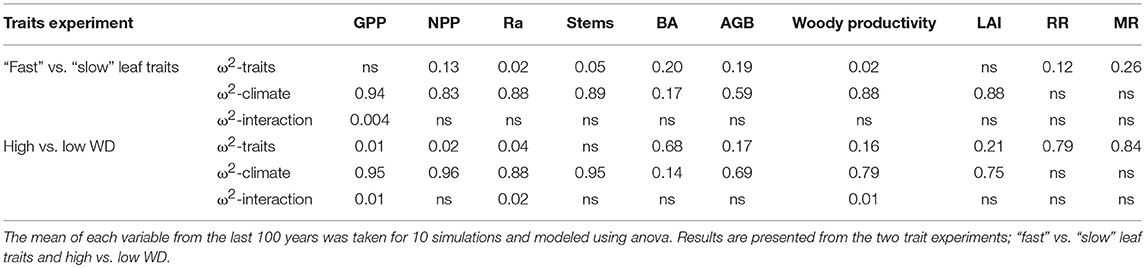
Table 4. Proportion of variance explained (ω2) by traits distribution, climate, and their interaction for various simulated carbon cycling, forest structure and demography variables from experiment simulations.
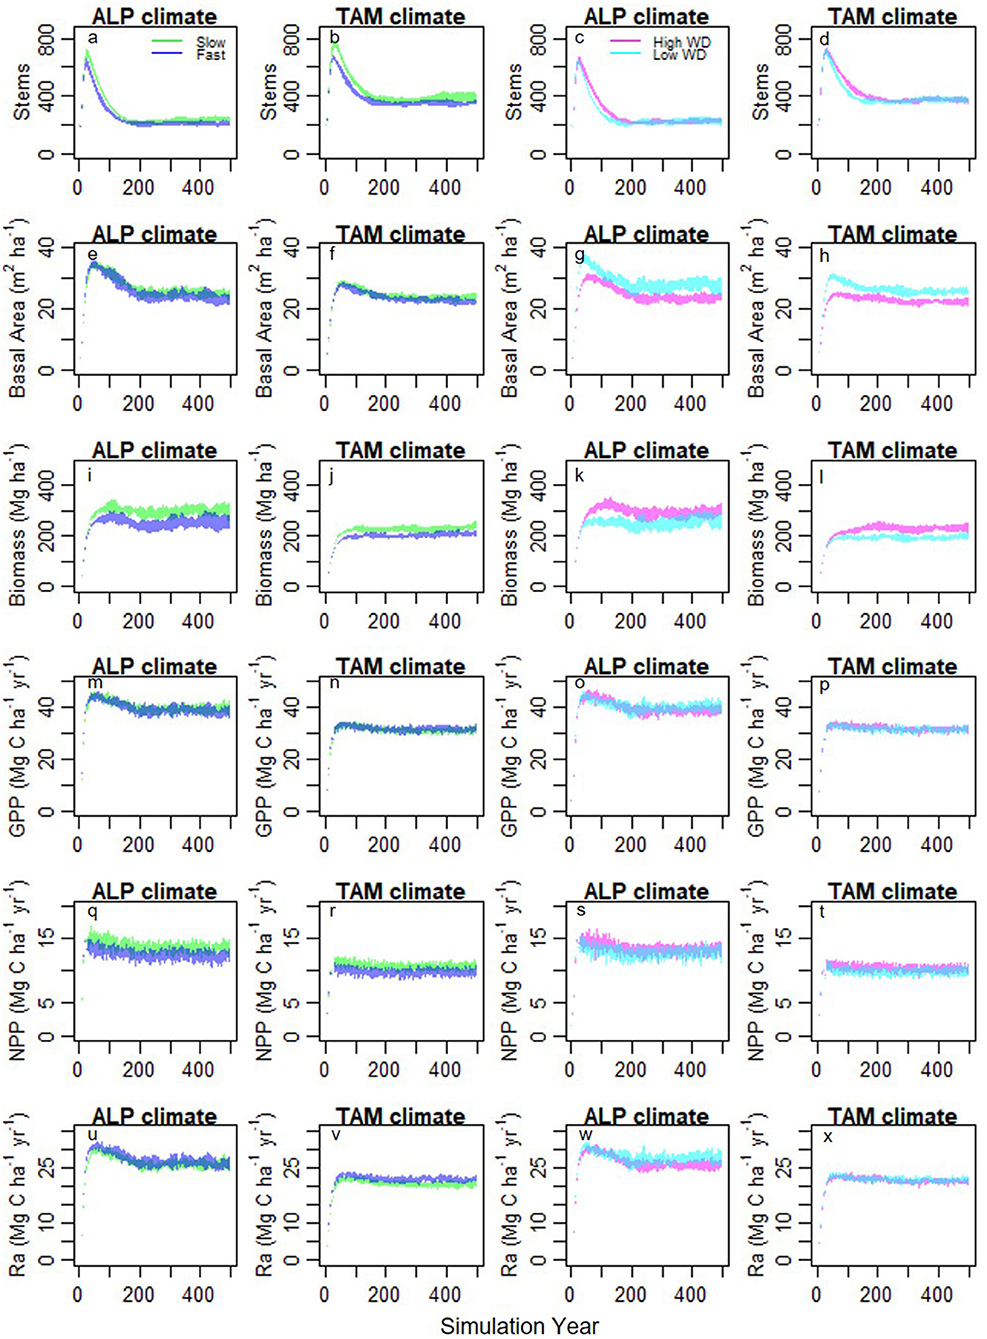
Figure 7. Stand development (a-d stem density, e-h basal area, i-l biomass) and carbon fluxes (m-p GPP, q-t NPP, u-x Ra) under different combinations of input trait distributions and climates from experimental simulations. Column 1 and 3–ALP climate, column 2 and 4–TAM climate, column 1 and 2– “fast” (blue) and “slow” (green) traits distributions with split based on leaf N, column 3 and 4–high (magenta) and low (cyan) WD distributions. Polygons show standard deviation ranges from 10 model runs.
The simulations showed similar variation in stand development under all experimental conditions. In all circumstances, stem numbers increased quickly, then declined to an equilibrium level (Figures 7a–d). Despite equilibrium stem numbers not being strongly influenced by trait distributions (Table 4), the peak stem numbers reached early during succession were higher for simulations using “slow” leaf traits than “fast” leaf traits (Figures 7a–d). This is likely due to the higher demographic rates resulting from the “fast” leaf trait distributions. WD increased during all simulations with a significantly different mean WD between the first and last years (Table S4; Figure S12).
Discussion
Simulation of Carbon Fluxes
Our findings suggest that differences in GPP between sites are due to climate. Simulations using the ALP climate had consistently higher GPP even under a range of different trait distributions. This occurs in the model due to a reduction in stomatal conductance as a result of seasonal soil moisture stress in TAM (Figure S13), which limits photosynthesis (Fyllas et al., 2014). Is it realistic that climate is the main driver of GPP differences between these sites? Malhi et al. (2015) found a strong relationship with seasonal water deficit and GPP across a range of sites, suggesting that seasonal water limitation reduces photosynthesis. This is supported by GPP observations from flux towers showing a seasonal reduction in photosynthesis at southern Amazon sites (Restrepo-Coupe et al., 2013). Remote sensing data also suggests a seasonal reduction in photosynthesis is expected at TAM (Guan et al., 2015). However, the role of climate as the sole driver of photosynthesis seasonality has been questioned, with evidence that leaf demography (leaf dropping, flushing, and age related changes in photosynthetic efficiency) determines seasonal changes in canopy photosynthetic capacity, driving seasonality of GPP (Hutyra et al., 2007; Restrepo-Coupe et al., 2013; Wu et al., 2016). In TFS v.2, photosynthetic capacity is constant throughout the year. Hence, the mechanism by which climate influences GPP may be more complex than we propose.
Beyond GPP
Organ-level Ra and NPP are key areas for model improvement and further research. Both Ra and NPP show similar patterns; RW and NPPW are consistently underestimated, while RL, RFR and NPPFR are overestimated. This may be due to the low simulated stem densities and larger tree sizes than observed (Figures 4, 5), and the lower proportional allocation to wood of large trees. It may also be due to the allocation scheme underestimating NPPW by preferentially replacing lost biomass (mainly leaf litter and root turnover). In any trait-based model it is important to include ecological trade-offs. In TFS v.2, we increased leaf lifespan (LL) with increasing LMA (Supplementary Methods S2; if all trees had the same LL low LMA trees would develop unrealistically dense crowns). Given this difference in LL, it is not possible or desirable to use static allocation coefficients (e.g., those observed from plot-level data e.g., Malhi et al., 2011) for all trees. Trees with a short LL need to allocate more carbon to leaves to maintain their canopy. This brings us to consider allocation as a trait-mediated function that will vary between individuals and species, perhaps as part of a “fast-slow plant economic spectrum” (Reich, 2014). Another aspect of allocation that was not incorporated into the model is a non-structural carbohydrate pool. In some sense, the annual timestep of allocation and growth allows for storage of photosynthate within the year, as during seasonal water stress photosynthesis is reduced but respiration continues. However, there is no consideration of longer-term storage, which has shown to be common across plants globally (Martínez-Vilalta et al., 2016), and could improve the model. Understanding mechanisms for different allocation patterns between species, sites, and under varying conditions remains a challenge, and outcomes from new datasets (e.g., Doughty et al., 2014, 2015; Girardin et al., 2016), in addition to organ-level understanding of respiration, should be incorporated into models when available.
The observations of woody productivity rates from forest inventory data (which is different from NPPW as it does not include branch fall or coarse roots, and here observations were based on a larger forest inventory dataset) were not significantly different between plots. In contrast, the simulations matched the observations for ALP but underestimated for TAM. Higher simulated wood production in ALP results from higher GPP due to less seasonality, but this is not supported by the data. For TFS v.2, climate is a stronger driver of woody productivity than traits, but with a small driving role for WD (Table 4). Baker et al. (2009) investigated plot-based observations of woody productivity across the Amazon and found it to be driven by environmental factors rather than differences in WD or maximum size between sites. Data from intensive plots show that while GPP is linked to climate, NPP does not show the same patterns (Malhi et al., 2015). Hence, there is progress to be made in improving our understanding of the linkages between GPP and woody growth.
Simulation of Forest Structure and Demographic Rates
Whilst the total standing stock and volume of vegetation (BA, AGB) is reasonably simulated, there is a lack of model performance with respect to the partitioning within individual stems (stem density, size class distribution, diameter growth rates, Table 2; Figures 4–6). The deviations from the observations were particularly strong in the ALP plots, and in the experimental simulations stem density was controlled only by climate. The higher productivity of the aseasonal ALP climate may enhance the dominance of large stems. The under-estimation of stem density does not appear to be linked to the low mortality rates, as the simulation of stem density was unresponsive to altering input traits, while mortality rates increased under the low wood density simulations (Table 4). To understand this further, a correlation matrix of various simulated stand-level variables was produced to give insight into the internal mechanics of the model relating to stem density. As shown in Table 5 and Figure S14, stem density is tightly negatively correlated to mean tree diameter, a density-size relationship that is commonly observed in forests (e.g., Long and Smith, 1983). Mean tree diameter is strongly positively correlated with GPP and only weakly with mortality rate (Table 5), while GPP itself is related to climate (Table 4), hence stem density being linked to climate. These findings should be taken with caution, as correlation does not mean causation, especially for GPP, and mean stem diameter which are not correlated when only simulations under the same climate are tested. Differences between observed and predicted size class distributions could be due to the observed forests not being in an equilibrium state. However, size class distributions in many forests across the tropics have been studied, and generally show patterns similar to the observed distributions (Enquist and Niklas, 2001). The cause of poor simulation of stand structure may relate to differential growth strategies of understory trees (e.g., Hubau et al., 2019) that may require more differences in parameterization than are already included in TFSv.2. Farrior et al. (2016) show that size class distributions can be simulated by non-physiological demographic models when size dependent rates are included. The experimental simulations produce a mean tree diameter range of 23.2–36.1 cm (Figure S14), higher than the observed range of 19.9–21.9 cm from the first census of each plot. The close relationship between simulated stem density and mean tree diameter suggests that to improve our simulation of stem density it is necessary to improve the simulation of mean tree diameter. Over-estimation of large trees (Antonarakis et al., 2011) and growth rates (Medvigy et al., 2009; Medgivy and Moorcroft, 2012) were also a feature of the ED2 model, and for growth were resolved by optimizing poorly constrained parameter values, an approach from which TFSv.2 would also likely benefit. Particular uncertain parameters that may improve model performance if optimized are the allocation coefficients, respiration parameters (including the fraction of Vcmax used to estimate leaf respiration at different levels of shading, Equation S4), and the recruitment model parameters (Equation 2). Simulation of mean tree diameter may be a useful variable for benchmarking the performance of individual and cohort based models (Fisher et al., 2018).
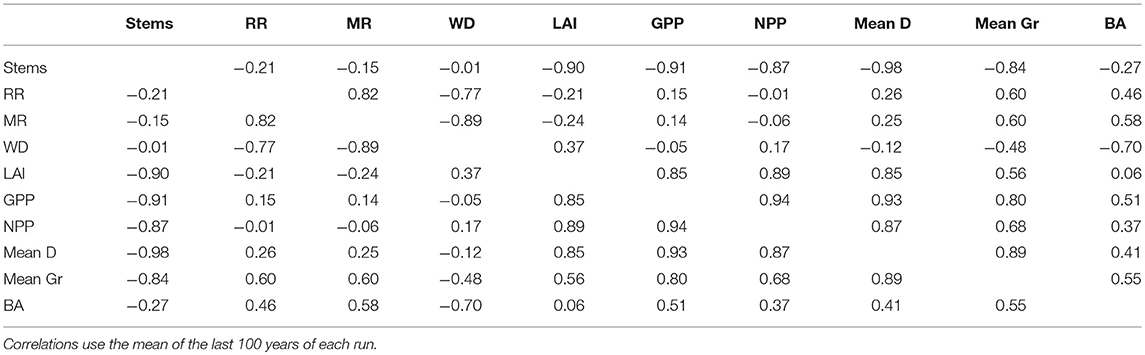
Table 5. Correlation matrix of simulated plot-level variables from each run of the experimental simulations (10 runs of 8 climate x trait combinations, 80 simulations).
WD had a strong influence on BA and, to a lesser extent, AGB (Table 4). This is through its impact on mortality rates which limit tree lifespans and hence the size that they can reach and the build-up of biomass within an individual. The importance of large trees for stand-level biomass has been observed in many tropical forests (DeWalt and Chave, 2004; Baraloto et al., 2011; Fauset et al., 2015) and our model formulation with individuals of varying size enables this effect to be included. Further, understanding of the link between tree mortality and stand-level biomass has been in development over the past decade (Malhi et al., 2006; Quesada et al., 2012; Galbraith et al., 2013) and has been supported by a large forest inventory dataset (Johnson et al., 2016). As shown by Johnson et al. (2016), typical big-leaf DVGMs are unable to include links between mortality and biomass as a fully described size structure is necessary, lending support for size structured models (Fisher et al., 2018) such as the TFS v.2 model presented here.
Stem mortality was underestimated in all plots (Figure S8; Table 3). The slightly higher biomass mortality rates compared to stem mortality rates is likely due to the fact that simulated tree sizes were larger than observed (Figure 4), so even if fewer trees died than in observations, the biomass content of these simulated trees was higher. Mortality rates were linked more to traits than climate (Table 4), and the higher rates for TAM-06 are due to the high abundance of low WD palm species Iriartea deltoidea and Socratea exorrhiza (Malhi et al., 2014) in the input traits distribution (Table 1). One potential reason for underestimating mortality is an increase in WD values over time in the simulations (Figure S15, a mean difference between the initial and final simulation years of 0.09 g cm−3 across all plots in validation simulations, see also Figure S12), as the probability of mortality (Pm) is strongly linked to WD. Whilst there is a growth advantage for trees of low WD which show faster growth than higher WD trees of similar size in “disturbed” subplots (Figure S11), this is not a sufficient trade-off with increased mortality to maintain the initial prescribed WD distribution throughout the simulations. Hence, the higher mortality of low WD trees causes a shift in the community toward higher WD trees, which itself reduces the community mortality rates as high WD trees have a lower chance of dying. The final WD values in the plot simulations are similar to observed plot mean WD values from the east-central Amazon (approaching 0.75 g cm−3, Quesada et al., 2012). This suggests that the final simulated WD distributions are not unrealistic for forests with low mortality rates. To maintain lower plot mean WD values more stochastic disturbance is required, or a recruitment advantage for low WD trees, which is not currently included in the model.
To determine the importance of the WD shift for mortality, we calculated the mortality rate produced from the model output of the final simulation year for one run using either the existing WD value, or WD reduced by 0.09 g cm−3. This showed that the increase in WD caused the stem mortality rate to be reduced by c. 12% of that simulated without the WD shift (Figure S16), and can explain c. one third of the total underestimation. In addition to the increase in WD during the simulations, the somewhat higher simulated than observed growth rates (Figure 6) may be an additional cause of low simulated stem mortality.
During model development, we initially used a Pm equation parameterized with a larger plot dataset from the whole Amazon basin. However, there is a 2-fold difference in stem mortality rates across the basin (Quesada et al., 2012). When we used the basin wide parameterization, the underestimation of mortality rates was more pronounced (on average 0.65% yr−1 across the four plots). The spatial variation in mortality is thought to be linked to differences in species composition that are related to soil structure (Quesada et al., 2012). Thus, by including WD in the estimation of Pm, some of the spatial variation in mortality that is related to species composition should be accounted for. Given that we produce a higher mortality rate when parameterizing the equation with only Western Amazon plot data, despite taking into account the species composition of the plots, this suggests that other factors (possibly soils) beyond WD that vary spatially are also important for determining tree mortality, and are areas for future research and model development.
An interesting emergent outcome of the simulations is the linkage between stem mortality and recruitment rates (Figure S9; Table 3). These processes are modeled independently, with recruitment driven by subplot-level LAI, and mortality linked to tree-level growth, size and WD. As for mortality, the recruitment scheme also includes high stochasticity. Given that the simulations run to a steady-state stem number, it is necessary that the demographic rates are similar over the long-term. The potential mechanisms that lead to linkages between mortality and recruitment rates are summarized in Figure 8. Stem mortality itself influences subplot LAI directly by removing trees (and their crowns) and indirectly by influencing tree lifespan and hence how large crowns can grow. These effects may be the reason why WD had an impact on mean plot LAI in the traits experiment (Table 4). Interannual variation in LAI is mostly driven by climatic events, with years with a particularly strong dry season or low incoming radiation resulting in a reduction in LAI due to low NPP, and therefore an increase in recruitment. This low NPP also influences growth rates, and hence more trees die when the climate is less favorable.
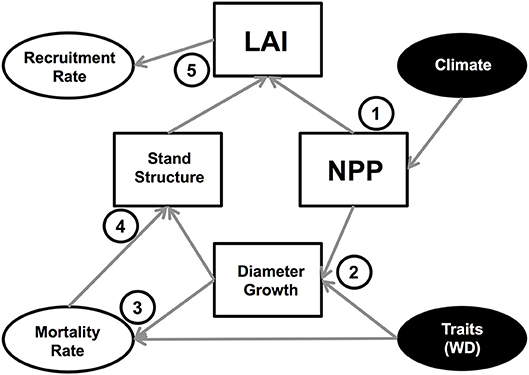
Figure 8. Conceptual diagram of model inputs (filled ovals) and model processes that affect mortality and recruitment rates. 1. Climate impacts NPP, with lower NPP under more seasonal climates. NPP then impacts LAI by determining the amount of carbon available for leaf production. 2. NPP impacts diameter growth rate by determining the amount of carbon available for wood production. Traits, predominately WD, also impact diameter growth as the biomass-diameter allometry is dependent on WD. 3. Mortality rates are directly influenced by WD and by diameter growth rates. 4. Diameter growth directly influences tree size, and mortality indirectly influences tree size via tree longevity (trees with a longer lifespan can reach larger sizes) and directly by removing trees. 5. The stand structure, particularly the presence of large crowns, determines the LAI. The recruitment rates are directly driven by plot LAI.
There was surprisingly little influence of leaf traits on GPP despite the explicit linkages in the model between LMA, leaf nutrients and the photosynthetic capacity. Comparing results from the two experiments (high vs. low WD and “fast” vs. “slow” leaf traits), the different WD distributions (with very little differences in other traits) has a stronger influence on model output than the different leaf trait distributions (which still have some difference in WD). The effects seen in the leaf traits experiment may therefore be more to do with the WD differences. WD showed large shifts over all model simulations (as discussed above), but there were only small, and less consistent, shifts in leaf traits (Figure S12) with seemingly little competitive advantage for particular leaf traits in the model. The lack of large shifts in leaf nutrients and influence of leaf traits on GPP suggests that trade-offs are more balanced for these traits. High leaf nutrient concentrations confer high photosynthetic rates but also high leaf respiration rates, while low LMA values confer high leaf area (for a given leaf biomass) but shorter leaf lifespans. Where shifts did occur they largely favored low leaf nutrient concentrations which may be due to selection for lower respiration rates, or to the weak negative association between WD and leaf nutrients. Whilst there is only scant data on shifts in plant traits, a recent study of five old-growth Neotropical forests over 10 years observed increases in WD with no change in leaf nutrients (van der Sande et al., 2016). However, no such shift in WD has yet been detected in much larger long-term plot networks (Lewis et al., 2009; Brienen et al., 2015; Esquivel-Muelbert et al., 2019).
Importance of Climate
Our results suggest a high sensitivity of forest productivity to climate. However, a limitation of the model is that we do not account for variation in plant hydraulic traits. In the model, the impact of waters stress is mediated by a simple link between soil moisture and stomatal conductance. Whilst this approach is used in many vegetation and land surface models, its use has been called into question as it performs poorly compared to other formulations (e.g., Egea et al., 2011; Joetzjer et al., 2014). The use of hydraulic traits and simulation of the full soil-plant-air continuum could provide better estimation of the sensitivity of photosynthesis to water stress (e.g., Christoffersen et al., 2016), although care is required in the parameterisation of soil hydraulics (Verhoef and Egea, 2014). The inclusion of plant hydraulic traits would be especially useful in models aiming to incorporate the wide variety of strategies in tropical forests, such as TFS. A variety of water use strategies have been shown (Klein, 2014), and plant hydraulic traits show correlations (Bartlett et al., 2016; Meinzer et al., 2016) potentially allowing inclusion of hydraulic trait strategies from measurements of few parameters or from traits already typically included (Markesteijn et al., 2011; Christoffersen et al., 2016). As well as improving representation of response to seasonal water stress, adding such traits could improve prediction of drought related mortality (Fisher et al., 2018), which has been shown to be linked to hydraulic failure (Rowland et al., 2015). Future shifts in precipitation could cause changes in species composition with consequences for forest dynamics, further supporting the need for the incorporation plant hydraulics into individual-based models that can allow for changing functional composition.
Empirical studies on tropical forests have also attempted to determine the roles of plant traits and/or climate on forest structure and functioning, particularly focusing on above ground carbon. For example, Poorter et al. (2015) found that rainfall was the strongest driver of AGB along a broad rainfall gradient, when considering effects of rainfall, average stem size, diversity and soil fertility. Poorter et al. (2017) assessed the impacts of climate, community mean traits, soil properties and disturbance (logging) impacts on biomass stocks and dynamics, and report findings broadly supported by those presented here. They found that AGB was controlled by both seasonal water stress and WD (c.f. Table 4), and that woody productivity (referred to as biomass growth of survivors) was controlled by mean annual precipitation and WD. In contrast with their findings, here leaf traits had an impact on AGB equal to that of WD (Table 4), while LMA was not important for AGB in the analysis of Poorter et al. (2017). In a study of an Andean altitudinal gradient using a simplified and non-demographic version of TFS v.1, Fyllas et al. (2017) found that functional trait and climate changes along the transect were the key drivers of changes in GPP and NPP with elevation, with a stronger role for traits on NPP than GPP. The results here are similar, with climate the key driver of GPP and NPP, and small role for leaf traits in controlling NPP. However, the main aspect of the climate differs in these two cases, with solar radiation important in the Andean elevation gradient (which is moist throughout) and precipitation important in the lowland Western Amazon.
Through a very detailed evaluation of the model, we have highlighted areas of poor model performance (organ level NPP and R, stem density, stem mortality) and suggested areas of future model development. While these areas of poor performance exist, many of the higher order variables were simulated well (GPP, NPP, Ra, AGB, BA). This gives us more confidence in the experimental results with regard to these well simulated variables, as does the congruence with the empirical results of Poorter et al. (2017). However, the results should be nonetheless be viewed with caution because of the uncertainty in the accuracy of internal mechanisms.
Conclusions
We analyzed carbon fluxes, forest structure and demographic rates using an individual-based, traits-continua model. The unique model structure allows us to explore linkages between climate, traits, carbon cycling, tree mortality and forest structure. Crucially, we include trait continua, which allow representation of diverse plant strategies. We found that between two contrasting sites, differences in productivity were driven by climate, rather than plant traits. Drivers of simulated forest structure were more complex, with a key role for WD mediated by its link to tree mortality, and surprisingly little effect of varying leaf traits. Our simulations showed consistent shifts in WD during simulations but not leaf traits, and highlighted the importance of including trait trade-offs. Future model development should focus on linking soil physical properties to mortality, improving allocation between organs and organ level respiration, differentially parameterizing the physiology of trees under different levels of shading, and adding hydraulic traits. This type of model that incorporates diverse tree strategies, detailed forest structure and realistic physiology is necessary if we are to be able to simulate tropical forest responses to global change scenarios.
Author Contributions
SF, MG, NF, YM, and OP designed the study, SF performed simulations and wrote the paper, SF, NF, MG, YM, TB, BC, and DG contributed to model development, all other authors contributed data and commented on or approved the manuscript.
Conflict of Interest Statement
The authors declare that the research was conducted in the absence of any commercial or financial relationships that could be construed as a potential conflict of interest.
Acknowledgments
SF was supported by the São Paulo Research Foundation (FAPESP 2014/13322-9), SF and MG were supported by NERC (AMAZONICA NE/F005806/1, ECOFOR NE/K01944X/1, BIO-RED NE/N012542/1) and ERC (GEM-TRAIT 321121). NF was supported by a Marie Curie Intra-European Fellowship within the EU FP7. BC was partially supported by the EU FP7 project AMAZALERT. Data collection following RAINFOR protocols was supported by several grants from NERC, the EU (T-FORCES 103919, PAN-AMAZONIA 74254, GEOCARBON 283080), and the Moore Foundation (1656, 3000). We acknowledge the help of collaborators including Jon Lloyd, Fredy Ramirez, Filio Farfán Amézquita, Roberta Martin, Plinio Barbosa Camargo, Eliana Jimenez-Rojas, Casimiro Mendoza, Irina Mendoza Polo, Maria Cristina Peñuela Mora, and Gabriela Lopez-Gonzalez, Aurora Levesley, and Georgia Pickavance for database management. This work is a product of the RAINFOR, ABERG and GEM research consortia, and was funded by grants from the Gordon and Betty Moore Foundation to the Amazon Forest Inventory Network (RAINFOR) and the Andes Biodiversity and Ecosystems Research Group (ABERG), and grants to YM from the UK Natural Environment Research Council (Grants NE/D01025X/1, NE/D014174/1), and an ERC Advanced Investigator Award to YM (GEM-TRAIT: 321131).
Supplementary Material
The Supplementary Material for this article can be found online at: https://www.frontiersin.org/articles/10.3389/feart.2019.00083/full#supplementary-material
References
Antonarakis, A. S., Saatchi, S. S., Chazdon, R. L., and Moorcroft, P. R. (2011). Using Lidar and Radar measurements to constrain predictions of forest ecosystem structure and function. Ecol. Appl. 21, 1120–1137. doi: 10.1890/10-0274.1
Aragão, L. E. O. C., Malhi, Y., Metcalfe, D. B., Silva-Espejo, J. E., Jimenez, E., Navarette, D., et al. (2009). Above- and below-ground net primary productivity across Amazonian forests on contrasting soils. Biogeosciences 6, 2759–2778. doi: 10.5194/bg-6-2759-2009
Aubry-Kientz, M., Hérault, B., Ayotte-Trépanier, C., Baraloto, C., and Rossi, V. (2013). Toward trait-based mortality models for tropical forests. PLoS ONE 8:e63678. doi: 10.1371/journal.pone.0063678
Baker, T. R., Phillips, O. L., Laurance, W. F., Pitman, N. C. A., Almeida, S., Arroyo, L., et al. (2009). Do species traits determine patterns of wood production in Amazonian forests? Biogeoscieces 6, 297–307. doi: 10.5194/bg-6-297-2009
Baker, T. R., Phillips, O. L., Malhi, Y., Almeida, S., Arroyo, L., Di Fiore, A., et al. (2004). Variation in wood density determines spatial patterns in Amazonian forest biomass. Glob. Chang. Biol. 10, 545–562. doi: 10.1111/j.1365-2486.2004.00751.x
Baraloto, C., Rabaud, S., Molto, Q., Blanc, L., Fortunel, C., Hérault, B., et al. (2011). Disentangling stand and environmental correlates of aboveground biomass in Amazonian forests. Glob. Chang. Biol. 17, 2677–2688. doi: 10.1111/j.1365-2486.2011.02432.x
Bartlett, M. K., Klein, T., Jansen, S., Choat, B., and Sack, L. (2016). The correlations and sequence of plant stomatal, hydraulic, and wilting responses to drought. PNAS 113, 13098–13103. doi: 10.1073/pnas.1604088113
Bigler, C. B. (2016). Trade-offs between growth rate, tree size and lifespan of mountain pine (Pinus montana) in the Swiss National Park. PLoS ONE 11:e0150402. doi: 10.1371/journal.pone.0150402
Bohlman, S., and Pacala, S. (2012). A forest structure model that determines crown layers and partitions growth and mortality rates for landscape-scale applications of tropical forests. J. Ecol. 100, 508–518 doi: 10.1111/j.1365-2745.2011.01935.x
Brienen, R. J. W., Phillips, O. L., Feldpausch, T. R., Gloor, E., Baker, T. R., Lloyd, J., et al. (2015). Long-term decline of the Amazon carbon sink. Nature 519, 344–348. doi: 10.1038/nature14283
Cardoso, D., Särkinen, T., Alexander, S., Amorim, A. M., Bittrich, V., Celis, M., et al. (2017). Amazon plant diversity revealed by a taxonomically verified species list. Proc. Natl. Acad. Sci. U S A. 114, 10695–10700. doi: 10.1073/pnas.1706756114
Chao, K. J., Phillips, O. L., Gloor, E., Monteagudo, A., Torres-Lezama, A., and Vásquez Martínez, R. (2008). Growth and wood density predict tree mortality in Amazon forests. J. Ecol. 96, 281–292. doi: 10.1111/j.1365-2745.2007.01343.x
Christoffersen, B. O., Gloor, M., Fauset, S., Fyllas, N. M., Glabraith, D. R., Baker, T. R., et al. (2016). Linking hydraulic traits to tropical forest function in a size-structured and trait-driven model (TFS v.1-Hydro). Geosci. Model Dev. 9, 4227–4255. doi: 10.5194/gmd-9-4227-2016
DeAngelis, D. L. (1988). Strategies and difficulties of applying models to aquatic populations and food webs. Ecol. Modell. 43, 57–73. doi: 10.1016/0304-3800(88)90073-7
del Aquila-Pasquel, J., Doughty, C. E., Metcalfe, D. B., Silva-Espejo, J. E., Girardin, C. A. J., Chung Gutierrez, J. A., et al. (2014). The seasonal cycle of productivity, metabolism and carbon dynamics in a wet aseasonal forest in north-west Amazonia (Iquitos, Peru). Plant Ecol. Diversity. 7, 71–83 doi: 10.1080/17550874.2013.798365
DeWalt, S., and Chave, J. (2004). Structure and biomass of four lowland Neotropical forests. Biotropica 36, 7–19. doi: 10.1111/j.1744-7429.2004.tb00291.x
Domingues, T. F., Meir, P., Feldpausch, T. R., Saiz, G., Veenendaal, E. M., Schrodt, F., et al. (2010). Co-limitation of photosynthetic capacity by nitrogen and phosphorus in West Africa woodlands. Plant Cell Environ. 33, 959–980. doi: 10.1111/j.1365-3040.2010.02119.x
Doughty, C. E., Malhi, Y., Araujo-Murakami, A., Metcalfe, D. B., Silva-Espejo, J. E., Arroyo, L., et al. (2014). Allocation trade-offs dominate the response of tropical forest growth to seasonal and interannual drought. Ecology 95, 2192–2201. doi: 10.1890/13-1507.1
Doughty, C. E., Metcalfe, D. B., Girardin, C. A. J., Amezquita, F. F., Durand, L., Huaraca Huasco, W., et al. (2015). Source and sink dynamics and carbon allocation in the Amazon basin. Global Biogeochem. Cycles. 29, 645–655. doi: 10.1002/2014GB005028
Egea, G., Verhoef, A., and Vidale, P. L. (2011). Towards an improved and more flexible representation of water stress in coupled photosynthesis–stomatal conductance models. Agric. Forest Meteorol. 151, 1370–1384. doi: 10.1016/j.agrformet.2011.05.019
Enquist, B. J., and Niklas, K. J. (2001). Invariant scaling relationships across tree-dominated communities. Nature 410, 655–660. doi: 10.1038/35070500
Esquivel-Muelbert, A., Baker, T. R., Dexter, K. G., Lewis, S. L., Brienen, R. J. W., Feldpausch, T. R., et al. (2019). Compositional response of Amazon forests to climate change. Glob. Chang. Biol. 25:39–56. doi: 10.1111/gcb.14413
Farquhar, G. D., von Caemmerer, S., and Berry, J. A. (1980). A biochemical model of photosynthetic CO2 assimilation in leaves of C3 species. Planta 149, 78–90. doi: 10.1007/BF00386231
Farrior, C. E., Bohlman, S. A., Hubbell, S., and Pacala, S. W. (2016). Dominance of the suppressed: power-law size structure in tropical forests. Science 351, 155–157. doi: 10.1126/science.aad0592
Fauset, S., Johnson, M. O., Gloor, M., Baker, T. R., Monteagudo M, A., Brienen, R. J., et al. (2015). Hyperdominance in Amazonian forest carbon cycling. Nat. Commun. 6:6857. doi: 10.1038/ncomms7857
Feldpausch, T. R., Lloyd, J., Lewis, S. L., Brienen, R. J. W., Gloor, M., Monteagudo Mendoza, A., et al. (2012). Tree height integrated into pantropical forest biomass estimates. Biogeosciences 9, 3381–3403. doi: 10.5194/bg-9-3381-2012
Feldpausch, T. R., Phillips, O. L., Brienen, R. J. W., Gloor, E., Lloyd, J., Lopez-Gonzalez, G., et al. (2016). Amazon forest response to repeated droughts. Global Biogeochem. Cycles. 30, 964–982. doi: 10.1002/2015GB005133
Fischer, R., Bohn, F., de Paula, M. D., Dislich, C., Groeneveld, J., Gutiérrez, A. G., et al. (2016). Lessons learned from applying a forest gap model to understand ecosystem and carbon dynamics of complex tropical forests. Ecol. Modell. 326, 124–133. doi: 10.1016/j.ecolmodel.2015.11.018
Fisher, R. A., Koven, C. D., Anderegg, W. R. L., Christoffersen, B. O., Dietze, M. C., Farrior, C. E., et al. (2018). Vegetation demographics in earth system models: a review of progress and priorities. Glob. Chang. Biol. 24, 35–54. doi: 10.1111/gcb.13910
Fyllas, N. M., Bentley, L. P., Shenkin, A., Asner, G. P., Atkin, O. K., Dìaz, S., et al. (2017). Solar radiation and functional traits explain the decline of forest primary productivity along a tropical elevation gradient. Ecol. Lett. 20, 730–740. doi: 10.1111/ele.12771
Fyllas, N. M., Gloor, E., Mercado, L. M., Sitch, S., Quesada, C. A., Domingues, T. F., et al. (2014). Analysing Amazonian forest productivity using a new individual and trait-based model (TFS v.1). Geosci. Model Dev. 7, 1251–1269. doi: 10.5194/gmd-7-1251-2014
Fyllas, N. M., Patiño, S., Baker, T. R., Bielefeld Nardoto, G., Martinelli, L. A., Quesada, C. A., et al. (2009). Basin-wide variations in foliar properties of Amazonian forest: phylogeny, soils and climate. Biogeosciences 6, 2677–2708. doi: 10.5194/bg-6-2677-2009
Fyllas, N. M., Politi, P. I., Galanidis, A., Dimitrakopoulos, P. G., and Arianoutsou, M. (2010). Simulating regeneration and vegetation dynamics in Mediterranean coniferous forests. Ecol. Modell. 221, 1494–1504. doi: 10.1016/j.ecolmodel.2010.03.003
Galbraith, D., Malhi, Y., Affum-Baffoe, K., Castanho, A. D. A., Doughty, C. E., Fisher, R. A., et al. (2013). Residence times of woody biomass in tropical forests. Plant Ecol. Diversity 6, 139–157. doi: 10.1080/17550874.2013.770578
Gatti, L. V., Gloor, M., Miller, J. B., Doughty, C. E., Malhi, Y., Domingues, L. G., et al. (2014). Drought sensitivity of Amazonian carbon balance revealed by atmospheric measurements. Nature 506, 76–80. doi: 10.1038/nature12957
Girardin, C. A. J., Malhi, Y., Doughty, C. E., Metcalfe, D. B., Meir, P., del Aguila-Pasquel, J., et al. (2016). Seasonal trends of Amazonian rainforest phenology, net primary productivity, and carbon allocation. Global Biogeochem. Cycles. 30, 700–715. doi: 10.1002/2015GB005270
Grimm, V., and Berger, U. (2016). Structural realism, emergence, and predictions in next-generation ecological modelling: synthesis from a special issue. Ecol. Modell. 326, 177–187. doi: 10.1016/j.ecolmodel.2016.01.001
Guan, K., Pan, M., Li, H., Wolf, A., Wu, J., Medvigy, D., et al. (2015). Photosynthetic seasonality of global tropical forests constrained by hydroclimate. Nat. Geosci. 8, 284–289. doi: 10.1038/ngeo2382
Herault, B., Bachelot, B., Poorter, L., Rossi, V., Bongers, F., Chave, J., et al. (2011). Functional traits shape ontogenetic growth trajectories of rain forest tree species. J. Ecol. 99, 1431–1440. doi: 10.1111/j.1365-2745.2011.01883.x
Hubau, W., DeMil, T., Van den Bulke, J., Phillips, O. L., Angoboy Ilondea, B., Van Acker, J., et al. (2019). The persistence of carbon in the African forest understory. Nat. Plants 5, 133–140. doi: 10.1038/s41477-018-0316-5
Hutyra, L. R., Munger, J. W., Saleska, S. R., Gottlieb, E., Daube, B. C., Dunn, A. L., et al. (2007). Seasonal controls on the exchange of carbon and water in an Amazonian rain forest. J. Geophys. Res. 112:G03008. doi: 10.1029/2006JG000365
Jiménez, E. M., Moreno, F. H., Peñuela, M. C., Patiño, S., and Lloyd, J. (2009). Fine root dynamics for forests on contrasting soils in the Colombian Amazon. Biogeosciences 6, 2809–2827. doi: 10.5194/bg-6-2809-2009
Joetzjer, E., Delire, C., Douville, H., Ciais, P., Decharme, B., Fisher, R., et al. (2014). Predicting the response of the Amazon rainforest to persistent drought conditions under current and future climates: a major challenge for global land surface models. Geosci Model Dev 7, 2933–2950. doi: 10.5194/gmd-7-2933-2014
Johnson, M. O., Baker, T. R., Galbraith, D., Gloor, M., de Deurwaerder, H., Guimberteau, M., et al. (2016). Variation in stem mortality rates determines patterns of above-ground biomass in Amazonian forests: implications for dynamic global vegetation models. Global Change Biol. 22, 3996–4013. doi: 10.1111/gcb.13315
King, D. A., Davies, S. J., and Noor, N. S. M. (2006). Growth and mortality are related to adult tree size in a Malaysian mixed dipterocarp forest. For. Ecol. Manage. 223, 152–158. doi: 10.1016/j.foreco.2005.10.066
Klein, T. (2014). The variability of stomatal sensitivity to leaf water potential across tree species indicates a continuum between isohydric and anisohydric behaviours. Funct. Ecol. 28, 1313–1320. doi: 10.1111/1365-2435.12289
Köhler, P., and Huth, A. (1998). The effects of tree species grouping in tropical rainforest modeling: simulations with the individual-based model FORMIND. Ecol. Modell. 109, 301–321. doi: 10.1016/S0304-3800(98)00066-0
Kraft, N. J. B., Metz, M., Condit, R. S., and Chave, J. (2010). The relationship between wood density and mortality in a global tropical forest data set. New Phytologist 188, 1124–1136. doi: 10.1111/j.1469-8137.2010.03444.x
Lewis, S. L., Lopez-Gonzalez, G., Sonké, B., Affum-Baffoe, K., Baker, T. R., Ojo, L. O., et al. (2009). Increasing carbon storage in intact African tropical forests. Nature 457, 1003–1006. doi: 10.1038/nature07771
Lines, E. R., Coomes, D. A., and Purves, D. W. (2010). Influences on forest structure, climate and species composition on tree mortality across the eastern US. PLoS ONE 5:e13212. doi: 10.1371/journal.pone.0013212
Long, J. N., and Smith, W. (1983). Relation between size and density in developing stands: a description and possible mechanisms. For. Ecol. Manage. 7, 191–206. doi: 10.1016/0378-1127(84)90067-7
Lopez-Gonzalez, G., Lewis, S. L., Burkitt, M., Baker, T. R., and Phillips, O. L. (2009). ForestPlots.net Database [Web document]. Available online at: www.forestplots.net. (accessed June 1, 2015).
Lopez-Gonzalez, G., Lewis, S. L., Burkitt, M., and Phillips, O. L. (2011). ForestPlots.net: a web application and research tool to manage and analyse tropical forest plot data. J. Veget. Sci. 22, 610–613. doi: 10.1111/j.1654-1103.2011.01312.x
Malhi, Y., Doughty, C., and Galbraith, D. (2011). The allocation of ecosystem net primary productivity in tropical forests. Philos. Trans. R. S. B. 366, 3225–3245. doi: 10.1098/rstb.2011.0062
Malhi, Y., Doughty, C. E., Goldsmith, G. R., Metcalfe, D. B., Girardin, C. A. J., Marthews, T. R., et al. (2015). The linkages between photosynthesis, productivity, growth and biomass in lowland Amazonian forests. Glob. Chang. Biol. 21:2283–2295. doi: 10.1111/gcb.12859
Malhi, Y., Farfán Amézquita, F., Doughty, C. E., Silva-Espejo, J. E., Girardin, C. A. J., Metcalfe, D. B., et al. (2014). The productivity, metabolism and carbon cycle of two lowland tropical forest plots in south-western Amazonia, Peru. Plant Ecol. Diversity. 7, 85–105. doi: 10.1080/17550874.2013.820805
Malhi, Y., Wood, D., Baker, T. R., Wright, J., Phillips, O. L., Cochrane, T., et al. (2006). The regional variation of aboveground live biomass in old-growth Amazonian forests. Glob. Chang. Biol. 12, 1–32. doi: 10.1111/j.1365-2486.2006.01120.x
Marechaux, I., and Chave, J. (2017). An individual-based forest model to jointly simulate carbon and tree diversity in Amazonia: description and applications. Ecol. Monogr. 87, 632–664. doi: 10.1002/ecm.1271
Markesteijn, M., Poorter, L., Bongers, F., Paz, H., and Sack, L. (2011). Hydraulics of tropical dry forest tree species: coordination of species' drought and shade tolerance. New Phytologist 191, 480–495. doi: 10.1111/j.1469-8137.2011.03708.x
Marthews, T., Riutta, T., Oliveras Menor, I., Urrutia, R., Moore, S., Metcalfe, D., et al. (2014). Measuring Tropical Forest Carbon Allocation and Cycling: A RAINFOR-GEM Field Manual for Intensive Census Plots (v3.0). Manual, Global Ecosystems Monitoring network. Available online at: http://gem.tropicalforests.ox.ac.uk/
Martínez-Vilalta, J., Sala, A., Asensio, D., Galiano, L., Hoch, G., Palacio, S., et al. (2016). Dynamics of non-structural carbohydrates in terrestrial plants: a global synthesis. Ecol. Monogr. 86, 495–516. doi: 10.1002/ecm.1231
Medgivy, D., and Moorcroft, P. R. (2012). Predicting ecosystem dynamics at regional scales: an evaluation of a terrestrial biosphere model for the forests of northeastern North America. Philos. Trans. R. Soc. B 367, 222–235. doi: 10.1098/rstb.2011.0253
Medvigy, D., Wofsy, S. C., Munger, J. W., Hollinger, D. Y., and Moorcroft, P. R. (2009). Mechanistic scaling of ecosystem function and dynamics in space and time: Ecosystem Demography model version 2. J. Geophys. Res. 114:G01002. doi: 10.1029/2008JG000812
Meinzer, F. C., Woodruff, D. R., Marias, D. E., Smith, D. D., McCulloh, K. A., Howard, A. R., et al. (2016). Mapping ‘hydroscapes' along the iso- to anisohydric continuum of stomatal regulation of plant water status. Ecol. Lett. 19, 1343–1352. doi: 10.1111/ele.12670
Mitchard, E. T. A., Feldpausch, T. R., Brienen, R. J. W., Lopez-Gonzalez, G., Monteagudo, A., Baker, T. R., et al. (2014). Markedly divergent estimates of Amazon forest carbon density from ground plots and satellites. Global Ecol. Biogeogr. 23, 935–946. doi: 10.1111/geb.12168
Moorcroft, P. R., Hurtt, G. C., and Pacala, S. W. (2001). A method for scaling vegetation dynamics: the ecosystem demography model (ED). Ecol. Monogr. 71, 557–586. doi: 10.1890/0012-9615(2001)071[0557:AMFSVD]2.0.CO;2
Muller-Landau, H. C. (2004). Interspecific and inter-site variation in wood specific gravity of tropical trees. Biotropica 36, 20–32. doi: 10.1111/j.1744-7429.2004.tb00292.x
Pacala, S. W., Canham, C. D., Saponara, J., Silander, J. A. Jr., Kobe, R. K., and Ribbens, E. (1996). Forest models defined by field measurements: Estimation, error analysis and dynamics. Ecol. Monogr. 66, 1–43. doi: 10.2307/2963479
Pan, Y., Birdsey, R. A., Fang, J., Houghton, R., Kauppi, P. E., Kurz, W. A., et al. (2011). A large and persistent carbon sink in the world's forests. Science 333, 988–993. doi: 10.1126/science.1201609
Phillips, O. L., Aragão, L. E. O. C., Lewis, S. L., Fisher, J. B., Lloyd, J., López-González, G., et al. (2009). Drought sensitivity of the Amazon Rainforest. Science 323, 1344–1347. doi: 10.1126/science.1164033
Phillips, O. L., Baker, T. R., Arroyo, L., Higuchi, N., Killeen, T. J., Laurance, W. F., et al. (2004). Pattern and process in Amazon tree turnover, 1976-2001. Philos. Trans. R. Soc. Lond. B 359, 381–407. doi: 10.1098/rstb.2003.1438
Phillips, O. L., Baker, T. R., Feldpausch, T., and Brienen, R. J. W. (2016). RAINFOR Field Manual for Plot Establishment and Remeasurement. Available online at: https://www.forestplots.net/upload/ManualsEnglish/RAINFOR_field_manual_EN.pdf
Poorter, L., Sande, M. T., van der, Arets, E. J. M. M., Ascarrunz, N., Enquist, B. J., Finegan, B., et al. (2017). Biodiversity and climate determine the functioning of Neotropical forests. Global Ecol. Biogeogr. 26, 1423–1434. doi: 10.1111/geb.12668
Poorter, L., van der Sande, M. T., Thompson, J., Arets, E. J. M. M., Alarcón, A., Álvarez?Sánchez, J., et al. (2015). Diversity enhances carbon storage in tropical forests. Global Ecol. Biogeogr. 24, 1314–1328. doi: 10.1111/geb.12364
Purves, D. W., Lichstein, J. W., and Pacala, S. W. (2007). Crown plasticity and competition for canopy space: a new spatially implicit model parameterized for 250 north American tree species. PLoS ONE 2:e870. doi: 10.1371/journal.pone.0000870
Quesada, C. A., Lloyd, J., Schwarz, M., Patiño, S., Baker, T. R., Czimczik, C., et al. (2010). Variations in chemical and physical properties of Amazon forest soils in relation to their genesis. Biogeosciences 7, 1515–1541. doi: 10.5194/bg-7-1515-2010
Quesada, C. A., Phillips, O. L., Schwarz, M., Czimczik, C. I., Baker, T. R., Patiño, S., et al. (2012). Basin-wide variations in Amazon forest structure and function are mediated by both soils and climate. Biogeosciences 9, 2203–2246. doi: 10.5194/bg-9-2203-2012
R Core Team (2012). R: A language and Environment for Statistical Computing. Vienna: R Foundation for Statistical Computing. Available online at: https://www.R-project.org/.
Reich, P. B. (2014). The world-wide ‘fast-slow' plant economics spectrum: a traits manifesto. J. Ecol. 102, 275–301. doi: 10.1111/1365-2745.12211
Restrepo-Coupe, N., da Rocha, H. R., Hutyra, L. R., de Araujo, A. C., Borma, L. S., Christoffersen, B., et al. (2013). What drives the seasonality of photosynthesis across the Amazon basin? A cross-site analysis of eddy flux tower measurements from the Brasil flux network. Agric. Forest Meteorol. 182–183, 128–144. doi: 10.1016/j.agrformet.2013.04.031
Rowland, L., da Costa, A. C. L., Galbraith, D. R., Oliveira, R. S., Binks, O. J., Oliveira, A. A. R., et al. (2015). Death from drought in tropical forests is triggered by hydraulics not carbon starvation. Nature 528, 119–122. doi: 10.1038/nature15539
Ruger, N., Wirth, C., Wright, S. J., and Condit, R. (2012). Functional traits explain light and size response of growth rates in tropical tree species. Ecology 93, 2626–2636. doi: 10.1890/12-0622.1
Sakschewski, B., Von Bloh, W., Boit, A., Rammig, A., Kattge, J., Poorter, L., et al. (2015). Leaf and stem economics spectra drive diversity of functional plant traits in a dynamic global vegetation model. Glob. Chang. Biol. 21, 2711–2725. doi: 10.1111/gcb.12870
Sato, H. (2009). Simulation of the vegetation structure and function in a Malaysian tropical rain forest using the individual-based dynamic vegetation model SEIB-DGVM. For. Ecol. Manage. 257, 2277–2286. doi: 10.1016/j.foreco.2009.03.002
Sato, H., Itoh, A., and Kohyama, T. (2007). SEIB-DVGM: a new dynamic global vegetation model using a spatially explicit individual-based approach. Ecol. Modell. 200, 279–307. doi: 10.1016/j.ecolmodel.2006.09.006
Scheiter, S., Langan, L., and Higgins, S. I. (2013). Next-generation dynamic global vegetation models: learning from community ecology. New Phytologist 198, 957–969. doi: 10.1111/nph.12210
Sheffield, J., Goteti, G., and Wood, E. F. (2006). Development of a 50-year high-resolution global dataset of meteorological forcings for land surface modeling. J. Clim. 19, 3088–3111. doi: 10.1175/JCLI3790.1
Shugart, H. H., Wang, B., Fischer, R., Ma, J., Yan, X., Huth, H., et al. (2018). Gap models and their individual-based relatives in the assessment of the consequences of global change. Environ. Res. Lett. 13:033001. doi: 10.1088/1748-9326/aaaacc
Smith, B., Prentice, I. C., and Syke, M. T. (2001). Representation of vegetation dynamics in the modelling of terrestrial ecosystems: comparing two contrasting approaches within European climate space. Glob. Ecol. Biogeogr. 10, 621–637. doi: 10.1046/j.1466-822X.2001.00256.x
ter Steege, H., Pitman, N. C. A., Phillips, O. L., Chave, J., Sabatier, D., Duque, A., et al. (2006). Continental-scale patterns of canopy tree composition and function across Amazonia. Nature 443, 444–447. doi: 10.1038/nature05134
ter Steege, H., Pitman, N. C. A., Sabatier, D., Baraloto, C., Salomão, R. P., Guevara, J. E., et al. (2013). Hyperdominance in the Amazonian tree flora. Science 342:1243092. doi: 10.1126/science.1243092
van der Sande, M. T., Arets, E. J. M. M., Peña-Claros, M., de Avila, A. L., Roopsind, A., Mazzei, L., et al. (2016). Old-growth Neotropical forests are shifting in species and trait composition. Ecol. Monogr. 86, 228–243. doi: 10.1890/15-1815.1
Verhoef, A., and Egea, G. (2014). Modeling plant transpiration under limited soil water: comparison of different plant and soil hydraulic parameterizations and preliminary implications for their use in land surface models. Agric. Forest Meteorol. 191, 22–32. doi: 10.1016/j.agrformet.2014.02.009
Welden, C. W., Hewett, S. W., Hubbell, S. P., and Foster, R. B. (1991). Sapling survival, growth, and recruitment: relationship to canopy height in a Neotropical forest. Ecology, 72, 35–50. doi: 10.2307/1938900
Wright, I. J., Reich, P. B., Westoby, M., Ackerly, D. D., Baruch, Z., Bongers, F., et al. (2004). The worldwide leaf economics spectrum. Nature 428, 821–827. doi: 10.1038/nature02403
Keywords: Amazon, carbon cycle, climate, forest dynamics, functional traits, leaf economics spectrum, tropical forest, vegetation model
Citation: Fauset S, Gloor M, Fyllas NM, Phillips OL, Asner GP, Baker TR, Patrick Bentley L, Brienen RJW, Christoffersen BO, del Aguila-Pasquel J, Doughty CE, Feldpausch TR, Galbraith DR, Goodman RC, Girardin CAJ, Honorio Coronado EN, Monteagudo A, Salinas N, Shenkin A, Silva-Espejo JE, van der Heijden G, Vasquez R, Alvarez-Davila E, Arroyo L, Barroso JG, Brown F, Castro W, Cornejo Valverde F, Davila Cardozo N, Di Fiore A, Erwin T, Huamantupa-Chuquimaco I, Núñez Vargas P, Neill D, Pallqui Camacho N, Gutierrez AP, Peacock J, Pitman N, Prieto A, Restrepo Z, Rudas A, Quesada CA, Silveira M, Stropp J, Terborgh J, Vieira SA and Malhi Y (2019) Individual-Based Modeling of Amazon Forests Suggests That Climate Controls Productivity While Traits Control Demography. Front. Earth Sci. 7:83. doi: 10.3389/feart.2019.00083
Received: 27 July 2018; Accepted: 08 April 2019;
Published: 30 April 2019.
Edited by:
Ken Takahashi, Servicio Nacional de Meteorología e Hidrología del Perú (SENAMHI), PeruReviewed by:
Jennifer Holm, Lawrence Berkeley National Laboratory, United StatesIsabelle Maréchaux, Institut National de la Recherche Agronomique Centre Montpellier, France
Liam Jude Langan, Senckenberg Biodiversity and Climate Research Centre, Germany
Copyright © 2019 Fauset, Gloor, Fyllas, Phillips, Asner, Baker, Patrick Bentley, Brienen, Christoffersen, del Aguila-Pasquel, Doughty, Feldpausch, Galbraith, Goodman, Girardin, Honorio Coronado, Monteagudo, Salinas, Shenkin, Silva-Espejo, van der Heijden, Vasquez, Alvarez-Davila, Arroyo, Barroso, Brown, Castro, Cornejo Valverde, Davila Cardozo, Di Fiore, Erwin, Huamantupa-Chuquimaco, Núñez Vargas, Neill, Pallqui Camacho, Gutierrez, Peacock, Pitman, Prieto, Restrepo, Rudas, Quesada, Silveira, Stropp, Terborgh, Vieira and Malhi. This is an open-access article distributed under the terms of the Creative Commons Attribution License (CC BY). The use, distribution or reproduction in other forums is permitted, provided the original author(s) and the copyright owner(s) are credited and that the original publication in this journal is cited, in accordance with accepted academic practice. No use, distribution or reproduction is permitted which does not comply with these terms.
*Correspondence: Sophie Fauset, c29waGllLmZhdXNldEBwbHltb3V0aC5hYy51aw==
†Present Address: Sophie Fauset, School of Geography, Earth and Environmental Sciences, University of Plymouth, Plymouth, United Kingdom