 Clara Armaroli
 Enrico Duo
 Christophe Viavattene
- 1Department of Physics and Earth Sciences, University of Ferrara, Ferrara, Italy
- 2Flood Hazard Research Centre, Middlesex University of London, London, United Kingdom
Managing coastal flood risk at the regional scale requires a prioritization of economic resources along the shoreline. Advanced modeling assessment and open-source tools are now available to support transparent and rigorous risk evaluation and to inform managers and stakeholders in their choices. However, the issues lay in data availability and data richness to estimate coastal vulnerability and impacts. The Coastal Risk Assessment Framework (CRAF) has been developed as part of the Resilience Increasing Strategies for Coasts - Toolkit (RISC-KIT) EU FP7 project. The framework provides two levels of analysis. In the first phase, a coastal index approach is applied to identify a restricted number of potential critical areas for different hazards (i.e., erosion and flooding). In the second phase, an integrated hazard and impact modeling approach is applied in the critical areas to assess the direct and indirect impacts of storm events using a matrix-based approach and a systemic analysis. The framework was tested on the coastline of the Emilia-Romagna region (northern Italy) for two probabilistic coastal storms with representative return periods of 10 and 100 years. In this work, the application of the second phase of the CRAF is presented for two sites, Lido degli Estensi-Spina (Ferrara province) and Milano Marittima (Ravenna province). The hazard modeling of floods was implemented using a coupling between XBeach and Lisflood-FP. The Integrated Disruption Assessment (INDRA) model was applied to quantify direct and indirect impacts. The impact assessment focused on household’s financial recovery, business disruption and financial recovery, transport network disruption and risk to life. The considered business sector comprised the key economic activities related to the sun-and-beach tourism, which is one of the main drivers of the regional economy. A Multi-Criteria Analysis was applied to support decision-makers to identify the most critical site. The importance of detailed physical and socio-economic data collected at the regional and local levels is highlighted and discussed, together with the importance to involve different stakeholders in the process (e.g., through interviews and surveys). The limitations of the applied approach due to data quality and availability and to the assumptions introduced in the hazard and disruption models are highlighted.
Introduction
Coastal areas represent one of the most vulnerable environments worldwide due to the high population density and the pressure of human activities. Sea level rise and increased storminess due to climate change is consequently expected to increase coastal flooding and intensify the frequency and magnitude of coastal impacts, posing a threat to coastal communities. The population exposed to coastal flooding is predicted to increase to up to 1.52–3.65 million by the end of the century (Vousdoukas et al., 2018b). In parallel, the present expected annual damage of 1.25 billion Euro is projected to increase, ranging between 93 and 961 billion Euro by the end of the century, thus increasing of two or three orders of magnitude the present expected annual damage (Vousdoukas et al., 2018b). In terms of vulnerability, one fourth of low coastal areas are retreating globally (Luijendijk et al., 2018) and the total amount of eroded land is twice that which is gained (Mentaschi et al., 2018). The IPCC (2018) report highlights that risks can be reduced if proper and effective adaptation and mitigation options are activated. Additionally, the Science for Disaster Risk Management report (Poljanšek et al., 2017) states that “The discrepancies in data quality are sometimes asserted an excuse to delay risk analysis and modeling, but it is infinitely better to embark on a risk assessment and analysis process from the outset than wait until better data become available. A “1-in-100 event” could happen tomorrow, it is better to have tried, and commit resources to develop a greater understanding of the risks as far as possible now (and so identify key weaknesses and data gaps) than postpone action until better data are collected.” Therefore, greater effort should focus on using the best available data and information to carry out comprehensive impact assessments of different hazards. This will provide decision makers with a better idea of the most probable consequences so that they can take action and implement new measures or improve those already in place. Decision makers should also be informed of the uncertainties associated with data and processes used in the quantification of the impact of extreme events.
Whereas risk can be defined by a simple product equation of the hazard probability and its consequences, its quantification remains complex. Assessing the consequences requires the evaluation of hazard intensities together with the direct exposure of assets and their vulnerability (Gouldby et al., 2005). Coastal hazards are of a different nature and intensities and can vary through time (Zscheischler et al., 2018). They can also impact in combination (multi-hazards). Exposure analysis requires the georeferenced mapping of both the built and the natural environment. Land use maps are static by nature and used as such in impact assessment. Yet, the exposed assets may vary by their activities in the short term (e.g., seasonal) or by type in the long term, as land use changes. Vulnerability is even more ambitious to define as it varies through time and includes the intrinsic nature of each exposed element, even for the well-studied flood depth-damage curves where much debate exists on which method provides the most accurate estimation (Jongman et al., 2012). The estimation of indirect and systematic impacts is often avoided biasing decision making toward the direct impacts (Meyer et al., 2013), but must be now encouraged (UNISDR, 2015). Indeed, the impacts of an extreme event can generate effects that last for many weeks or years after the event, and even be permanent, and affect areas and activities that are located far from the coastline and from the impacted site. As a result of difficulties in computing and retrieving the necessary information with a sufficient level of accuracy and reliability, the evaluation of certain consequences is often avoided or implemented by using simple methodologies at large scales, undermining the analysis of critical differences in the impact assessment (Viavattene et al., 2018).
Recent research activities have shown important advancement in risk assessments. Several studies focus on the definition of hazard scenarios, discussing their potential impacts (e.g., Villatoro et al., 2014; Ruol et al., 2018; Favaretto et al., 2019). Most of risk assessment studies combine the hazard evaluation, obtained with various hazard models, with exposure maps to infer the number and nature of probable affected assets (e.g., Perini et al., 2016; Aucelli et al., 2017). Other studies include vulnerability concepts (e.g., Torresan et al., 2012). The obtained results should be considered as an indication of the potential risk, rather than a proper quantification of the risk. Some studies present valuable approaches, combining hazard, vulnerability, and exposure of coastal areas (e.g., Zanuttigh et al., 2014; Erikson et al., 2018). Significant improvements in risk assessment science were delivered by multi-disciplinary projects such as, e.g., THESEUS (Zanuttigh, 2011), MICORE (Ferreira et al., 2009; Ciavola et al., 2011), and RISC-KIT (Van Dongeren et al., 2018). Specifically, the RISC-KIT Project1 (Van Dongeren et al., 2018) developed management tools with the aim to support coastal administrations to perform proper risk and impact assessment, improving the prevention and preparedness phases of the disaster management cycle. The tools were developed to derive a comprehensive analysis of multiple hazards and systemic impacts (Van Dongeren et al., 2018).
The Coastal Risk Assessment Framework (CRAF; Viavattene et al., 2018) is the RISC-KIT regional risk assessment tool aiming to determine where critical coastal sectors (hotspots) are located and where coastal managers should act first, therefore prioritizing their (usually limited) resources. The framework is composed of two phases. A first screening of the coast (Phase 1) that includes the computation of a coastal index based on the identification of exposure indicators and hazard indicators to provide a shortlist of critical sites (hotspots). Subsequently, hotspots are ranked (Phase 2) by applying a risk assessment utilizing more complex hazard models at the local scale (i.e., XBeach, Roelvink et al., 2009; Lisflood-FP, Bates and De Roo, 2000) and the Integrated Disruption Assessment model (INDRA, Viavattene et al., 20152, 2018). The second phase is carried out to compare the selected hotspots in order to define the most critical one at the regional level.
This paper presents the implementation of CRAF Phase 2 for flooding at two coastal hotspots in the Emilia-Romagna (Italy) coast that were identified as critical through CRAF Phase 1 analysis (Armaroli and Duo, 2018). Beyond this, the paper highlights the importance of the quality of the input data for the proper application of an impact assessment, as well as discusses how data quality, hazard modeling uncertainties and damage functions selection could affect the reliability of the final results. The paper discusses the influence of data quality for the interpretation of the results and to identify the most critical hotspot, among the ones selected in CRAF Phase 1, in the context of an urbanized and highly touristic regional coast.
Case Study
The Emilia-Romagna Region (RER hereafter) coastline, facing the north Adriatic Sea in Italy, stretches over 130 km and is composed of low-lying sandy beaches mostly of a dissipative nature (Figure 1, Perini et al., 2016). The majority of landward territories are below mean sea level, with the lower values registered in the Ferrara Province. The coastal area is heavily urbanized, especially in the central-southern parts (Figure 1). A large number of hard protection structures had been constructed starting from the late 1970s in order to protect the coast from erosion and inundation (60% of the regional coastline is protected by hard structures; Perini et al., 2016). There are few pristine sites that are located in natural parks of the Natura 2000 network. The parks represent the only remaining coastal areas where flora and fauna are preserved from anthropisation. However, the vicinity of the natural sites to heavily exploited areas makes them fragile and exposed to degradation.
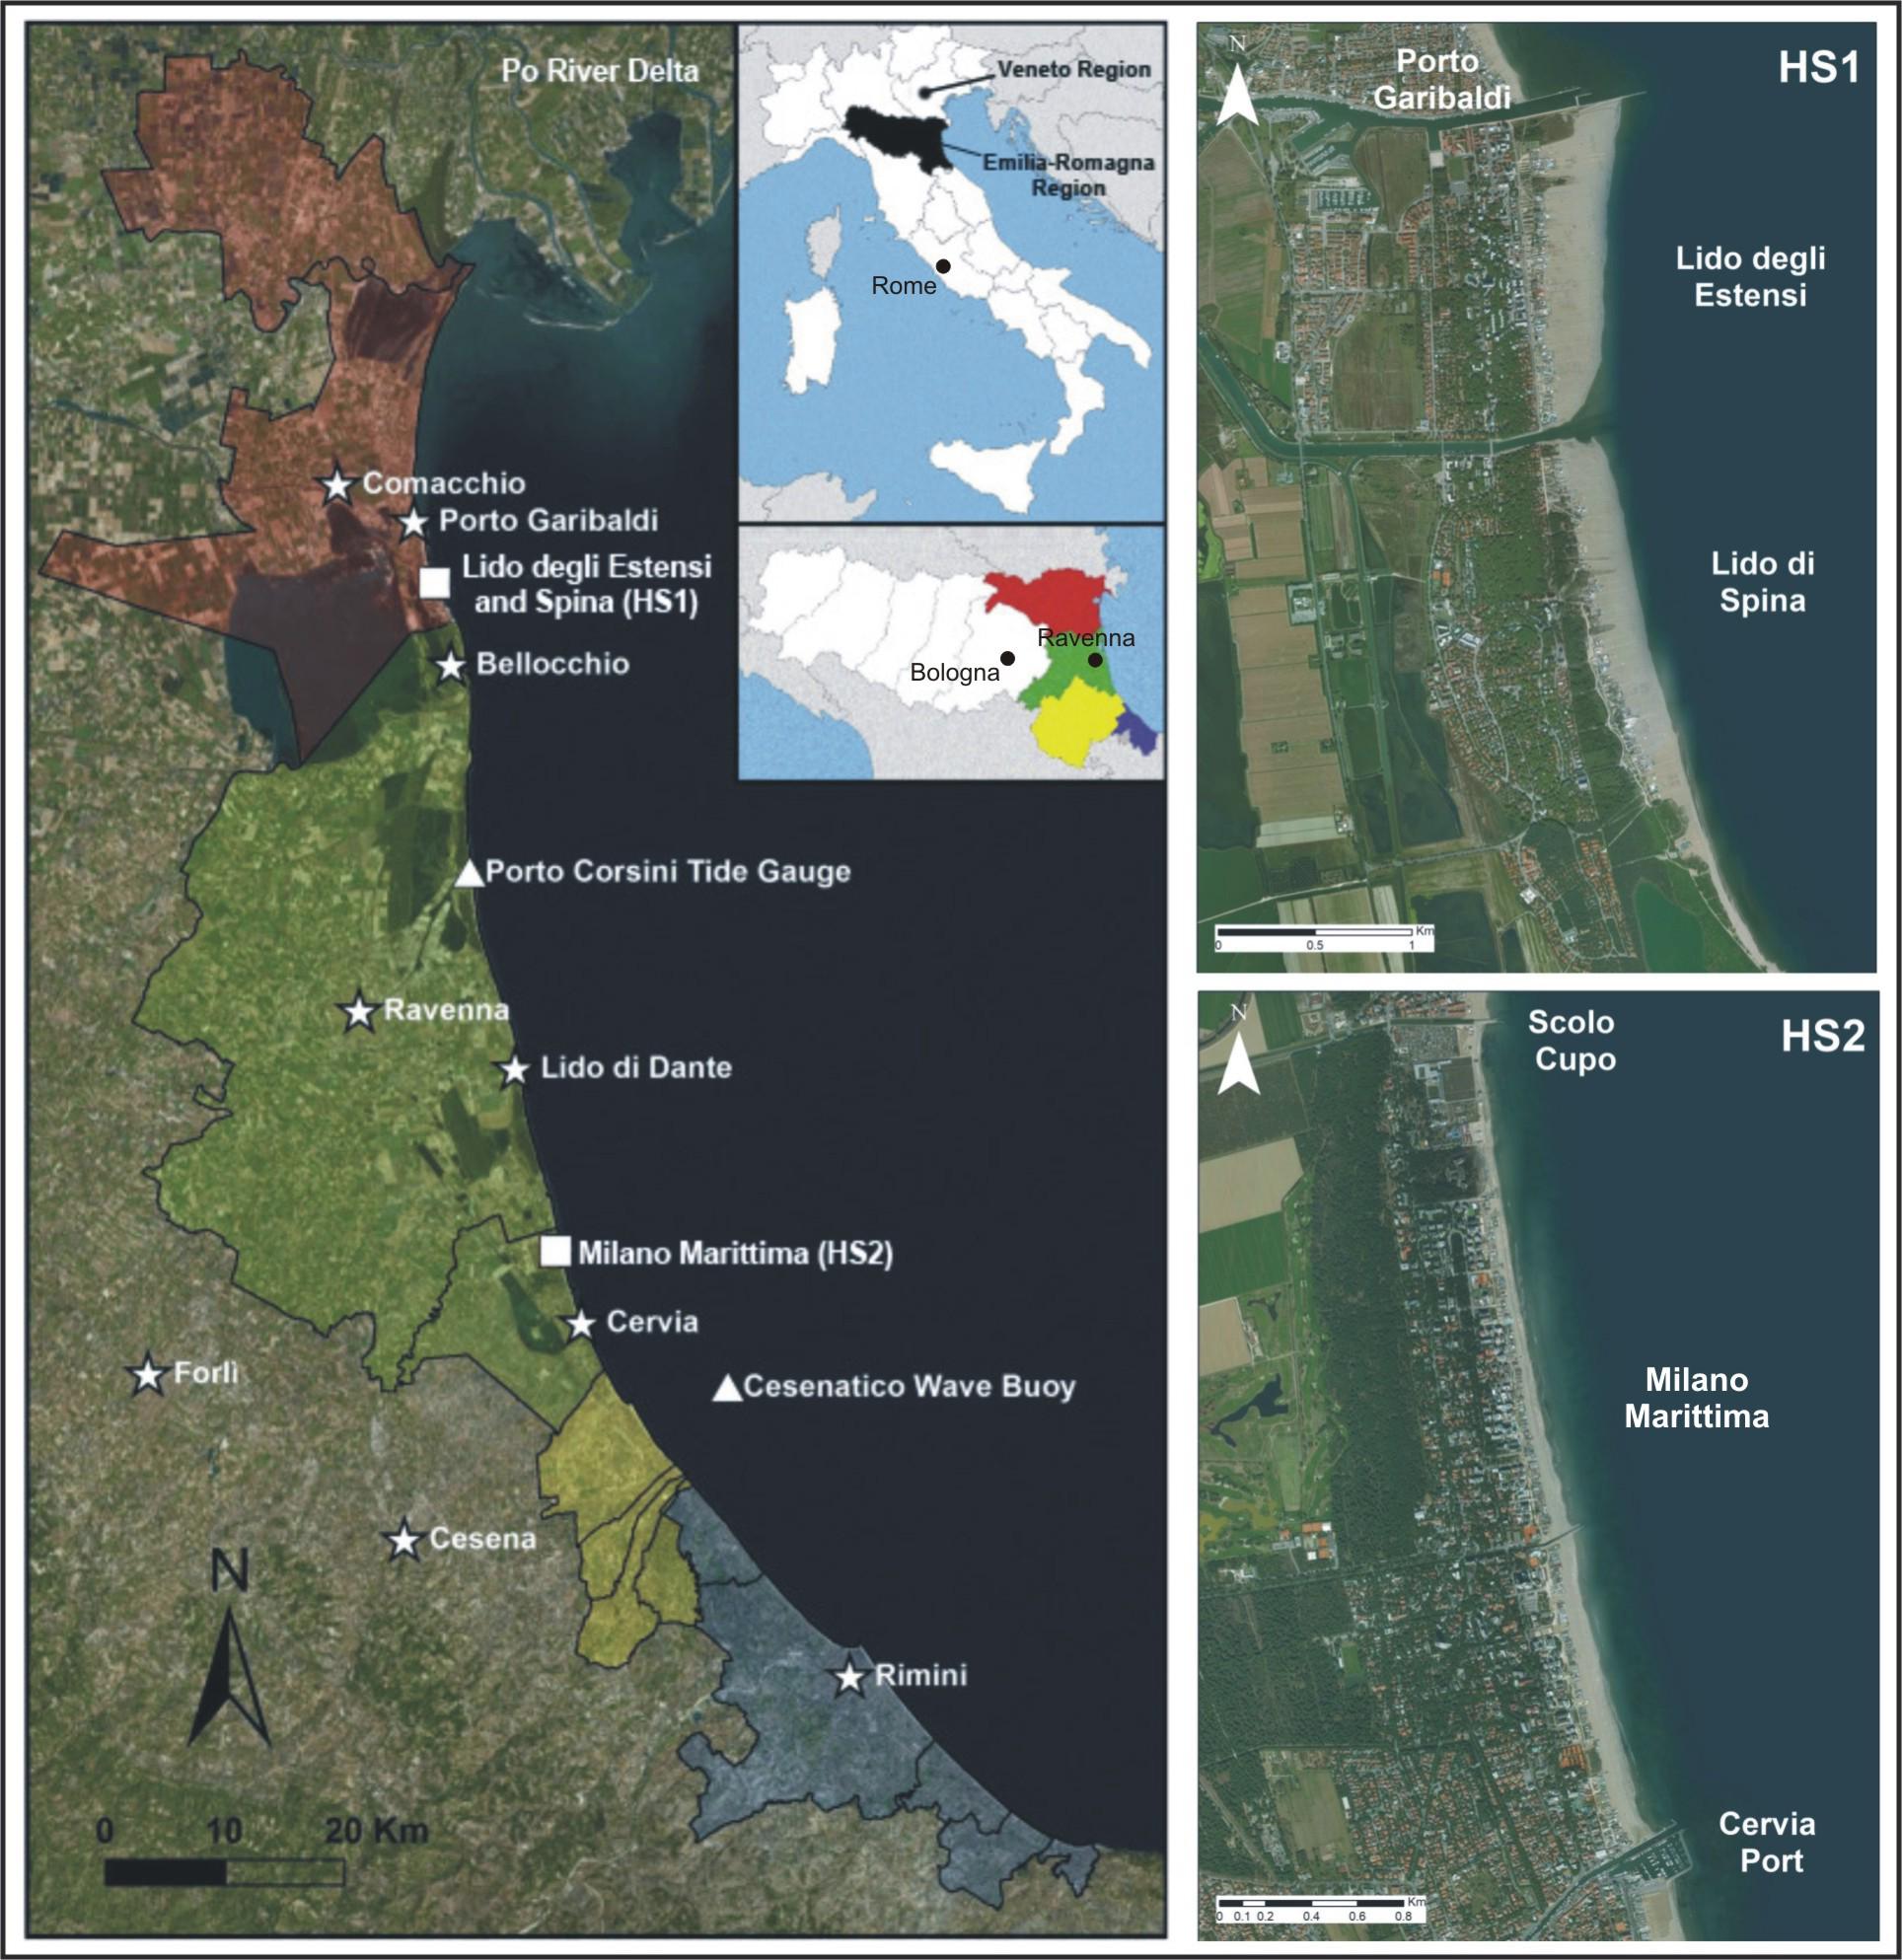
Figure 1. Coastal area of the Emilia Romagna region. The localities cited in the text are indicated. On the right: Lido degli Estensi-Lido di Spina (HS1) and Milano Marittima (HS2). The different colors in the inset indicate the four coastal provinces (modified from Armaroli and Duo, 2018).
The tidal regime is microtidal ranging between 30–40 and 80–90 cm at neap and spring conditions, respectively (Perini et al., 2016). The coastline is exposed to storms from the E-NE and SE directions. Prevailing winds are from the same directions (Bora and Scirocco, respectively) and are able to generate significant storm waves and high surge levels, although the modal wave regime is of low energy (91% of Hs below 1.25 m; Ciavola et al., 2007). The 1-in-1 year return period wave height is 3.3 m with a peak period of 7.7 s (Armaroli et al., 2009). Storm tides represent a threat for the coastal area because they can double the tidal effect (1-in-10 years return period surge ∼1 m, Masina and Ciavola, 2011) and are mainly associated with SE winds. Subsidence rates exacerbate the exposure of coastal lands to the impact of storms. Subsidence affects the whole coastline to varying degrees and is the result of the natural compaction of alluvial sediments that compose the Po River plain and of human activities, such as groundwater and natural gas extraction (Teatini et al., 2005; Taramelli et al., 2015; Perini et al., 2017; Antonellini et al., 2019). The peak values are registered at the coast near Ravenna (2 cm/year).
The main coastal hazards are beach erosion and inundation that cause sediment loss and beach width reduction, along with damages to coastal structures and infrastructures. A major event occurred on 5–7 February 2015 (Hs = 4.6 m, Tp = 9.9 s, wave dir = ENE – measured at the Cesenatico wave rider buoy at the peak of the storm; max water level = 1.2 m measured at Porto Corsini tide gauge, Figure 1; Duo et al., 2018). This caused the extensive inundation of landward areas and impressive beach erosion. Perini et al. (2015a, b) report that the inundated area was, in several localities, comparable to the 100 years return period flood extension computed by the regional authorities in the framework of the EU Floods Directive (Perini et al., 2016, 2017), while in other locations it appeared to be closer to the 10 years return period flood map (Duo et al., 2018). In some coastal towns located in the Ravenna Province a flood water level of up to 2 m was measured (Perini et al., 2015a, b). The event was followed by extraordinary interventions to repair the damages and nourish the shores with 1.2 million cubic meters of sand taken from offshore deposits. The Italian and Regional Governments allocated 20 million Euro to finance the interventions3.
The coastal area is very important for the regional economy as it includes a large number of activities related to the sun-and-beach tourism. The tourist presence in 2017 (between January and December) in the Riviera (the coastal area of the Emilia-Romagna region) was almost 7 million visitors. The summer period only (May–September) registered almost 5.5 million visitors4. Tourism represents 11% of the Regional GDP, with the Riviera as the main driver of the leisure industry. The leisure industry is represented by the “chain” that includes accommodations, concessions (areas occupied by permanent structures, located on the rear part of the beach, that are granted to private entities who pay a yearly fee to the State to be allowed to use the public land for entrepreneur activities) and facilities such as sun-chairs and umbrellas, restaurants, bars, gym, changing cabinets, showers, etc.
Two coastal hotspots were selected to evaluate the direct and indirect impacts of extreme events. The hotspots were identified through the application of the first phase of the Coastal Risk Assessment Framework developed in the RISC-KIT project (for more details on the project refer to Van Dongeren et al., 2018; for CRAF phase 1 application along the Emilia-Romagna coastline refer to Armaroli and Duo, 2018). The identified hotspots are the Lido degli Estensi-Lido di Spina coastal area (hereafter referred to as HS1, Ferrara province, Figure 1) and Milano Marittima (HS2, Ravenna province, Figure 1). Both locations experienced impacts in February 2015 (see Duo et al., 2018 for HS1; Perini et al., 2015a, b for HS2). Furthermore, HS1 and HS2 were identified by local end-users as the areas where a more detailed evaluation of the direct and indirect impacts caused by extreme events should be carried out. Herein, the impacts of flooding are discussed.
HS1 – Lido degli Estensi-Lido di Spina
The coastal villages of Lido degli Estensi and Lido di Spina are located in the Ferrara province (Figure 1). The area is bounded by the Porto Garibaldi jetty in the northern part. The analyzed beach extends southward by almost 4 km. The beach is composed of fine to medium sand and is very dissipative. The shore at Lido degli Estensi has a maximum width of 250 m, one of the largest of the regional coastline. The sand accumulation is due to interruption of longshore sediment transport caused by the Porto Garibaldi jetty that was built in the early 1940s to protect the mouth of the navigation channel of Porto Garibaldi. The backshore is urbanized, and the beach is predominantly occupied by bathing establishments with some remaining dunes in-between structures. The economic activities of the area are based on fishery, aquaculture, agriculture, summer (coastal) leisure activities and eco-tourism (the site is located in the Po Delta Park that is part of the Natura 2000 network).
HS2 – Milano Marittima
The Milano Marittima site is in the Ravenna province (Figure 1). The beach is almost 5 km long and comprised between the artificial canal “Scolo Cupo” in the north and the Cervia port in the south. The beach width is between 50 and 100 m. It is dissipative with fine to medium sand. The area in 1943 was characterized by large dune fields and few buildings, especially located in the southern part of the site. Starting from the early 1970s, HS2 was occupied by many buildings and infrastructure and development increased until the late 1980s, along with the destruction of the coastal dunes and occupation of the rear part of the beach with concessions. At present the site is one of the most attractive for summer tourism along the regional coastal area. The number of second homes is large as well as hotels and other types of accommodation. The main economic activity is the summer tourism.
Methods and Data
The second phase of the CRAF is aimed at the comparison between coastal hotspots, that were identified in the first phase of the framework (see, as an example, Armaroli and Duo, 2018), in terms of direct and indirect impacts. In this section, the methodology for the assessment of the impact of extreme coastal flood events is presented. It consists of two main parts: the hazard and the impact modules. The hazard (see Inundation Modeling and Extreme Events Selection) is assessed through numerical models forced with literature-based design extreme events. The risk assessment is completed through the application of the Integrated Disruption Assessment (INDRA) module (see The Integrated Disruption Assessment (INDRA) Module) able to quantify direct (see Direct Impacts) and indirect (see Indirect Impacts) impacts. The comparison between hotspots is done through a Multi Criteria Analysis [see Multi Criteria Analysis (MCA)] which is based on the involvement of regional and local stakeholders.
Inundation Modeling and Extreme Events Selection
The hazard modeling is implemented through a model chain coupling XBeach (Roelvink et al., 2009) 1D profiles with a 2D Lisflood-FP (Bates and De Roo, 2000; Bates et al., 2005) model of the hinterland (Figure 2). The XBeach model computes the hydro-morphodynamics of the profile for a given extreme forcing event. The discharge time series of the profiles, that are calculated considering the morphodynamic feedback of the profile, are therefore used as input for the Lisflood model that computes the inundation maps (i.e., water depth, velocity and flood-depth velocity). Specifically, the link between the two models is implemented through Matlab scripts that read the discharge timeseries calculated by the XBeach model for each profile and process them to provide water discharges. For each profile, the position (P) where the discharge time series is read by the scripts, is located around 10 m inland from the location where beach erosion interrupts. Since each profile is representative of a beach sector with a specific length (L), the discharge time series for the Lisflood model are corrected taking into account the length of each sector. Additionally, in order to avoid localized massive and unrealistic amounts of water pouring into the Lisflood domain at the discharge location (P), the localized discharge is distributed between equally spaced points in each sector, considering the cell size of the Lisflood model grid and the length (L) of the sector.
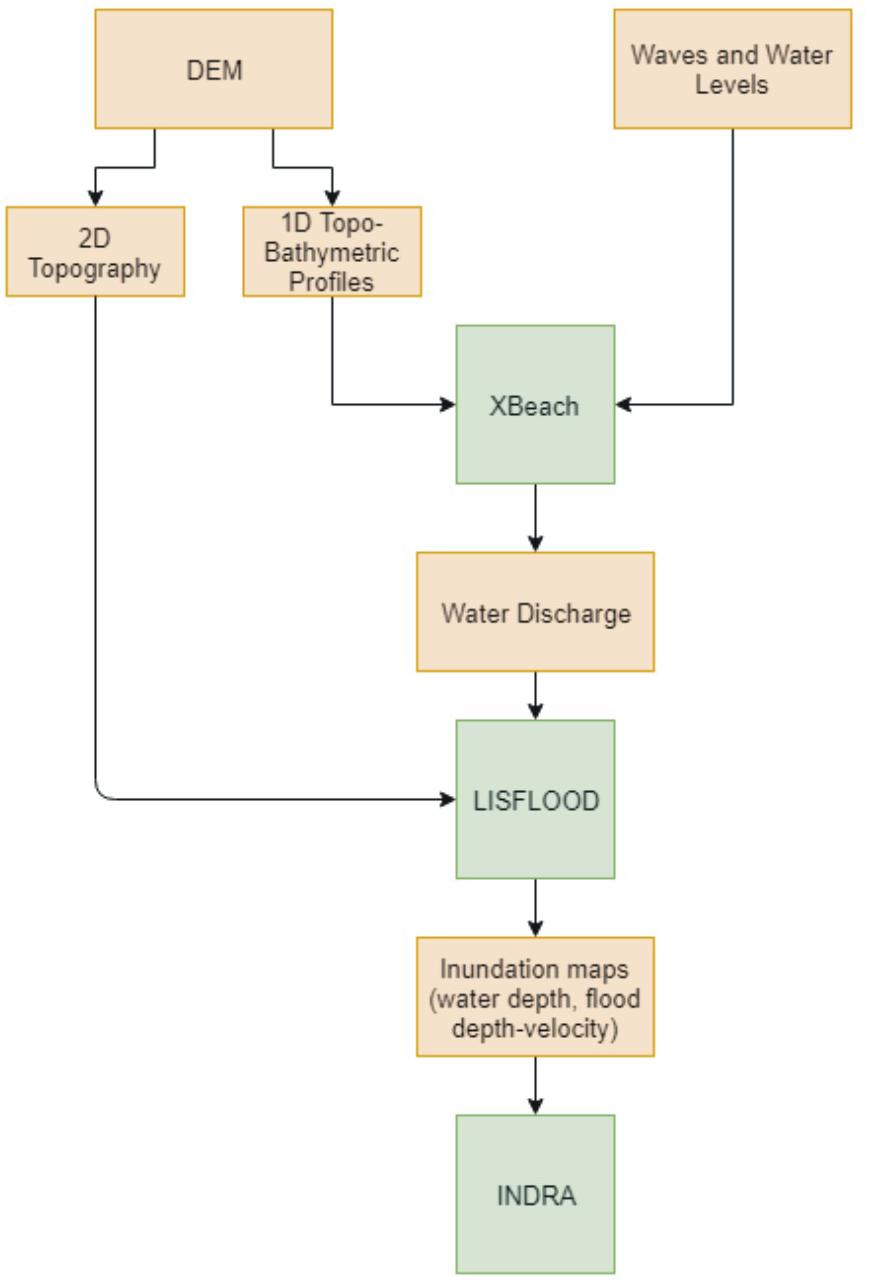
Figure 2. Hazard assessment process and link between XBeach and Lisflood models.
The characteristics of the topo-bathymetric dataset are presented in Table 1. Different datasets from different sources and with different resolutions (Lidar flights and multibeam surveys) are merged (covering the emerged and submerged beach) to obtain a uniform topo-bathymetric model of the area in order to run the numerical model. A large number of XBeach profiles are selected (90 for HS1; 106 for HS2) in order to describe in details the morphology of the beach and the backshore, as it represents a dominant factor for the inundation modeling. Each profile is representative of a uniform coastal sector, with lengths ranging from 9 to 98 m for HS1, and from 7 to 109 m for HS2. Representative cross-shore profiles along the regional coastal area are presented in Armaroli and Duo (2018), in their Figure 2. The water level and wave time series are designed as triangular shapes (e.g., McCall et al., 2010) based on the parameters presented by Perini et al. (2016). The forcing levels in deep water were calculated as the sum of the high tide and storm surge components while wave data are used as they appear in Table 2. The direction of each storm is not considered, thus meaning that the direction of wave propagation is assumed to be perpendicular to the coast. The results of the model chain are post-processed to provide the inundation maps of each event in terms of maximum water depth and flood depth-velocity. The main parameters used in the model chain (XBeach-Lisflood) are summarized in Table 3 (Bates and De Roo, 2000; Bates et al., 2005; Roelvink et al., 2009). XBeach automatically defines the time step depending on the Courant–Friedrichs–Lewy number (CFL) that is set as default (0.7). The time step for LISFLOOD is also set as default (10 s).
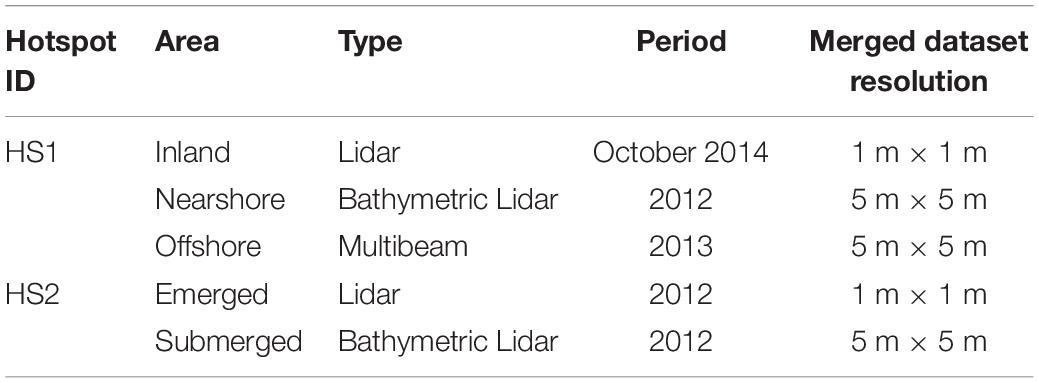
Table 1. Topo-bathymetric dataset, input for the XBeach (1D Topo-bathymetric profiles) and Lisflood (2D Topography) models.
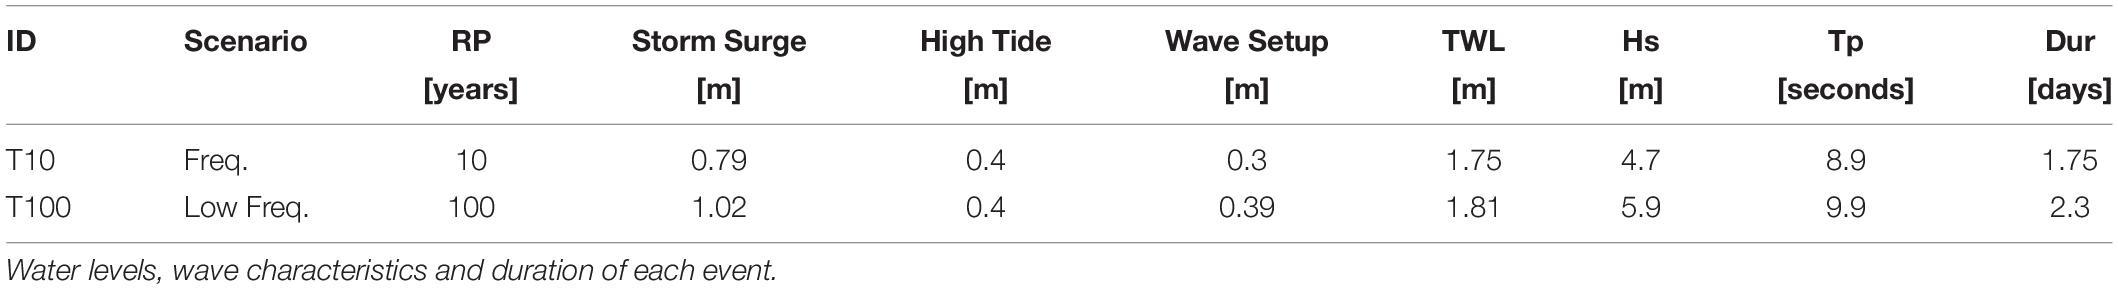
Table 2. Parameters of the selected extreme events: 10 and 100 years return period storms (T10 and T100, adapted from Perini et al., 2016).
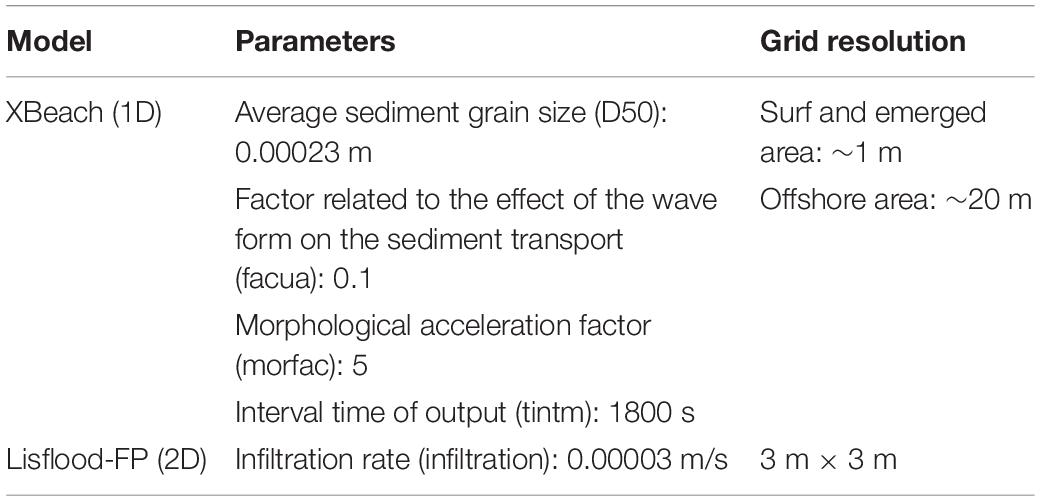
Table 3. Modified parameters from the default settings for both models (XBeach and Lisflood) used for the analysis.
The Integrated Disruption Assessment (INDRA) Module
The direct and indirect impacts of the simulated coastal events are assessed with the INDRA model (Integrated Disruption Assessment). The INDRA model (Viavattene et al., 2018) produces as outputs eight regional standardized indicators for a multi-criteria analysis, i.e., risk to life, ecosystem recovery, household displacement, household financial recovery, business financial recovery, regional business disruption, regional utilities disruption, regional transport service disruption (Figure 3) (for more detailed information on methods see Viavattene et al., 2015). The INDRA model code5 and CRAF application manual are available online as public deliverables of the RISC-KIT project (Viavattene et al., 20156). However, a brief summary of the main equations and assumptions used in the model are presented in the following sections. For other applications of the model in different case study sites the reader is invited to refer to Christie et al. (2018), De Angeli et al. (2018), and Ferreira et al. (2018).
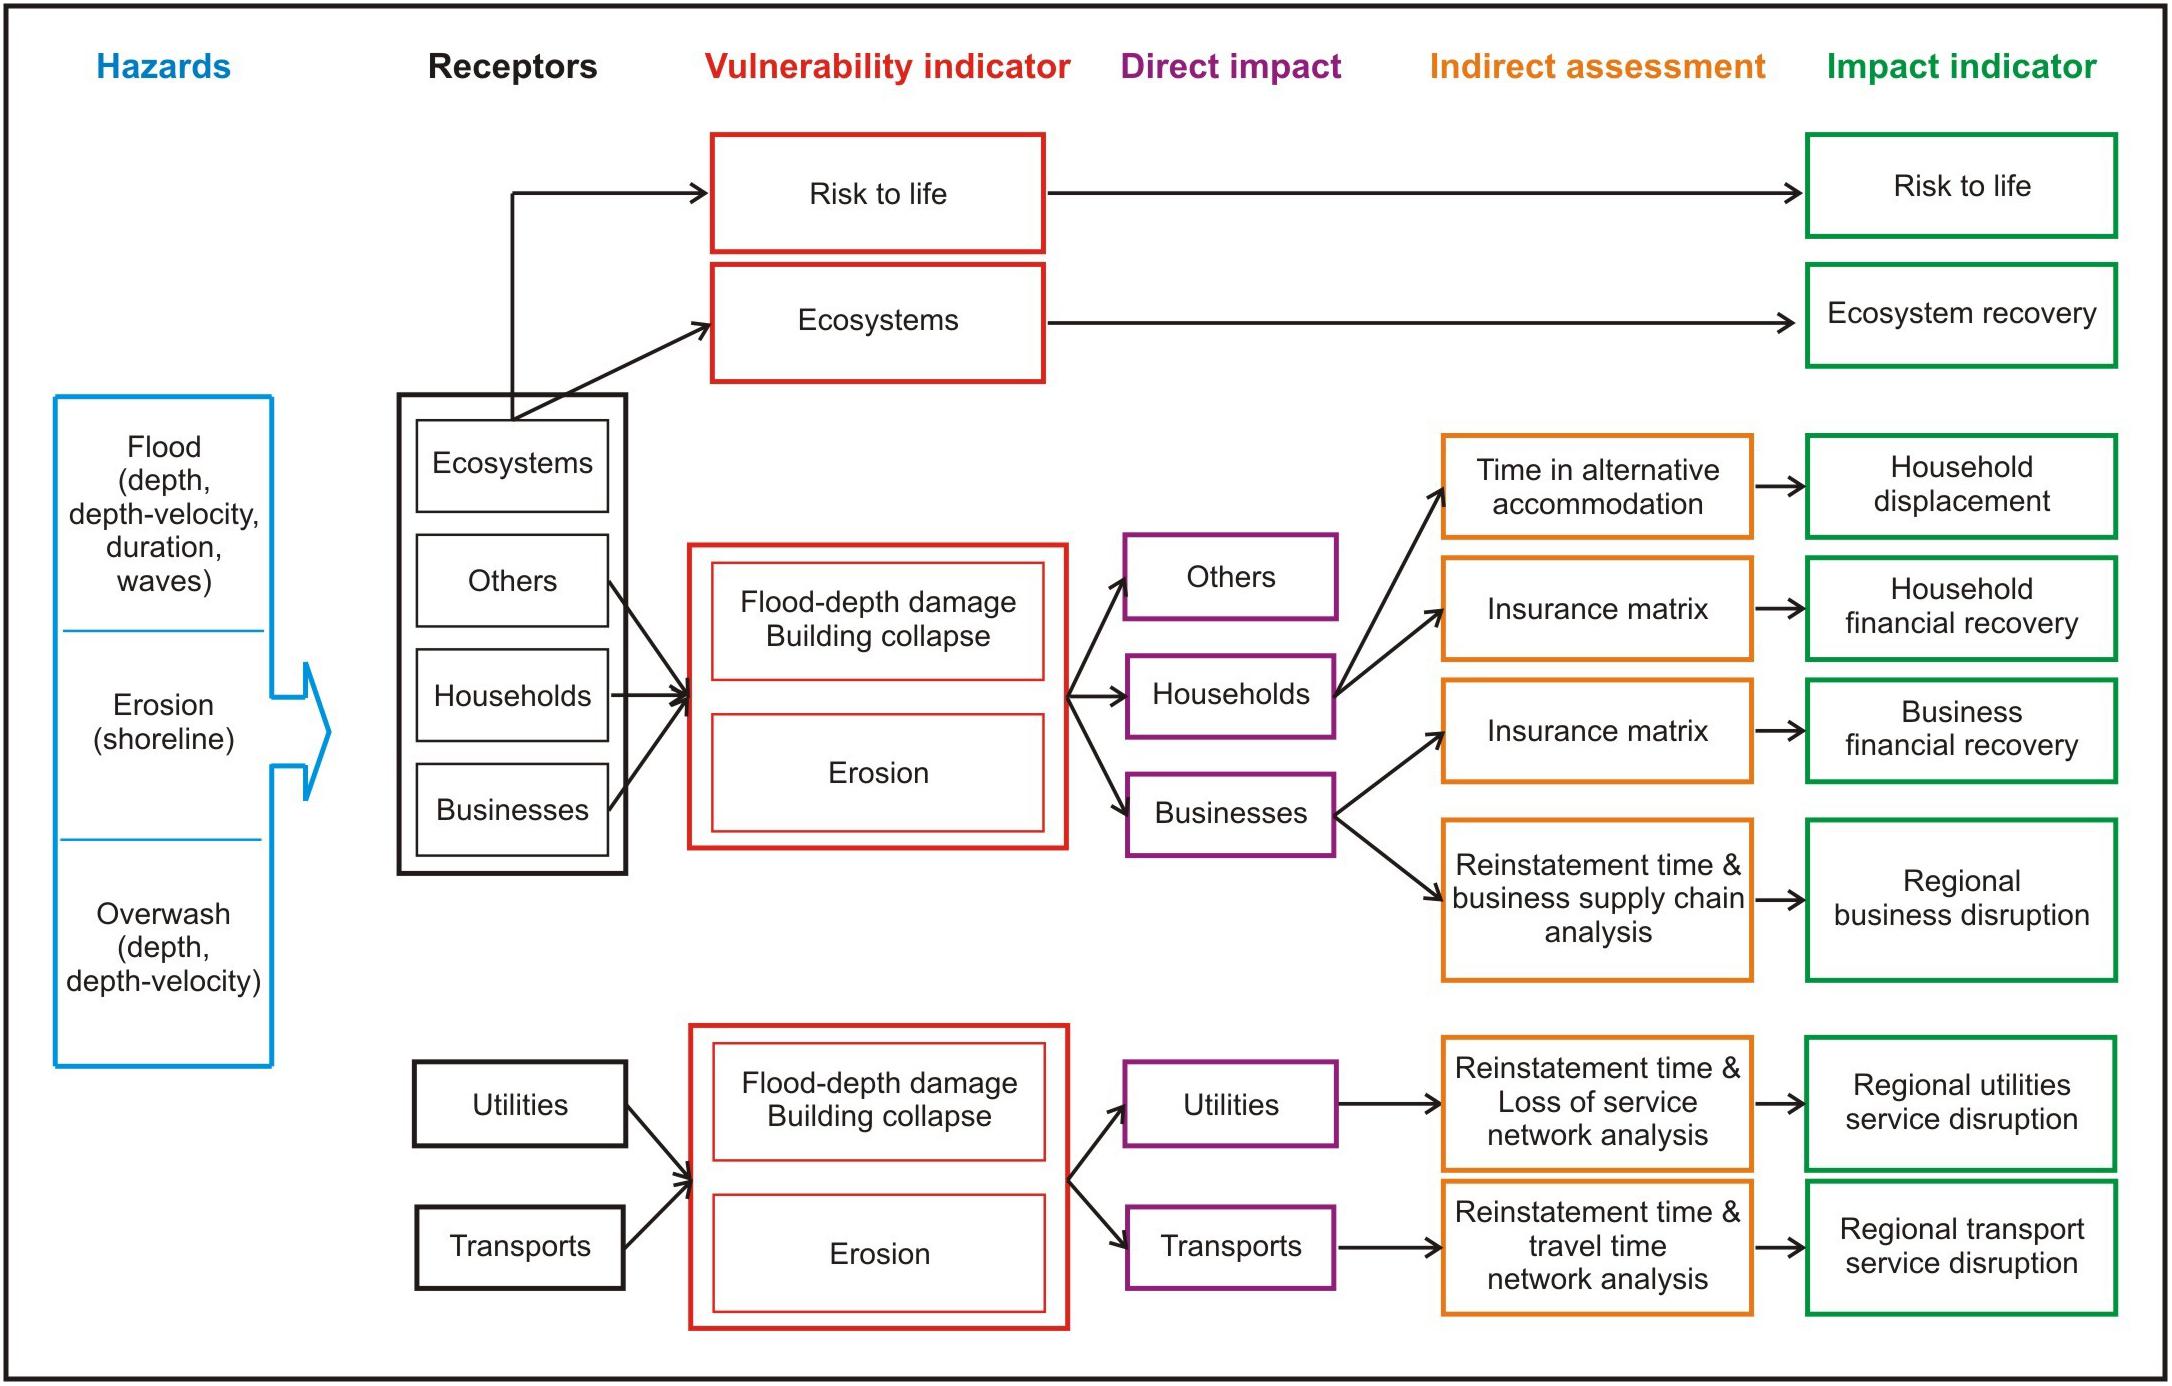
Figure 3. Impact assessment process of the INDRA model (modified from Viavattene et al., 2018).
The calculation of each indicator requires the collection of specific data on exposed assets and their characteristics. The estimation of the direct impacts requires the geolocation of assets (land uses and networks) and vulnerability indicators such as flood depth damage curves. A common five-point scale (None, Low, Medium, High, and Very High Impact) is used to measure the direct impacts; each scale being associated with a hazard intensity threshold level (e.g., flood depth, flood depth-velocity, flood duration, erosion distance).
Additional inputs are then required for estimating the resulting indirect impacts. As such, empirical or synthetic data are necessary to estimate, e.g., the time spent by households in alternative accommodation according to the severity of an event. Information on penetration rate of insurance is required to estimate the financial recovery of households and businesses. INDRA also aims to estimate the loss of services over time using network analysis. It requires an evaluation of reinstatement time (e.g., required logistic and repair time for an asset to be operational) and of their dependencies for the considered assets (e.g., business supply chain, utility networks).
INDRA aims to compare indicators and hotspots rather than absolutely quantifying the losses. Therefore, the indicators are scaled regionally from 0 to 1 (from no regional impact to all region been impacted). The indicators are then combined by weighted summation using Multi Criteria Analysis (MCA). The MCA approach is considered here as an appropriate and widely used method to support transparent decision-making between various stakeholders (Janssen, 2001; Belton and Stewart, 2002; Hajkowicz and Higgins, 2008). It permits stakeholders perspectives to be reflected on the indicators and consensus to be reached on the selected hotspot(s).
The approach adopted in INDRA recognizes the existing issues of inconsistent units and of data collection and availability, and the model was developed to increase flexibility and the ease of use in the context of scarce or rich data being available. To maintain a degree of transparency and to support the stakeholders in their selection, a Data Quality Score is included in the approach. It consists of scoring between 1 and 5 the different input data (From “1 - Data available and of sufficient quality” to “5 - No data available, based on multiple assumptions”). The scoring is carried out through an expert judgment approach, meaning that the level of quality is assigned by who carries out the analysis and collects the information, i.e., who is aware of the quantity and quality of the included information and datasets.
Data Input for the INDRA Model
The INDRA model is applied to evaluate the direct and indirect impacts of two extreme events selected as representative of the 10 and 100 years return period storms. At the regional and hotspots scales households, businesses, risk to life, transport networks are included in the impact assessment. Ecosystems, including agricultural areas, were considered as negligible with the end-users and were scored to 0 by default in the impact assessment model. Indeed, the coastal zone includes large agricultural areas and two important natural parks. However, the analysis carried out builds on the awareness that, although coastal managers recognize the importance of natural sites, especially in a coastline where pristine lands are rare and protected, they have to “face the reality” (Martinez et al., 2018). In fact, the majority of human and economic resources are spent for the protection and maintenance of one of the most important economic sectors of the Region, i.e., tourism in coastal villages and towns where hotels, concessions, shops and many other facilities are located. Utilities are not taken into account as in the first phase of the CRAF it was found that important electricity stations, aqueducts and wastewater treatment plants are not exposed (Armaroli and Duo, 2018).
Direct Impacts
Direct impacts represent the category of losses associated with a physical contact with the water. They mainly concern assets and people and are treated differently in the model. In the next paragraphs the method used to evaluate direct impacts to assets (see Direct Impacts to Assets) and people (see Direct Impacts to People) is presented. An additional section (see Direct Impact to Other Structures) regarding the direct impact to other structures, such as schools and cultural heritage sites identified in the two hotspots, is included.
Direct Impacts to Assets
Impact indicators related to assets are evaluated by estimating the direct damages to buildings and other assets using flood-depth damage curves and a building collapse matrix (Figure 3). Such evaluation requires the identification and location of each asset. Buildings are identified using 2016 cadastral maps provided by regional managers, updated with more recent information where necessary. The polygon features are firstly converted into points calculating the centroid of each polygon and then the points manually checked and corrected. The cadastral maps do not provide a description of the mapped elements and are classified by default as residential building. For the purpose of this study only residential buildings, hotels, concessions, camping sites, cultural heritage buildings and schools have been classified according to their type, but the rest of non-residential properties (e.g., public offices, shops, restaurants) remained classified as residential properties. Such information is unavailable and will require additional local surveys. Therefore, the assessment probably overestimates the number of impacted residential properties and underestimates that of non-residential properties, with the exception of the typologies listed above (hotels, concessions, cultural heritage buildings, and schools). For estimating the regional indicators all regional assets have to be represented in the model. However, only the exposed assets have to be represented individually for the impact assessment. Therefore, all the assets potentially non-exposed (i.e., outside the hotspots area) are aggregated. The mapped assets in each hotspot are the ones falling inside flood-prone areas derived from the modeling chain (i.e., potentially affected). The transport network includes both roads and railways and are mapped at the regional level on the basis of data provided by regional managers that has been checked and manually corrected and simplified.
Table 4 includes the vulnerability functions used to evaluate the direct impacts. The flood-damage curve utilized to compute the direct impacts is adapted from the study by Scorzini and Frank (2017). The curve was constructed considering the damages to residential properties caused by a river flooding that occurred in Veneto in 2010, the Region that borders Emilia-Romagna in the north. The decision to use flood-damage curves for river flooding comes from the fact that similar curves for marine flooding are not available for Italian coastlines. The chosen curve is the one developed for single-family detached buildings, that shows the highest derivative. The thresholds summarized in Table 4 are defined following the approach adopted by Sanuy et al. (2018) for the Italian site Lido degli Estensi-Spina (Ferrara province, Figure 1), which includes part of HS1. In Sanuy et al. (2018), site-specific damage levels are defined based on the damage factor value (here translated into water depths following the adopted curve) in agreement with regional coastal managers.
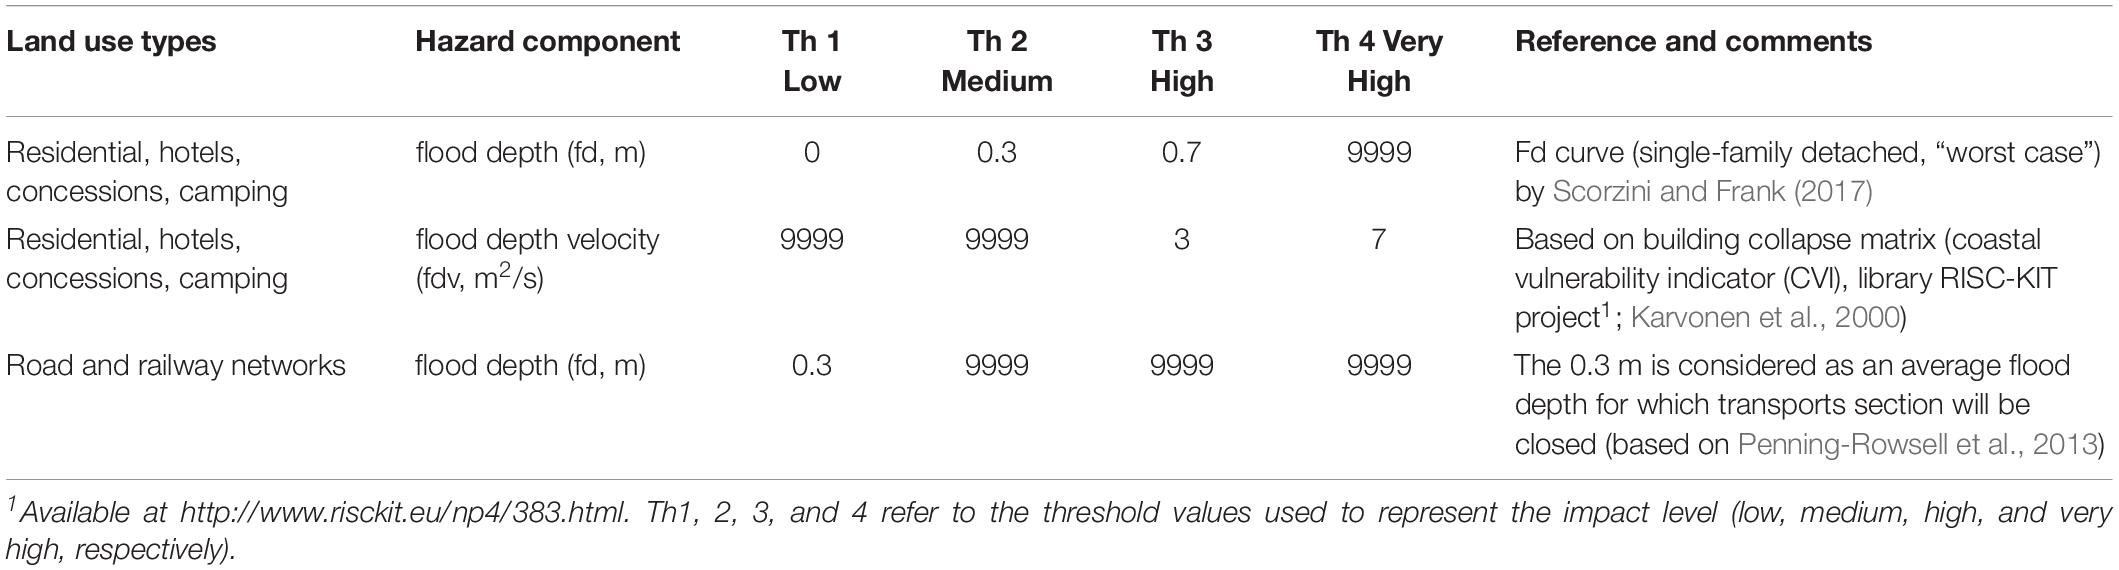
Table 4. Vulnerability indicators for the direct impact of flooding and corresponding references.
The thresholds used for building collapse (Karvonen et al., 2000) and direct impacts to the transport network (Penning-Rowsell et al., 2013) are the default values included in the model, because it was not possible to retrieve such information from local, regional or national sources (database, literature, reports). The hazard input in the INDRA model is in the form of a grid with flood depths (fd) and flood depths-velocities (fdv) associated to each cell of the grid. In case that low depths (e.g., 0.3 m < fd < 0.7 m, medium impact, Table 4) but high velocities occur (i.e., the product flood depth∗velocity is e.g., above the 3 m2/s threshold according to Table 4, which means high impact) the model considers the worst condition (i.e., high impact). The overall Data Quality for assessing the direct impact is scored 3.
Direct Impacts to People
Loss of life and injuries may result from extreme events. However, the causes vary and, often, are a combination of multiple determinants such as lack of warning, time, type of flooding, surrounding environment, structure collapse, individual behavior (Jonkman et al., 2008). A simplified method applicable to regional scale is considered in the model. Risk to life is evaluated with the matrix produced for the FLOODSITE project by Priest et al. (2007). The matrix includes simple and easy-to-access information such as flood-depth velocities and the nature of the area in terms of building materials, number of stories and type of property (the matrix is also presented in Christie et al., 2018 in their Table 8). There are three levels of vulnerability (low, medium, and high) associated to different buildings’ characteristics: multi-storey apartments and masonry concrete and brick properties (low), typical residential area with mixed types of properties (medium) and mobile homes, campsites, bungalows and poorly constructed properties (high). It must be noted that the method does not preclude the consideration of other determinants such as the presence of vulnerable population group or flood warning. The matrix was built taking into account the comprehensive review by Jonkman et al. (2008) of different risk models and provides a risk to life score ranking from 0 (no risk to life) to 4 (very high risk to life). Residential buildings and hotels are associated with the low vulnerability class, concessions to medium and camping sites to high. The surface (in km2) of each vulnerability class in each hotspot is presented in Table 5 with the associated impact thresholds. The model associates to each property the flood depth-velocity obtained from the hazard modeling to derive a risk to life score. The scores from each building are then aggregated and normalized to calculate a Regionalized Risk to Life Indicator.
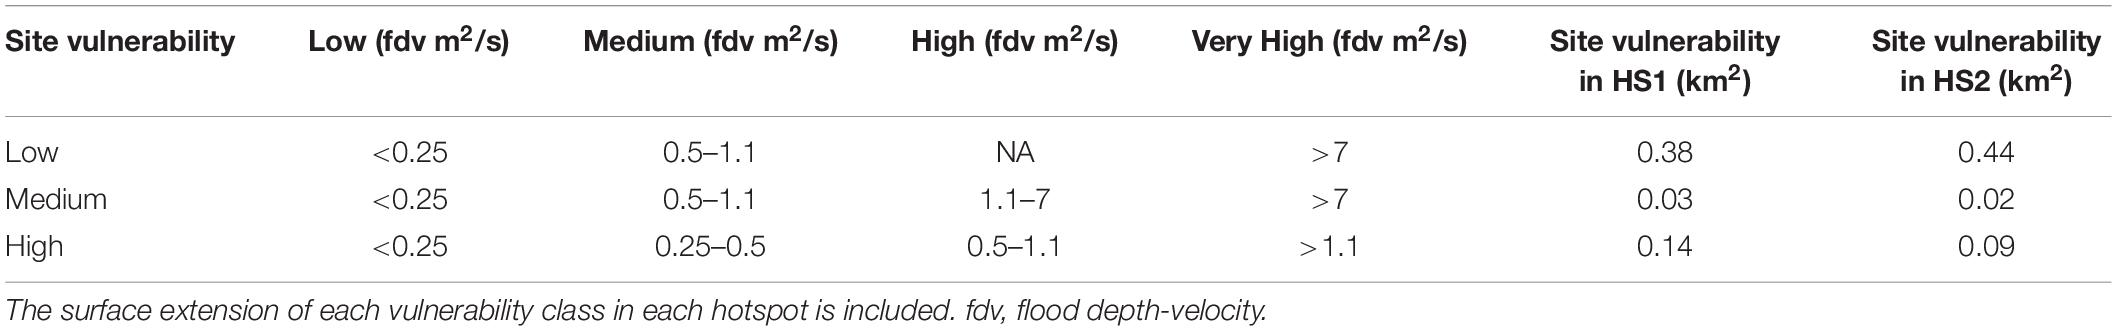
Table 5. Site vulnerability classes and related impact thresholds according to fdv values for the risk to life assessment on the basis of the risk to life matrix (Priest et al., 2007; Christie et al., 2018).
Direct Impact to Other Structures
The direct impact to schools, cultural heritage buildings and camping sites is evaluated considering the same thresholds defined for other assets (Table 4). In HS1 there is one school located not far from the beach and in front of the navigation channel of Porto Garibaldi. In HS2 four schools are identified and two cultural heritage sites represented by the Varese and Montecatini summer colonies built in 1938–1939 that are part of the regional cultural heritage. The financial recovery for schools and cultural heritage sites is set to be fully compensated because they are public properties. It should be underlined that the colonies represent an important part of the historical heritage of the region, but they are abandoned and not utilized because the investments needed to restore the buildings would be very high.
Indirect Impacts
Household Displacement
According to the analysis of recent storm events that caused the evacuation of the population (in 1999 and 2015), household displacement is not a major issue when storm events occur. Specifically, households are displaced for few days and mostly as a precautionary measure, especially where there is a river flooding hazard7,8 (Perini et al., 2011).
The storm that occurred on 6–7 November 1999 caused extensive beach erosion along the whole coastal area and inundation (Perini et al., 2011). It is reported that 50 residents of Cesenatico (Forlì-Cesena province, Figure 1) were evacuated. The event that occurred on 5–6 February 2015 was one of the most intense ever registered since 1966 (i.e., the most intense storm occurred along the RER coast; Duo et al., 2018) and caused severe damages and inundation along the whole regional area. According to newspapers articles, around 400 people were evacuated from their homes, but mostly as a preventive measure due to the high elevation, above the alert level, of the freshwater inside canals and rivers. Marine flooding affected several villages, and 20 families were evacuated from their homes in Lido di Savio (Ravenna province, Figure 1). The information was provided by end-users and stakeholders during a consultation that took place in October 2015 with ten stakeholders (representatives of Land Use planners, Civil Protection, Forest Rangers, Academics, Regional Meteo Agency, Po Delta Regional Park, Comacchio Municipality) and by examining local and regional newspapers’ articles. People were evacuated after the peak of the storm and, after two/three days, they were allowed to go back home. Damages to households consisted of deposition of mud and sand on ground floors, and damage to goods and furniture located in the lower floors.
A comprehensive review of past events centered on household displacement is not available. Such information is difficult to recover. In the catalog of past storm events that affected the regional coastal area between 1946 and 2010, produced for the Micore EU project9 (Perini et al., 2011), the information on displacement is limited, especially that related to the duration. Also, for the 2015 storm, information is difficult to find for the whole regional area (not even the Regional Civil Protection official report gives detailed information, especially on the duration of the displacement and exact location10). Therefore, it was decided to consider that households are not displaced. The Data Quality for displacement is considered as poor (3).
Household and Business Financial Recovery
Financial recovery mechanisms may include compensation provided by both national and regional governments and also by private insurance companies. They can be in the form of reimbursements, direct payments, tax breaks or as coverage on a standard insurance policy.
In Italy, marine flooding is currently excluded from private residential insurance policy. Large debate at the political level occurred between 2012 and 2014 on the proposal to make compulsory the insurance for inundation of households for all the areas included within hazard zones. However, any decision has been currently postponed and the principal financial recovery mechanism in place is governmental compensation.
Therefore, the financial recovery mechanism for private properties that was considered in the model is the compensation that is provided if a disastrous event occurs and only if the regional government declares the “natural disaster state.” If this is declared, the regional government can have access to specific national and regional funds that are allocated to compensate areas that are affected by catastrophic events (e.g., the 2012 earthquake that occurred in the RER region; the 2015 storm event in the northern Adriatic). Therefore, compensation is provided only for high and very high hazards and depends on the magnitude and extent of the impacts. In Table 6 the insurance figure for residential properties and business activities is presented. For households, 15% are associated to NoI (Not Insured, to include a certain percentage of households that do not access compensations due to bureaucratic obstacles and/or non-eligibility for compensations), 85% NoILcomp (Not Insured, Low compensation, because we are taking into account extreme events).
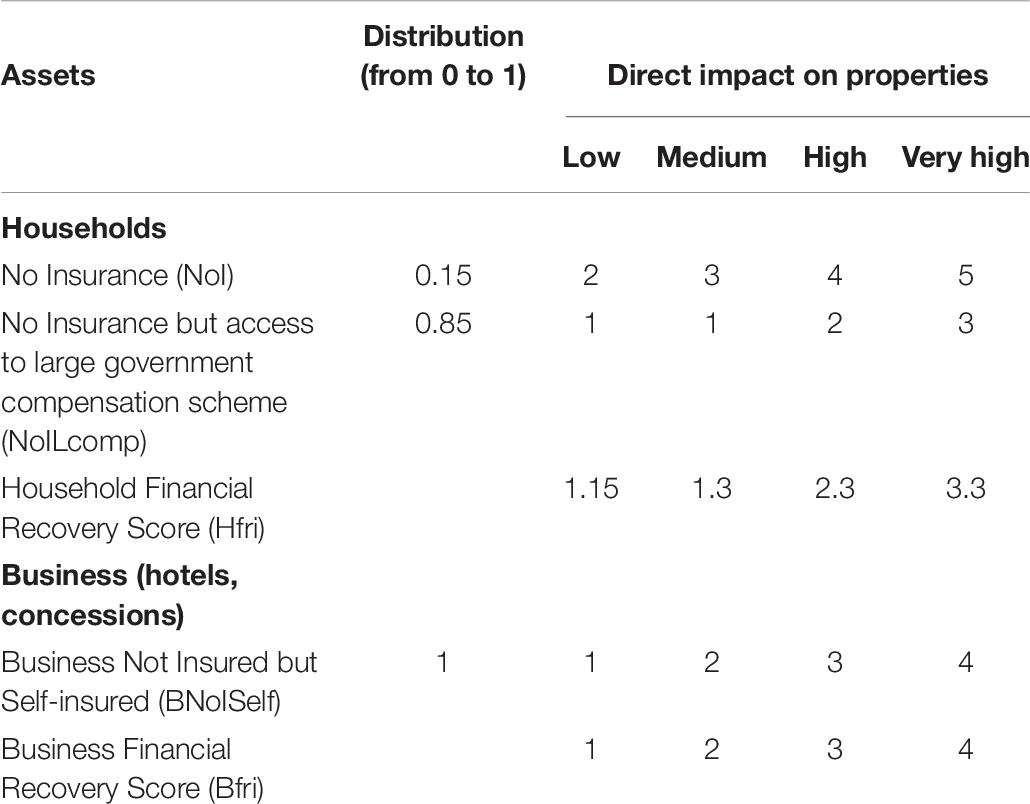
Table 6. Financial recovery mechanisms in relation to the scores of the direct impact on properties and business activities.
We have interviewed the President of the Consortium of economic activities (concessions and hotels) located in the coastal area of the Ferrara Province and he stated that: “there are no insurance companies that offer policies that cover the risk of inundation and erosion.” Furthermore, he stated that “our consortium has created a guarantee fund to collect money from the associated partners (a sort of auto-taxation) that is used to finance different activities, among which there is the compensation to entrepreneurs whose enterprise was affected by inundation and erosion. The fund is not large enough to fully compensate each entrepreneur, especially if the coast (beach and related structures) was largely damaged, but it is possible to obtain partial compensation. The central and regional governments do not include businesses in the compensations provided in the aftermath of a catastrophic event. Compensation are only meant to refund households.” Nevertheless, the compensation provided by the private fund is negligible (max 5000 Euro11) when compared to true damages of very high impact events.
In Table 6, 100% business activities are associated to BNoISelf (Business Not Insured, Self-insured) because marine inundation is not covered by insurance companies for economic activities in Italy. Nevertheless, after the 2015 storm (Duo et al., 2018), the regional authorities have mediated between representatives of economic activities and lending institutions in order to find an agreement on soft loans to entrepreneurs affected by the event. Some economic support initiatives were also activated by the regional government12. Overall a Data Quality Score of 3 is attributed to the insurance matrix.
The INDRA model assigns the Household or Business Financial Recovery Score for each property according to the level of direct impact. For each asset a scale of recovery (from 1 = Full financial recovery – recovery with no/few adverse impacts to 5 = Very low financial recovery is possible – major and permanent changes to associated activities) is attributed based on international analyses of the commonly adopted approaches (Priest, 2014). The Regionalized Business Financial Recovery Indicator (IBfr) is then calculated following Table 7. A similar approach is applied for Household.
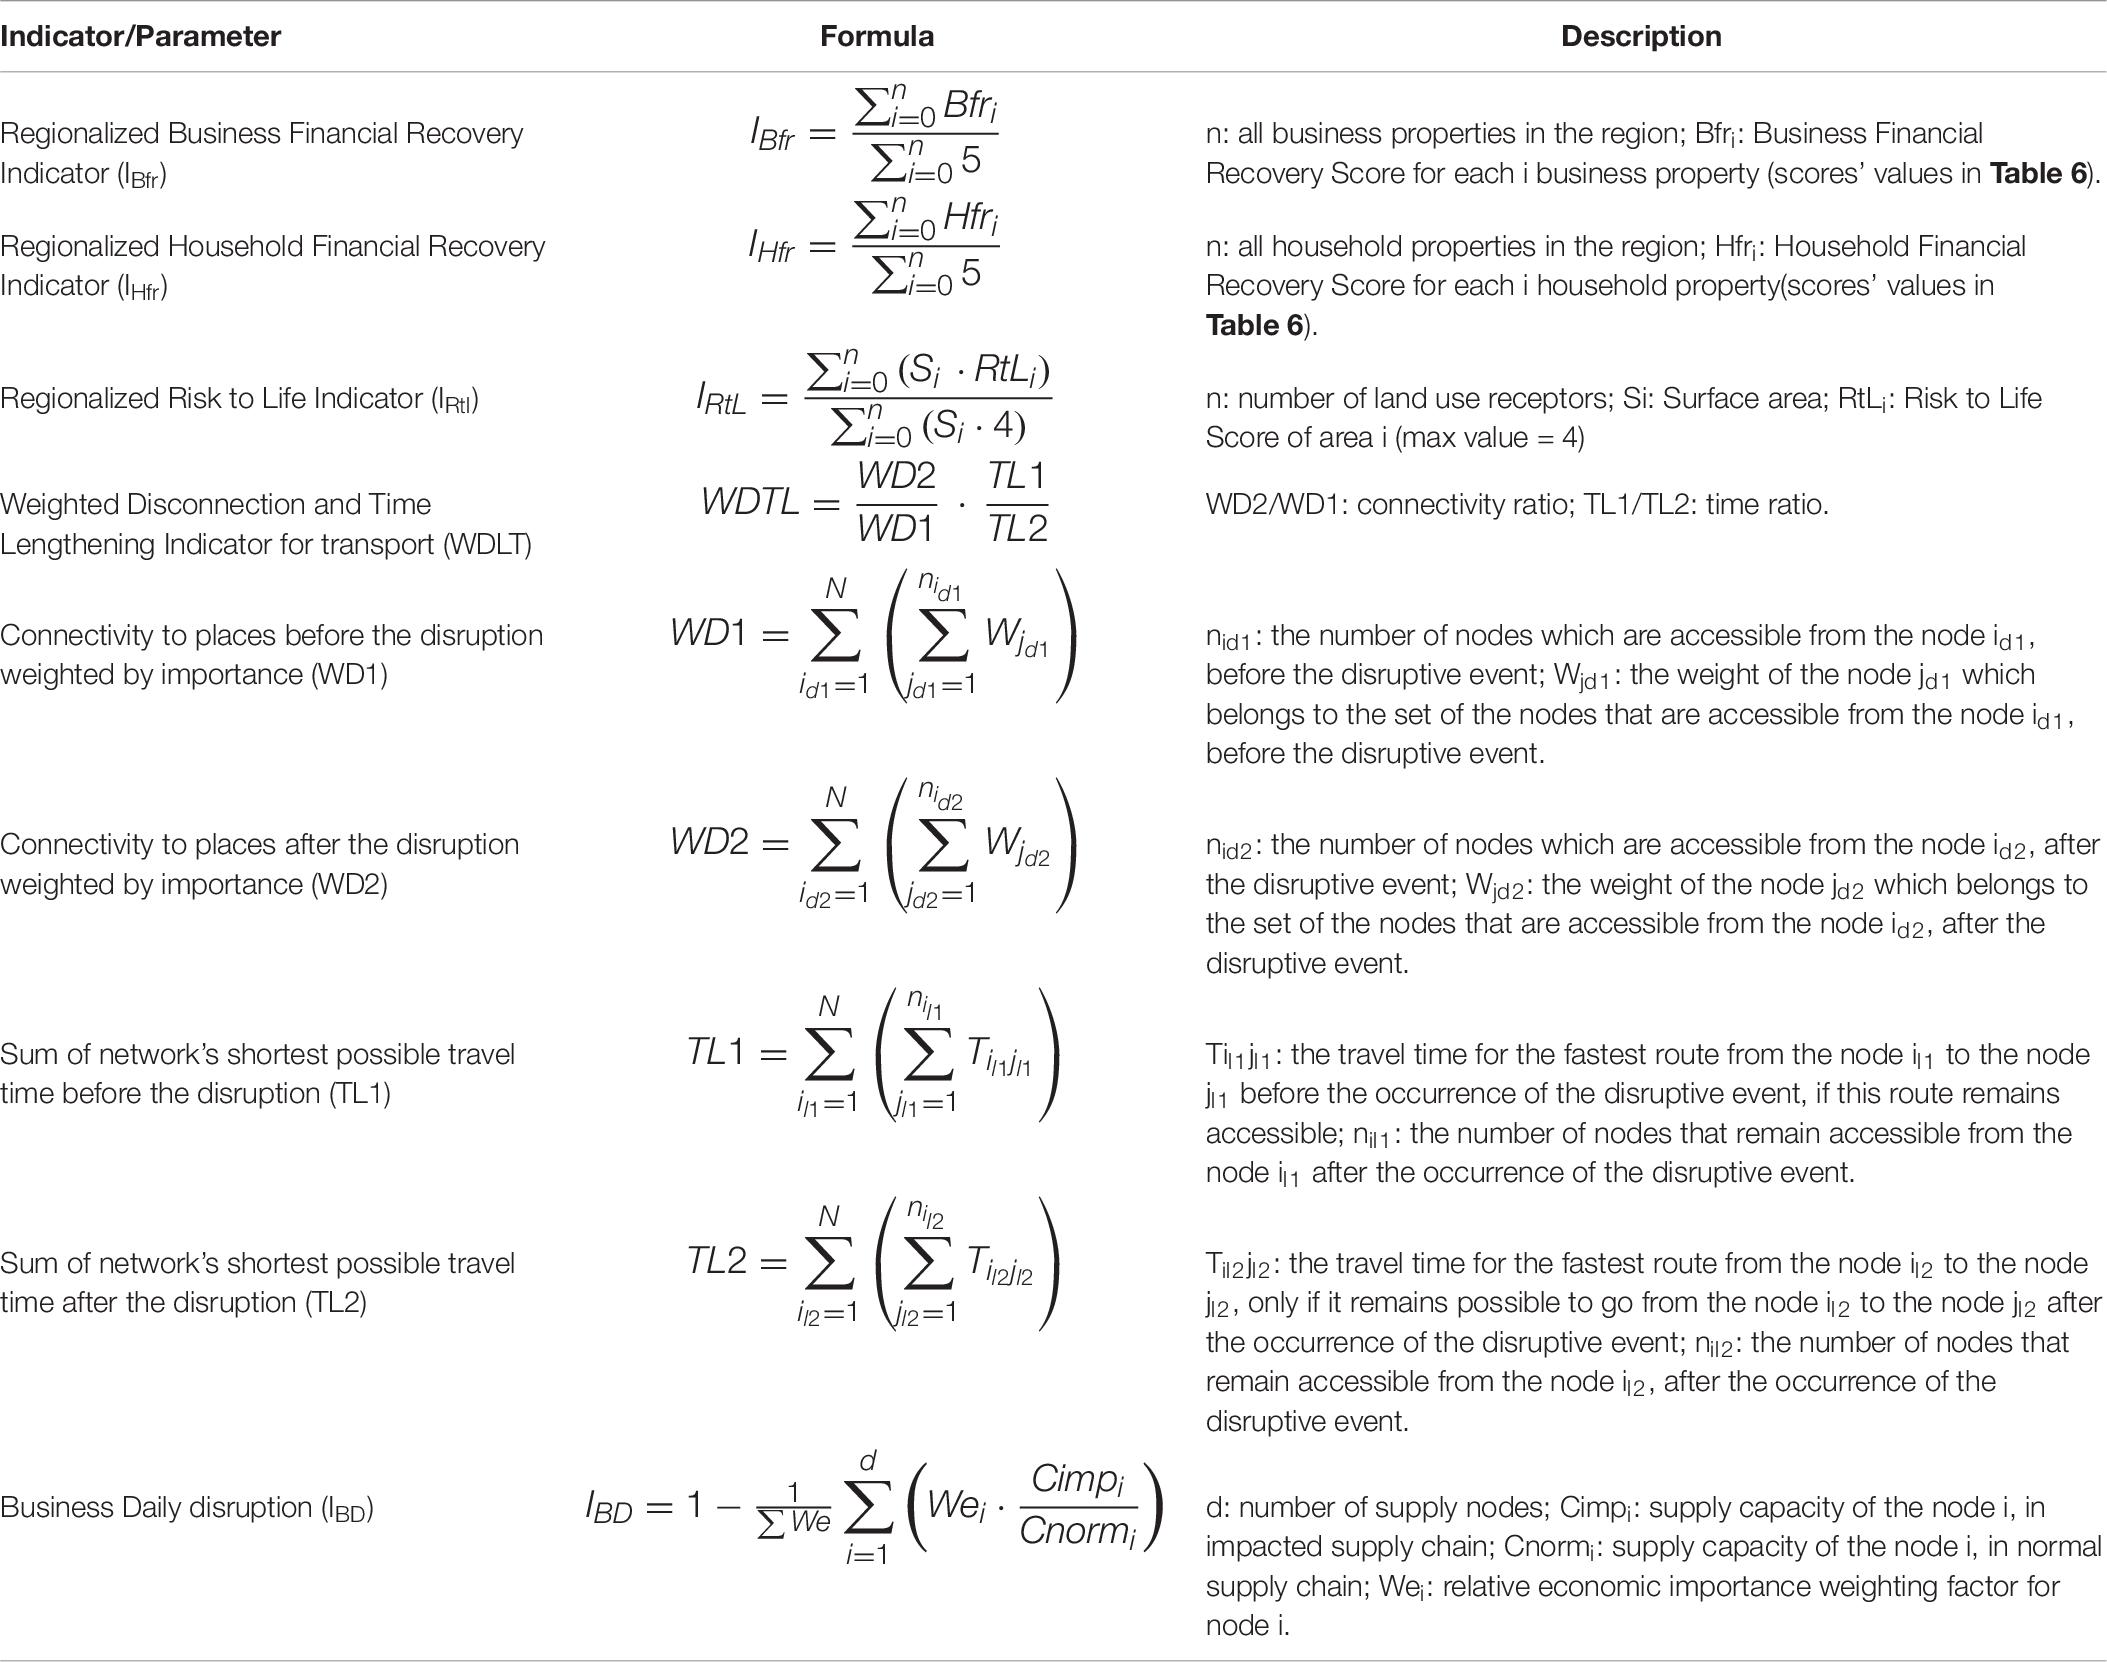
Table 7. Descriptions and formulas of the main indicators and parameters calculated by the INDRA model for business financial and household recovery, risk to life and transport and business disruption.
Transport Network Disruption
Transport disruption is an important issue along the regional coastline. If we consider the regional scale, the motorway that connects the eastern regions of Italy (i.e., the regions that face the Adriatic Sea) to the northern regions runs along the coastline and in its southern part is located close to the coast (Figure 4). For this reason, if flooding occurs in the southern part of the regional coastline, and if the motorway and railway lines are affected, the disruption can potentially become massive for the national transport system. On the other hand, in the two selected hotspots the transport networks are represented by local roads and by a limited portion of the regional railway line in HS2. The impact assessment is carried out considering a boundary that includes the whole regional area and that extends landward up to Bologna (Figure 4), in order to take into account the most important routes and junctions.
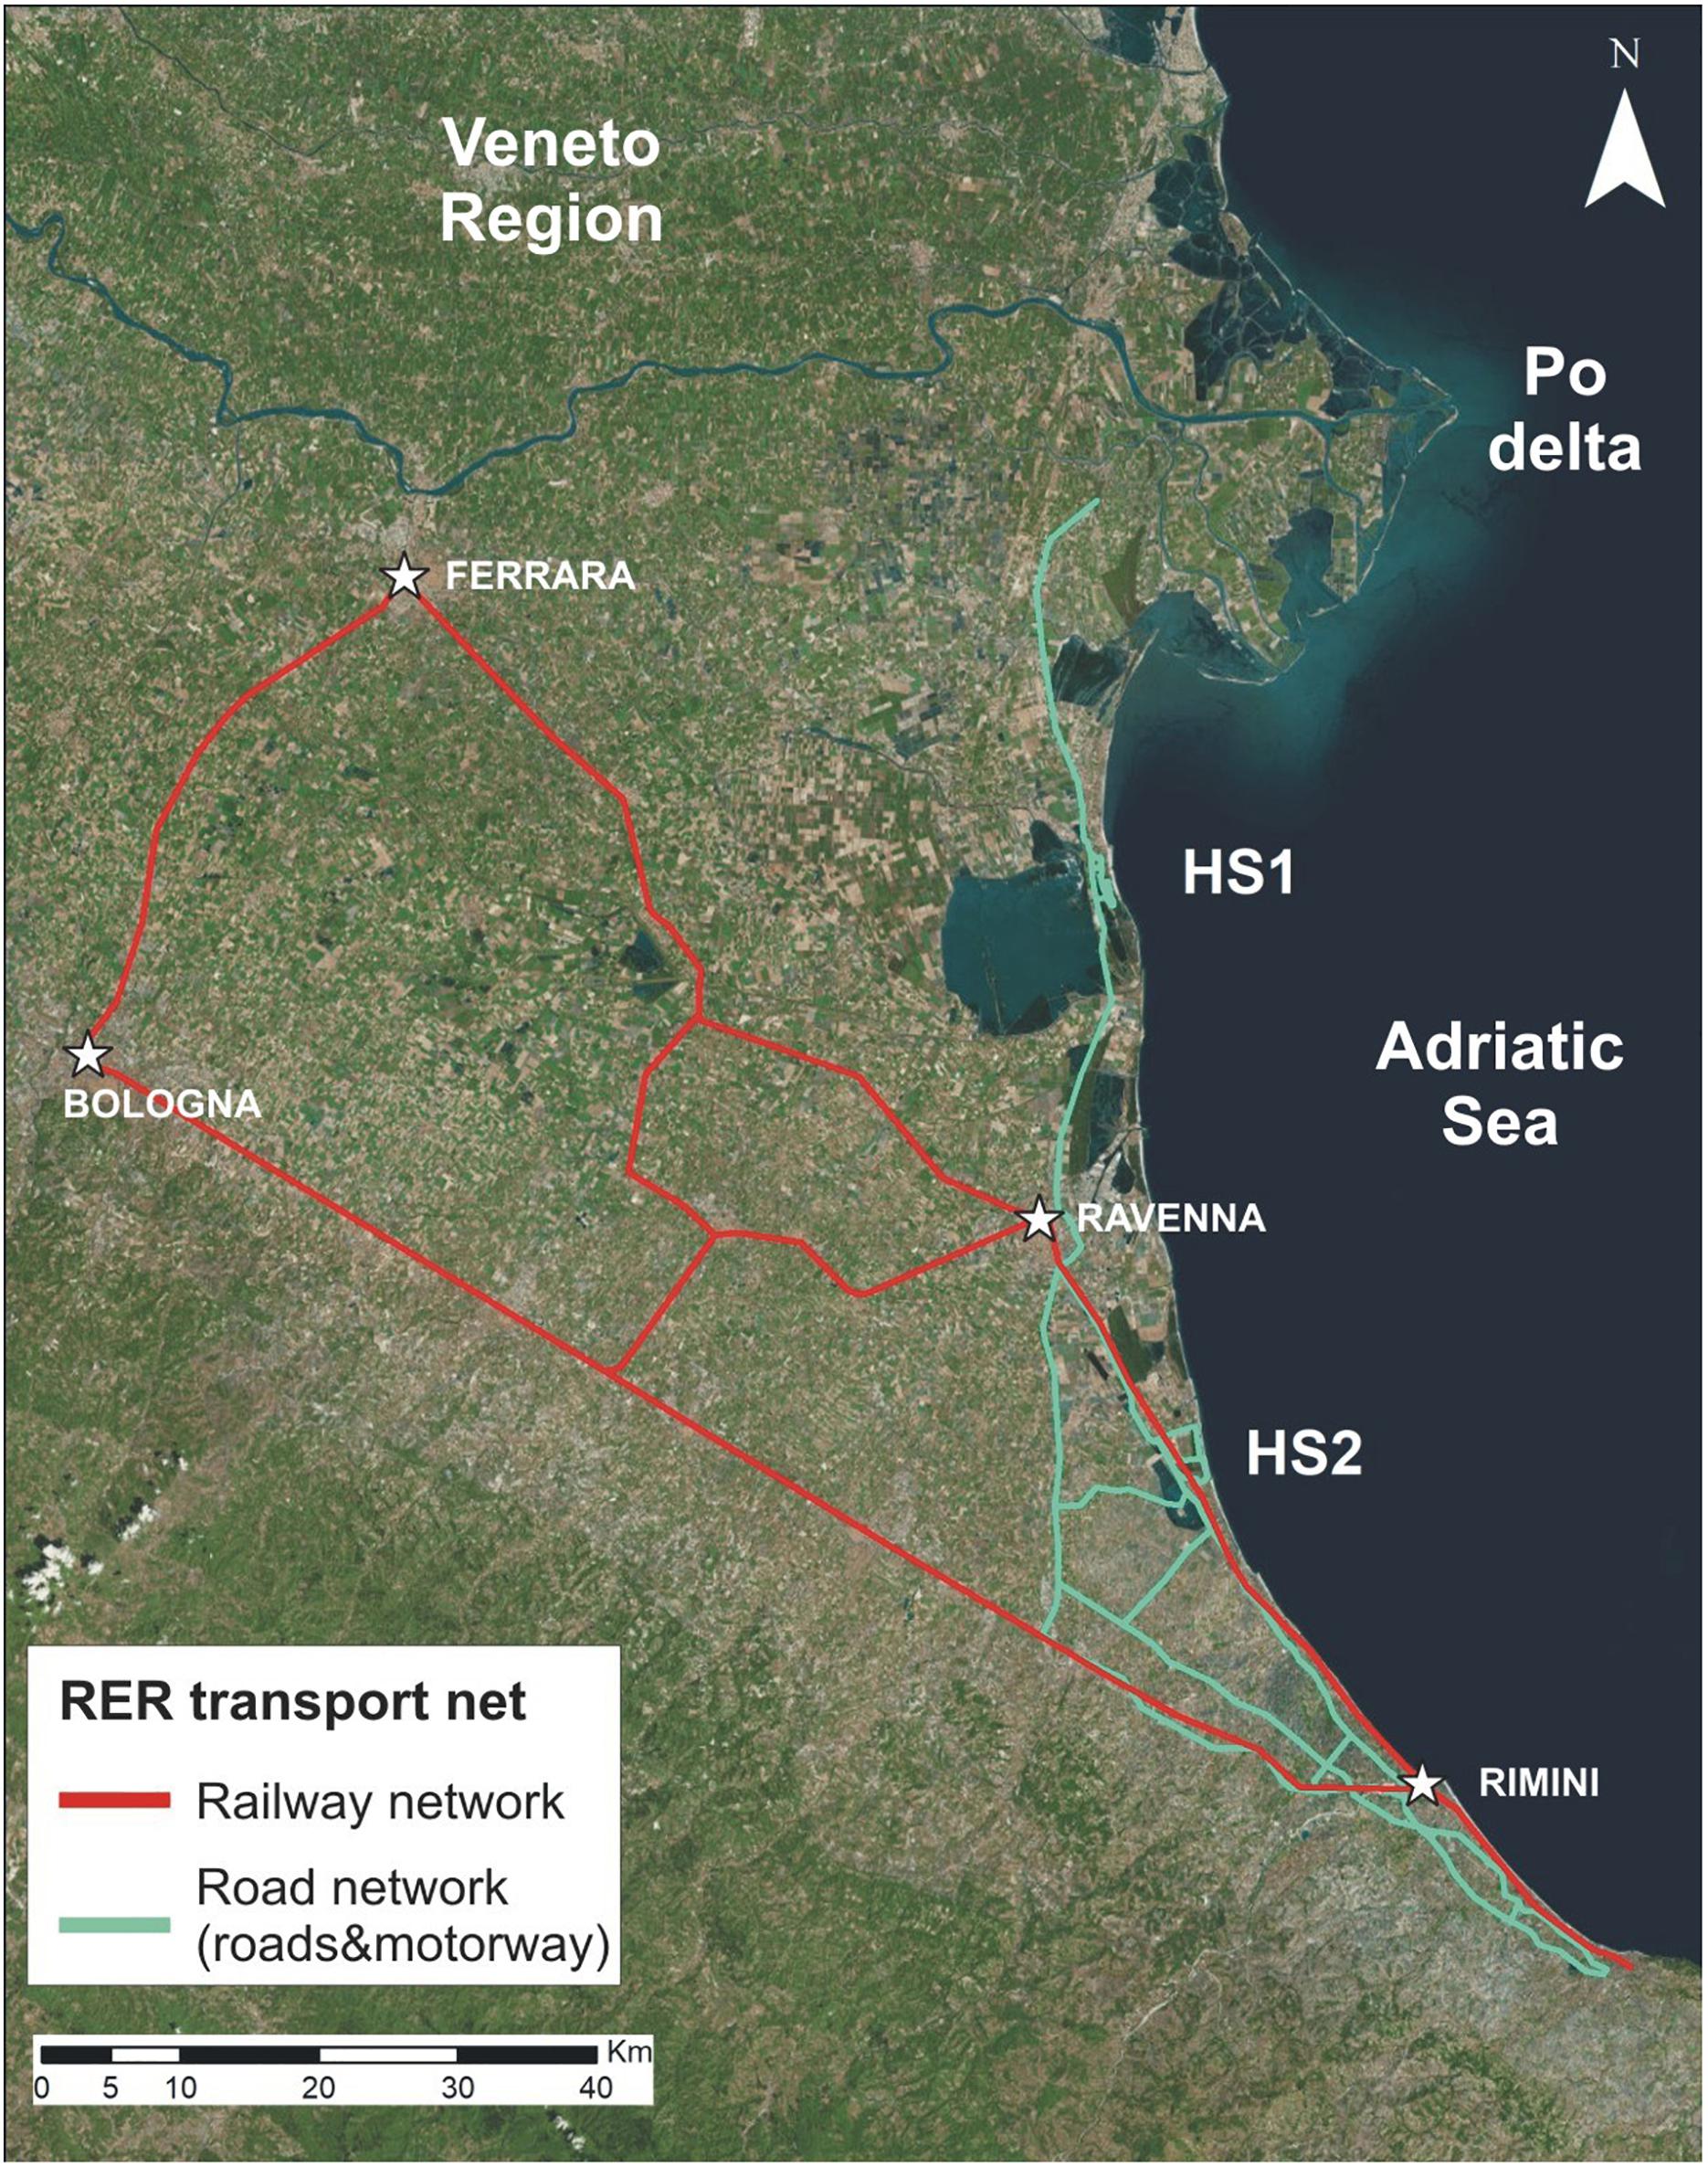
Figure 4. Schematic of the transport network at the regional level.
Accessibility is considered in the model as the principal “product” of the transportation system (Demirel et al., 2015) and its loss a good indicator of the disruption for regional analysis. Accessibility can be reduced by the loss of access to certain sites and by longer journey to reach certain sites. Two indicators, a connectivity ratio (Weighted Disconnection between nodes, WD2/WD1) and a time ratio (Time Lengthening between nodes, TL1/TL2), are therefore estimated by network analysis and combined to calculate a Weighted Disconnection and Time Lengthening Indicator transport (WDTL) by comparing the situation before (1) and after the event (2) (Sohn, 2005; Demirel et al., 2015; Mattsson and Jenelius, 2015, Table 7). The connectivity ratio estimates the loss of connectivity to places weighted by importance based on stakeholders’ inputs. The importance of a place permits to incorporate in the assessment the relative loss of the option to go from one place to another, such as the access to locations that provide essential services or important economy activities compared to uninhabited locations. WD1 represents the number of nodes accessible from each node before the disruption, WD2 the number of accessible nodes after the disruption. TL2 and TL1 represents the sum of network’s shortest possible travel times after (2) and before (1) the disruption (Table 7). The WDTL and related ratios are calculated following Table 7. WDTL is then integrated over time to better consider flood duration and repair time to return to normal condition.
For the present analysis, we have taken into account: local roads in the two selected hotspots, two important regional roads, part of the motorway (where it is located close to the coast, i.e., southern part of the regional coastline), the main provincial roads that connect the coastal villages to the main regional and national roads and the national and regional railway lines. A Data Quality Score of 2 is given to the input information for the transport network disruption.
Business Disruption
The business sector along the RER coastline is represented by the sun-and-beach tourism and, specifically, by the concessions that offer a large number of services to their clients. There are many hotels along the whole regional coastline and most of them offer special prices in nearby concessions.
Business disruption is firstly represented by the damage, and time for repair, to concessions and hotels that can negatively affect the whole hotspot area. A business supply chain approach derived from graph theory approaches is then used to model the principal business facilities in form of nodes and the business interactions or exchanges in form of arcs (Wagner and Neshat, 2010; Kim et al., 2015). The daily disruption (IBD, Table 7) is estimated as a reduction in the supply capacity of each of its nodes due to the flooding of premises weighted by their relative economic importance (Table 7). In INDRA each asset can be associated with a node of the modeled supply chain and attributed a supply capacity. As such, the supply capacity of the non-flooded assets can be aggregated for each node (Cimp) and compared to its supply capacity in normal condition (Cnorm) to derive the IBD at each simulation step.
Sun-umbrellas are included in the supply chain because they represent an important tourist and economic activity, as described in the field site description. The supply chain goes from “umbrellas” to hotels and concessions and from concessions to “umbrellas.” If the beach (available space for setting up umbrellas) or concessions are impacted, umbrellas and associated services will not be available for the tourists. The hotels are also negatively affected as people are not prone to go to local towns where services provided by concessionaires are not available on the beach. Because the inputs are based on many assumptions a Data Quality Score of 5 is given to the information for the business disruption.
Multi Criteria Analysis (MCA)
The INDRA model includes an MCA analysis to evaluate which of the selected hotspots is the most critical. In the present study it is decided to weight (in percentages) the different elements exposed to storms (i.e., Risk to Life, Household financial, Household displacement, Business financial, Business disruption, Transport, Ecosystems, Agricultural areas) through the consultation of end-users. The values are chosen on the basis of a discussion carried out with three stakeholders (a regional land use planner, a stakeholder working with the regional civil protection and a coastal manager). They were asked to score the elements listed above according to their own perception/opinion of the importance of each component. The listed values in Table 8 are obtained by first computing the mean values of the three values provided by the stakeholders, one for each component, and then through an agreement on the rounded values. The final values are then used in the weighted summation of the indicators to obtain a final score for each considered extreme event (equation 1):
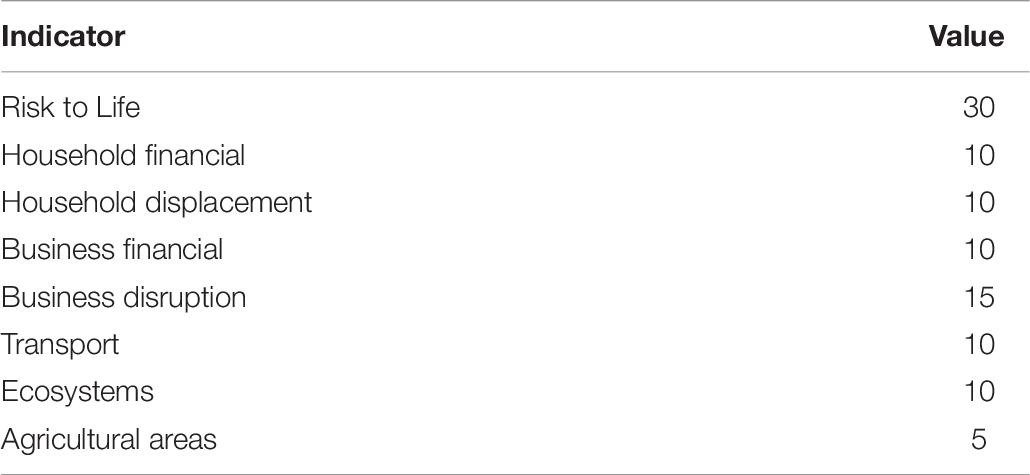
Table 8. List of indicators and associated weights.
where Wi = Weighted value obtained for each indicator (Table 8), Ii = Indicator Value (obtained using Table 7 formulas, specifically IBfr, IHfr, IRtl, WDTL, IBD; for displacement, agriculture and ecosystem indicators a 0 value is considered)
The consultation with regional and local stakeholders provides the figure about the level of awareness on coastal issues related to the impact of storms and how the issues are perceived and managed (Martinez et al., 2018). The involvement of the end-users is a fundamental step in the CRAF application, because it drives the selection of hotspots to be compared in phase 2 and the final ranking of the selected sites according to the MCA analysis of INDRA.
Results
The direct impact on assets of any type is large for both events in HS2 (Figures 5, 6) with flood depths up to 1.6 m. HS1, on the contrary, is not impacted by the T10 event while T100 generates some impacts, but still very limited. On Figures 5, 6 the identified assets of any type and the flooding extension, flood depth and flood depth-velocity values are presented. It is important to note that none of the assets experiences a very high impact (i.e., building collapse, Figure 6).
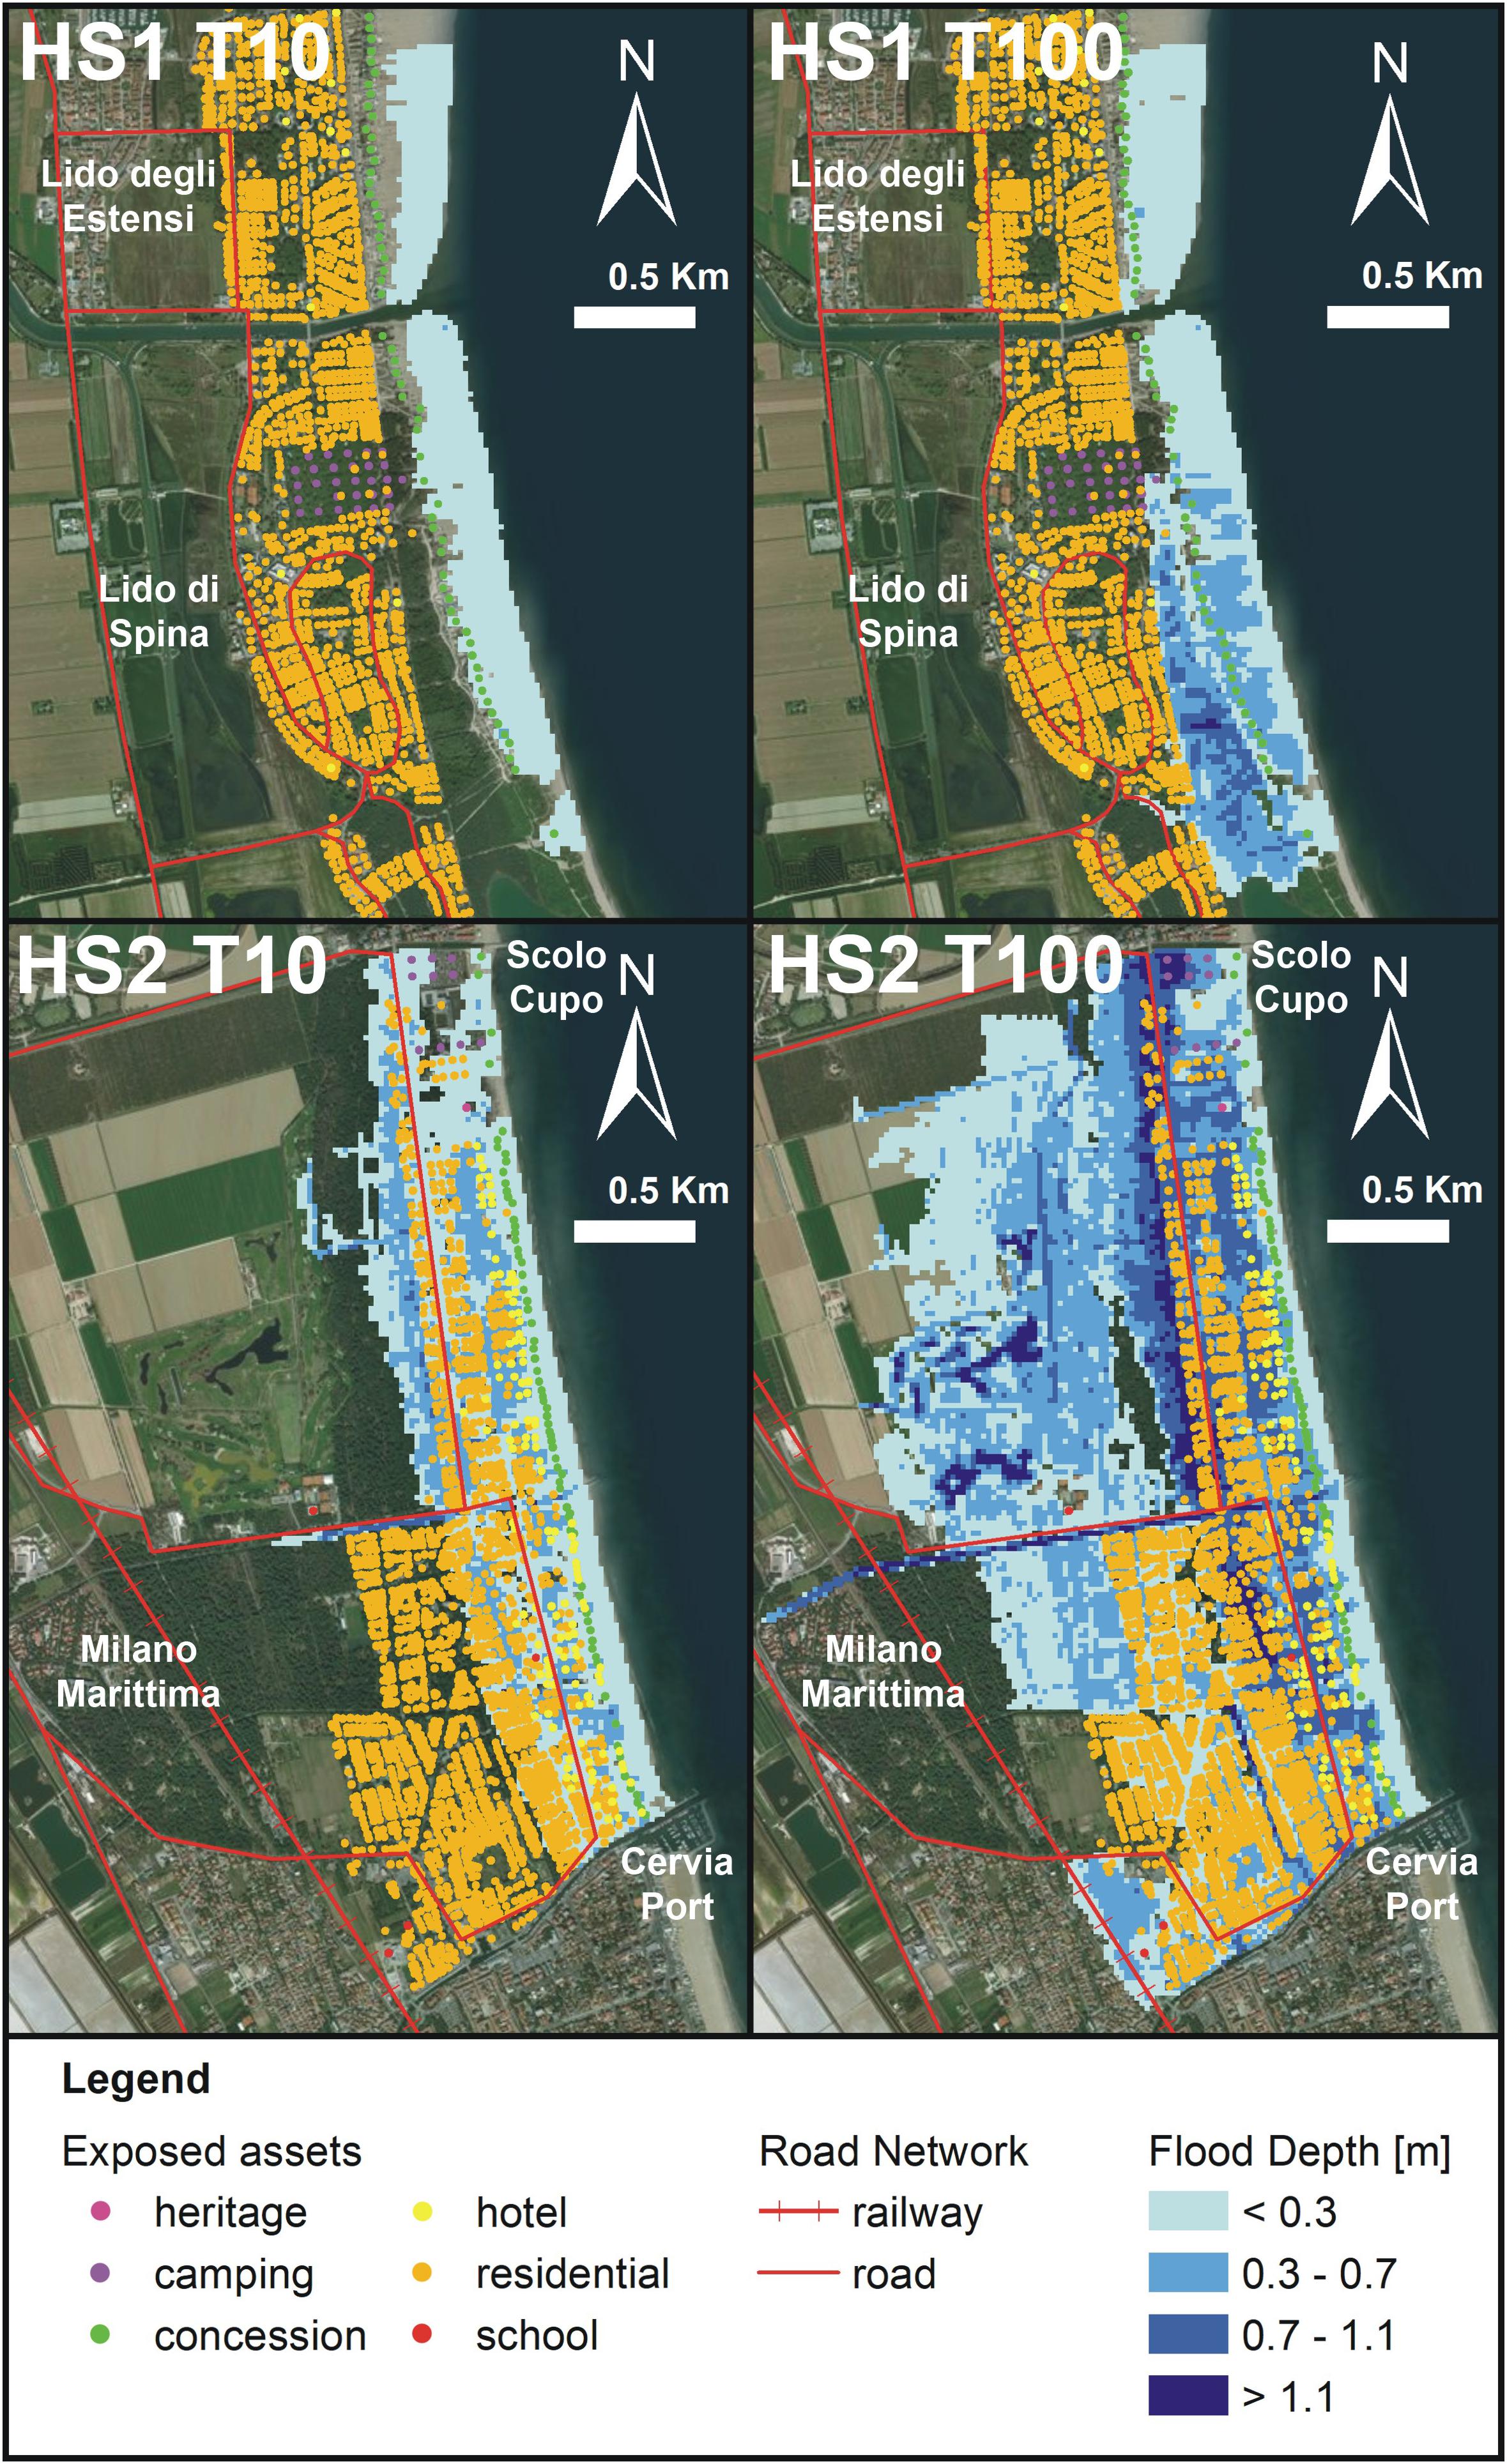
Figure 5. Identified assets and transport network in the two selected hotspots (HS1, Lido degli Estensi-Lido di Spina; HS2, Milano Marittima) and flooding extension. Flood depth calculated through the hazard modeling chain presented in Figure 2 for the two selected storms (T10 and T100) in the two hotspots: HS1, upper figures; HS2, lower figures. The selected classes for the visualization of flood depth values are chosen on the basis of the thresholds presented in Table 4.
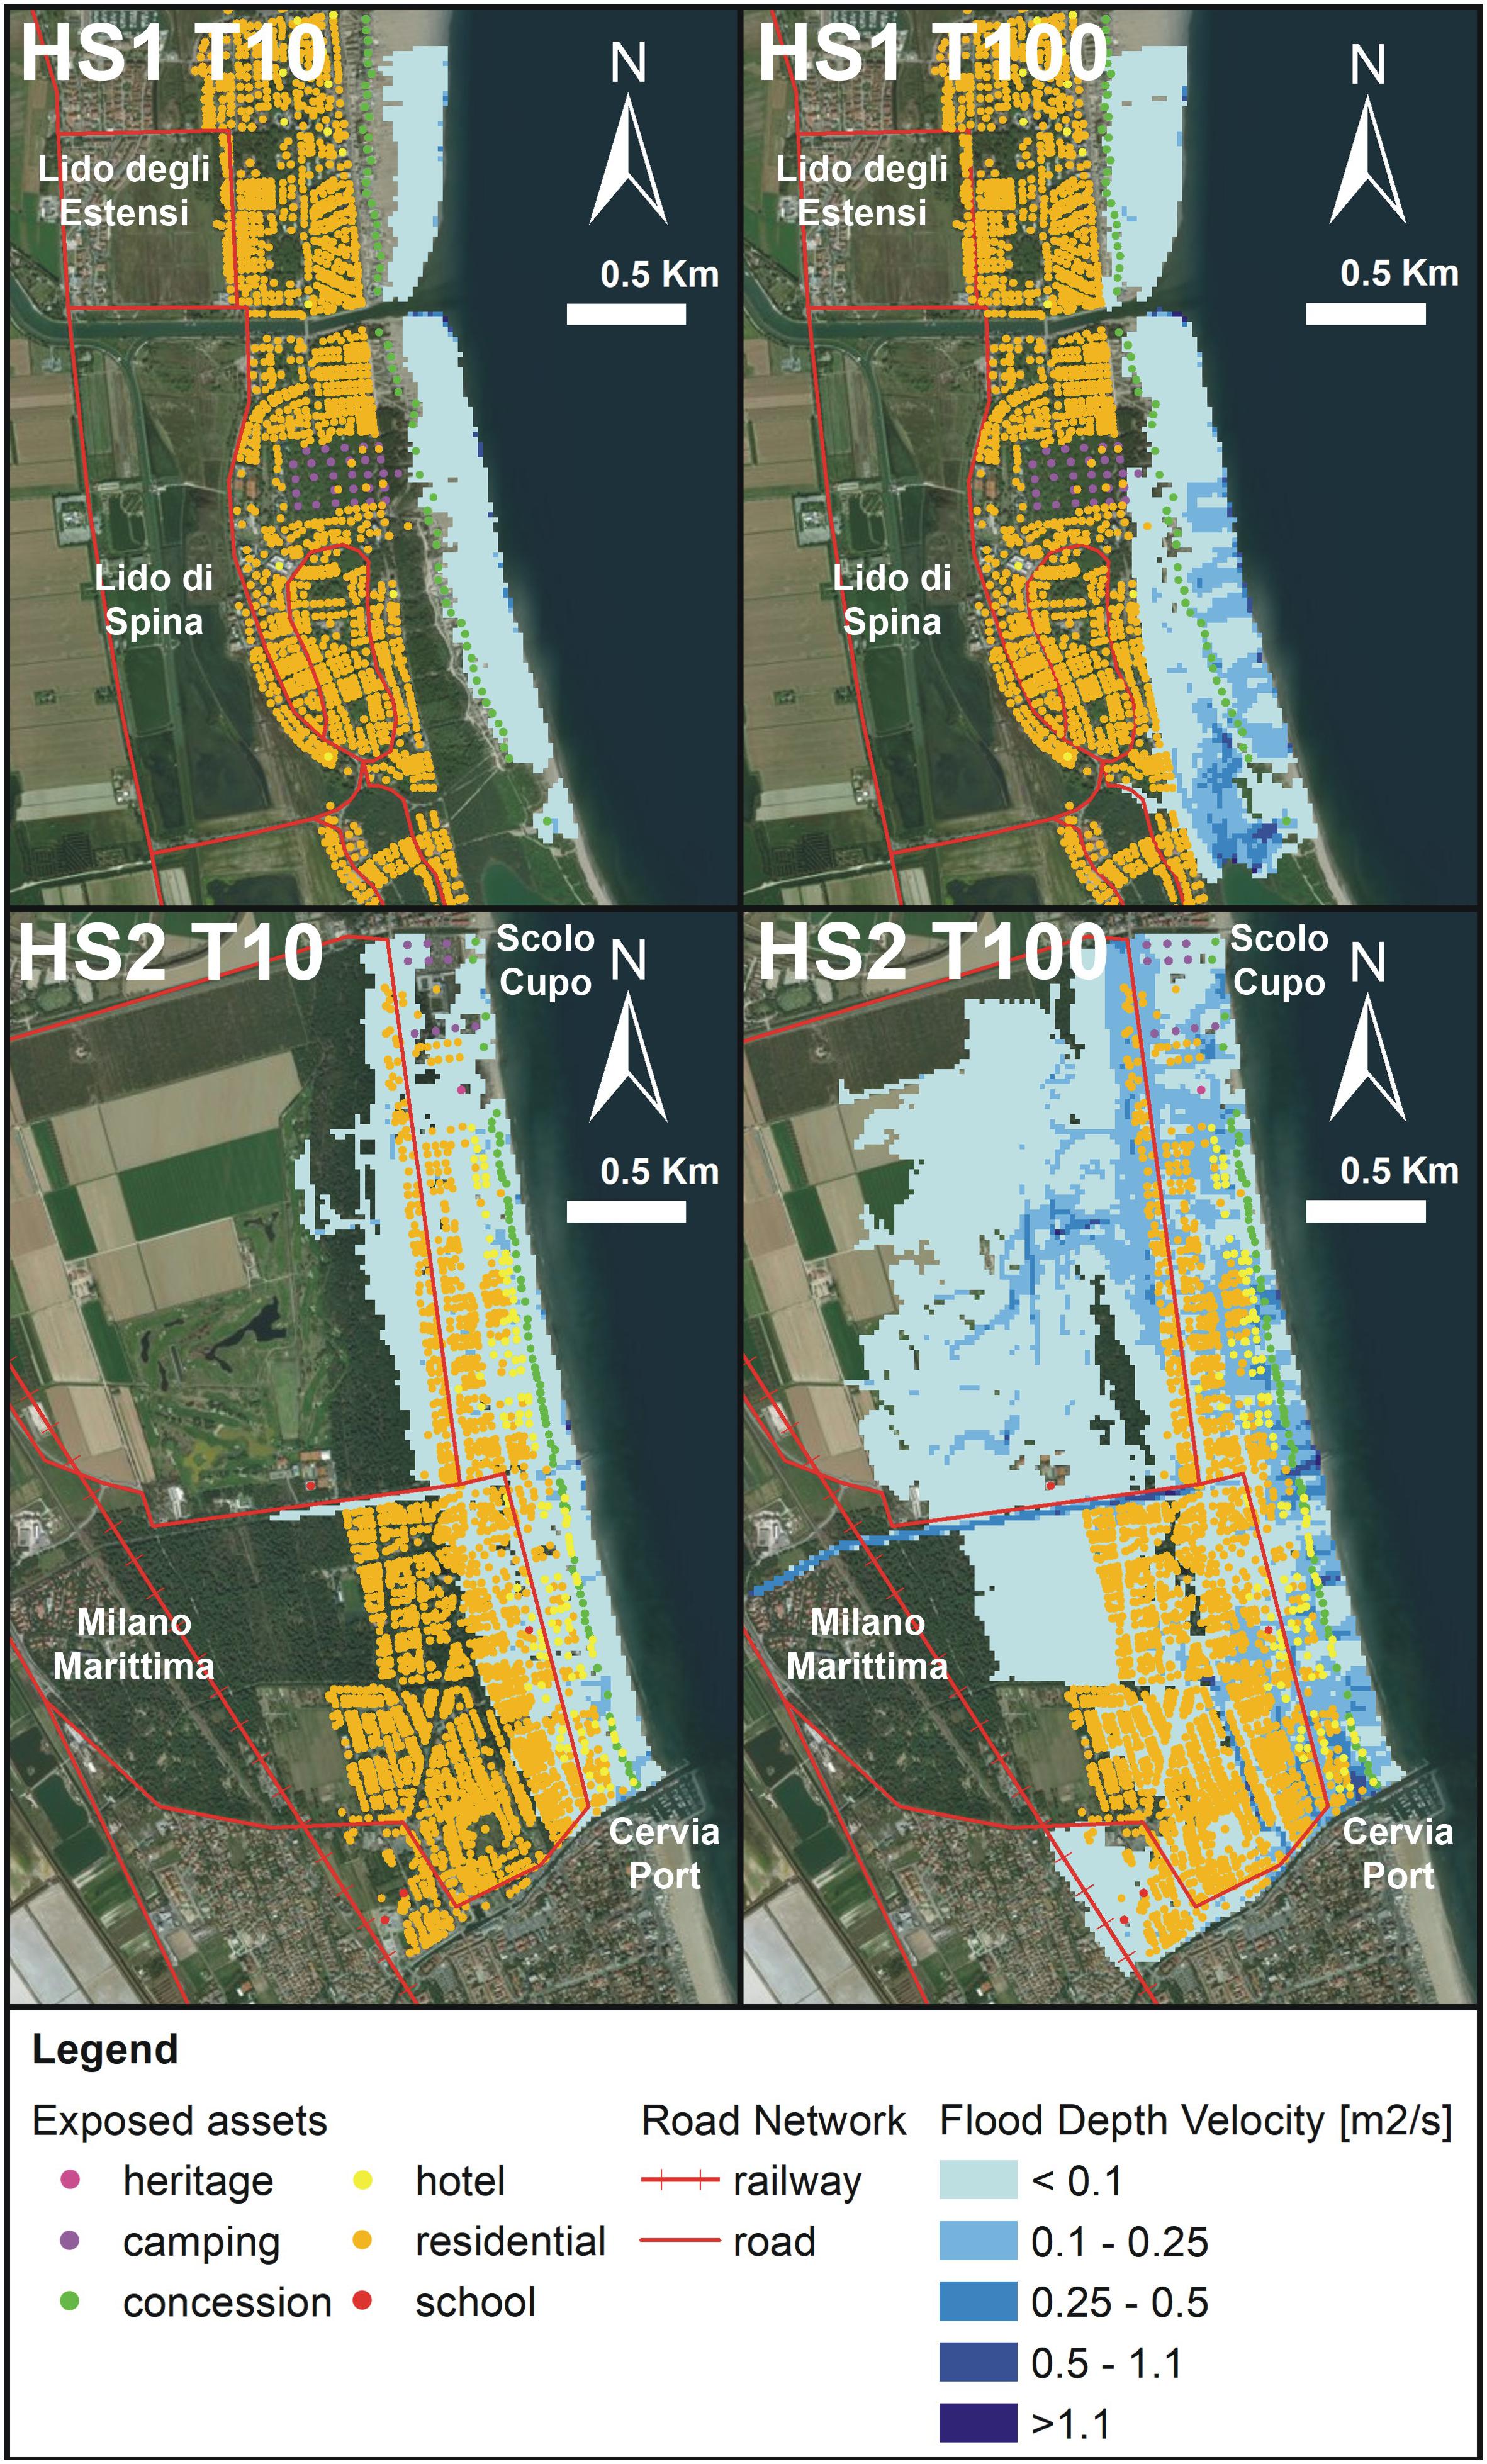
Figure 6. Identified assets and transport network in the two selected hotspots (HS1, Lido degli Estensi-Lido di Spina; HS2, Milano Marittima) and flooding extension. Flood depth-velocity calculated through the hazard modeling chain presented in Figure 2 for the two selected storms (T10 and T100) in the two hotspots: HS1, upper figures; HS2, lower figures. The selected classes for the visualization of flood depth-velocity values are chosen on the basis of the risk to life matrix and also presented in Table 5.
HS1 presents very few residential buildings and business activities that are impacted under both scenarios. In HS2 most of the exposed assets are affected by T100, with a significant percentage of assets in the medium and high impact levels (Figure 7). It should be underlined that schools are also impacted in HS2. Specifically, the four identified schools experience impact levels from 1 to 3, depending on their location. The colonies are impacted by the T100 event but the impact level is low.
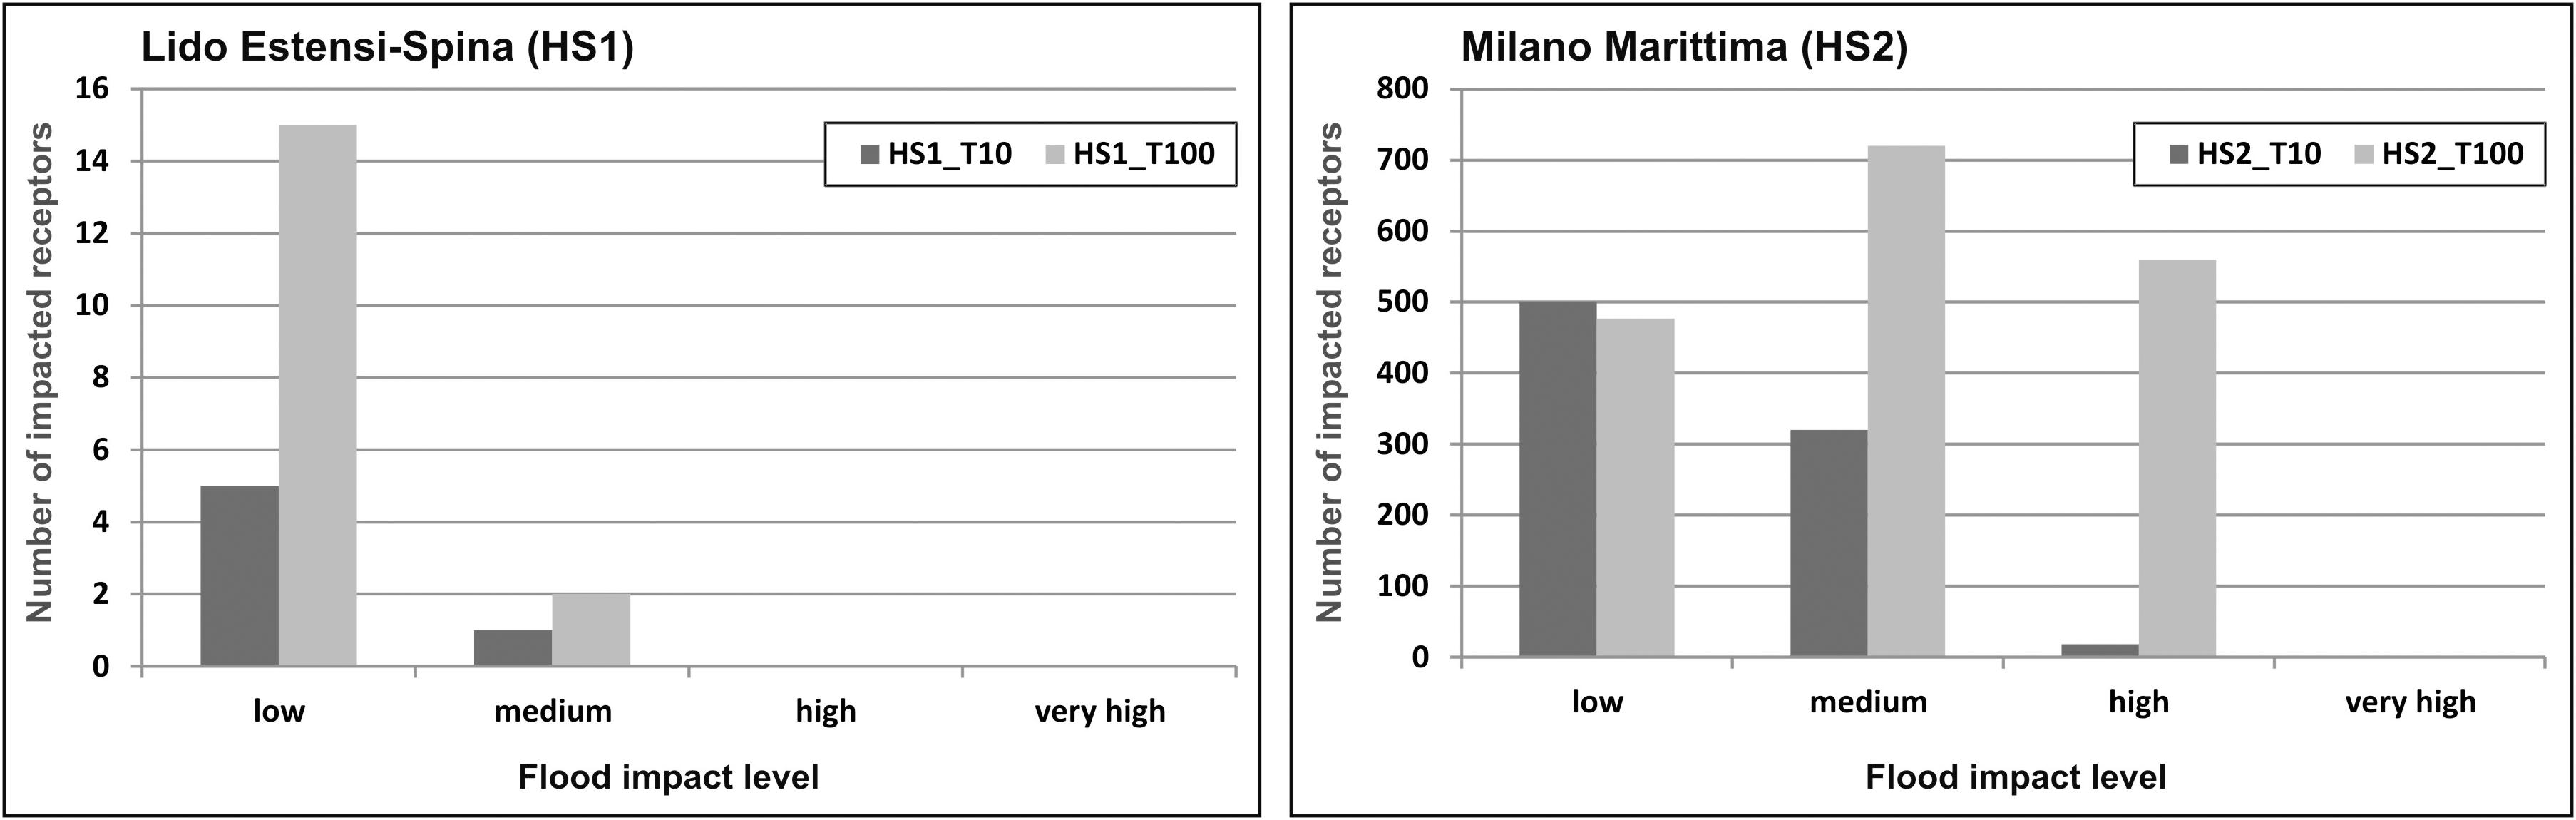
Figure 7. Distribution of impact severity to the selected assets per scenarios (T10 and T100) in the two hotspots: Lido degli Estensi-lido di Spina, HS1 and Milano Marittima, HS2.
The increased number of affected properties, associated with a significant change in the distribution of the severity of impacts from T10 to T100, leads to a reduced financial recovery of many households and businesses. A high proportion of households will be covered by compensation and will recover based on the government response. For businesses, the recovery is worsened by the absence of insurance or compensation. In HS2, the higher severity of impact may lead to a significant number of businesses expecting difficulties in recovering financially. As it was expected, the percentage of impacted business activities in the two hotspots increases between T10 and T100. Nevertheless, the percentage of affected businesses in HS1, with any impact level, for T100 is 25% of the identified activities while in HS2 the percentage rises to 92%. Furthermore, most of them experience medium and high severity impacts.
The final scores of the MCA in HS1 for the T100 event provide a value of business financial recovery equal to 0.003. This value indicates a high-level of recovery for the region as very few of the 3456 businesses identified at the regional level are impacted. Household financial recovery (2.5e-5) and risk to life (2.5e-4) values are also negligible to the low exposure level. The transport network is not impacted, while business disruption equals 0.006. The total MCA score is 0.001 considering the weighted values presented in Table 8. For HS2, on the contrary, risk to life is 0.007 and household financial recovery is 0.008 for the 66428 residential properties identified at the regional level. Business financial recovery is 0.022 reflecting a locally significant exposure, combined with a lack of insurance coverage. Transport disruption is not significant, while business disruption is 0.048. The total MCA score is 0.012, therefore one order of magnitude higher than HS1, but the regional impact remains low overall.
Discussion
This study represents one of the first attempts at the national level to provide an evaluation that quantifies the direct and indirect impacts to different assets, along coastal areas, generated by marine storms only. A previous study by De Angeli et al. (2018) evaluated the impact of marine and river flooding in the Liguria region (Italy), on the basis of comparable assumptions presented here. In fact, the methodology was developed for the RER coastline in the RISC-KIT project and then applied similarly at the two Italian case study sites. The evaluation is very much influenced by the quality of the input data. In the present paper the analysis is carried out including all the available information and the most up to date databases that are accessible at the regional and national level. Nevertheless, a lot of information is not available, and many assumptions are applied in order to produce the risk assessment.
The hazard modeling includes several limitations determined by the numerical approach, the assumptions and data availability. Beyond the fact that numerical models present intrinsic limitations, several simplifications are applied in this study. First, the morphodynamic behavior of the beach is represented by 1D profiles that, although computationally faster, do not represent the 2D nature of the phenomena. Furthermore, the forcing probabilistic extreme events are defined with information extracted from the literature. This choice was made because the selected information are commonly used at the regional level to define design extreme events for different purposes (e.g., Armaroli et al., 2009; Perini et al., 2016). A comprehensive assessment should include the evaluation of the combined probability of occurrence of waves and surge levels to define the forcing components for different return periods. The direction of the storm is assumed to be perpendicular to the coast, thus leading to a possible overestimation of the flood extension. An additional limitation on the forcing input is represented by the use of symmetric triangular synthetic storms to describe the temporal evolution of the event. Although it is a commonly adopted approach in numerical coastal studies (e.g., McCall et al., 2010; Plomaritis et al., 2018; Sanuy et al., 2018), it represents another source of uncertainty. Finally, the numerical models are applied in default mode, except for the parameters previously described. It was demonstrated that the hazard modeling input (and, therefore, the output flood maps) can act as important factors affecting the overall uncertainty of flooding risk assessments (e.g., Vousdoukas et al., 2018a). On the other hand, other studies (e.g., Apel et al., 2009; De Moel and Aerts, 2011) conclude that it does not represent a dominant factor, when compared with the uncertainty due to the assumptions on the impact assessment component. In particular, De Moel and Aerts (2011) quantify that the variation of the final damage assessment induced by the uncertainty related to the damage model are comparable (or higher) to that of a uniform variation of ∼1.1 m in flood water depth. Being these uncertainty magnitudes for flood depth estimates rather improbable (see, as an example, the performance of the hazard models in Apel et al., 2009), the design- and default-based hazard modeling applied in this study can be assumed to represent a meaningful approach, especially considering the comparative nature of the CRAF 2 approach.
On the other hand, the direct impact assessment is affected by large uncertainties (Jongman et al., 2012) that propagate to the final damage estimations. It was demonstrated that the uncertainty related to this component represents a dominant factor affecting the overall uncertainty of damage assessments (De Moel and Aerts, 2011), especially when damage calculations are applied in deterministic ways (Figueiredo et al., 2018). Additionally, damage models are generally site-dependent. Therefore, transferability to locations where such data is not available remains an important issue, although the utilization of curves developed in different countries is a common practice (Scorzini and Frank, 2017). The definition of the land use or building category is also fundamental, however, such specific data is difficult to obtain. The type of flood hazard and related damage models are also important, as marine floods are different from fluvial ones in terms of consequences to buildings (e.g., salinity, short-period waves). These aspects contribute to lower the predictive skills of damage models (Figueiredo et al., 2018). The damage curve used in this study (adapted from Scorzini and Frank, 2017) was developed for residential buildings, for a fluvial flood occurred in Veneto in 2010. The Emilia-Romagna region borders the Veneto region to the north and has comparable architectural, as well as economic, characteristics. Therefore, spatial transferability of the damage curve does not represent an issue. On the other hand, the uncertainty on direct impact evaluation is mostly represented by the use of average depth-damage curves developed for fluvial inundations and the lack of building typology (e.g., single- or multi- storey; with/without basement). It is worth mentioning that the selection of the curve was made in agreement with the regional coastal managers and that all the limitations were discussed with them, in the framework of the RISC-KIT project. The proper selection of direct damage models is a persisting problem in the literature. Whereas an uplift factor could be considered in further studies to better reflect additional damages associated with saline and wave conditions, specific building-type depth-damages curves and appropriate cadastral maps remain to be developed and applied to marine conditions. Furthermore, no differentiation was possible on the type of residential building because of the lack of available data. Additionally, the curve is also applied to commercial activities, since a specific model was not available. As deterministic approaches based on flood damage curves showed limitations and low predictive skills, recent approaches are moving toward probabilistic (e.g., Dottori et al., 2016) or model-ensemble approaches (Figueiredo et al., 2018). The damage is, therefore, calculated using different damage models in order to produce a distribution of possible damages and, at the same time, to quantify the uncertainty of the outcomes. Figueiredo et al. (2018) provide a methodology to score a dataset of damage models that can also be applied for deterministic approaches, to select the most suitable one. The score assignment is based on the expert judgment of the main properties of the models, such as the type of physical variables included, the degree of characterization of the assets, the similarity of the context where the model has to be applied with the study site where the model was built, the correspondence between the analyzed flood and the type of flood used to build the model and the type of variable used to quantify the output damage (i.e., damage factor or monetary damage). Following the example of damage model properties proposed in Figueiredo et al. (2018) in their Figure 3, the curve applied in the present study scores 0.59e-2, or 0.44e-2, depending on the fact that the regional contexts (i.e., Veneto and Emilia-Romagna) are considered comparable or not. The scores are medium-low values if compared to the scoring (from 0.15e-2 to 3.34e-2) of models assessed in Figueiredo et al. (2018).
A site-specific damage model would undoubtedly represent the best option. Therefore, regional coastal managers should prioritize the collection and analysis of the necessary information to produce reliable damage models. At present, there is not an official regional (or national) standard for data collection in the aftermath of an extreme coastal event, in order to measure flood levels and identify, collect and rigorously catalog the losses in monetary terms or structural/content damage. Standard data-collection protocols should be based on scientific studies already available at local level (e.g., Duo et al., 2018), in order to collect the necessary information that is of foremost importance to develop damage models.
The assets’ location is very well defined, but other characteristics are assumed to be uniform or are associated with default values defined at European level or for other EU countries (Jongman et al., 2012). The elevation above the ground of both buildings and roads is set to 0 m. Clearly this is not the real situation for all the identified assets. However, the definition of the correct elevations would require very detailed data collection on the ground. The presence of underground garages or basements should be identified for each asset and included in the input data. The time required to collect such data is large and raises a question about the feasibility of such in-depth inspection of critical areas. It could be performed for areas with a limited extent and/or number of assets, but for hotspots with many buildings and a large flooding extension it is less realistic. An alternative of an in-depth inspection of critical areas is the development in collaboration with architects, civil engineers, land use planner of a national or regional dataset of properties’ typology which better reflects fundamental structural differences and construction. This could be then integrated in the current land use information to better support risk assessment.
The consultation of stakeholders with different roles is fundamental to properly define the variables to be included in the model, taking into account the information that correctly describe the characteristics of the study area. In fact, the insurance figure included in the model is based on both a comprehensive desktop research and interview of an informed person (President of the Consortium of economic activities, i.e., concessions and hotels) who provided useful information to define the level of insurance according to the level of impact. The same applies to the household displacement. The decision to exclude displacement from the evaluation derives from the consultation of regional managers and thanks to the historical storm database (Perini et al., 2011). The lack of well documented impacts of past events, as such, limits the possibility to use post-events survey to estimate future risk and the coastal community resilience. This is aggravated by the rapid changes in urbanization, livelihood and in the environment. Working with the coastal communities to develop plausible “what-if” scenarios and to collect relevant socio-economic data could complement this lack of information as well as building community resilience.
The supply chain presented in the paper is surely one of the most important economic activities at the regional level. However, it does not fully represent the complexity of the local economy and the connection with other businesses such as restaurants, local commerce and producers, highly dependent for their annual incomes on the seasonal touristic activity level. The identification of the most significant business sectors and the linkage between the different parts of the identified sectors requires much effort for data collection and construction of the correct supply chain and paths of “goods” exchange (represented here by hotels, concessions and umbrellas customers). The involvement of informed stakeholders is also needed to properly design the supply chain. A better understanding of the coping strategies is also required to better assess differences in businesses recovery time. The quantification of direct and indirect impacts to the economic sector is important for a comprehensive risk assessment but still in its infancy, as demonstrated in the present paper.
Conclusion
This paper includes the analysis of direct and indirect impacts generated by flooding in two coastal villages located in the Emilia-Romagna coastline (Italy): Lido degli Estensi-Spina (HS1) and Milano Marittima (HS2) (Figure 1). The evaluation was carried out taking into account two extreme events with return periods of 10 and 100 years through a modeling chain that included a morphological numerical model (XBeach) and an inundation model (Lisflood-FP). The flooding hazard assessment was then used to quantify direct and indirect impacts for different assets. The INDRA (Integrated Disruption Assessment) model (Viavattene et al., 2018), developed in the RISC-KIT project (Van Dongeren et al., 2018), was used to quantify the impacts, to define the level of recovery of the analyzed assets after the events and the probable disruption of the transport network and of the business supply chain. The data input for the impact assessment was performed utilizing the best available information and through consultations with different stakeholders. An evaluation of the data quality was carried out to underline the strengths and limitations of the applied methodology.
The results showed that HS2 is the most critical site, with many assets highly impacted in both scenarios (Figures 5, 6). The results are consistent with the historical information on past events that affected the regional coastline (Perini et al., 2011). Furthermore, the site is one of the most vulnerable of the RER coast. Nevertheless, the present work quantifies the damage and identifies a certain level of disruption, with some sectors (i.e., business activities) being more severely affected, in the case of an extreme event occurrence, because of a lack of flood-related insurance coverage. These results are in accordance with the observed consequences of storms. The most affected assets are the concessions that represent a pivotal element of the business supply chain.
The evaluation of the quality of the data identified the business supply chain as largely based on general assumptions (DQS = 5), while the direct impacts, household displacement and insurance matrix have a higher quality, but still poor (DQS = 3). The input information with the best quality is the transport network disruption (DQS = 2). As discussed, the evaluation of the impacts is largely affected by the quality of the input information. The outcomes should be evaluated taking into account the uncertainty/limitations of the adopted approach in terms of hazard modeling and damage functions selection that are presented and largely examined.
The study represents a first and important step toward the quantification of risk, properly and fully characterized. However, it underlines that comprehensive data collection should be carried out to better characterize the risk at the regional level and that a wider involvement of stakeholders should also be foreseen.
Data Availability
The datasets generated for this study are available on request to the corresponding author.
Author Contributions
CA wrote the manuscript with the contribution of ED and CV. CA collected the information on assets to perform the direct and indirect impact assessment, including the insurance figure, displacement information, reinstatement and recovery times, the interview to stakeholders, and mapping of the assets in GIS. CV supervised the data collection and defined the final quality scores in agreement with CA and ED. CA ran the INDRA model. ED designed the forcing input data and ran the hazard models, providing the flood maps. CV is one of the main designers of the INDRA model (provided by the Middlesex University of London in the RISC-KIT project). CV analyzed the results of the INDRA model together with CA. CA, ED, and CV equally contributed to the literature review, and “Introduction,” “Discussion,” and “Conclusion” sections.
Funding
The research leading to these results has received funding from EU H2020 Program under grant agreement no. 700099 (Anywhere: Enhancing emergency management and response to extreme weather and climate events).
Conflict of Interest Statement
The authors declare that the research was conducted in the absence of any commercial or financial relationships that could be construed as a potential conflict of interest.
Acknowledgments
The authors are very grateful to Prof. Sally J. Priest and Prof. Paolo Ciavola for providing valuable comments and suggestions on the manuscript and for the grammar and language corrections. The authors would like to thank Dott.ssa Luisa Perini, Dr. Lorenzo Calabrese, and Dott. Paolo Luciani of SGSS for providing LU/LC maps, cadastral maps, and Lidar data. The authors would like to thank ENI for providing Lidar and Multibeam data. The authors would also like to thank all the interviewed stakeholders for their availability and for the valuable information provided, without which it would not have been possible to carry out the analysis. The authors are very grateful to the four reviewers for their valuable comments and suggestions that helped to significantly improve the manuscript.
Footnotes
- ^ www.risckit.eu
- ^ http://www.risckit.eu/np4/file/383/RISC_KIT_D2.3_CRAF_Guidance.pdf
- ^ https://www.ferraraitalia.it/ripascimento-della-costa-aggiudicata-la-gara-per-20-milioni-79268.html
- ^ https://www.ucer.camcom.it/osservatori-regionali/os-turistico/pdf17/2017-rapporto-consuntivo-turismo-er.pdf
- ^ http://www.risckit.eu/np4/383.html, T6
- ^ http://www.risckit.eu/np4/file/383/RISC_KIT_D2.3_CRAF_Guidance.pdf
- ^ http://www.comune.ra.it/Notizie-di-copertina/Maltempo-il-diario-delle-comunicazioni-di-servizio.-L-impegno-di-Comune-Istituzioni-e-mondo-imprenditoriale-per-far-fronte-all-emergenza
- ^ http://protezionecivile.regione.emilia-romagna.it/argomenti/piani-sicurezza-interventi-urgenti/speciali/febbraio-2015-emergenza-neve-e-mareggiate/febbraio-2015-emergenza-neve-e-mareggiate
- ^ www.micore.eu
- ^ http://protezionecivile.regione.emilia-romagna.it/argomenti/piani-sicurezza-interventi-urgenti/speciali/febbraio-2015-emergenza-neve-e-mareggiate/febbraio-2015-emergenza-neve-e-mareggiate
- ^ http://www.confesercentiferrara.it/mareggiate-un-aiuto-da-confesercenti/
- ^ http://www.comune.ra.it/Notizie-di-copertina/Maltempo-il-diario-delle-comunicazioni-di-servizio.-L-impegno-di-Comune-Istituzioni-e-mondo-imprenditoriale-per-far-fronte-all-emergenza
References
Antonellini, M., Giambastiani, B. M. S., Greggio, N., Bonzi, L., Calabrese, L., Luciani, P., et al. (2019). Processes governing natural land subsidence in the shallow coastal aquifer of the Ravenna coast. Italy. CATENA 172, 76–86. doi: 10.1016/j.catena.2018.08.019
Apel, H., Aronica, G. T., Kreibich, H., and Thieken, A. H. (2009). Flood risk analyses—how detailed do we need to be? Nat. Hazards 49, 79–98. doi: 10.1007/s11069-008-9277-8
Armaroli, C., Ciavola, P., Masina, M., and Perini, L. (2009). Run-up computation behind emerged breakwaters for marine storm risk assessment. J. Coast. Res. 56, 1612–1616.
Armaroli, C., and Duo, E. (2018). Validation of the coastal storm risk assessment framework along the emilia-romagna coast. Coast. Eng. 134, 159–167. doi: 10.1016/j.coastaleng.2017.08.014
Aucelli, P. P. C., Di Paola, G., Incontri, P., Rizzo, A., Vilardo, G., Benassai, G., et al. (2017). Coastal inundation risk assessment due to subsidence and sea level rise in a Mediterranean alluvial plain (Volturno coastal plain – southern Italy). Estuar. Coast. Shelf S. 198, 597–609. doi: 10.1016/j.ecss.2016.06.017
Bates, P., and De Roo, A. P. (2000). A simple raster-based model for flood inundation simulation. J. Hydrol. 236, 54–77. doi: 10.1016/S0022-1694(00)00278-X
Bates, P. D., Dawson, R. J., Hall, J. W., Horritt, M. S., Nicholls, R. J., Wicks, J., et al. (2005). Simplified two-dimensional numerical modelling of coastal flooding and example applications. Coast. Eng. 52, 793–810. doi: 10.1016/j.coastaleng.2005.06.001
Belton, S., and Stewart, T. S. (2002). Multiple Criteria Decision Analysis. An Integrated Approach. Massachusetts: Kluwer Academic Publishers.
Ciavola, P., Ferreira, O., Haerens, P., Van Koningsveld, M., and Armaroli, C. (2011). Storm impacts along European coastlines. Part 2: lessons learned from the MICORE project. Environ. Sci. Policy 14, 924–933. doi: 10.1016/j.envsci.2011.05.009
Christie, E. K., Spencer, T., Owen, D., McIvor, A. L., Möller, I., and Viavattene, C. (2018). Regional coastal flood risk assessment for a tidally dominant, natural coastal setting: North Norfolk, southern North Sea. Coast. Eng. 134, 177–190. doi: 10.1016/j.coastaleng.2017.05.003
Ciavola, P., Armaroli, C., Chiggiato, J., Valentini, A., Deserti, M., Perini, L., et al. (2007). Impact of storms along the coastline of Emilia-Romagna: the morphological signature on the Ravenna coastline (Italy). J. Coast. Res. SI 50, 540–544.
De Angeli, S., D’Andrea, M., Cazzola, G., Dolia, D., Duo, E., and Rebora, N. (2018). Coastal risk assessment framework: comparison of modelled fluvial and marine inundation impacts. bocca di magra, ligurian coast, Italy. Coast. Eng. 134, 229–240. doi: 10.1016/j.coastaleng.2017.09.011
De Moel, H., and Aerts, J. C. J. H. (2011). Effect of uncertainty in land use, damage models and inundation depth on flood damage estimates. Nat. Hazards 58, 407–425. doi: 10.1007/s11069-010-9675-6
Demirel, H., Kompil, M., and Nemry, F. (2015). A framework to analyze the vulnerability of European road networks due to Sea-Level Rise (SLR) and sea storm surges. Transport. Res. A Policy Pract. 81, 62–76. doi: 10.1016/j.tra.2015.05.002
Dottori, F., Figueiredo, R., Martina, M. L. V., Molinari, D., and Scorzini, A. R. (2016). INSYDE: a synthetic, probabilistic flood damage model based on explicit cost analysis. Nat. Hazards Earth Syst. Sci. 16, 2577–2591. doi: 10.5194/nhess-16-2577-2016
Duo, E., Trembanis, A. C., Dohner, S., Grottoli, E., and Ciavola, P. (2018). Local-scale post-event assessments with GPS and UAV-based quick-response surveys: a pilot case from the Emilia–Romagna (Italy) coast. Nat. Hazards Earth Syst. Sci. 18, 2969–2989. doi: 10.5194/nhess-18-2969-2018
Erikson, L., Barnard, P., O’Neill, A., Wood, N., Jones, J., Finzi Hart, J., et al. (2018). Projected 21st century coastal flooding in the southern california bight. part 2: tools for assessing climate change-driven coastal hazards and socio-economic impacts. J. Mar. Sci. Eng. 6:76. doi: 10.3390/jmse6030076
Favaretto, C., Martinelli, L., and Ruol, P. (2019). Coastal flooding hazard due to overflow using a level II method: application to the venetian littoral. Water 11:134. doi: 10.3390/w11010134
Ferreira, O., Viavattene, C., Jiménez, J. A., Bolle, A., das Neves, L., Plomaritis, T. A., et al. (2018). Storm-induced risk assessment: evaluation of two tools at the regional and hotspot scale. Coast. Eng. 134, 241–253. doi: 10.1016/j.coastaleng.2017.10.005
Ferreira, Ó., Ciavola, P., Armaroli, C., Balouin, Y., Benavente, J., Del Río, L., et al. (2009). Coastal storm risk assessment in Europe: examples from 9 study sites. J. Coast. Res. 56, 1632–1636.
Figueiredo, R., Schröter, K., Weiss-Motz, A., Martina, M. L. V., and Kreibich, H. (2018). Multi-model ensembles for assessment of flood losses and associated uncertainty. Nat. Hazards Earth Syst. Sci. 18, 1297–1314. doi: 10.5194/nhess-18-1297-2018
Gouldby, B., Samuels, P., Klijn, F., van Os, A., Sayers, P., and Schanze, J. (2005). Language of Risk - Project Definitions EU Floodsite Project. Available at: http://www.floodsite.net/html/partner_area/project_docs/FLOODsite_Language_of_Risk_v4_0_P1.pdf (accessed February 8, 2019).
Hajkowicz, S., and Higgins, A. (2008). A comparison of multiple criteria analysis techniques for water resource management. Eur. J. Oper. Res. 184, 255–265. doi: 10.1016/j.ejor.2006.10.045
IPCC (2018). “Summary for policymakers in global warming of 1.5°C. An IPCC Special Report on the impacts of global warming of 1.5°C above pre-industrial levels and related global greenhouse gas emission pathways,” in The Context of Strengthening the Global Response to the Threat of Climate Change, Sustainable Development, and Efforts to Eradicate Poverty, eds P. Masson-Delmotte, et al. (Geneva: World Meteorological Organization), 32.
Janssen, R. (2001). On the use of multi-criteria analysis in environmental impact assessment in the Netherlands. J. Multi-Criteria Decis. Anal. 10, 101–109. doi: 10.1002/mcda.293.abs
Jongman, B., Kreibich, H., Apel, H., Barredo, J. I., Bates, P. D., Feyen, L., et al. (2012). Comparative flood damage model assessment: towards a European approach. Nat. Hazards Earth Syst. Sci. 12, 3733–3752. doi: 10.5194/nhess-12-3733-2012
Jonkman, S. N., Vrijling, J. K., and Vrouwenvelder, A. C. W. M. (2008). Methods for the estimation of loss of life due to floods: a literature review and a proposal for a new method. Nat. Hazards 46, 353–389. doi: 10.1007/s11069-008-9227-5
Karvonen, T., Hepojoki, A., Huhta, H.-K., and Louhio, A. (2000). The Use of Physical Models in Dam-Break Analysis RESCDAM Final Report. Helsinki: Helsinki University.
Kim, Y., Chen, Y.-S., and Linderman, K. (2015). Supply chain network disruption and resilience: a network structural perspective. J. Oper. Manag. 33-34, 43–59. doi: 10.1016/j.jom.2014.10.006
Luijendijk, A., Hagenaars, G., Ranasinghe, R., Baart, F., Donchyts, G., and Aarninkhof, S. (2018). The state of the world’s beaches. Sci. Rep. 8:6641. doi: 10.1038/s41598-018-24630-6
Martinez, G., Armaroli, C., Costas, S., Harley, M. D., and Paolisso, M. (2018). Experiences and results from interdisciplinary collaboration: utilizing qualitative information to formulate disaster risk reduction measures for coastal regions. Coast. Eng. 134, 62–72. doi: 10.1016/j.coastaleng.2017.09.010
Masina, M., and Ciavola, P. (2011). Analisi dei livelli marini estremi e delle acque alte lungo il litorale ravennate. Studi Costieri 18, 87–101.
Mattsson, L.-G., and Jenelius, E. (2015). Vulnerability and resilience of transport systems – a discussion of recent research. Transp. Res. 81, 16–34. doi: 10.1016/j.tra.2015.06.002
McCall, R. T., Van Thiel de Vries, J. S. M., Plant, N. G., Van Dongeren, A. R., Roelvink, J. A., Thompson, D. M., et al. (2010). Two-dimensional time dependent hurricane overwash and erosion modeling at Santa Rosa Island. Coast. Eng. 57, 668–683. doi: 10.1016/j.coastaleng.2010.02.006
Mentaschi, L., Vousdoukas, M. I., Pekel, J.-F., Voukouvalas, E., and Feyen, L. (2018). Global long-term observations of coastal erosion and accretion. Sci. Rep. 8:12876. doi: 10.1038/s41598-018-30904-w
Meyer, V., Becker, N., Markantonis, V., Schwarze, R., van den Bergh, J. C. J. M., Bouwer, L. M., et al. (2013). Review article: assessing the costs of natural hazards – state of the art and knowledge gaps. Nat. Hazards Earth Syst. Sci. 13, 1351–1373. doi: 10.5194/nhess-13-1351-2013
Penning-Rowsell, E. C., Priest, S., Parker, D., Morris, J., Tunstall, S., Viavattene, C., et al. (2013). Flood and Coastal Erosion Risk Management A Manual for Economic Appraisal. London: Routledge.
Perini, L., Calabrese, L., Deserti, M., Valentini, A., Ciavola, P., and Armaroli, C. (2011). Le mareggiate e gli impatti sulla costa in Emilia-Romagna 1946–2010. Bologna: ARPA Emilia-Romagna.
Perini, L., Calabrese, L., Lorito, S., and Luciani, P. (2015a). “Coastal flood risk in Emilia-Romagna (Italy): the sea storm of February 2015,” in Proceedings of the Coastal and Maritime Mediterranean Conference, 3rd Edn, eds D. Levacher, M. Sanchez, P. Ciavola, and E. Raymond (Ferrara).
Perini, L., Calabrese, L., Lorito, S., and Luciani, P. (2015b). Il rischio da mareggiata in Emilia-Romagna: l’evento del 5-6 Febbraio 2015. il Geologo. 53, 8–17. Available at: http://www.geologiemiliaromagna.it/il-geologo-anno-xv-2015-n-53/ (accessed January 30, 2019).
Perini, L., Calabrese, L., Luciani, P., Olivieri, M., Galassi, G., and Spada, G. (2017). Sea-level rise along the Emilia-Romagna coast (Northern Italy) in 2100: scenarios and impacts. Nat. Hazards Earth Syst. Sci. 17, 2271–2287. doi: 10.5194/nhess-17-2271-2017
Perini, L., Calabrese, L., Salerno, G., Ciavola, P., and Armaroli, C. (2016). Evaluation of coastal vulnerability to flooding: comparison of two different methodologies adopted by the Emilia-Romagna region (Italy). Nat. Hazards Earth Syst. Sci. 16, 181–194. doi: 10.5194/nhess-16-181-2016
Plomaritis, T. A., Costas, S., and Ferreira, Ó (2018). Use of a Bayesian network for coastal hazards, impact and disaster risk reduction assessment at a coastal barrier (Ria Formosa, Portugal). Coast. Eng. 134, 134–147. doi: 10.1016/j.coastaleng.2017.07.003
Poljanšek, K., Marin Ferrer, M., De Groeve, T., and Clark, I. (eds) (2017). Science for Disaster Risk Management 2017: Knowing Better and Losing Less. Luxembourg: Publications Office of the European Union.
Priest, S., Wilson, T., Tapsell, S., Penning-Rowsell, E., Viavattene, C., and Fernandez-Bilbao, A. (2007). Building a Model to Estimate Risk to Life for European Flood Events – Final Report. FLOODsite project report T10-07-10. Wallingford: HR Wallingford.
Priest, S. J. (2014). Review of International Flood Insurance and Recovery Mechanisms: Implications for New Zealand and the Resilience of Older People. Research Report for the Community Resilience and Good Ageing: Doing Better in Bad Times Project. Available at: http://resilience.goodhomes.co.nz/publications/ (accessed August 1, 2019).
Roelvink, D., Reniers, A., van Dongeren, A., van Thiel de Vries, J., McCall, R., and Lescinski, J. (2009). Modelling storm impacts on beaches, dunes and barrier islands. Coast. Eng. 56, 1133–1152. doi: 10.1016/j.coastaleng.2009.08.006
Ruol, P., Martinelli, L., and Favaretto, C. (2018). Vulnerability analysis of the venetian littoral and adopted mitigation strategy. Water 10:984. doi: 10.3390/w10080984
Sanuy, M., Duo, E., Jäger, W. S., Ciavola, P., and Jiménez, J. A. (2018). Linking source with consequences of coastal storm impacts for climate change and risk reduction scenarios for Mediterranean sandy beaches. Nat. Hazards Earth Syst. Sci. 18, 1825–1847. doi: 10.5194/nhess-18-1825-2018
Scorzini, A., and Frank, E. (2017). Flood damage curves: new insights from the 2010 flood in Veneto. Italy. J. Flood Risk Manage. 10, 381–392. doi: 10.1111/jfr3.121633
Sohn, J. (2005). Evaluating the significance of highway network links under the flood damage: an accessibility approach. Transp. Res. A Policy Pract. 40, 491–506. doi: 10.1016/j.tra.2005.08.006
Taramelli, A., Di Matteo, L., Ciavola, P., Guadagnano, F., and Tolomei, C. (2015). Temporal evolution of patterns and processes related to subsidence of the coastal area surrounding the Bevano River mouth (Northern Adriatic) – Italy. Ocean Coast. Manage. 108, 74–88. doi: 10.1016/j.ocecoaman.2014.06.021
Teatini, P., Ferronato, M., Gambolati, G., Bertoni, W., and Gonella, M. (2005). A century of land subsidence in Ravenna. Italy. Environ. Geol. 47, 831–846. doi: 10.1007/s00254-004-1215-9
Torresan, S., Critto, A., Rizzi, J., and Marcomini, A. (2012). Assessment of coastal vulnerability to climate change hazards at the regional scale: the case study of the North Adriatic Sea. Nat. Hazards Earth Syst. Sci. 12, 2347–2368. doi: 10.5194/nhess-12-2347-2012
UNISDR (2015). Disaster Risk Reduction and Resilience in the 2030 Agenda for Sustainable Development. Available at: https://www.unisdr.org/files/46052_disasterriskreductioninthe2030agend.pdf (accessed February 8, 2019).
Van Dongeren, A., Ciavola, P., Martinez, G., and Viavattene, C. (2018). Introduction to RISC-KIT: resilience increasing strategies for coasts. Coast. Eng. 134, 2–9. doi: 10.1016/j.coastaleng.2017.10.007
Viavattene, C., Jiménez, J. A., Ferreira, O., Priest, S., Owen, D., and McCall, R. (2018). Selecting coastal hotspots to storm impacts at the regional scale: a coastal risk assessment framework. Coast. Eng. 134, 33–47. doi: 10.1016/j.coastaleng.2017.09.002
Viavattene, C., Jiménez, J. A., Owen, D., Priest, S., Parker, D., Micou, P., et al. (2015). Coastal Risk Assessment Framework Tool. London: Middlesex University research.
Villatoro, M., Silva, R., Méndez, F. J., Zanuttigh, B., Pan, S., Trifonova, E., et al. (2014). An approach to assess flooding and erosion risk for open beaches in a changing climate. Coast. Eng. 87, 50–76. doi: 10.1016/j.coastaleng.2013.11.009
Vousdoukas, M. I., Bouziotas, D., Giardino, A., Bouwer, L. M., Mentaschi, L., Voukouvalas, E., et al. (2018a). Understanding epistemic uncertainty in large-scale coastal flood risk assessment for present and future climates. Nat. Hazards Earth Syst. Sci. 18, 2127–2142. doi: 10.5194/nhess-18-2127-2018
Vousdoukas, M. I., Mentaschi, L., Voukouvalas, E., Bianchi, A., Dottori, F., and Feyen, L. (2018b). Climatic and socioeconomic controls of future coastal flood risk in Europe. Nat. Clim. Change 8, 776–780. doi: 10.1038/s41558-018-0260-4
Wagner, S. M., and Neshat, N. (2010). Assessing the vulnerability of supply chains using graph theory. Int. J. Prod. Econ. 126, 121–129. doi: 10.1016/j.ijpe.2009.10.007
Zanuttigh, B. (2011). Coastal flood protection: what perspective in a changing climate? The THESEUS approach. Environ. Sci. Policy 14, 845–863. doi: 10.1016/j.envsci.2011.03.015
Zanuttigh, B., Simcic, D., Bagli, S., Bozzeda, F., Pietrantoni, L., Zagonari, F., et al. (2014). THESEUS decision support system for coastal risk management. Coast. Eng. 87, 218–239. doi: 10.1016/j.coastaleng.2013.11.013
Keywords: coastal risk, vulnerability, exposure, INDRA model, Lisflood, XBeach, storm, inundation
Citation: Armaroli C, Duo E and Viavattene C (2019) From Hazard to Consequences: Evaluation of Direct and Indirect Impacts of Flooding Along the Emilia-Romagna Coastline, Italy. Front. Earth Sci. 7:203. doi: 10.3389/feart.2019.00203
Received: 28 February 2019; Accepted: 25 July 2019;
Published: 30 August 2019.
Edited by:
Carmine Galasso, University College London, United KingdomReviewed by:
Raffaele De Risi, University of Bristol, United KingdomMaria Pregnolato, University of Bristol, United Kingdom
Mohammad Heidarzadeh, Brunel University London, United Kingdom
Rui Figueiredo, University of Porto, Portugal
Copyright © 2019 Armaroli, Duo and Viavattene. This is an open-access article distributed under the terms of the Creative Commons Attribution License (CC BY). The use, distribution or reproduction in other forums is permitted, provided the original author(s) and the copyright owner(s) are credited and that the original publication in this journal is cited, in accordance with accepted academic practice. No use, distribution or reproduction is permitted which does not comply with these terms.
*Correspondence: Clara Armaroli, Y2xhcmEuYXJtYXJvbGlAdW5pZmUuaXQ=