 Shengfu Wang
 Ping Yang2*
- 1Department of Civil and Architecture Engineering, East China University of Technology, Nanchang, China
- 2School of Civil Engineering, Nanjing Forestry University, Nanjing, China
Accurate quantification of soil micro-pore is important for understanding compression deformation and thaw settlement of fine-grained soils, including clay. This study presents mercury intrusion porosimetry (MIP) data on the four types of soil samples before and after freeze-thaw and compression under four different cold-end temperatures. Undisturbed clay specimens were subject to one-directional freeze-thaw in a closed system under different freezing temperatures. The frozen-thawed specimens were divided into three layers and averaged along the height direction for a consolidation test. The mercury intrusion test data were analyzed, and three typical micro-pore parameters including (1) total pore volume, (2) median pore size, and (3) average pore size were selected to quantitatively describe the variation of soil micro-pores before and after freeze-thaw and consolidation. Close correlations were observed between the variation of micro-pore parameters and variation of compression index, pore ratio, water content, and density. This study demonstrates that compared with traditional test methods, MIP can be advantageous in revealing the internal micro-pore change of soil due to freeze-thaw and compression both quantitatively and nondestructively.
Introduction
The artificial ground freezing method (AGF) has been widely applied in geotechnical engineering (Jessberger, 1980), such as the freezing method of shaft sinking technology in deep alluvium (Li et al., 2017), freezing excavation connecting passages and freezing reinforcement for the ends of shield tunnels in urban subway tunnels (Russo et al., 2015; Han et al., 2016; Kang et al., 2016), and freezing waterproof curtains in deep foundation pits (Fei et al., 2019). In recent years, the large-scale construction of urban underground space in China has accelerated the application of AGF in urban underground buildings and tunnels (Zhou and Tang, 2015b; Tang and Li, 2018). Engineering practices show that using AGF, the excavation of the connecting tunnels of urban subway tunnels in the Yangtze River Delta area, China, has yielded successful construction (Yang and Zhu, 2005; Zhou and Zhou, 2012; Zhou and Tang, 2015a; Zhao et al., 2016).
In water-rich soft soil areas, the control of compression deformation of thawed soil under the action of gravity and load of superstructures becomes a difficult and urgent problem to be solved (Hass and Schafers, 2006; Zhou and Tang, 2015a). The existing research focuses on the external factors that affect the freeze-thaw deformation of soils, such as freezing temperature and temperature gradient (Lagger et al., 2014), the physical indexes of soil, including water content (Wang D. et al., 2018), void ratio (Wang et al., 2017; Wang S. et al., 2018), permeability coefficient (Vitel et al., 2016), compressibility coefficient (Zhao et al., 2013), and the external load (Lai et al., 2013; Guan et al., 2015; Yuan et al., 2019a, b).
The microstructure of soil will be changed under the action of gravity and external loads, and this also changes the mechanical properties of soil (Katti and Shanmugasundaram, 2001; Ouhadi and Yong, 2003; Yamamuro and Wood, 2004; Dananaj et al., 2005; Kikkawa et al., 2013; Zhao et al., 2017). The macroscopic mechanical behavior of soil is closely related to its microstructure. The combination of macro- and micro-characteristics of soil is of great significance to the study of macro-deformation mechanism and the establishment of a micro-mechanical model of soil (Ouhadi and Yong, 2003; Miao et al., 2007; Cuisinier et al., 2011; Gu et al., 2013).
This study presents the results of freeze-thaw tests of soft clay under four different cold-end temperatures and consolidation tests before and after freeze-thaw testing. Moreover, mercury intrusion porosimetry (MIP) tests were conducted on four types of soil samples before and after freeze-thaw and compression, including (1) undisturbed soil, (2) compacted soil, (3) soil after freeze-thaw, and (4) soil after freeze-thaw and compacted. Finally, the variation of micro-pores under freeze-thaw and compression was quantitatively calculated, and three parameters (total pore volume, median pore size, and average pore size) were obtained to describe the micro-pore change under freeze-thaw and compression. Combined with the changes of water content, void ratio, and the compression index of soil before and after freezing-thawing and compression, the compression deformation of soil after freezing-thawing can be explained and quantitatively described from a microcosmic point of view.
Experimental Program
This section describes the index properties of the soil sample, the environmental chamber used to simulate the one-way freeze-thaw process, the MIP technique, and testing procedures.
Index Properties of Soil Samples
Samples were obtained from 30 to 35 m below the ground surface by a thin-walled sampler (11 cm ID) from a site in Ningbo, China. Figure 1 presents the grain size distribution curve, and Table 1 presents the soil index property. The samples were classified as lean clay (CL) per the Unified Soil Classification System. The soil specimens were unsaturated with a degree of saturation at 87.9%.
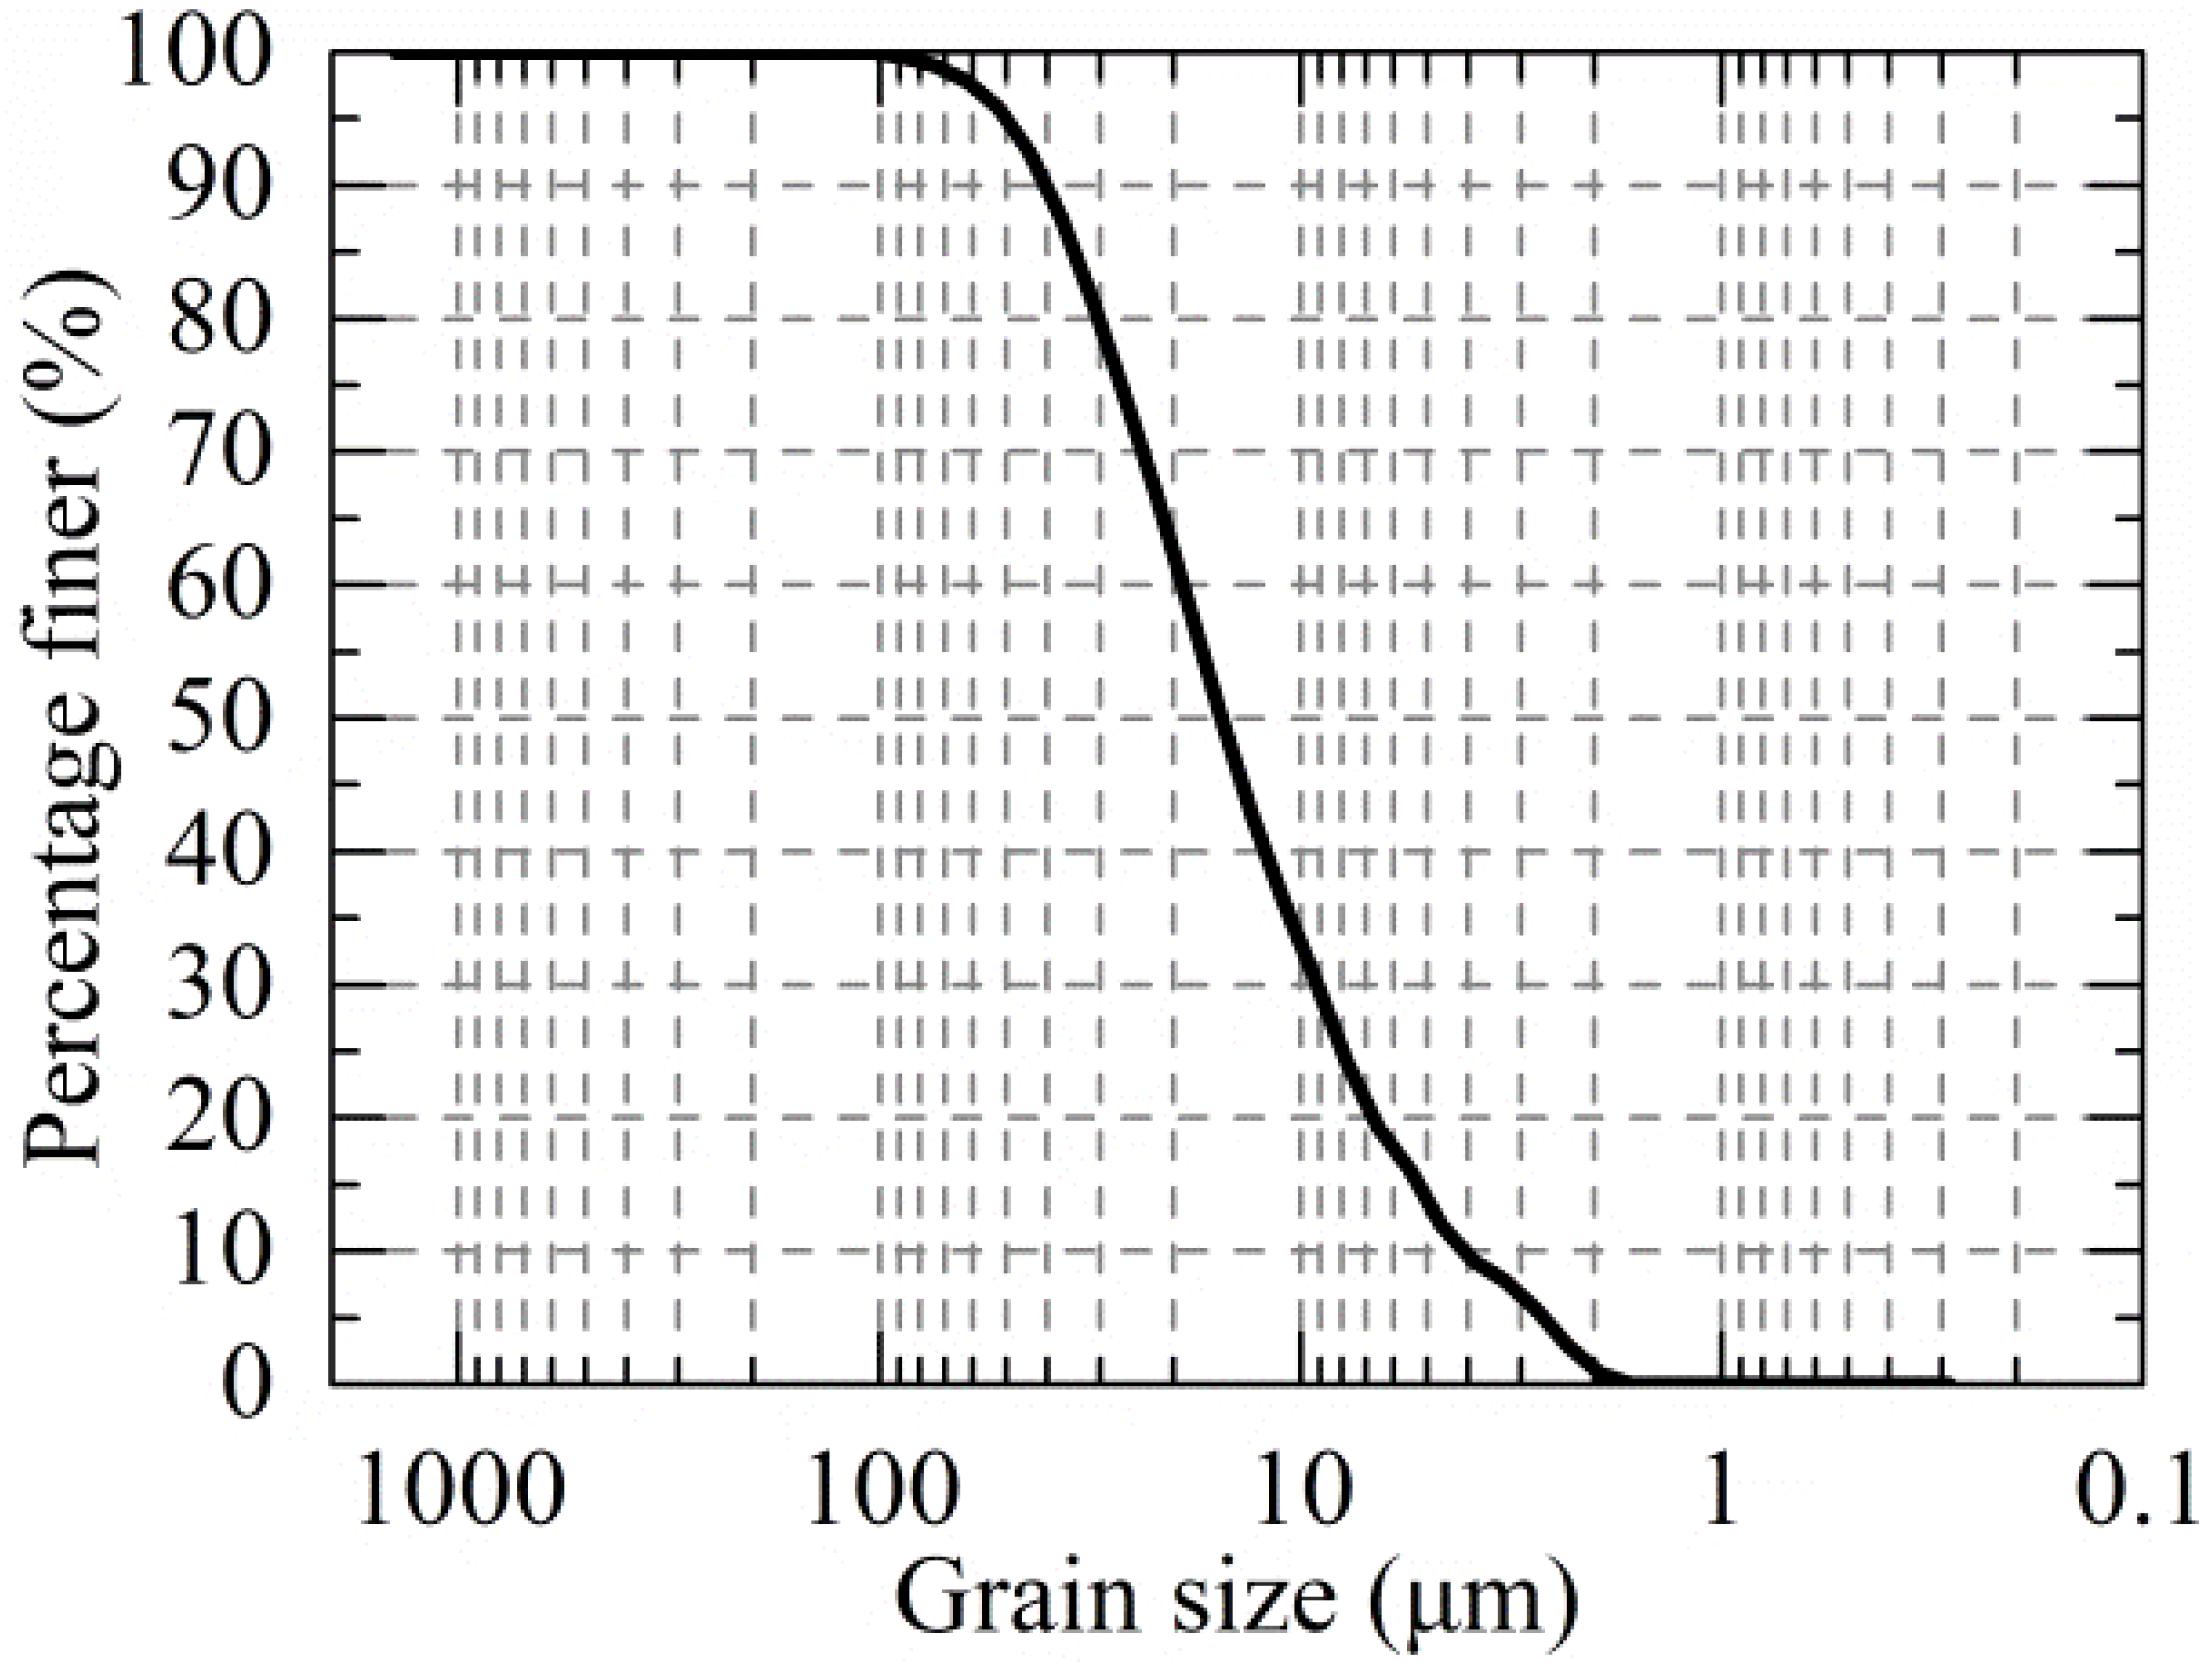
Figure 1. Grain sizes distribution of clay samples.
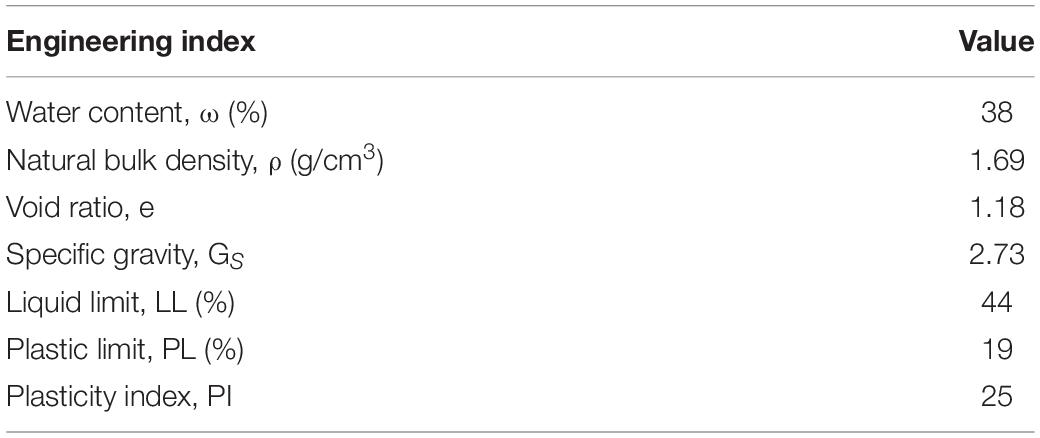
Table 1. Soil index properties of tested samples.
Apparatus for Freeze-Thaw Simulation
Figure 2 shows a schematic of the apparatus designed for simulating freeze-thaw in AGF. A brief description of the device is summarized here. More details can be found in Wang et al. (2017). This device consisted of a temperature-controlled environmental chamber, specimen tube, top and bottom plates, and a temperature and vertical displacement monitoring system. As the concern of this work was the buried utility pipes and surface structures, which are typically above the freeze pipes used in AGF, the cold plate was located at the bottom to promote a one-way freezing of the soil specimen from bottom to top. The test was carried out in a closed system, that is, with no external water supply and no drainage, to simulate freeze-thaw of clay soils within an undrained boundary, which is valid for the very low permeability of clay and the relatively short time required for freeze-thaw in AGF. The specimen tube of 79.8 mm inner diameter and 120 mm height was made of double-layer Plexiglas with a removable external insulation layer. Soil samples were carefully trimmed to make cylindrical soil specimens 100 mm high and 79.8 mm in diameter to fit with the specimen tube snugly.
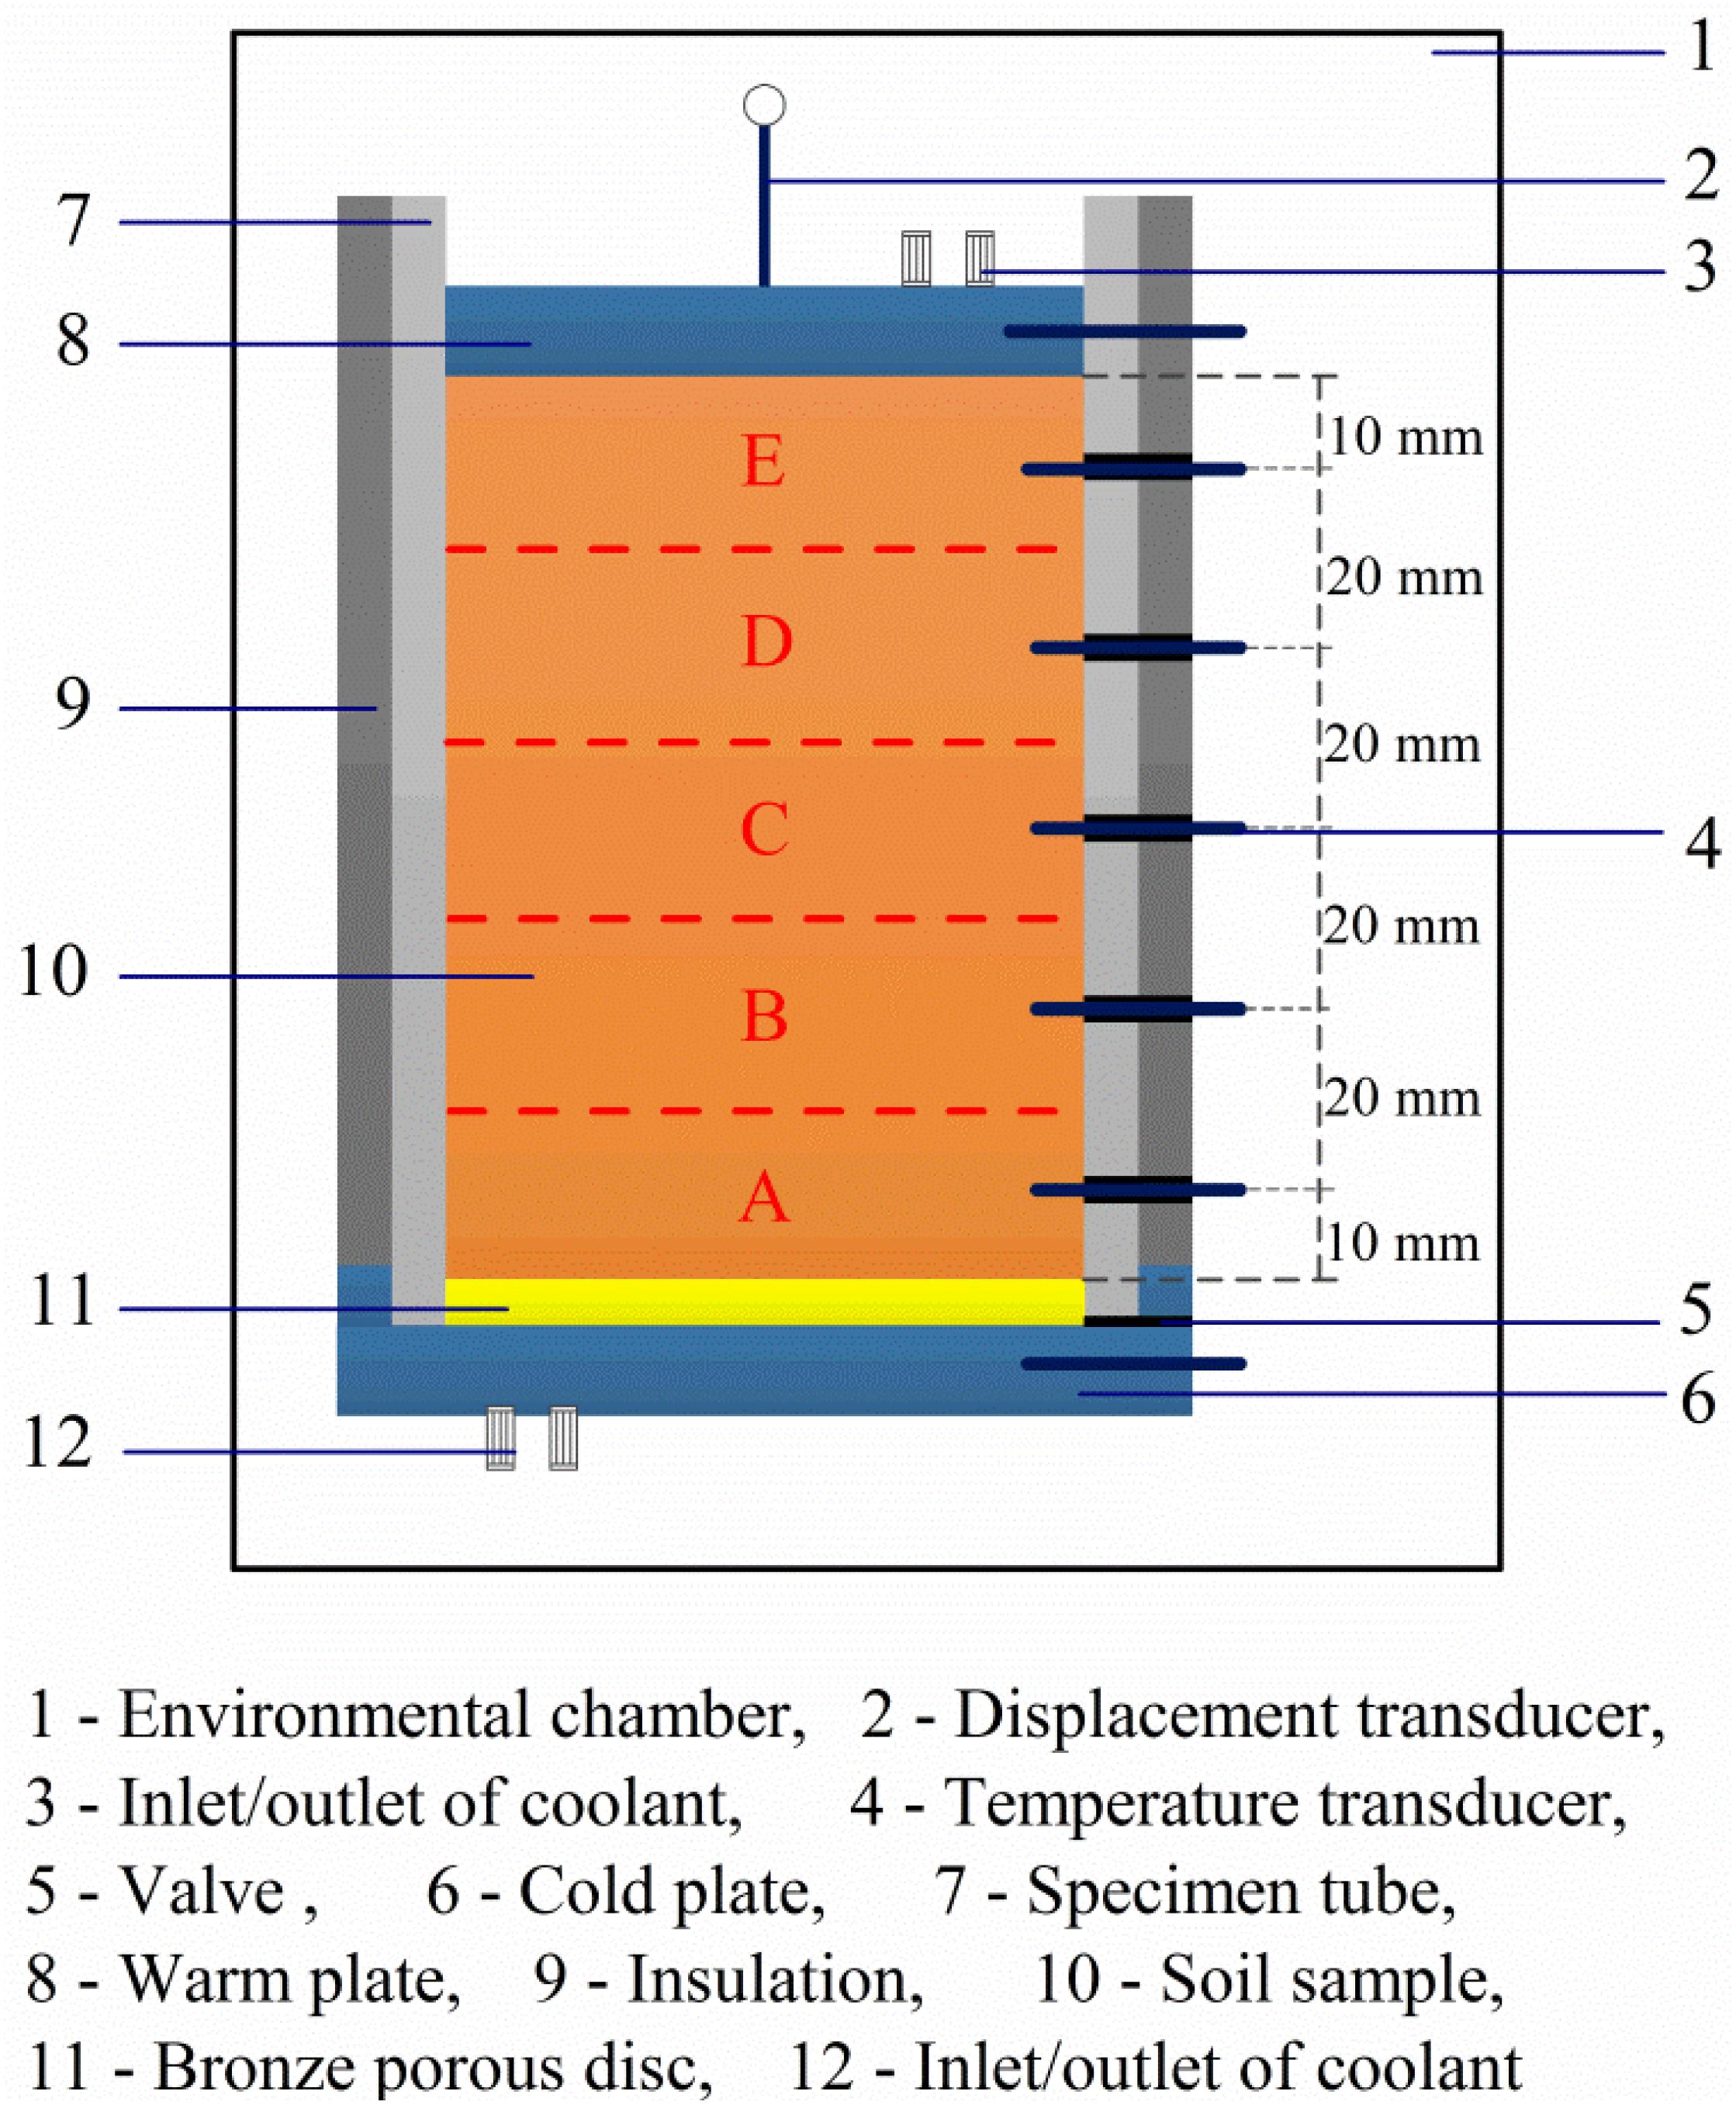
Figure 2. Schematic of the freeze-thaw experimental apparatus.
Freeze-thaw experiments were conducted under four scenarios with the cold plate set at freezing temperatures (referred to as Tf) of −5, −7, −10, or −15°C (referred to as Case I, II, III, or IV, respectively), and the warm plate at 1°C, resulting in temperature gradient of 0.6, 0.8, 1.1, and 1.6°C/cm, respectively. The temperature within the environmental chamber during testing was kept at 1°C. The thawing temperature was set at 20°C for all scenarios. No surcharge was applied to the top plate to allow the investigation of structural change due to moisture migration during AGF. The frost heave test is completed until the height change of the sample is less than 0.02 mm in 2 h. After the frost heave test, the upper and lower cold plate supply device were closed, and the temperature of the environment box was adjusted to 20°C to simulate the thawing of frozen soil in natural environment, the temperature and deformation were recorded in real time. Within 2 h, the height change value of the sample is less than 0.05 mm, and the test is completed. The components of the instrument are dismantled, the sample is taken out and the subsequent test is carried out.
Compression Test Methods for Freeze-Thaw Soil
A uniaxial compression test was conducted on the consolidation apparatus. As the soil samples in this study were taken from an underground depth of about 30 m, the load of the compression test was 1, 12.5, 25, 50, 100, 200, 400, and 800 kPa. The specific test process was as follows: (1) for the undisturbed clay before freeze-thaw, the soil samples were directly prepared for compression test. (2) For freeze-thaw clay, compression tests were conducted on samples taken from unloaded specimens after unidirectional freeze-thaw tests. To more directly study the change of compression characteristics along the freezing direction (height of the specimen) at different positions after freezing and thawing, test soil specimens after freeze-thaw were divided into three layers along the height. The compression tests were carried out separately, and the sampling position is shown in Figure 3.
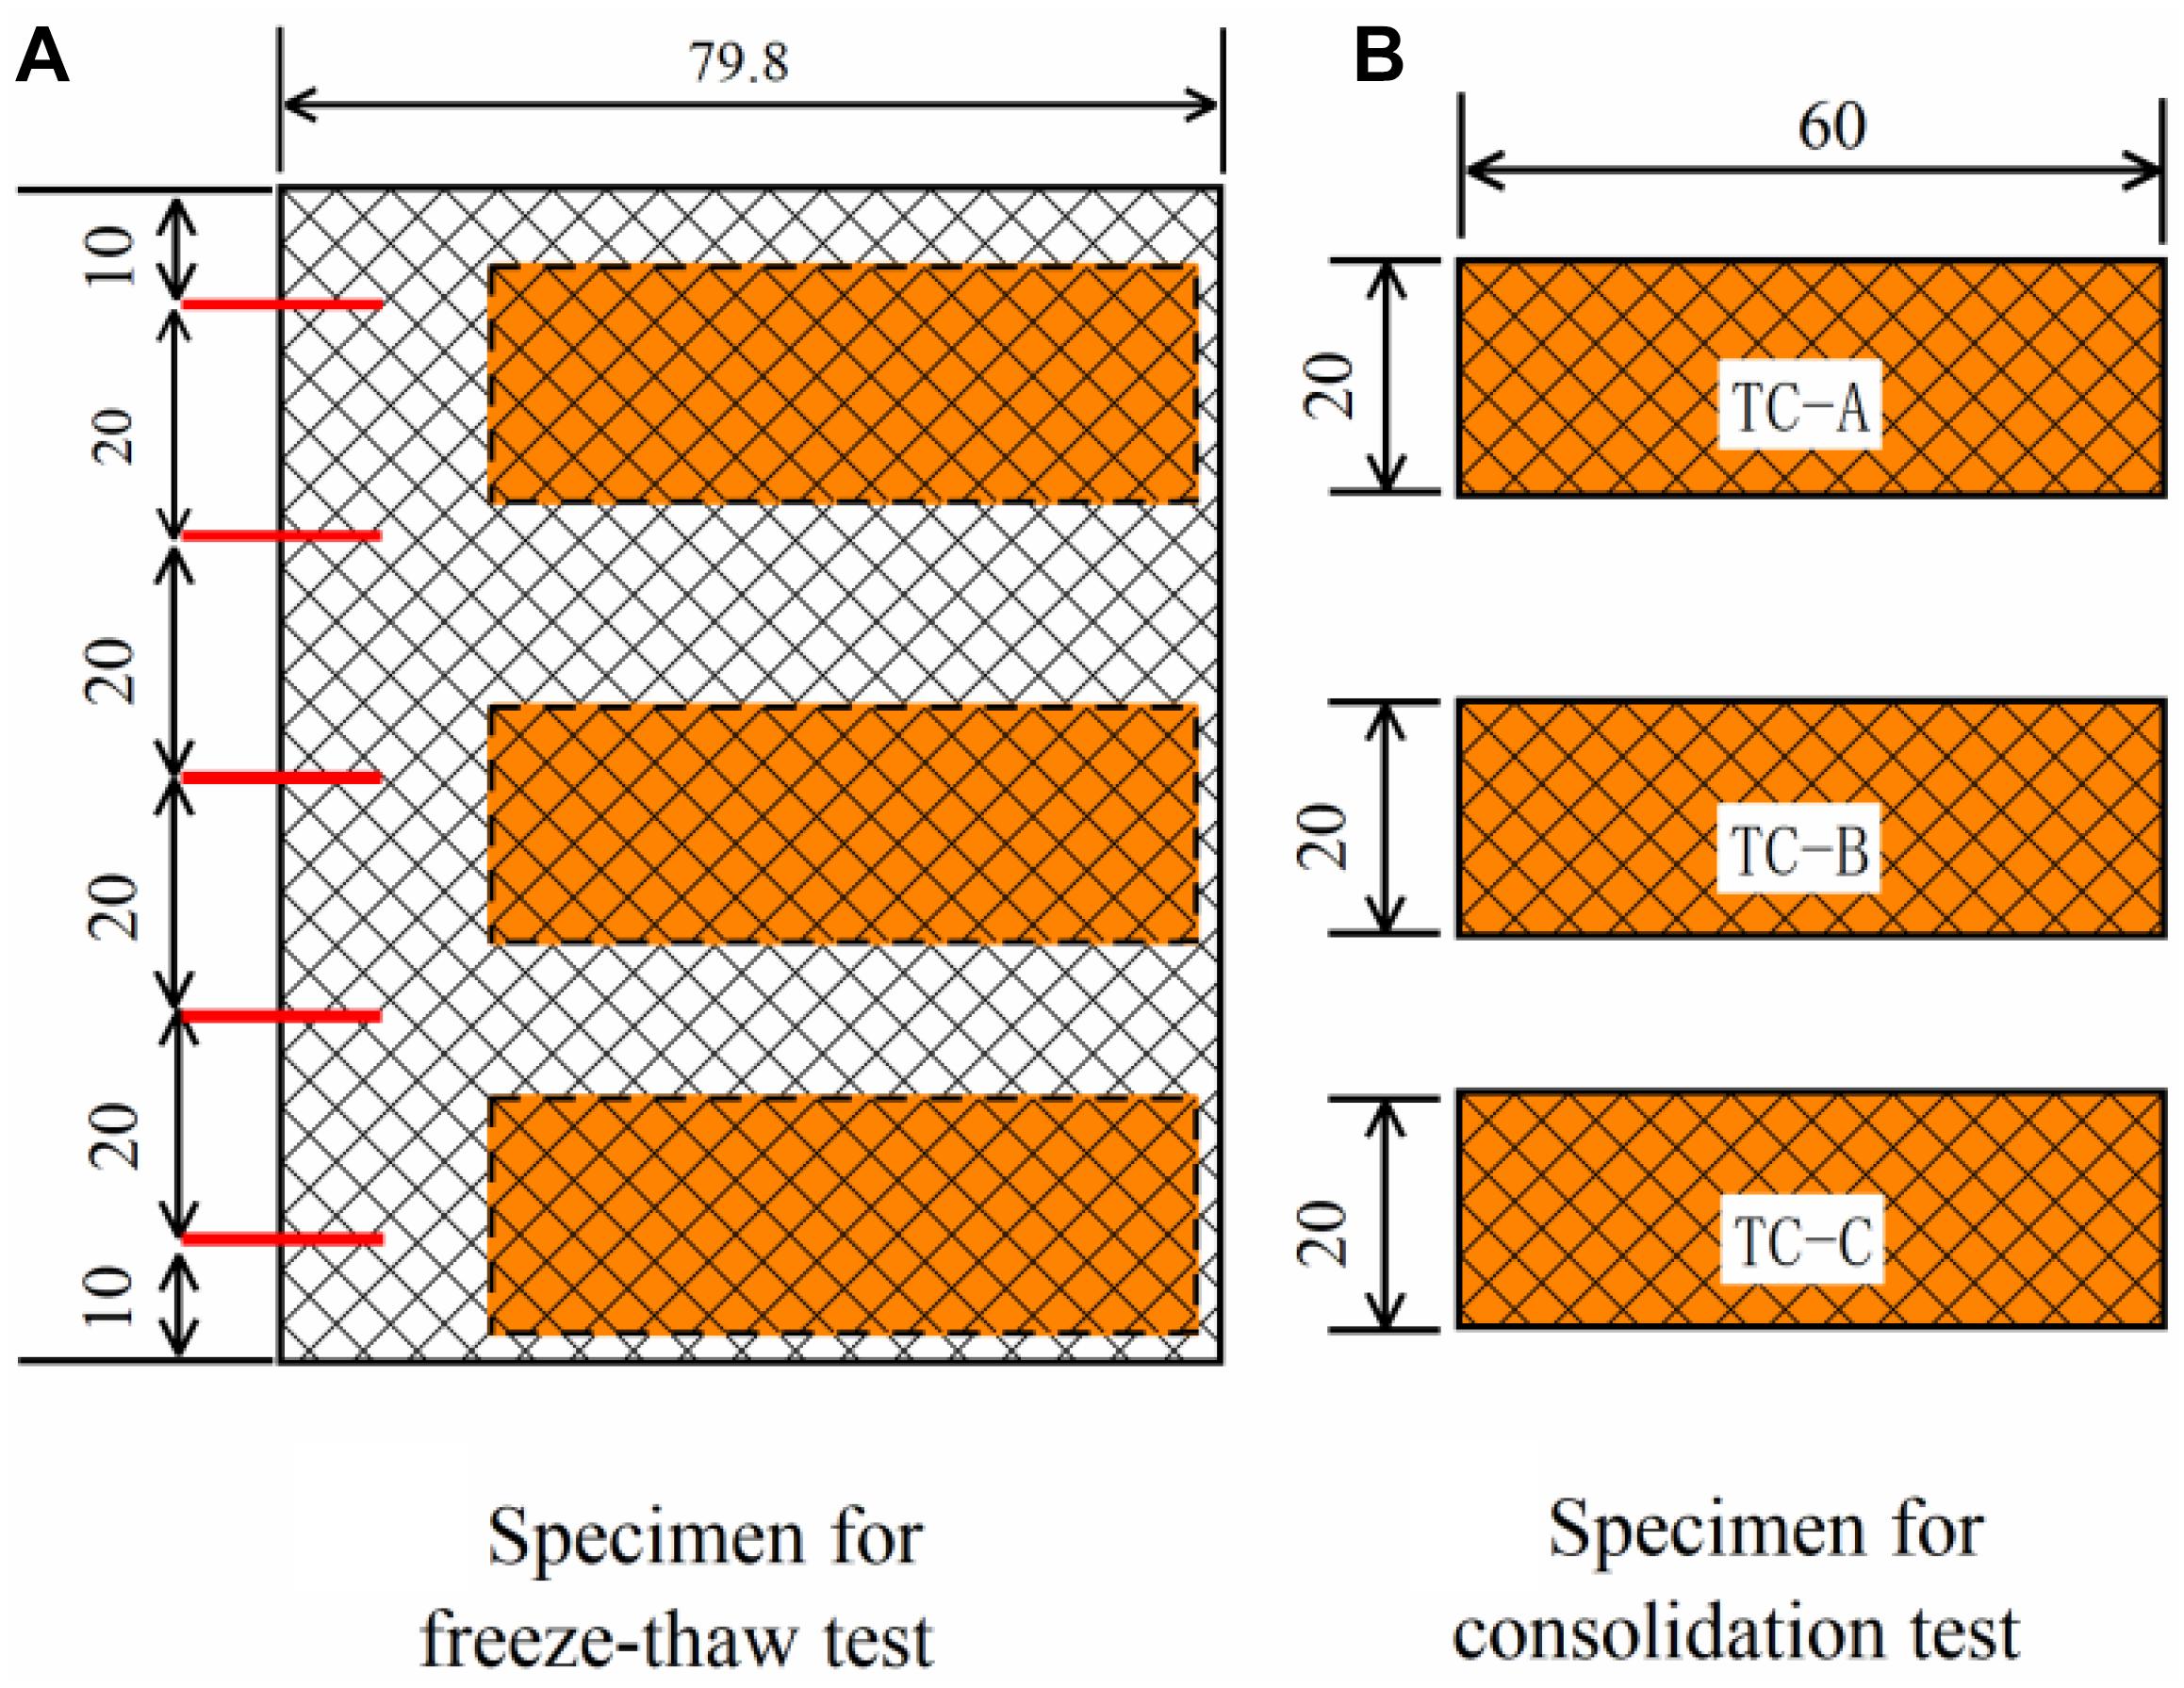
Figure 3. Samples were taken along the specimen height for the consolidation test (units: mm). (A) Specimen for freeze-thaw test. (B) Specimen for Consolidation test.
As the difference of temperature field along the specimen height during the freezing-thawing process, the development of a frozen front occurred, along with the redistribution of moisture field after freeze-thaw. The compression characteristics of specimens would be very different along the height of different freezing temperatures. Compression tests for specimens after freeze-thaw at four different cold-end temperatures were conducted according to the compression test procedure mentioned above. Care was taken to avoid disturbing the soil sample when making the specimen for the compression test with freeze-thaw soil. When cutting the compression sample from the soil column of the freeze-thaw sample, the insertion position of the temperature sensor should be avoided as much as possible, and the sample should be taken as close as possible to the center of the sample.
Mercury Intrusion Porosimetry Tests
Mercury intrusion porosimetry has been routinely used to evaluate the pore-size distribution of powdered and bulk materials with open and interconnected pore structures (Nowamooz and Masrouri, 2012; Zhang et al., 2012). An assumption was made that cylindrical flow channels with a radius r exist in the soil, and the radius of the pores are intruded by mercury under an applied pressure, p. For a cylindrical pore, the Washburn Equation can be used to calculate the pore radius (Washburn, 1921):
where, p is the applied external pressure (psia), σ is the surface tension coefficient of mercury (N/m), taken as 0.484 N/m at normal temperature, α is the infiltration angle of mercury to soil, taken as 130°, r is the radius of cylindrical pore (m).
The mercury intrusion-extrusion testing was performed using an AutoPore 9500 V1.09 MIP device with a maximum intrusion pressure of 60000 PSI (413.7 MPa), corresponding to the measurement of pore sizes as small as 10–2 μm. In all the intrusion testing, a solid sample pentameter with a volume of 1 cm3 and triple-distilled mercury with a surface tension of 0.48 N/m and a contact angle of 141° (at 25°C) were used. The freeze-drying technique was used to dehydrate the saturated soil samples for MIP tests. More details of the MIP tests can be found in the provided references (Penumadu and Dean, 2000; Li and Zhang, 2009).
An introduction to the methods and procedures for the measurement of pore size distribution will be presented here in detail: The mercury intrusion-extrusion tests in this paper mainly include two aspects: (1) samples were taken from different heights (five layers) of the specimen after freeze-thaw at four cold-end temperature conditions (−5, −7, −10, and 15°C, expressed as case I, II, III, and IV). (2) The mercury intrusion-extrusion tests were carried out on soil samples before and after compression tests, respectively. Herein, compression tests were carried out on frozen-thawed specimens at three different heights along the height direction and were also carried out on undisturbed soil without freezing-thawing. Mercury intrusion tests were carried out on four types of soil samples before and after freeze-thaw and compression under four different cold-end temperatures. Detailed mercury intrusion-extrusion test grouping is shown in Table 2. For the four types of soil, a total of 32 MIP tests has been conducted.
Table 2. Mercury intrusion test scenarios and test plan.
As the size of sample for MIP is relatively small in volume, which was about 1 cm3. In this paper, the statistics of micro pore change data is based on mathematical statistics, for the soil samples, it is considered that the undisturbed soil in natural is random and uniform. During the mercury injection test, the test conditions and environmental conditions shall be strictly controlled to ensure the repeatability of the test. For this, the following assumptions are needed to consider: (i) The surface tension of mercury and contact angle with solid material are constant during the analysis. (ii) The intrusion pressure must be equilibrium. (iii) Pores are considered as being of cylindrical shape. And (iv) Solids are not subject to deformation under the effect of pressure.
Compression Characteristics of Soft Clay Before and After Freeze-Thaw
Compression Test Results
During the step-by-step compression test, with the increase of loading, the void ratio of the soil sample decreases and the compactness increases, which makes it more and more difficult to be compacted. In this study, the e-lg p curves of samples before and after freeze-thaw under the four frozen conditions are shown in Figure 4. It can be seen from the figure that the compressive properties of soil samples at different positions along the height of the specimen under four cold-end temperatures showed great differences. For undisturbed soft clay, the distribution of e-lg p curves of four groups of compression tests was basically the same, indicating that the soil used for testing was uniform. The initial void ratio (e0) of natural soft clay was 1.18, and after loading step by step to 800 kPa the void ratio changed to 0.75. Compared with the initial void ratio, it was reduced by 36%. This indicated that the compression capacity of intact soft clay is relatively high.
Figure 4. Soil e-lg p curve before and after freeze-thaw: (A) case I, (B) case II, (C) case III, and (D) case IV.
1It can also be seen from Figure 4 that the variation of the porosity ratio of frozen-thawed soil sample is slightly smaller than that of the natural soil. As the cold-end temperature was −5°C, the variation of porosity of the topsoil sample was the smallest. It was concluded that freezing-thawing make the compressibility of soft clay change in varying degrees, which were closely related to the freezing cold-end temperature and the distance from the cold end.
Variation of Compression Index
The compression index (Cc) of each test sample can be calculated according to the compression curve, that is, the e-lgp curve shown in Figure 4 tended to be a straight line in the pressure range from 100 to 800 kPa, and Cc can be calculated using the slope of line. Figure 5 shows the compression index distribution of soil samples along the height of specimens after freeze-thaw. The Cc of undisturbed soil was 0.33, and it increased or decreased along the different height positions of freeze-thaw specimens under the four cold end temperatures, indicating that the change of Cc for frozen-thawed soil was closely related to the cold-end temperature and the distance from the cold end during freezing.
Figure 5. Compression index Cc distribution before and after freeze-thaw.
Moisture Redistribution and Soil Structural Change
The water content, void ratio, and dry density of the soil specimen were measured by sampling layers A, B, C, D, and E (refer to Figure 2), and the changes compared with their respective values before freeze-thaw are presented in Figure 6 for the four cases. More details can be found in Wang et al. (2017), Wang S. et al. (2018). The negative pore-water pressure or suction existing in the freezing fringe is anticipated to induce significant moisture migration and redistribution under the unidirectional freeze-thaw experiments in a closed system, and can render an originally uniform soil into a nonuniform soil. The water content, void ratio and dry density of the soil specimen were measured by sampling layers A, B, C, D and E (refer to Figure 3), and the changes compared with their respective values before freeze-thaw are presented in Figure 9 for the four cases. Note that the dry density and void ratio were obtained at three layers (i.e., A, C and E) due to the test procedure requirement of sample height. It is clear from Figure 9A that the moisture content of the upper portion of the soil specimen decreased, and that of the lower portion increased after freeze-thaw for all four cases. The maximum decrement clearly occurred at the layer closest to the warm end and varied from 2% for Case IV (-15 °C) to 7% for Case I (-5 °C). The maximum increment occurred at varying depths, and ranged from 1 to 2% in a much larger lower portion of the soil specimen for different freezing temperatures. The moisture data indicates a consistent moisture migration from the warm end to the cold end.
Figure 6. Moisture content, void ratio, and dry density variation along the specimen height after freeze-thaw experiments under four freezing temperatures.
Soil Micro-Pore Structure Changes
Results of MIP Tests
As shown in Figure 7, the MIP test results of undisturbed soil samples (denoted as U11, according to Table 2) included a mercury intrusion and extrusion curve, and the results of other experimental groups showed the same trend in curve, with the difference being only in the value of the mercury intrusion volume. By analyzing the mercury curve of intrusion and extrusion, it can be learned that the intrusion and extrusion curves do not coincide within a certain pressure range, indicating that some mercury remains permanently in soil pores (Li and Zhang, 2009; Beckett and Augarde, 2013). This hysteresis is often explained using the well-known “ink-bottle” theory. Pores shaped like ink bottles (a narrow neck that opens to a large bulb) cause this hysteresis effect (Penumadu and Dean, 2000; Moro and Bohni, 2002).
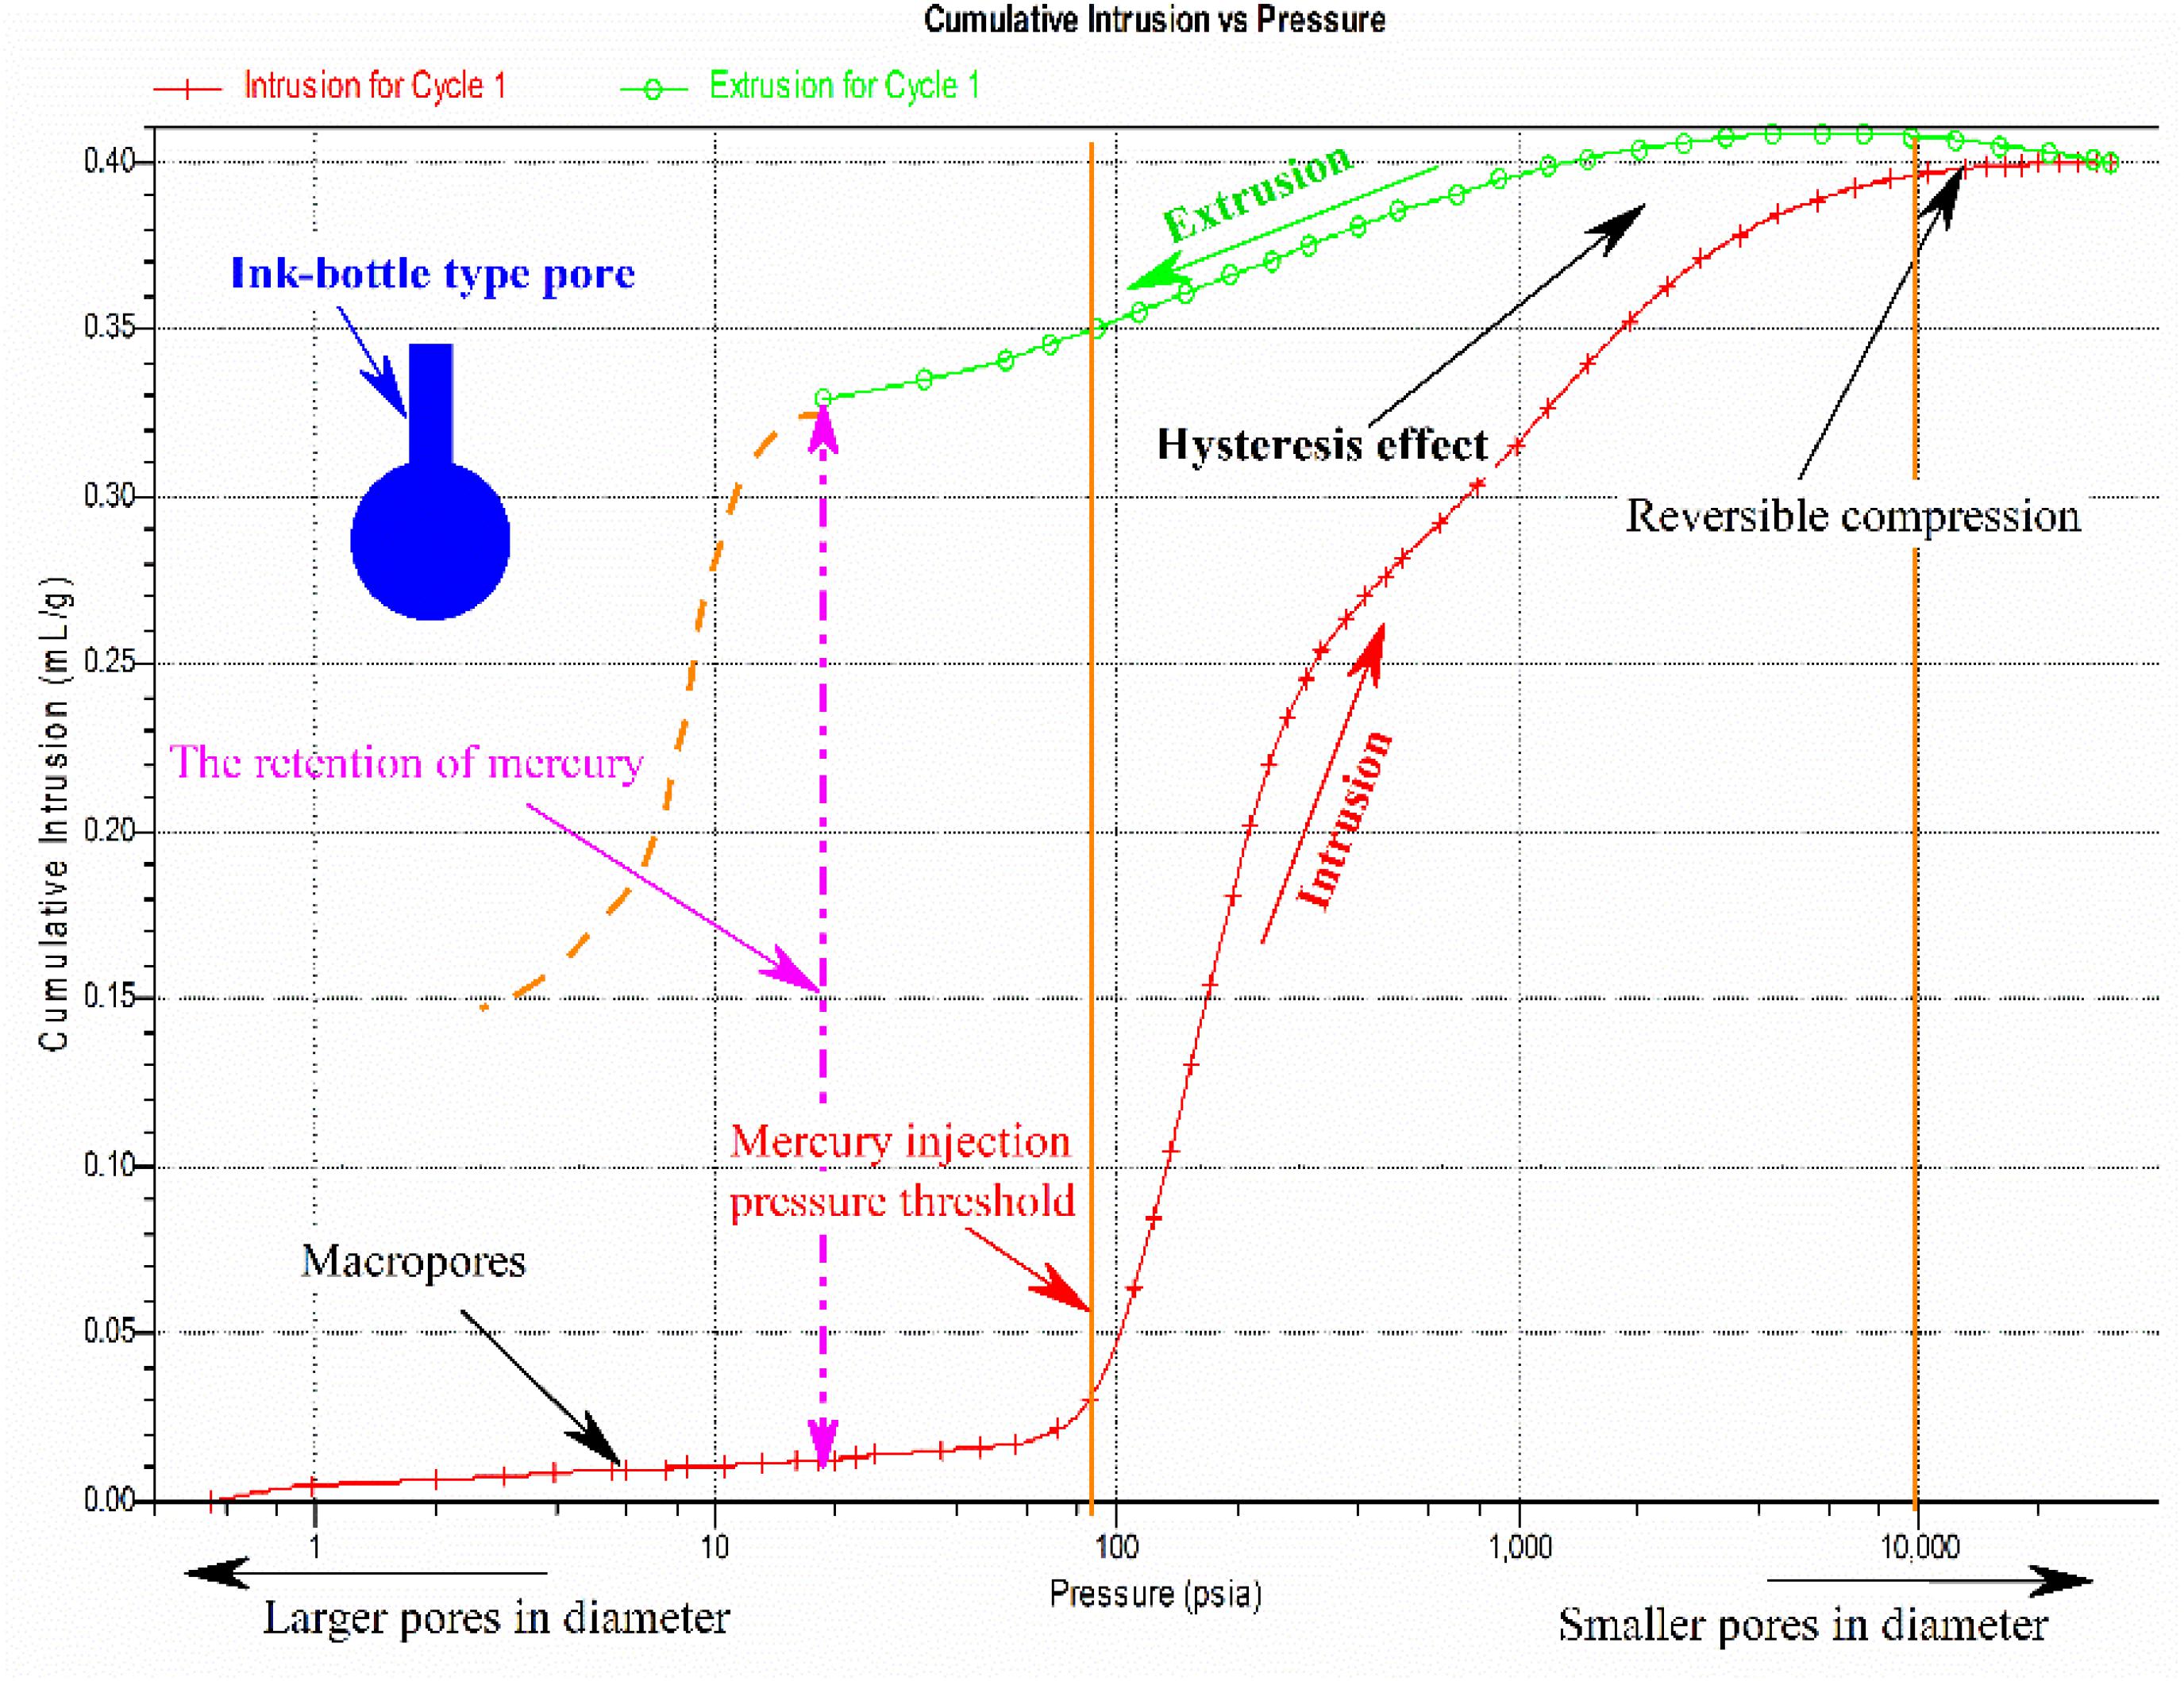
Figure 7. Overall observation of the mercury intrusion curve.
In this paper, the maximum mercury intrusion pressure was 30000 psi. For the mercury intrusion stage, when the mercury intrusion pressure is relatively low, the volume of mercury intrusion increased slowly, and the intrusion curve was smooth. In the process of mercury intrusion, as the intrusion pressure reached a threshold, which was about 80 psi as shown in Figure 7, with the increase of pressure, the cumulative mercury volume increased rapidly. The mercury intrusion pressure was greater than 10000 psi until 30000 psi; although the pressure continued to increase at this stage, the cumulative mercury volume growth tended to be gentle. During the whole process of mercury intrusion, the relationship between the mercury intrusion pressure and the cumulative mercury volume shown in the curve reflected the filling process of pores with different pore size of mercury. By analyzing the mercury intrusion and extrusion curves, many quantitative parameters of pores — total pore volume and area, median pore diameter for volume and area, an average pore diameter, porosity, and fractal dimensions, for example — can be converted. Also, many scholars have studied the characteristics of soil using the MIP method (Penumadu and Dean, 2000; Ninjgarav et al., 2007; Romero and Simms, 2009; Hao et al., 2013; Sasanian and Newson, 2013; Tang and Yan, 2015).
In order to quantitatively study the micro-pore change of clay after freeze-thaw and compression, three characteristic parameters — (1) total pore volume, (2) median pore diameter for volume, and (3) average pore diameter — are used to describe the pore volume change and pore size distribution, with analysis as follows:
Total Pore Volumes
The total pore volume is the total volume of pores measured by MIP at unit mass in units of mL/g. According to the relationship between the pore size and the cumulative intrusion (Formula 1), the pore volume distribution function can be obtained as follows:
where V is the volume of mercury, that is, the total pore volume, and r is the pore size.
Then, according to the pore volume distribution function, the total mercury volume, namely the total pore volume, can be calculated by the integral as follows:
Figure 8 shows the total volume of samples after freeze-thaw and compression of the four cases, with a total of 32 MIP tests. Under the four cases, the total pore volume of the undisturbed soil sample after compression was significantly lower than that of the undisturbed soil, indicating that pores of clay were compressed, and some pores were annihilated by compressing. The pore volume of frozen-thawed samples at different locations along the freeze-thaw specimen height for the four cases was obviously different. The general rule under various conditions was that, (1) there were different changes along the height of the specimen after freeze-thaw, and the difference was related to the cold-end temperature and the distance to the cold end, (2) the change of total pore volume after compression was greater than that after freeze-thaw, and (3) the total pore volume changed the most for the compression samples after freeze-thaw, and the difference was also related to the cold-end temperature and the distance to the cold end.
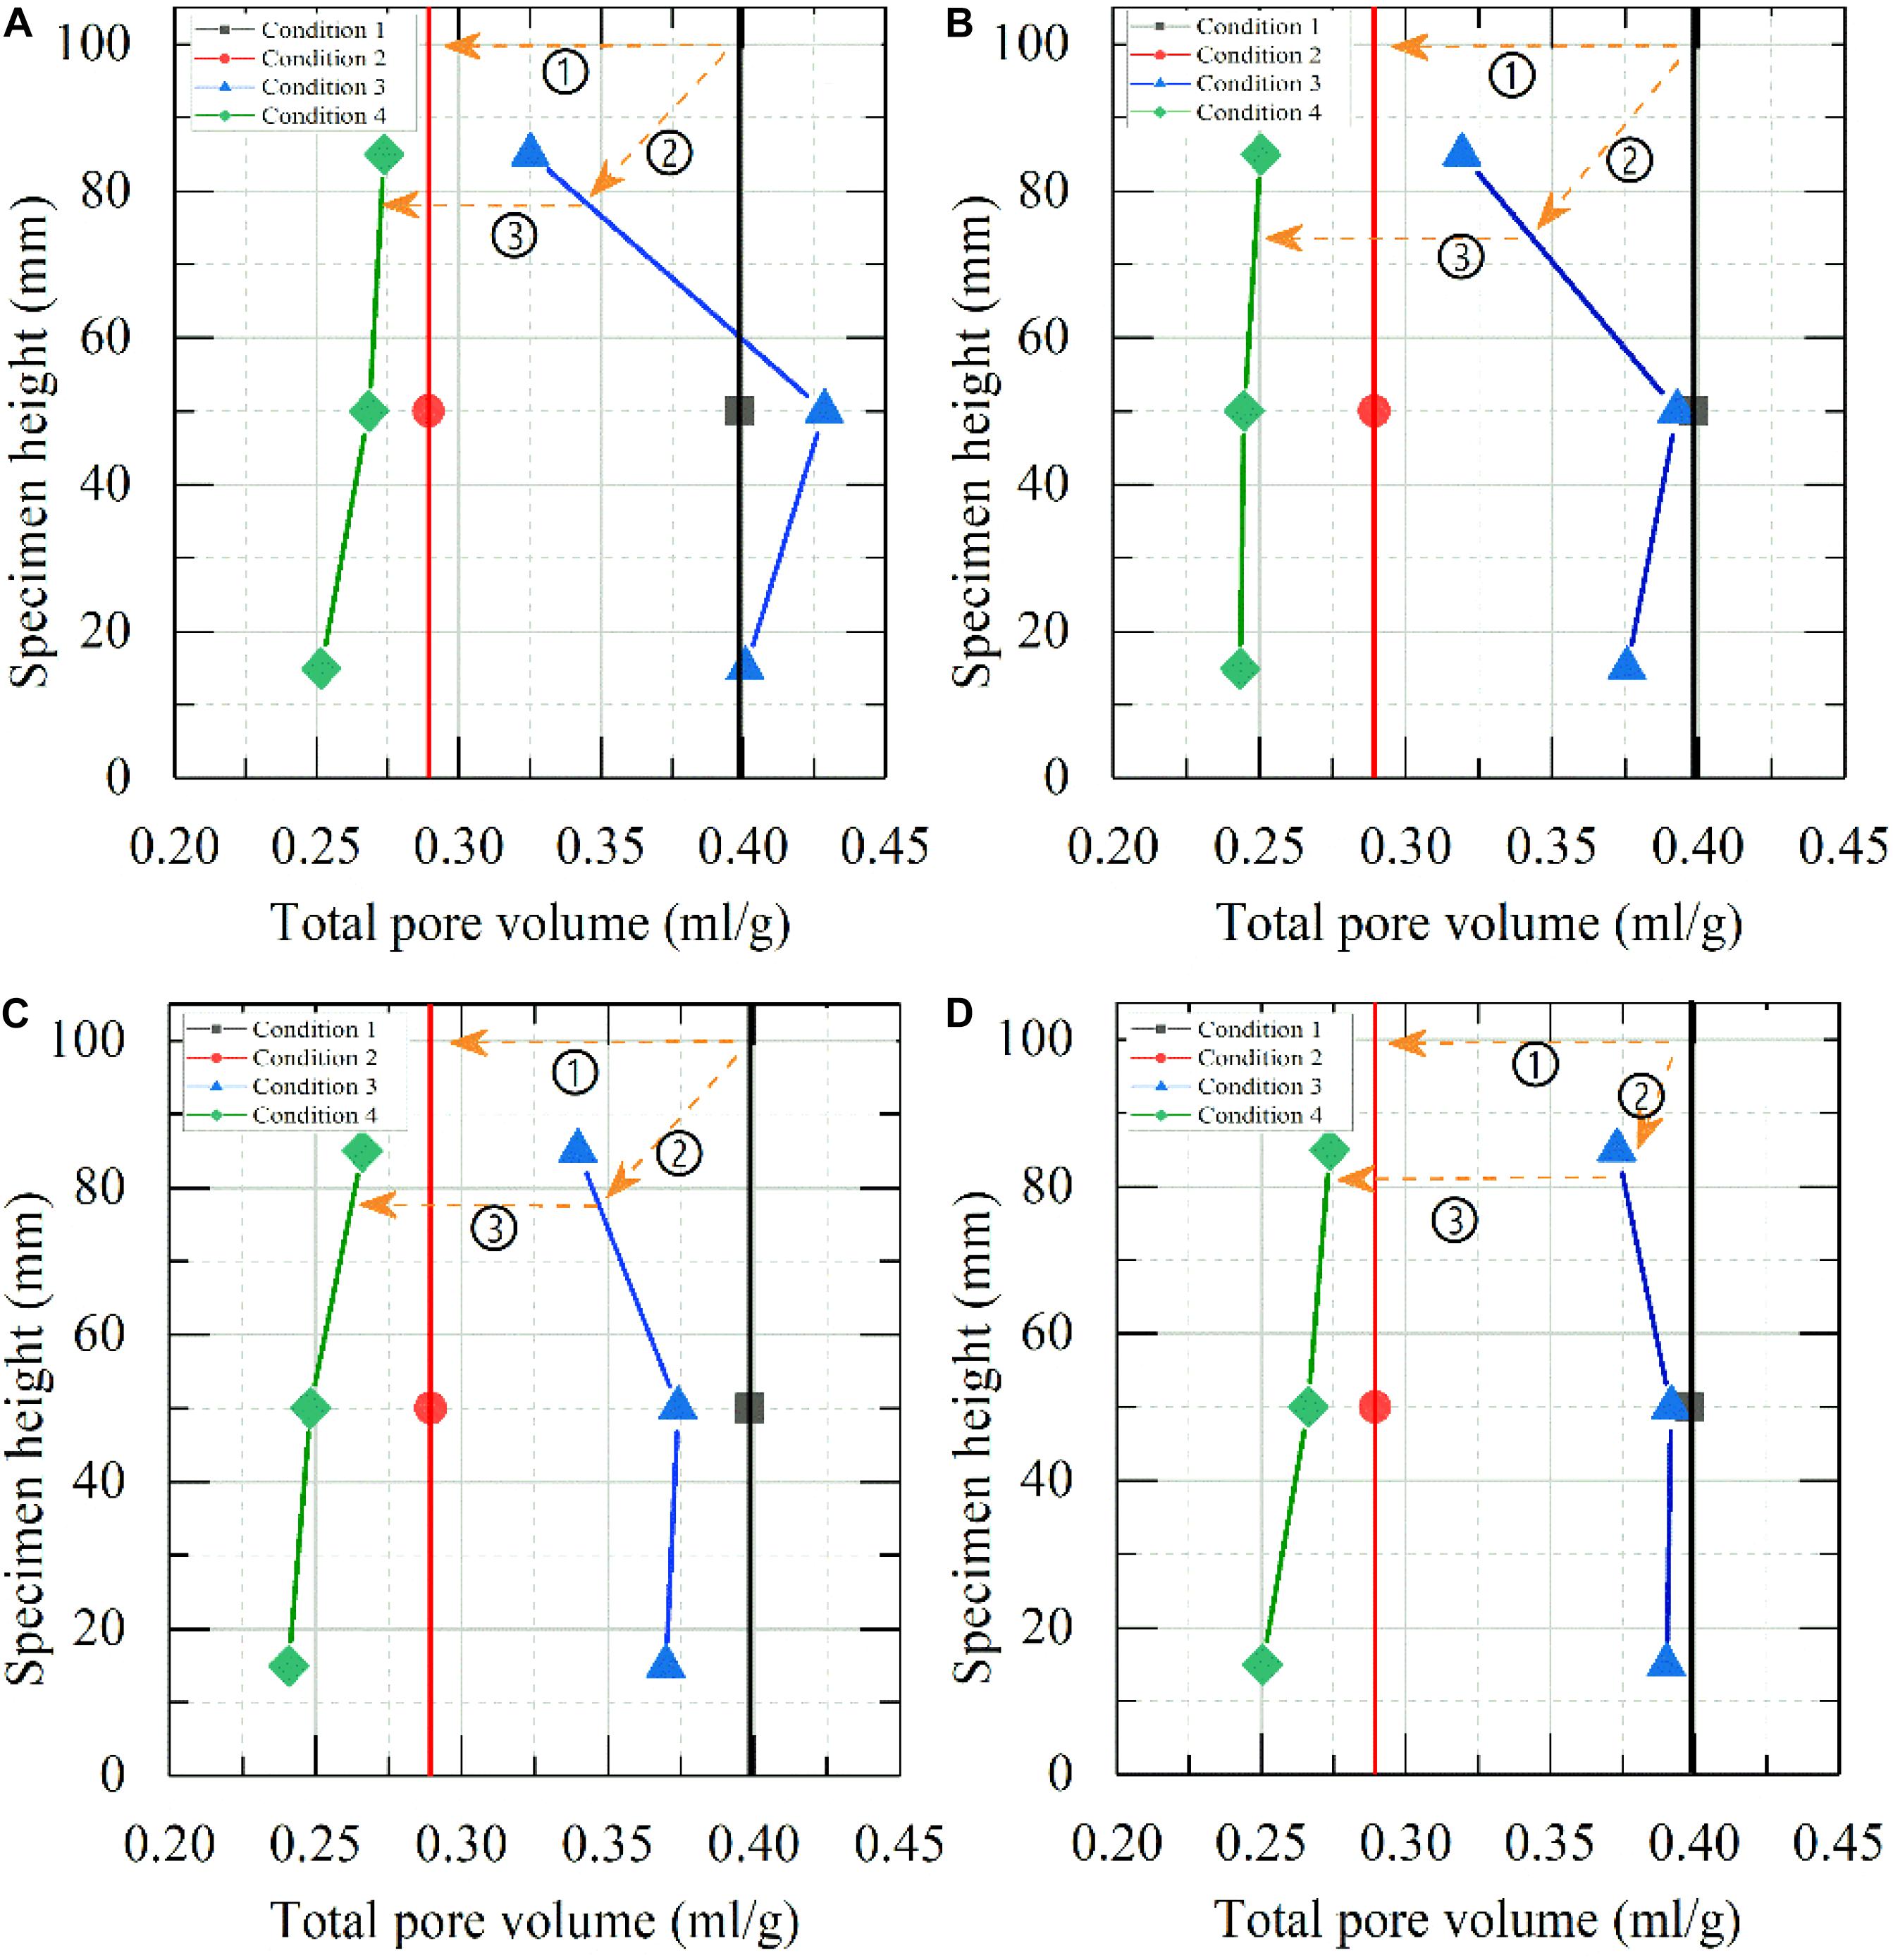
Figure 8. Variation of total pore volume for soil samples with condition: (A) undisturbed, (B) after compressing, (C) after freezing-thawing, (D) after freezing-thawing and compressing. ➀ Consolidation test, ➁ freeze-thaw test, and ➂ consolidation test.
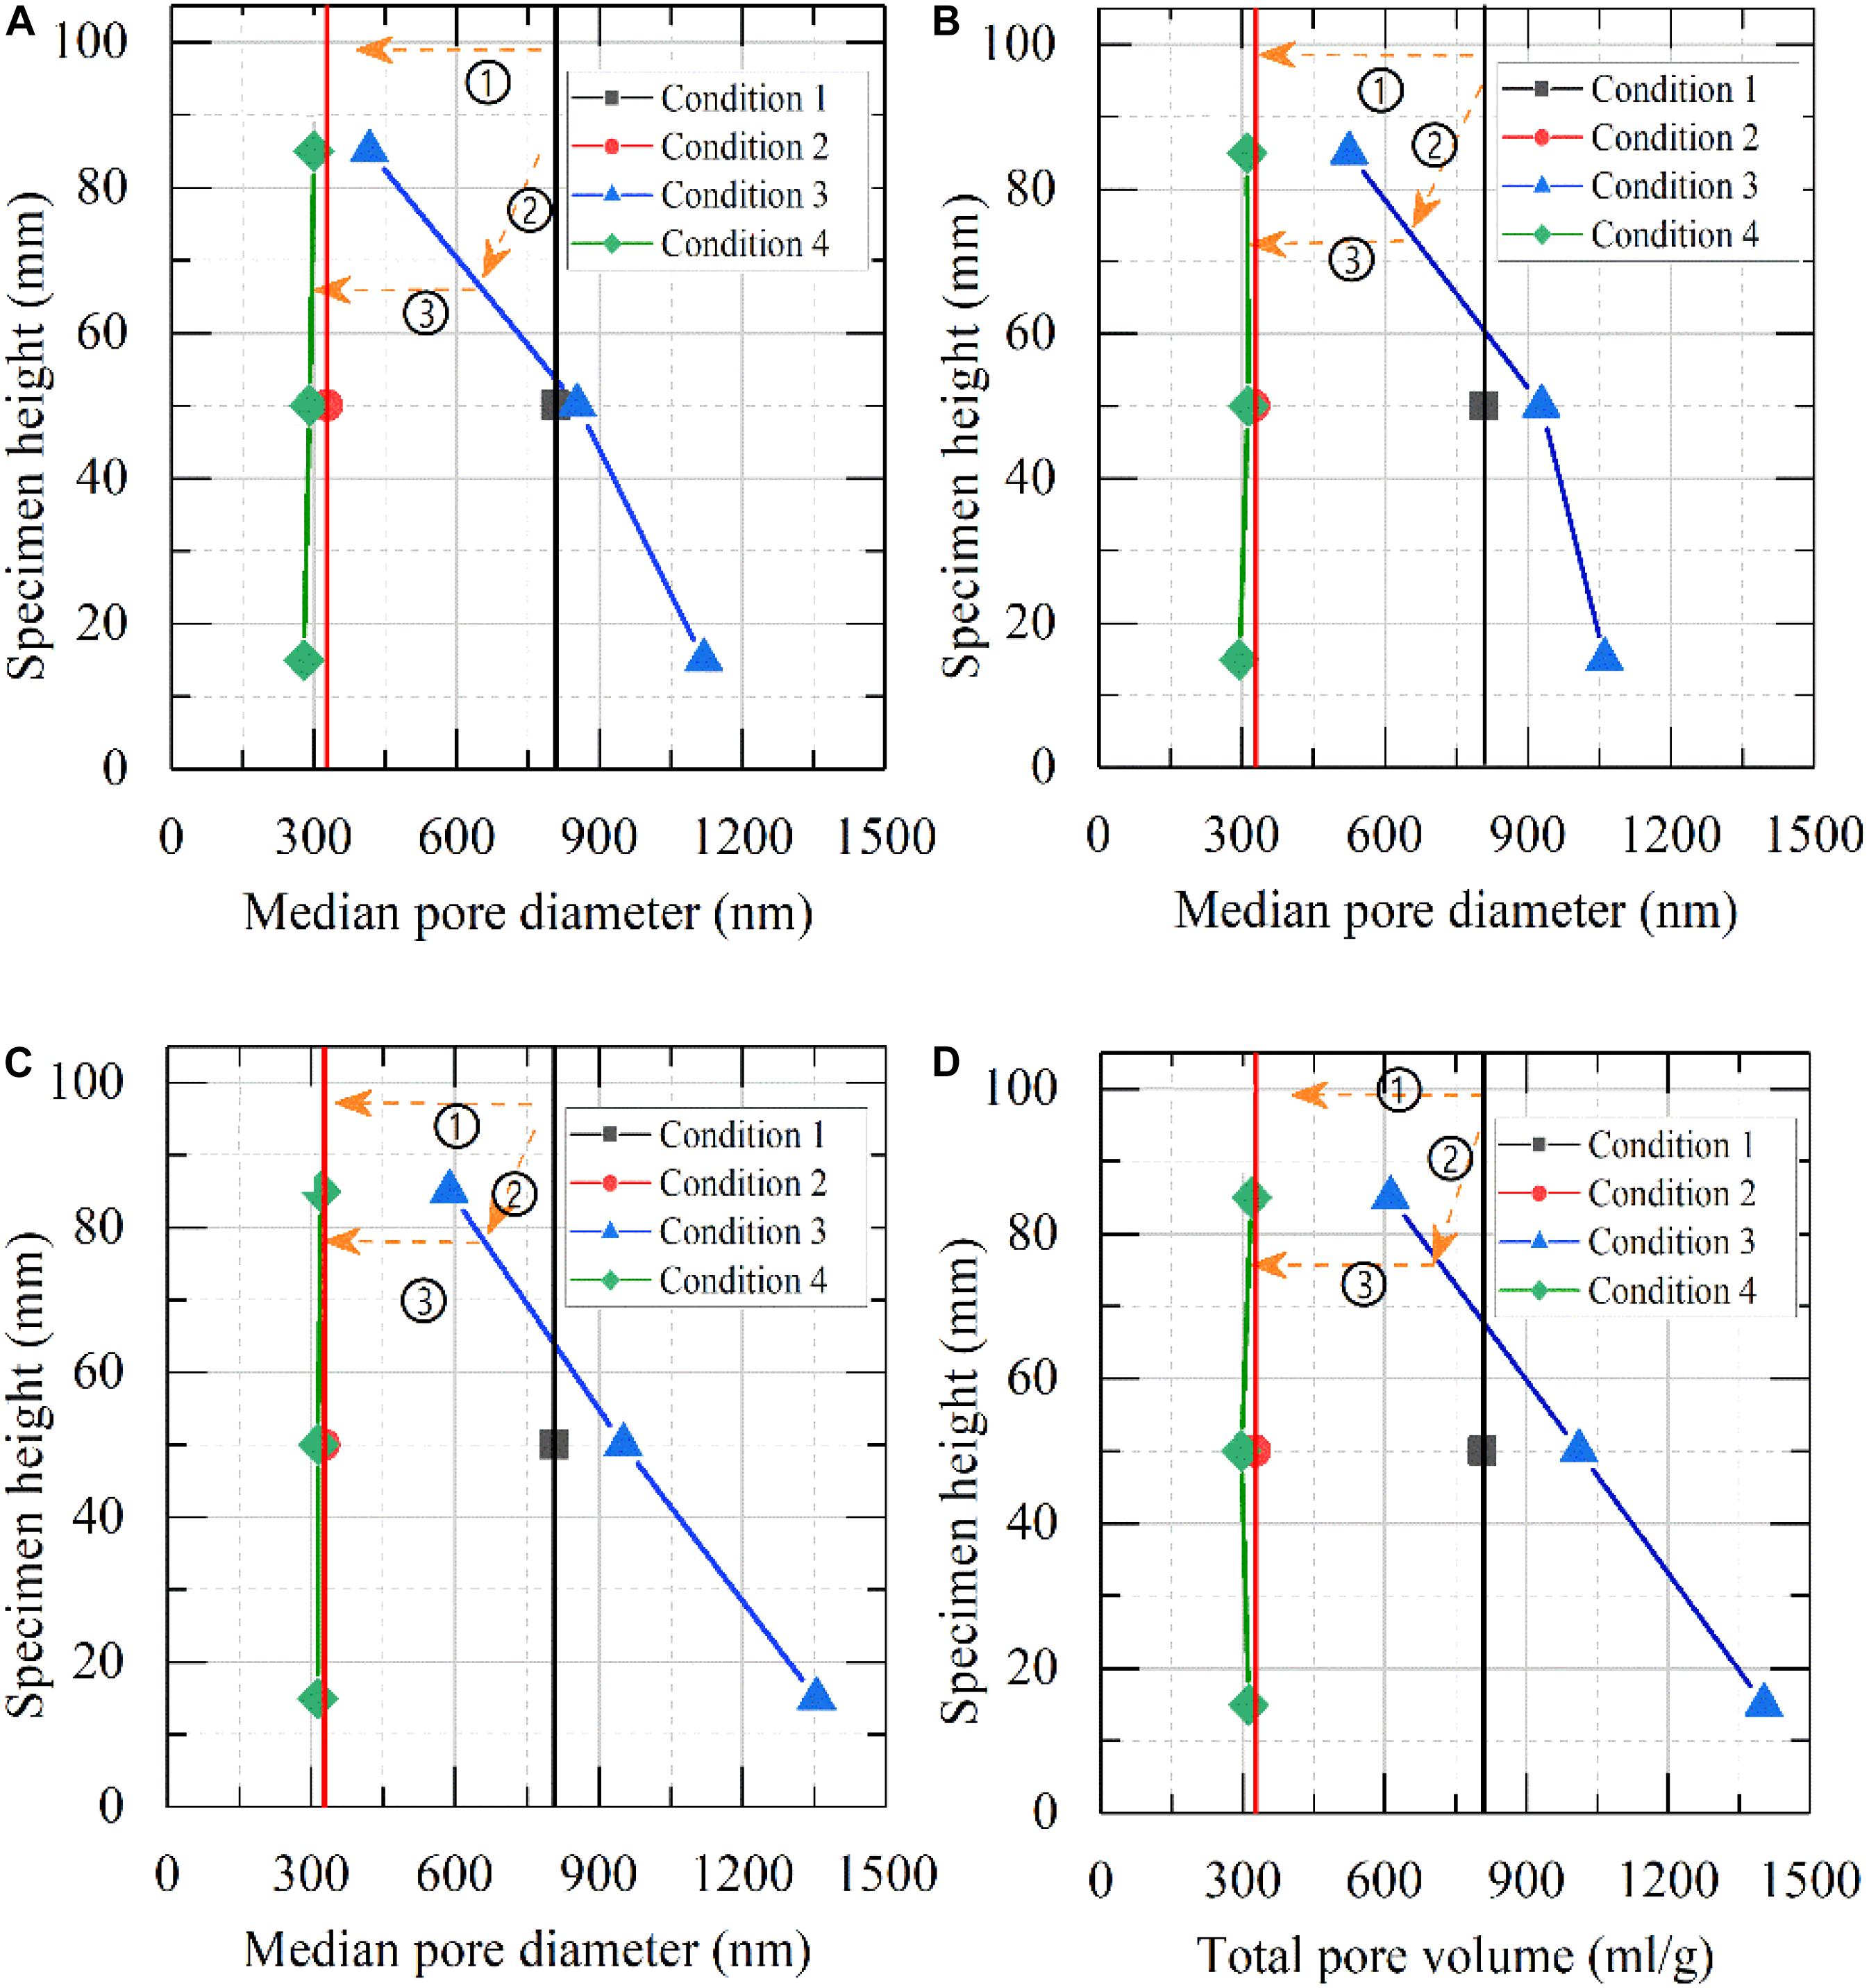
Figure 9. Variation of median pore size for soil samples with condition: (A) undisturbed, (B) after compressing, (C) after freezing-thawing, (D) after freezing-thawing and compressing. ➀ Consolidation test, ➁ freeze-thaw test, and ➂ consolidation test.
As mentioned before, in the previous studies related to this paper (Wang et al., 2017; Wang S. et al., 2018), freezing necking phenomenon of clay occurred near the warm end of the specimen under different freezing temperature. During the freezing process, the water in the upper portion of the specimen migrated downward under the temperature gradient and resulted in the soil being consolidated under negative pressure from the freezing front movement and moisture migration. This process can be explained from the view of soil micro-pores undergoing pore shrinkage, or the transformation of larger pores to micro-pore or the annihilation of micro-pore occurring. It also verified the existence of freezing-necking from the perspective of microscopic pore change. For the case I shown in Figure 8A, the total pore volume in the middle position of the specimen increased after freeze-thaw, which coincided with the law of moisture redistribution after freeze-thaw. The difference of total pore volume variation under differentials can be explained as follows. With the freezing front moving during the freezing process, the moisture migration and ice lens formation will always exist, the structure of undisturbed soil samples was disturbed, and complicated processes such as the expansion of original pore by phase transformation of water and ice, connection of part of pore and transformation between small and smaller pore appeared. Moreover, it was noteworthy that the pores of soft clay were easier to be compressed and the sensitivity of soil was increased after freeze-thaw samples were subjected to external forces.
Median Pore Sizes
The median pore diameter, also known as the most probable pore size, is the place where the pore distribution corresponding to a certain pore size is the most concentrated, and the pore size corresponding to the highest peak of the pore distribution and the pore occurrence probability is the largest. In this study, the calculation of the median pore diameter was based on the volume of pores.
The variation of median pore size of each sample after freeze-thaw and compression of the four cases is shown in Figure 9. It was obvious that the median pore size of samples after freeze-thaw varied greatly with the frozen cold-end temperature and the distance from the cold end. Different from the total pore volume change shown in Figure 8, the median pore size after compressing, freezing-thawing, and compressing is smaller than that of undisturbed soil samples, and the effect of freeze-thaw on the median pore size changing is relatively less. Compared with the undisturbed soil sample, the median pore size of freeze-thaw samples changed regularly along the height of specimens for the four cases. For case I shown in Figure 9A, after freezing-thawing, the median pore size of the upper part of the specimen decreased by about 50%, and the lower part of the specimen increased by 1.4 times as much as the undisturbed soil, while the middle part increased slightly but changed only slightly. For the other three cases, the curve moves to the right as the cold end temperature is lower, that is, the median pore size decreased smaller at the upper and increased lager at the lower of the specimen with the cold-end temperature lower. It also reflects that the distribution trend of pore volume after freeze-thaw and compression is pore size transformation. For the upper part of the freeze-thaw specimens and the compressed soil sample, the macrospores are transformed into small pores. Meanwhile, the large pores in the soil near the bottom of the specimen increase, and the pore space of the soil itself is connected or expanded.
Average Pore Sizes
The average pore size is equal to the corresponding pore volume and the corresponding specific surface. The result is obtained from the simplified cylindrical pore. The mean pore diameter can be calculated as follows:
where k is the coefficient related to the shape of the selected pore model. In this paper, the MIP test assumes that if the pore is cylindrical, then k is 4, and if it is a plane plate model, then k is 2. Furthermore, V is the total pore volume and S is the total pore surface area, which is the sum of the equivalent surface areas of all pores under the unit mass of the test sample.
Results presented in Figure 10 are the average pore size distribution of all the 32 MIP testing samples, which were similar to the variation of total pore volume and median pore size. The average pore size of the soil sample after compression decreased by 20%, and that after freeze-thaw and compression decreased by about 40%. After freeze-thaw, the average pore size of the specimen increased or decreased along the specimen height, the difference of cold-end temperature, and the distance from the cold end. The maximum change was still case I, shown in Figure 10A; the average pore size of the upper part of the freeze-thaw specimen decreased 14%, while that of the lower part increased by about 17%. For case IV shown in Figure 10D, the average pore size of the upper part of the specimen remained unchanged, while that of the lower part increased slightly, with little change.
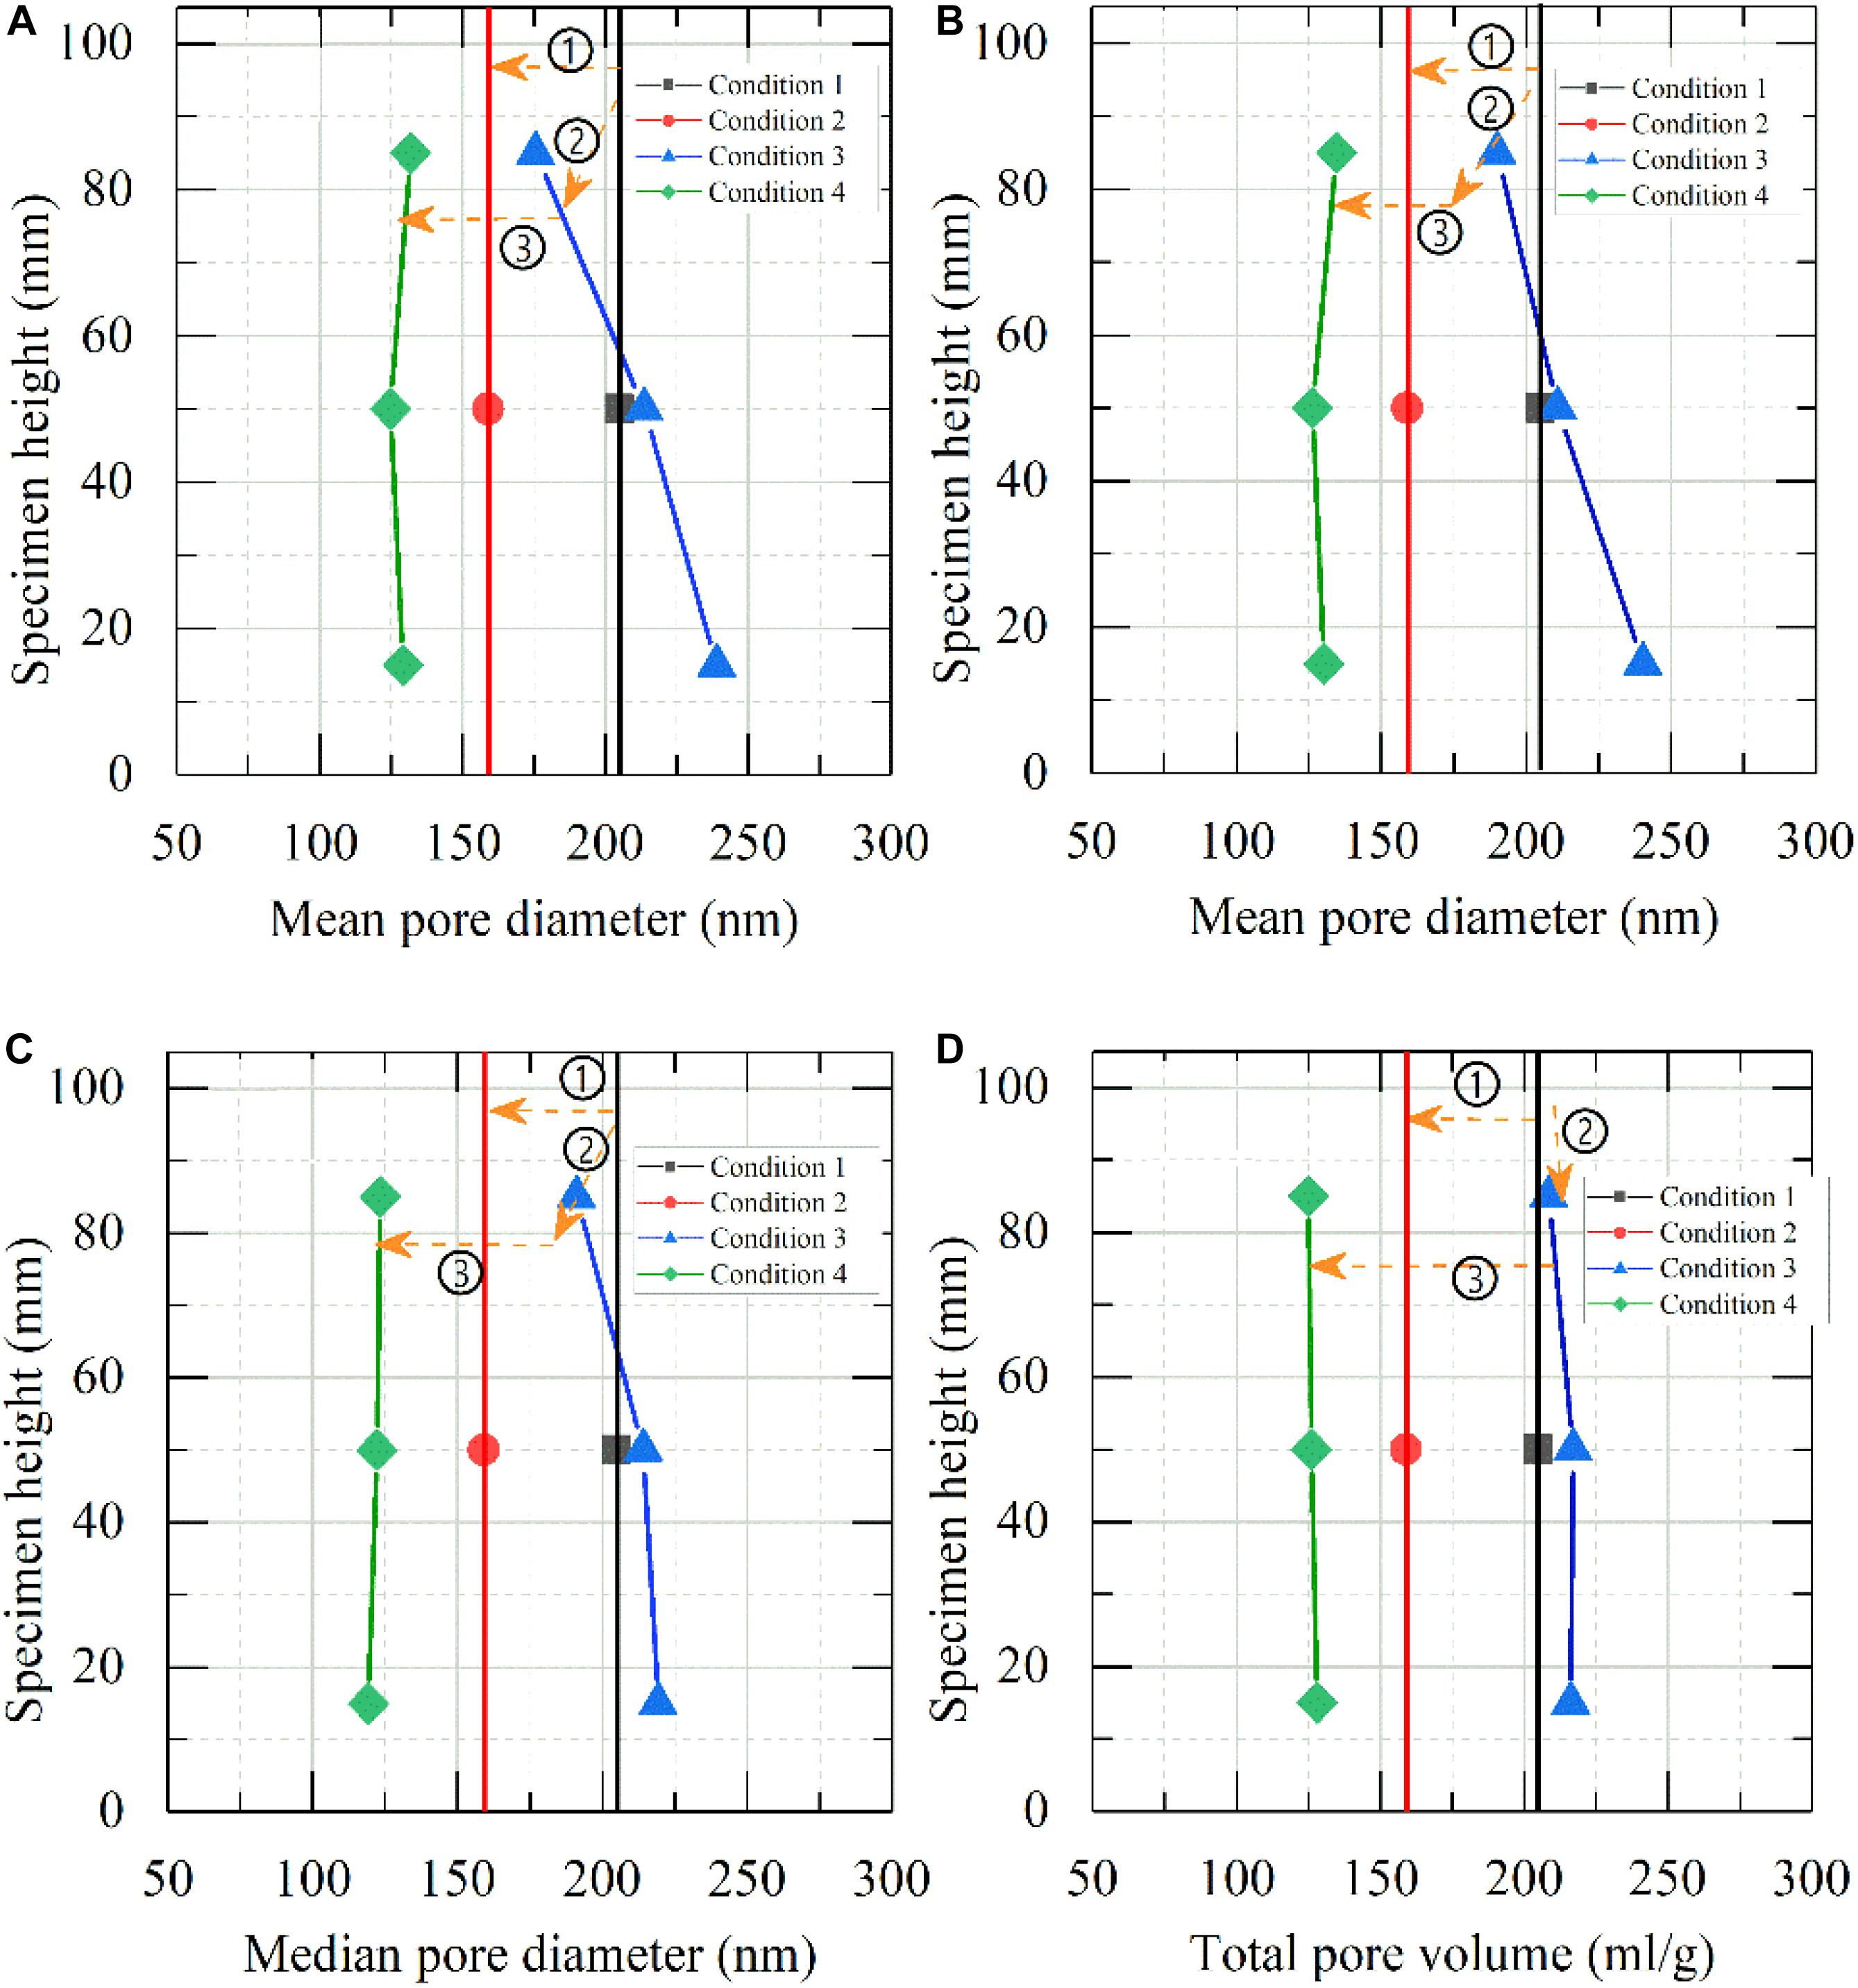
Figure 10. Average pore size distribution for soil samples with condition: (A) undisturbed, (B) after compressing, (C) after freezing-thawing, (D) after freezing-thawing and compressing. ➀ Consolidation test, ➁ freeze-thaw test, and ➂ consolidation test.
Discussion
Change of Micro-Pores in Clay After Freeze-Thaw and Compression
As mentioned above, freeze-thaw and compression tests of undisturbed clay were carried out, and the total pore volume, median pore size, and average pore size were obtained by mercury intrusion tests. The results presented in the previous section indicate that the compressive deformation characteristics of frozen-thawed soil closely related to the changes of micro-pore parameters. Figure 11 illustrates the mechanism for micro-pore changes in clay under freeze-thaw and compression.
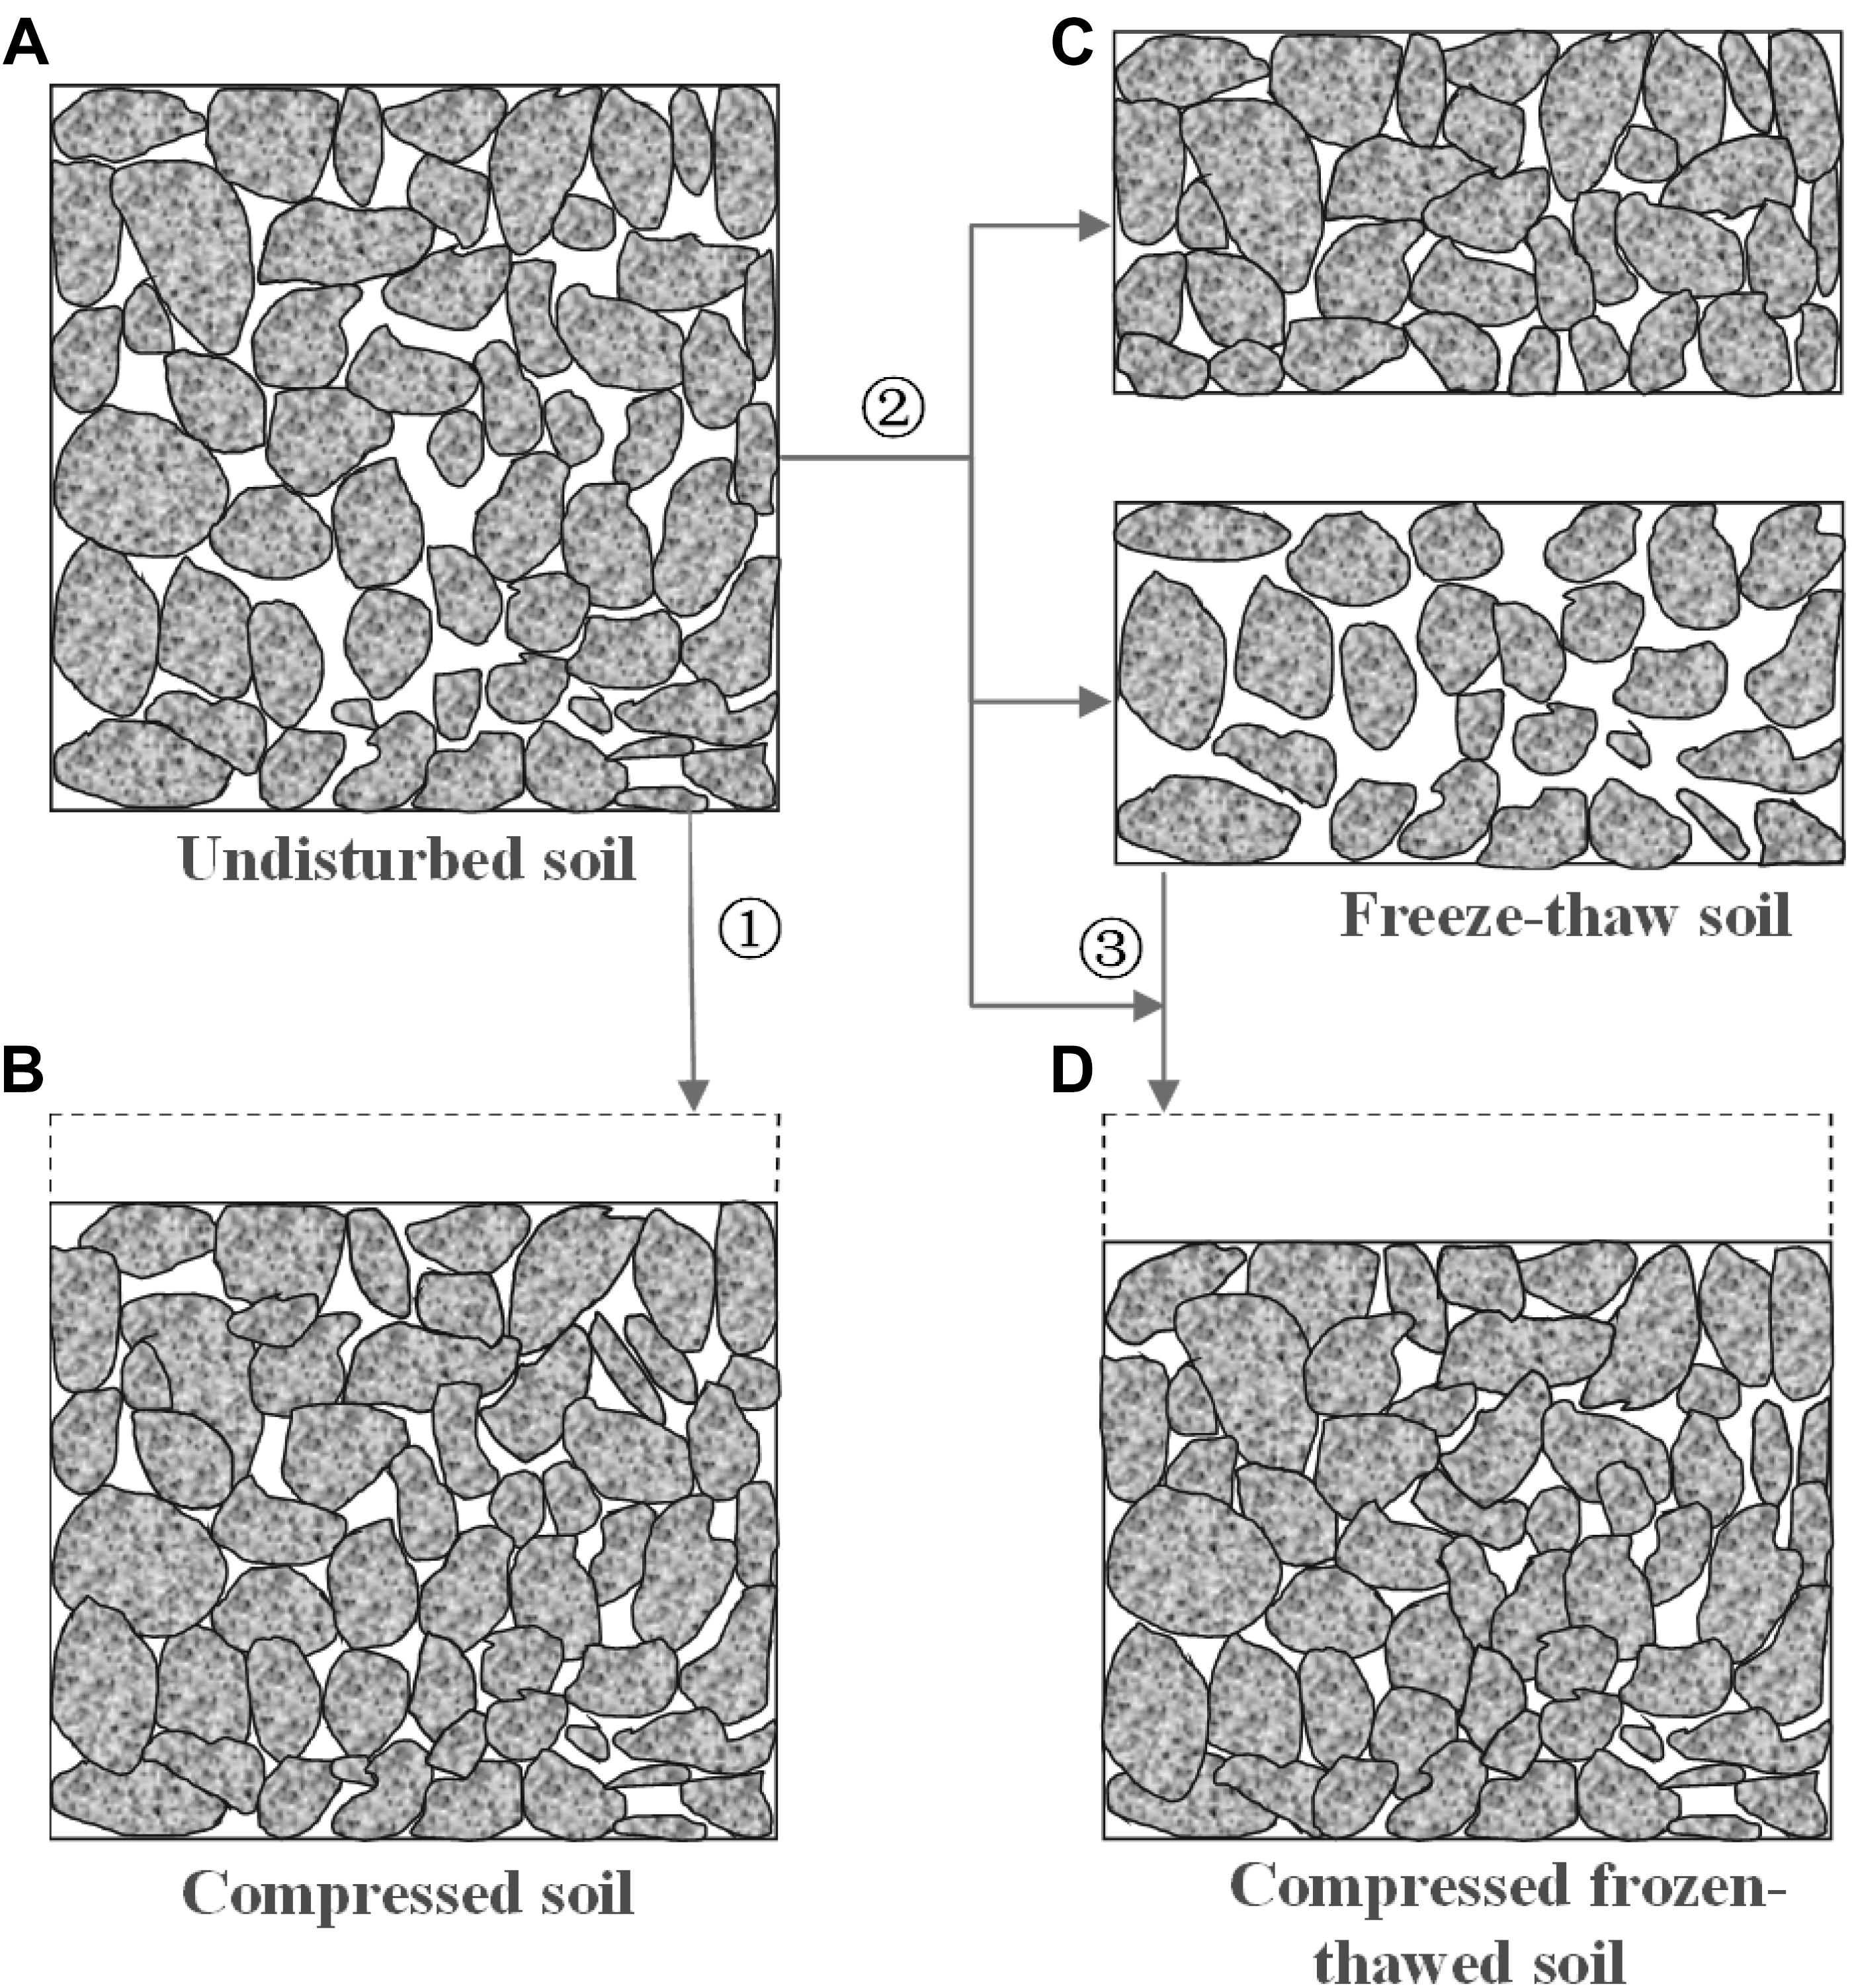
Figure 11. Schematic of micro-pore changes in clay under freeze-thaw and compression (➀ consolidation test, ➁ freeze-thaw test, and ➂ consolidation test). (A) Undisturbed soil, (B) Compressed soil, (C) freeze-thaw, (D) Compressed frozen-thawed soil.
According to the classical theory of soil mechanics, there are three components of soil, including the soil skeleton, pore, and water filled in pore (Terzaghi et al., 1948, 1965). Under the action of an additional load, the soil is compressed. At this time, the soil skeleton is squeezed, the pore between particles is squeezed smaller, and the water in part of the pore is excluded and the soil is consolidated (Figures 11A,B). In the process of freezing-thawing, the effect of temperature field varies with time, which is accompanied by the effect of ice formation in the frozen zone, with the movement of the freezing front and the moisture migration under the action of negative pressure in the unfrozen zone. Under this effect, the pores of soil near the cold end are enlarged under the action of ice formation, and the pores are squeezed as the soil skeleton is under the negative pressure far away from the cold end (Figure 11C). Finally, the consolidation test of frozen-thawed soil samples was carried out. At this time, due to the disturbance of pores and soil particles caused by freeze-thaw ice formation and water migration, the sensitivity of soil is increased, and the pores between soil particles will be further compressed under external forces (Figure 11D). This process can be more intuitively displayed by means of a scanning electronic microscope, and the results will be reported in a separate paper.
Limitations and Engineering Implications
The soil skeleton structure is under the function of three-dimensional stress of the stratum and keeps its inherent structure shape, in the natural state. In this paper, in order to show the change of soil pore under freeze-thaw and compression more faithfully, the original soil samples were tested, ignoring the influence of disturbance on soil pore structure caused by the sampling and sample preparation process. Furthermore, as the sample size of MIP is small, to avoid the influence of the structure difference of soil samples in different states, the mercury intrusion test data in all states were obtained by three groups of parallel tests with average values.
Summary and Conclusion
This study (1) presents MIP data on a clay specimen before and after a one-directional freeze-thaw test in a closed system and physical property data obtained using conventional laboratory testing of samples from different locations within a specimen; (2) analyzes the micro-pore change of clay after freeze-thaw and compression using three characteristic parameters, including total pore volume, median pore diameter for volume, and average pore diameter; (3) demonstrates how MIP data can be used for the quantitative assessment of local changes in micro-pores. The following conclusions can be drawn:
(1) The compression index varies with the height and location of the specimen after freeze-thaw with different cold-end temperatures.
(2) The mercury injection pressure threshold exists in the clay, there is hysteresis in the stage of mercury removal, and the micro-pores of soil contains ink-bottle type pores.
(3) The total pore volume, median pore size, and the average pore size are closely related to the cold-end temperature, the distance from the cold end, and the compression effect.
(4) There are close correlations between the variation of micro-pore parameters and variation of compression index, pore ratio, water content, and density.
(5) Quantitative changes of micro-pores under freeze-thaw and compression can be related to the consolidation principle of soil mechanics and the principle of moisture migration driven by negative pressure in the freeze-thaw process. Additional testing for soil micro-structure observation and image analysis, and the characterization of other soil types, should be conducted.
Data Availability Statement
All datasets generated for this study are included in the article/supplementary material.
Author Contributions
All authors listed have made a substantial, direct and intellectual contribution to the work, and approved it for publication.
Funding
This work was supported by the National Natural Science Foundation of China (Nos. 41462011, 51609093, 41977236, and 51869001), the Doctoral Scientific Research Foundation of East China University of Science and Technology (No. DHBK2017121), Science and Technology Project funded by the Education Department of Jiangxi Province (No. GJJ170485), and Science and Technology Project of Jiangxi Province (Nos. 20192ACBL20002 and 20192ACBL20002).
Conflict of Interest
The authors declare that the research was conducted in the absence of any commercial or financial relationships that could be construed as a potential conflict of interest.
Acknowledgments
We thank LetPub (www.letpub.com) for its linguistic assistance during the preparation of this manuscript.
References
Beckett, C. T. S., and Augarde, C. E. (2013). Prediction of soil water retention properties using pore-size distribution and porosity. Cana. Geotechn. J. 50, 435–450. doi: 10.1139/cgj-2012-0320
Cuisinier, O., Auriol, J.-C., Le Borgne, T., and Deneele, D. (2011). Microstructure and hydraulic conductivity of a compacted lime-treated soil. Eng. Geol. 123, 187–193. doi: 10.1016/j.enggeo.2011.07.010
Dananaj, I., Frankovská, J., and Janotka, I. (2005). The influence of smectite content on microstructure and geotechnical properties of calcium and sodium bentonites. Appl. Clay Sci. 28, 223–232. doi: 10.1016/j.clay.2004.02.006
Fei, W., Yang, Z., and Sun, T. (2019). Ground freezing impact on laterally loaded pile foundations considering strain rate effect. Cold Reg. Sci. Technol. 157, 53–63. doi: 10.1016/j.coldregions.2018.09.006
Gu, X., Huang, M., and Qian, J. (2013). DEM investigation on the evolution of microstructure in granular soils under shearing. Granul. Matter 16, 91–106. doi: 10.1007/s10035-013-0467-z
Guan, H., Wang, D., Ma, W., Mu, Y., Wen, Z., Gu, T., et al. (2015). Study on the freezing characteristics of silty clay under high loading conditions. Cold Reg. Sci. Technol. 110, 26–31. doi: 10.1016/j.coldregions.2014.10.005
Han, L., Ye, G. L., Li, Y. H., Xia, X. H., and Wang, J. H. (2016). In situ monitoring of frost heave pressure during cross passage construction using ground-freezing method. Can. Geotechn. J. 53, 530–539. doi: 10.1139/cgj-2014-0486
Hao, N., Wang, Y. L., Mao, L. T., and Liu, Q. (2013). The fractal characteristic analysis of coal pore structure based on mercury intrusion porosimetry. Adv. Civil Ind. Eng.4, 353–356.
Hass, H., and Schafers, P. (2006). “Application of ground freezing for underground construction in soft ground,” in Geotechnical Aspects of Underground Construction in Soft Ground: Proceedings of the 5th International Symposium TC28, eds E. A. Kwast, K. J. Bakker, W. Broere, and A. Bezuijen (Amsterdam), 405–412.
Jessberger, H. L. (1980). Theory and Application of ground freezing in civil engineering. Cold Reg. Sci. Technol. 3, 3–27. doi: 10.1016/0165-232x(80)90003-8
Kang, Y., Liu, Q., Cheng, Y., and Liu, X. (2016). Combined freeze-sealing and new tubular roof construction methods for seaside urban tunnel in soft ground. Tunnel. Undergr. Space Technol. 58, 1–10. doi: 10.1016/j.tust.2016.04.001
Katti, D. R., and Shanmugasundaram, V. (2001). Influence of swelling on the microstructure of expansive clays. Can. Geotechn. J. 38, 175–182. doi: 10.1139/t00-079
Kikkawa, N., Orense, R. P., and Pender, M. J. (2013). Observations on microstructure of pumice particles using computed tomography. Can. Geotechn. J. 50, 1109–1117. doi: 10.1139/cgj-2012-0365
Lagger, H., Amon, A., and Lackner, R. (2014). Artificial ground freezing of fully saturated soil: thermal problem. J. Eng. Mech. 131, 211–220. doi: 10.1061/(asce)0733-9399(2005)131:2(211)
Lai, Y., Xu, X., Dong, Y., and Li, S. (2013). Present situation and prospect of mechanical research on frozen soils in China. Cold Reg. Sci. Technol. 87, 6–18. doi: 10.1016/j.coldregions.2012.12.001
Li, D., Yang, X., and Chen, J. (2017). A study of triaxial creep test and yield criterion of artificial frozen soil under unloading stress paths. Cold Reg. Sci. Technol. 141, 163–170. doi: 10.1016/j.coldregions.2017.06.009
Li, X., and Zhang, L. M. (2009). Characterization of dual-structure pore-size distribution of soil. Can. Geotechn. J. 46, 129–141. doi: 10.1139/t08-110
Miao, L., Houston, S. L., Cui, Y., and Yuan, J. (2007). Relationship between soil structure and mechanical behavior for an expansive unsaturated clay. Can. Geotechn. J. 44, 126–137. doi: 10.1139/t06-108
Moro, F., and Bohni, H. (2002). Ink-bottle effect in mercury intrusion porosimetry of cement-based materials. J. Colloid Interface Sci. 246, 135–149. doi: 10.1006/jcis.2001.7962
Ninjgarav, E., Chung, S.-G., Jang, W.-Y., and Ryu, C.-K. (2007). Pore size distribution of Pusan clay measured by mercury intrusion porosimetry. KSCE J. Civil Eng. 11, 133–139. doi: 10.1007/bf02823892
Nowamooz, H., and Masrouri, F. (2012). “Soil Fabric of Compacted and Natural Swelling Soils Studied by Mercury Intrusion Porosimetry,” in Unsaturated Soils, eds C. Mancuso, C. Jommi, and F. D’Onza (Berlin: Research and Applications. Springer).
Ouhadi, V. R., and Yong, R. N. (2003). Impact of clay microstructure and mass absorption coefficient on the quantitative mineral identification by XRD analysis. Appl. Clay Sci. 23, 141–148. doi: 10.1016/s0169-1317(03)00096-6
Penumadu, D., and Dean, J. (2000). Compressibility effect in evaluating the pore-size distribution of kaolin clay using mercury intrusion porosimetry. Can. Geotechn. J. 37, 393–405. doi: 10.1139/t99-121
Romero, E., and Simms, P. H. (2009). Microstructure investigation in unsaturated soils: A review with special attention to contribution of mercury intrusion porosimetry and environmental scanning electron microscopy, Laboratory and Field Testing of Unsaturated Soils. Berlin: Springer, 93–115.
Russo, G., Corbo, A., Cavuoto, F., and Autuori, S. (2015). Artificial ground freezing to excavate a tunnel in sandy soil. measurements and back analysis. Tunnel. Undergr. Space Technol. 50, 226–238. doi: 10.1016/j.tust.2015.07.008
Sasanian, S., and Newson, T. A. (2013). Use of mercury intrusion porosimetry for microstructural investigation of reconstituted clays at high water contents. Eng. Geol. 158, 15–22. doi: 10.1016/j.enggeo.2013.03.002
Tang, Y., and Li, J. (2018). Experimental study on dynamic cumulative axial-strain performance of freezing–thawing saturated sandy silt. Cold Reg. Sci. Technol. 155, 100–107. doi: 10.1016/j.coldregions.2018.08.001
Tang, Y. Q., and Yan, J. J. (2015). Effect of freeze-thaw on hydraulic conductivity and microstructure of soft soil in Shanghai area. Environ. Earth Sci. 73, 7679–7690. doi: 10.1007/s12665-014-3934-x
Terzaghi, K., Peck, R. B., and Mesri, G. (1948). Soil mechanics in engineering practice. Soil Sci. 68, 149–150.
Terzaghi, K., Terzaghi, K. P., Ralph, B., Terzaghi, K. P., and Ralph, B. (1965). Theoretical soil mechanics. Hoboken, NJ: John Wiley & Sons.
Vitel, M., Rouabhi, A., Tijani, M., and Guérin, F. (2016). Modeling heat and mass transfer during ground freezing subjected to high seepage velocities. Comput. Geotechn. 73, 1–15. doi: 10.1016/j.compgeo.2015.11.014
Wang, D., Wang, Y., Ma, W., Lei, L., and Wen, Z. (2018). Study on the freezing-induced soil moisture redistribution under the applied high pressure. Cold Reg. Sci. Technol. 145, 135–141. doi: 10.1016/j.coldregions.2017.10.012
Wang, S., Yang, P., and Yang, Z. (2018). Characterization of freeze–thaw effects within clay by 3D X-ray Computed Tomography. Cold Reg. Sci. Technol. 148, 13–21. doi: 10.1016/j.coldregions.2018.01.001
Wang, S., Yang, Z., and Yang, P. (2017). Structural change and volumetric shrinkage of clay due to freeze-thaw by 3D X-ray computed tomography. Cold Reg. Sci. Technol. 138, 108–116. doi: 10.1016/j.coldregions.2017.03.007
Washburn, E. W. (1921). Note on a Method of Determining the Distribution of Pore Sizes in a Porous Material. Proc. Natl. Acad. Sci. U.S.A. 7, 115–116. doi: 10.1073/pnas.7.4.115
Yamamuro, J. A., and Wood, F. M. (2004). Effect of depositional method on the undrained behavior and microstructure of sand with silt. Soil Dyn. Earthq. Eng. 24, 751–760. doi: 10.1016/j.soildyn.2004.06.004
Yang, P., and Zhu, F.-B. (2005). “Application of Freezing Method to Recover Tunnel Accident in Complex Stratum of Nanjing Subway,” in Proceedings of the International Conference. (Singapore: World Scientific), 13.
Yuan, B., Sun, M., Xiong, L., Luo, Q., Pradhan, S. P., and Li, H. (2019a). Investigation of 3D deformation of transparent soil around a laterally loaded pile based on a hydraulic gradient model test. J. Build. Eng. 28, 1–9.
Yuan, B., Xiong, L., Zhai, L., Zhou, Y., Chen, G., Gong, X., et al. (2019b). Transparent synthetic soil and its application in modeling of soil-structure interaction using optical system. Front. Earth Sci. 7:276.
Zhang, X., Kong, L., Guo, A., and Tuo, Y. (2012). Evolution of microscopic pore of structured clay in compression process based on SEM and MIP test. Chin. J. Rock Mech. Eng. 31, 406–412.
Zhao, D., Xu, M., Liu, G., Yao, X., Tuo, D., Zhang, R., et al. (2017). Quantification of soil aggregate microstructure on abandoned cropland during vegetative succession using synchrotron radiation-based micro-computed tomography. Soil Tillage Res. 165, 239–246. doi: 10.1016/j.still.2016.08.007
Zhao, L., Yang, P., Zhang, L.-C., and Wang, J. (2016). Cyclic direct shear behaviors of an artificial frozen soil-structure interface under constant normal stress and sub-zero temperature. Cold Reg. Sci. Technol. 133, 70–81. doi: 10.1016/j.coldregions.2016.10.011
Zhao, X., Zhou, G., and Wang, J. (2013). Deformation and strength behaviors of frozen clay with thermal gradient under uniaxial compression. Tunnel. Undergr. Space Technol. 38, 550–558. doi: 10.1016/j.tust.2013.09.003
Zhou, J., and Tang, Y. (2015a). Artificial ground freezing of fully saturated mucky clay: thawing problem by centrifuge modeling. Cold Reg. Sci. Technol. 117, 1–11. doi: 10.1016/j.coldregions.2015.04.005
Zhou, J., and Tang, Y. (2015b). Centrifuge experimental study of thaw settlement characteristics of mucky clay after artificial ground freezing. Eng. Geolo., 98–108. doi: 10.1016/j.enggeo.2015.03.002
Keywords: micro-pore, freeze-thaw effect, compression, clay, mercury intrusion porosimetry
Citation: Wang S, Yang P, Dai D, Xue K and Li D (2020) A Study on Micro-Pore Characteristics of Clay Due to Freeze-Thaw and Compression by Mercury Intrusion Porosimetry. Front. Earth Sci. 7:344. doi: 10.3389/feart.2019.00344
Received: 11 September 2019; Accepted: 10 December 2019;
Published: 14 January 2020.
Edited by:
Yixian Wang, Hefei University of Technology, ChinaReviewed by:
Sabyasachi Sen, University of California, Davis, United StatesHyun Na Kim, Kongju National University, South Korea
Bingxiang Yuan, Guangdong University of Technology, China
Copyright © 2020 Wang, Yang, Dai, Xue and Li. This is an open-access article distributed under the terms of the Creative Commons Attribution License (CC BY). The use, distribution or reproduction in other forums is permitted, provided the original author(s) and the copyright owner(s) are credited and that the original publication in this journal is cited, in accordance with accepted academic practice. No use, distribution or reproduction is permitted which does not comply with these terms.
*Correspondence: Shengfu Wang, bmZ1d2FuZ3NmQGZveG1haWwuY29t; Ping Yang, eWFuZ3BpbmdAbmpmdS5lZHUuY24=