 Mingyi Zhang
 Songkui Sang
 Yonghong Wang*
- School of Civil Engineering, Qingdao University of Technology, Qingdao, China
A series of direct shear tests using a large-scale constant-normal-stiffness direct-shear testing system was conducted to study the factors that influence the mechanical characteristics of a pile–soil interface (PSI) in clay soil. Interfaces of different roughness (R = 0, 2, 4, and 6 mm) were tested in clay soil with four different water contents with four normal stresses under different shear rates during shearing. Results for the interfacial shear behavior are presented as shear-stress–shear-strain curves, shear strength, and parameters. The results show that (i) the higher the roughness, the higher the shear strength of the PSI. The larger the normal stress, the smaller the roughness effect on the shear strength and parameters of the PSI; and (ii) the higher the water content of the clay soil, the lower the shear strength of the PSI, with maximum cohesion at a water content of 25%. The main influence that increasing the water content has on the shear strength of the PSI is changing the coherence, while the shear rate in this test range has less effect on the shear strength of the PSI. Overall, the mechanical characteristics of the PSI are influenced by roughness, water content, and shear rate, and close attention should be paid to those three factors when analyzing test results.
Introduction
Pile–soil interaction is a key research topic when considering how soil and structures interact. When analyzing pile–soil interaction, it is important to consider the mechanical properties of the pile–soil interface (PSI), which are studied by means of indoor contact shear tests. Currently, the commonly used indoor shear tests for soil–structure contact surfaces are the direct shear test (Ramsey et al., 1998; Guo et al., 2000; Airey and Kelly, 2010; Quinteros et al., 2017), the single shear test (Rebelo, 2003), and the ring shear test (Lutenegger et al., 1981; Jewell, 1989; Reddy et al., 2000; Guo, 2008). Potyondy (1961); Clough and Duncan (1971), Brandi (1985); Desai and Drumm (1985), Fakharian and Evgin (1997); Hu and Pu (2001), Canakci et al. (2016), all used the direct shear test to study the relationship between soil and structures. Regarding the mechanical properties of the contact surface, Potyondy (1961) used the direct shear test to study those of silty soil, silty clay, and clay with concrete, steel, and wood. Sun et al. (2009); Wang et al. (2009), Yang et al. (2009), and Liu et al. (2011) used ring shear tests to carry out the interface shear tests considering mud skin and ring shear tests of overconsolidated clay at three different shear rates. Currently, the test that is used most widely is the direct shear test, in which loading by a constant-stiffness direct-shear instrument reflects the dynamic change of the normal stress at the PSI along with the normal displacement of the soil, which is consistent with the actual stress condition of pile–soil interaction. Some scholars also studied the stress characteristics between pileand soil through transparent soil and PIV technology (Yuan et al., 2016, 2019a,b, 2020).
In practical engineering, most jacked piles are in clay soil layers. Considering the practical application characteristics of the jacked piles, the clay soil can reproduce the actual working state of the jacked piles. The penetration of a jacked pile is affected by factors such as the water content of the clay soil around the pile (Yang et al., 2009), the soil pressure on the sides of the pile (Sun et al., 2009; Chen et al., 2016), the pile roughness (Zhao et al., 2012), and the pile sinking rate (Zhou et al., 2010; Xu et al., 2013). Many scholars have conducted in-depth investigations of the shear-strength parameters of PSIs. Using a scheme of loading and unloading (The National Standards Compilation Group of People’s Republic of China, 1999) analyzed how the stress history influenced the effective coefficient of friction and cohesion at a PSI. By varying the water content and forward shear ratio of the soil, Lu et al. (2013) determined how those parameters affected the cohesion and friction angle. Xu and Meng (2010) and Chen et al. (2016) studied how roughness influenced the shear strength and index of the contact surface; they proposed that the main reason for the increased shear strength of the contact surface with greater roughness was the increase in cohesion, which was far greater than the change in the internal friction angle. At present, some scholars conducted a series of tests to improved the shear strength of soil by adding fiber, and many useful conclusions have been obtained (Wang et al., 2017, 2018, 2019).
The above research shows that the shear-strength parameters of a PSI are affected by the water content, the roughness of the contact surface, and the shear rate. To date, there has been a lack of experimental laboratory research on how PSI change during static-pressure pile driving, and therefore the factors that influence the mechanical properties of a PSI in viscous soil are not known accurately. To study how roughness, water content, and shear rate influence the shear strength and parameters of a PSI in cohesive soil, the present author used a large-scale constant-stiffness direct-shear instrument to study the contact between cohesive soil and concrete for (i) four different roughness grades of the contact surface, (ii) four different water contents, and (iii) four different normal stresses and shear rates. The design of the present pile foundation provides a theoretical basis and has important application value in engineering.
Test Plan
Test Instruments
The device used for the tests was a large-scale direct-shear test system. The system comprises two shear boxes, an upper one and a lower one. During a test, a concrete block was placed in the lower box, and the upper box was filled with clay soil after installing a baffle so as to simulate the shear of a PSI in actual engineering. The direct-shear test system is simple to operate, controls the shear rate of stiffness displacement precisely, and provides automatically collected data on the normal shear stress. The test device is shown in Figure 1.
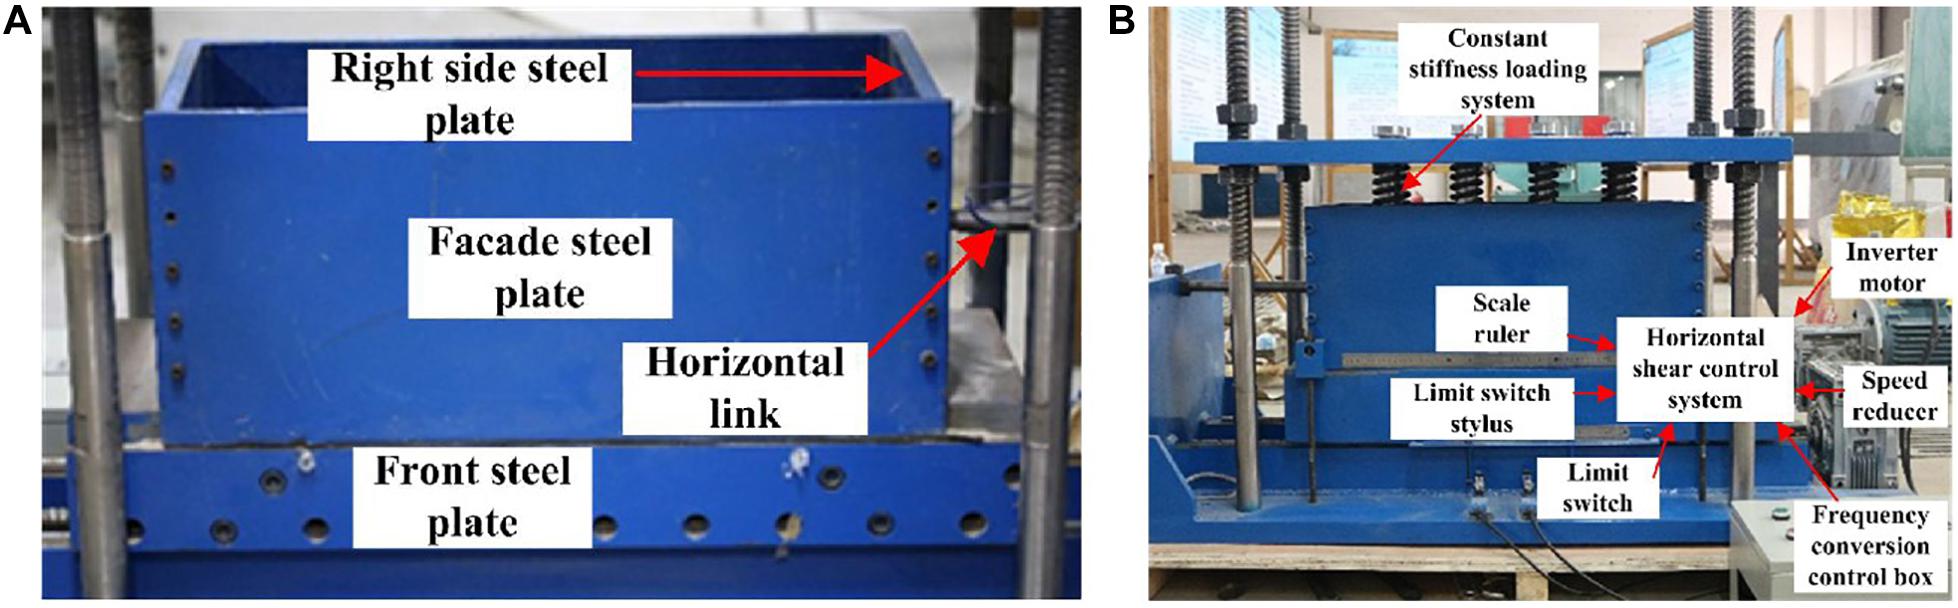
Figure 1. Large-scale constant-normal-stiffness direct-shear apparatus for pile–soil interface (PSI): (A) Front elevation; (B) Back elevation.
Soil Samples
The soil samples used in the tests were taken from the silty clay layer in a project site in Qingdao in China. Following standard GB50123-1999 for geotechnical tests (Liu et al., 2016), the undisturbed soil was dried, crushed, and screened, and soil samples with different water content were prepared by adding water. For stratified compaction, all the soil samples had the same dry density, which was controlled at 1.58 g/cm3. The prepared soil samples were left standing for 7–10 days to ensure moisture uniformity therein. Taking the water content of a soil sample as 28% as an example, the basic physical properties of the soil are given in Table 1.
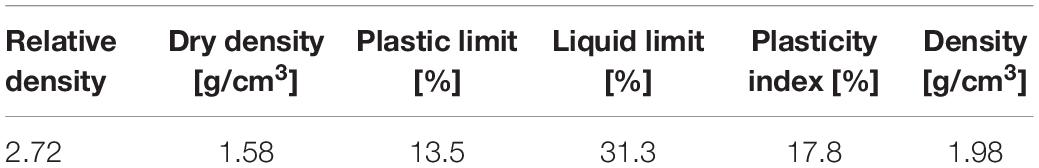
Table 1. Basic physical properties of clay.
Concrete Blocks
A block of concrete with a strength grade of C50 was placed inside the shear box under the instrument to simulate the concrete of the pile body. As shown in Figure 2A, the concrete surface had a sawtooth profile, with one sawtooth being 2 mm wide at its top and 10 mm wide at its base. To simulate the interfacial roughness of actual precast piles (i.e., interfaces I, II, III, and IV), concrete blocks were prepared with sawtooth heights R = 0, 2, 4, and 6 mm, respectively. Photographs of the surfaces of the concrete test blocks with different roughness are shown in Figure 2B.
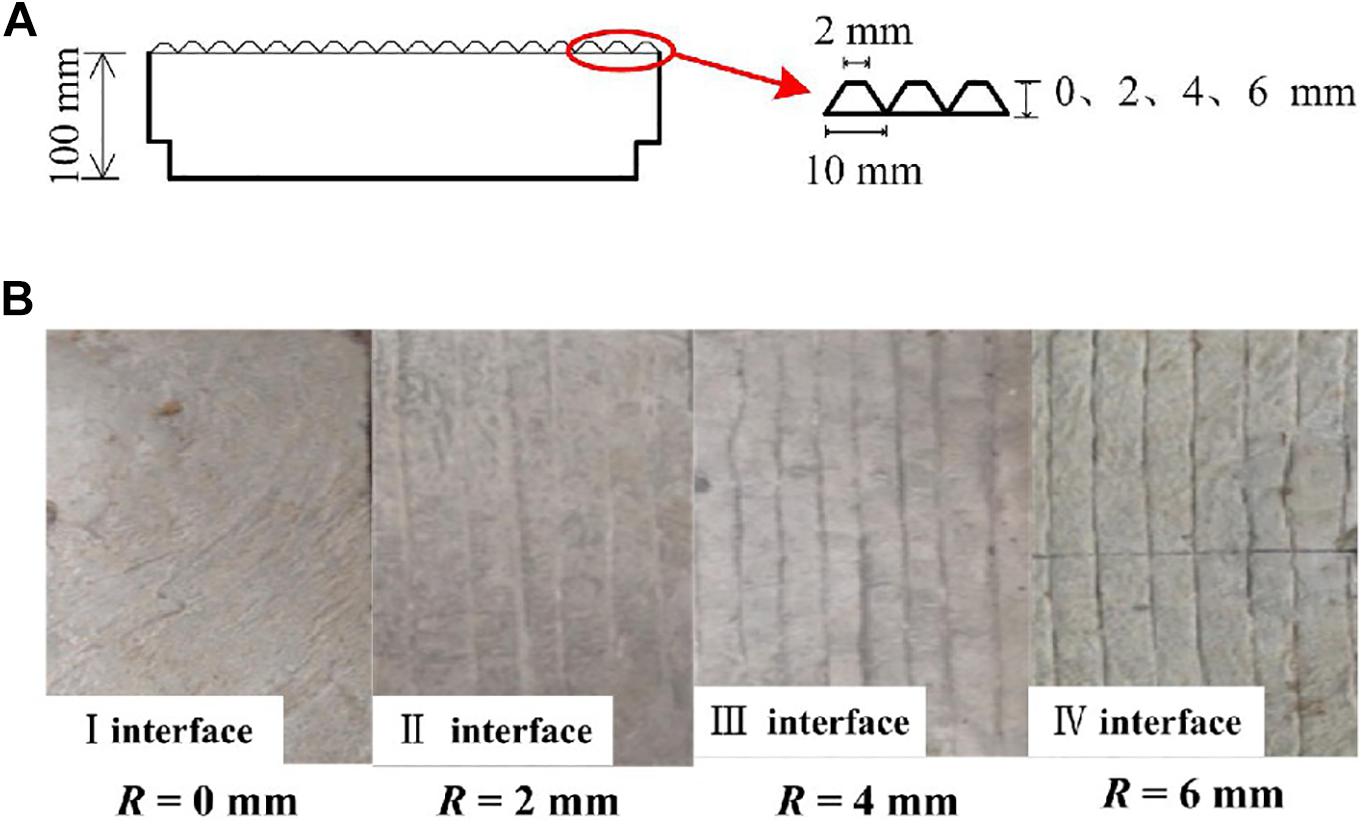
Figure 2. Interface roughness setting: (A) Sawtooth peak–valley distance of concrete interface; (B) Concrete test blocks of different roughness.
Silicon Piezoresistive Sensor
To measure directly the radial soil pressure and pore water pressure at the PSI, silicon piezoresistive sensors were embedded in holes on the surface of the concrete test block. The diameter of the silicon piezoresistive sensor was 10 mm, the height was 6 mm, and the data acquisition frequency was 2000 Hz. The soil pressure sensor and the two pore water pressure sensors were installed on the surface of the concrete test block using the same installation method, as shown in Figure 3.
Figure 3. Diagram of installation of silicon piezoresistive sensors.
Experimental Procedure
The test process is shown in Figure 4. During a test, a prepared concrete block with the silicon piezoresistive sensors was placed in the shear box under the direct-shear meter. Then the soil samples with different moisture content were layered compaction. Put equal volume soil samples into each layer, and then use light rubber hammer to evenly compaction. The height of each layer is 80 mm after compaction. After each layer of soil sample is compacted, the soil surface is shaved to ensure the uniformity of the soil. Repeat this procedure and test soil samples are compacted in 5 layers. Finally, normal stress is applied to shear test and data are collected in real time.
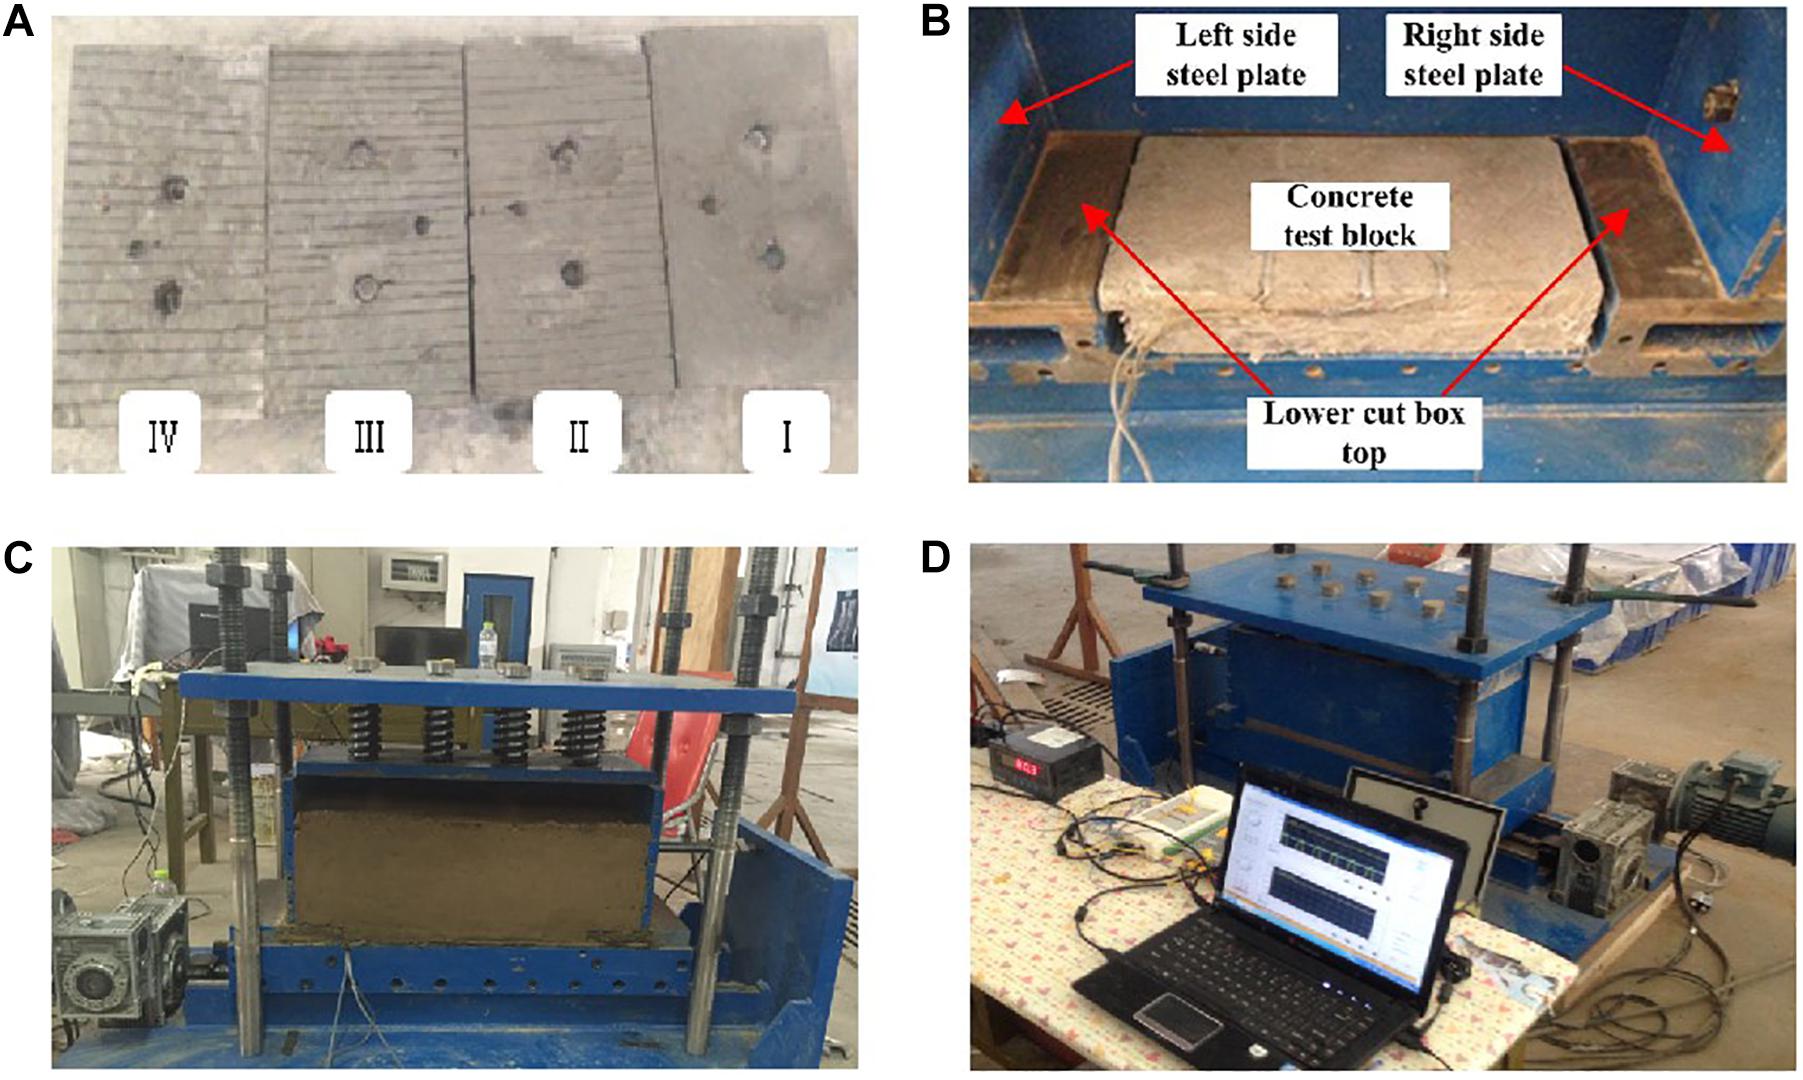
Figure 4. Testing process: (A) Making concrete test blocks, (B) Place concrete test block, (C) Remodeling soil samples, (D) Data collection systems.
Test Content
Direct shear tests were carried out on soil samples with different water content under the conditions of different roughness and shear rate, and the shear displacement was controlled at 40 mm to study the mechanical properties of the PSI in viscous soil. The experiment was divided into 96 groups, as listed in Table 2. The relationship between the shear stress and shear displacement of the samples with different parameters was obtained.
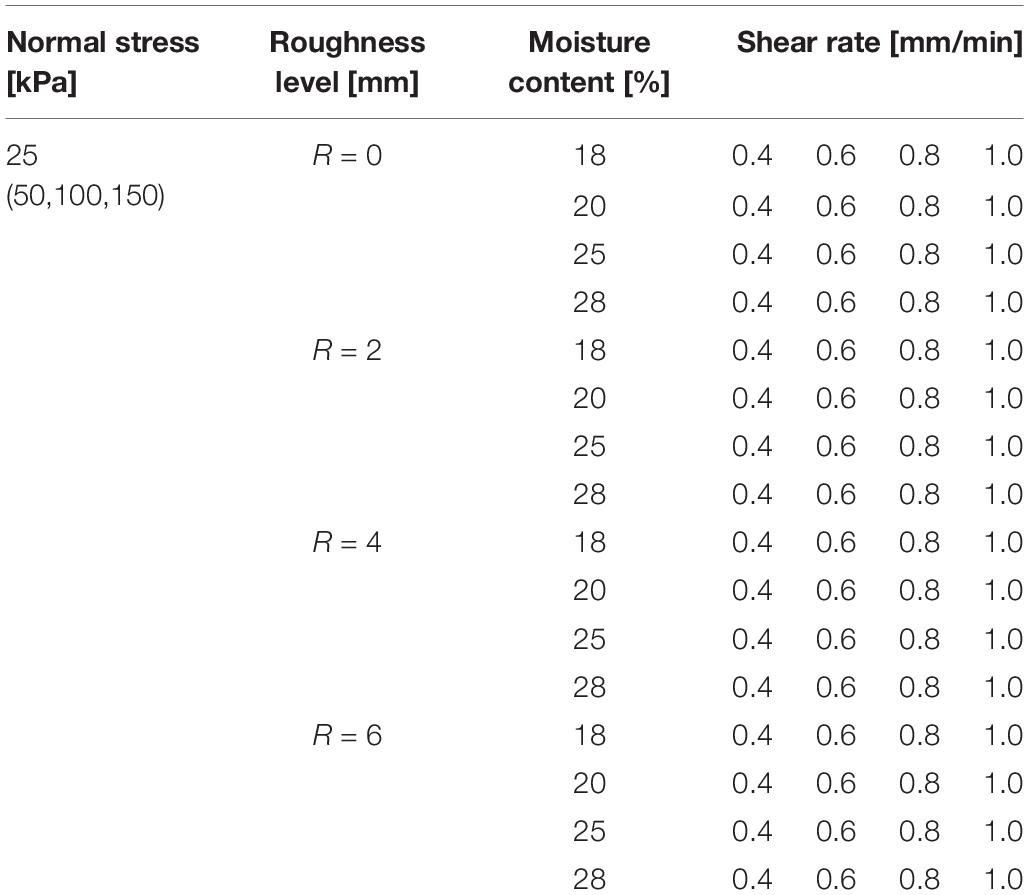
Table 2. Groups of samples.
Analysis of Test Results
Influence of Roughness
Shear Stress Versus Shear Displacement
Figure 5 shows the curves of shear stress versus shear displacement (τ-u curves) of the PSI under different roughness conditions. Take the same water content ω = 28% and the same shear rate as 1.0 mm/min as an example. As can be seen, when the roughness is same, the τ-u curves coincide at small shear displacement, after which they deviate. The maximum shear stress and the shear failure displacement increase with the normal stress; when the roughness level is low (R ≤ 2 mm), the τ-u curve exhibits a distinct line shape at normal stress σ ≤ 50 kPa. For normal stress σ ≥ 100 kPa, the τ-u curves are of a type that is between linear and hyperbolic. The curves have no obvious turning point; when the roughness level is high (R ≥ 4 mm), the τ-u curves have a more pronounced linear shape. When the normal stress reaches 50 kPa, the shear stress reaches a maximum value, and then a small drop occurs, finally, it tends to be gentle.
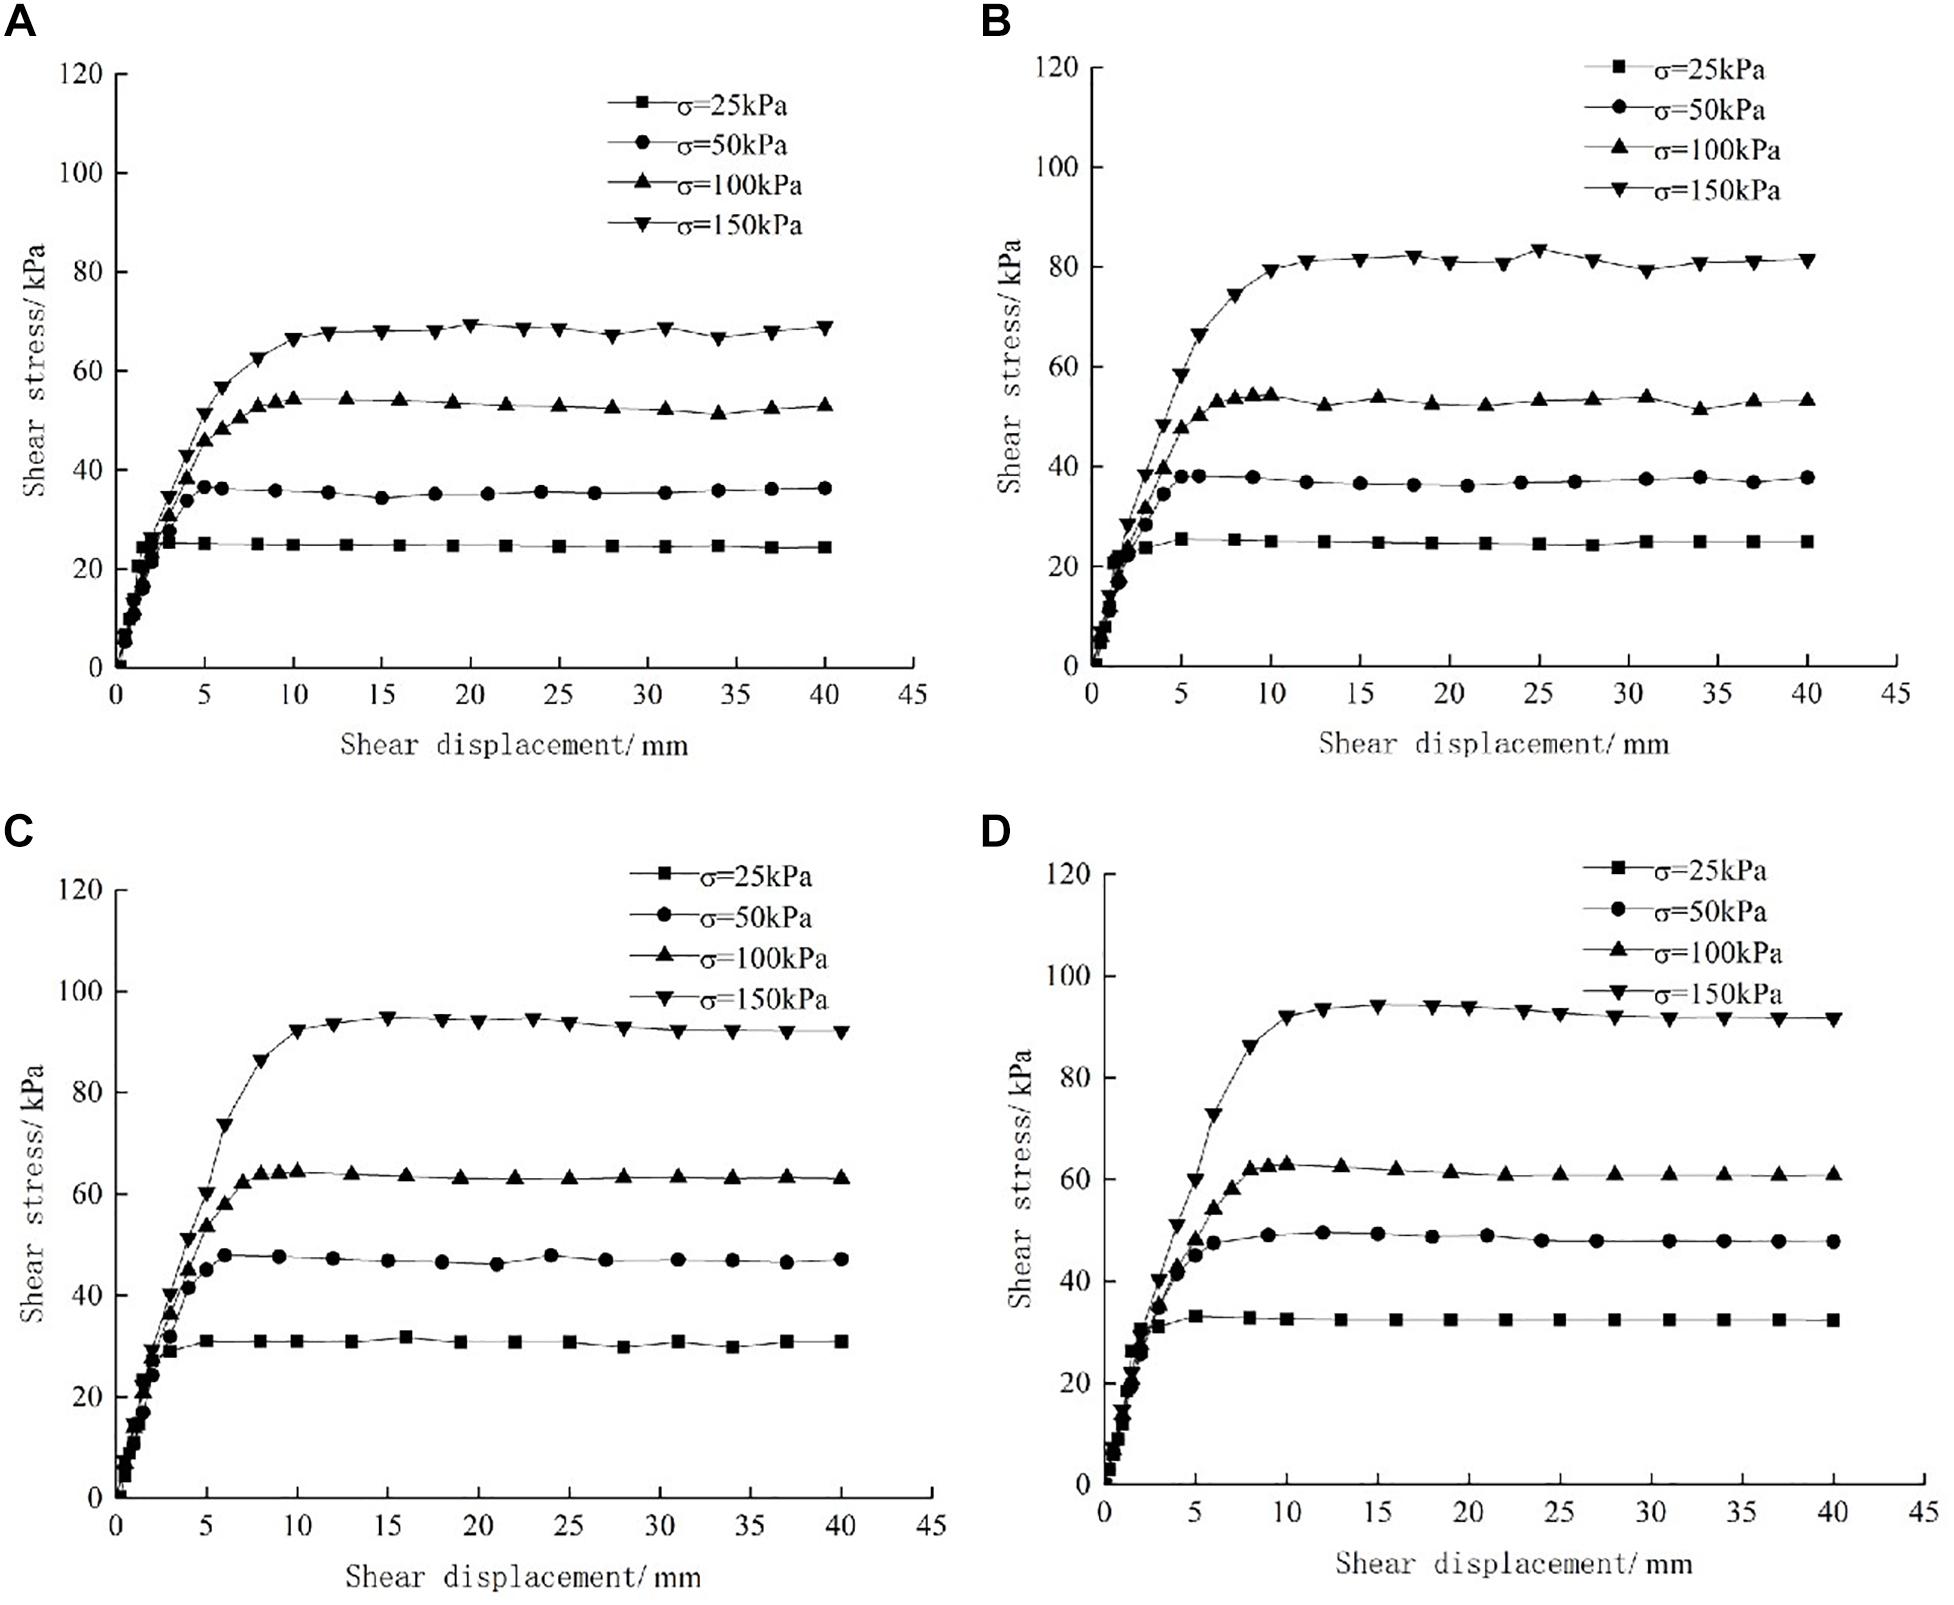
Figure 5. Shear-stress–shear-strain curves for given roughness and varying normal stress: (A) R = 0 mm; (B) R = 2 mm; (C) R = 4 mm; (D) R = 6 mm.
Figure 6 shows the τ-u curves for different values of the interfacial roughness R. For a given normal stress, the τ-u curves with different roughness have overlapping sections that are separated by shear failure with increasing roughness. With increasing normal stress, the difference of τ-u curve is reduced under different roughness, and the influence of roughness on τ-u curve is gradually reduced. For a given normal stress, the roughness has a significant influence on the τ-u curve. For R ≤ 2 mm, the shear stress of the τ-u curve reaches a peak and remains basically unchanged, showing a more obvious linear shape. For R ≥ 4 mm, strain softening occurs after the shear stress of the τ-u curve reaches a peak.
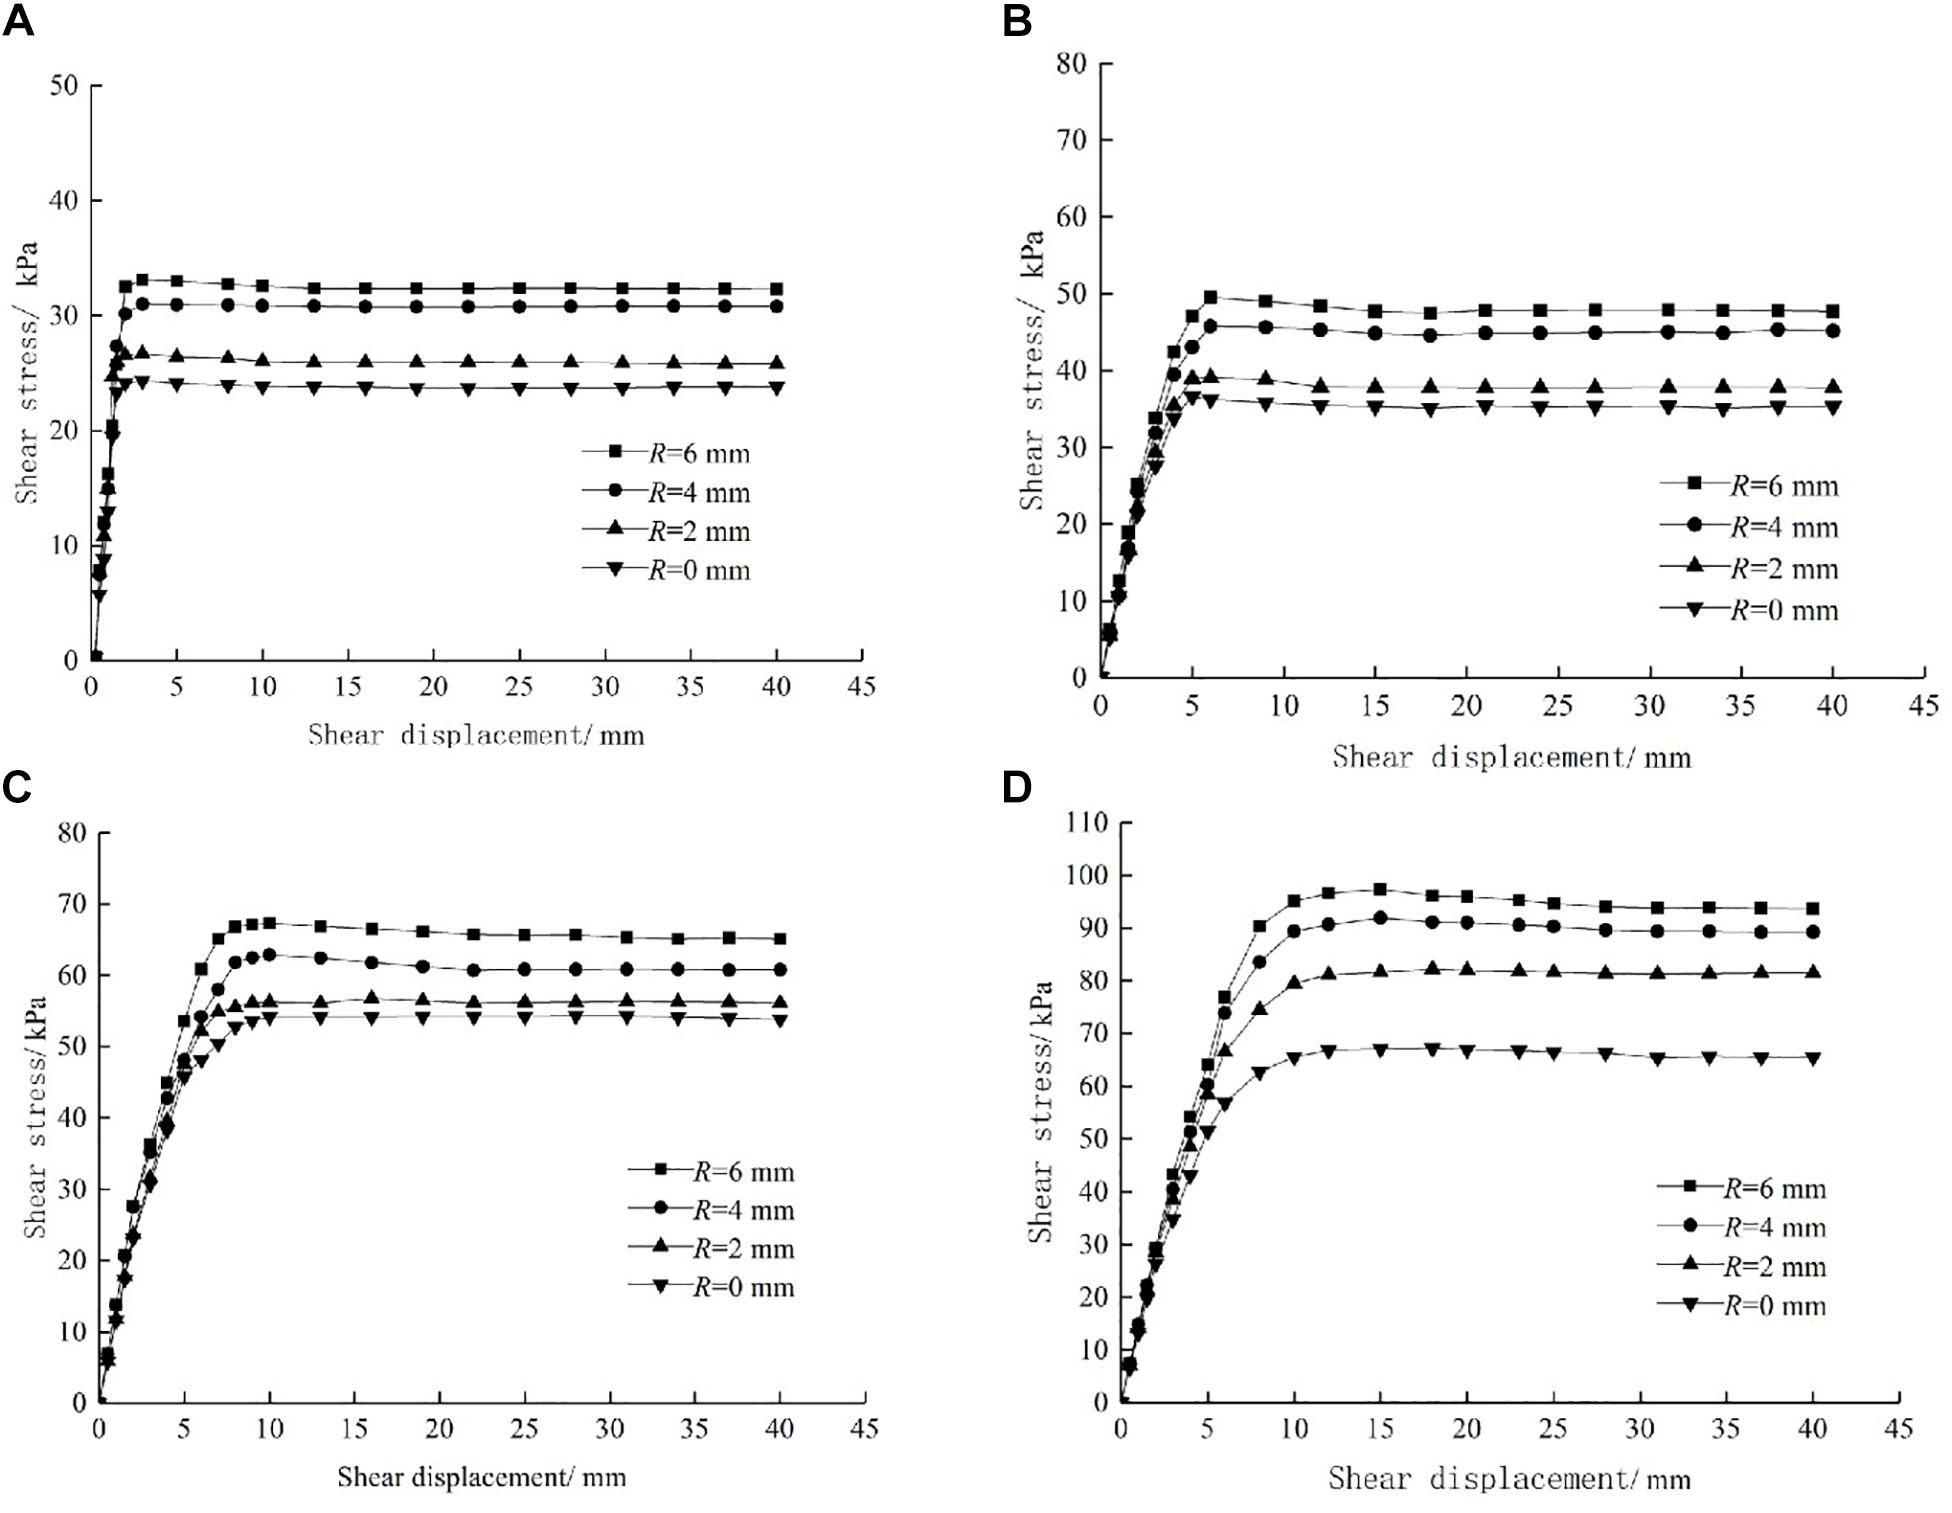
Figure 6. Shear-stress–shear-strain curves for given normal stress and varying roughness: (A) σ = 25 kPa; (B) σ = 50 kPa; (C) σ = 100 kPa; (D) σ = 150 kPa.
Pile–Soil Interface Shear Strength and Its Parameters
Figure 7A shows that (i) the shear strength at the PSI increases gradually with the roughness level and (ii) the difference in shear strength between different PSIs decreases with the normal stress. With increasing roughness, the growth rate of the cohesion first increases and then decreases, and the friction coefficient stabilizes gradually after growing linearly (see Figures 7B,C). Under the present experimental conditions, (i) the greater the normal stress, the less the roughness influences the shear strength of the PSI and (ii) the higher the roughness grade, the less the shear-strength parameters influence the PSI. These results are similar to those obtained by Liu et al. (2011).
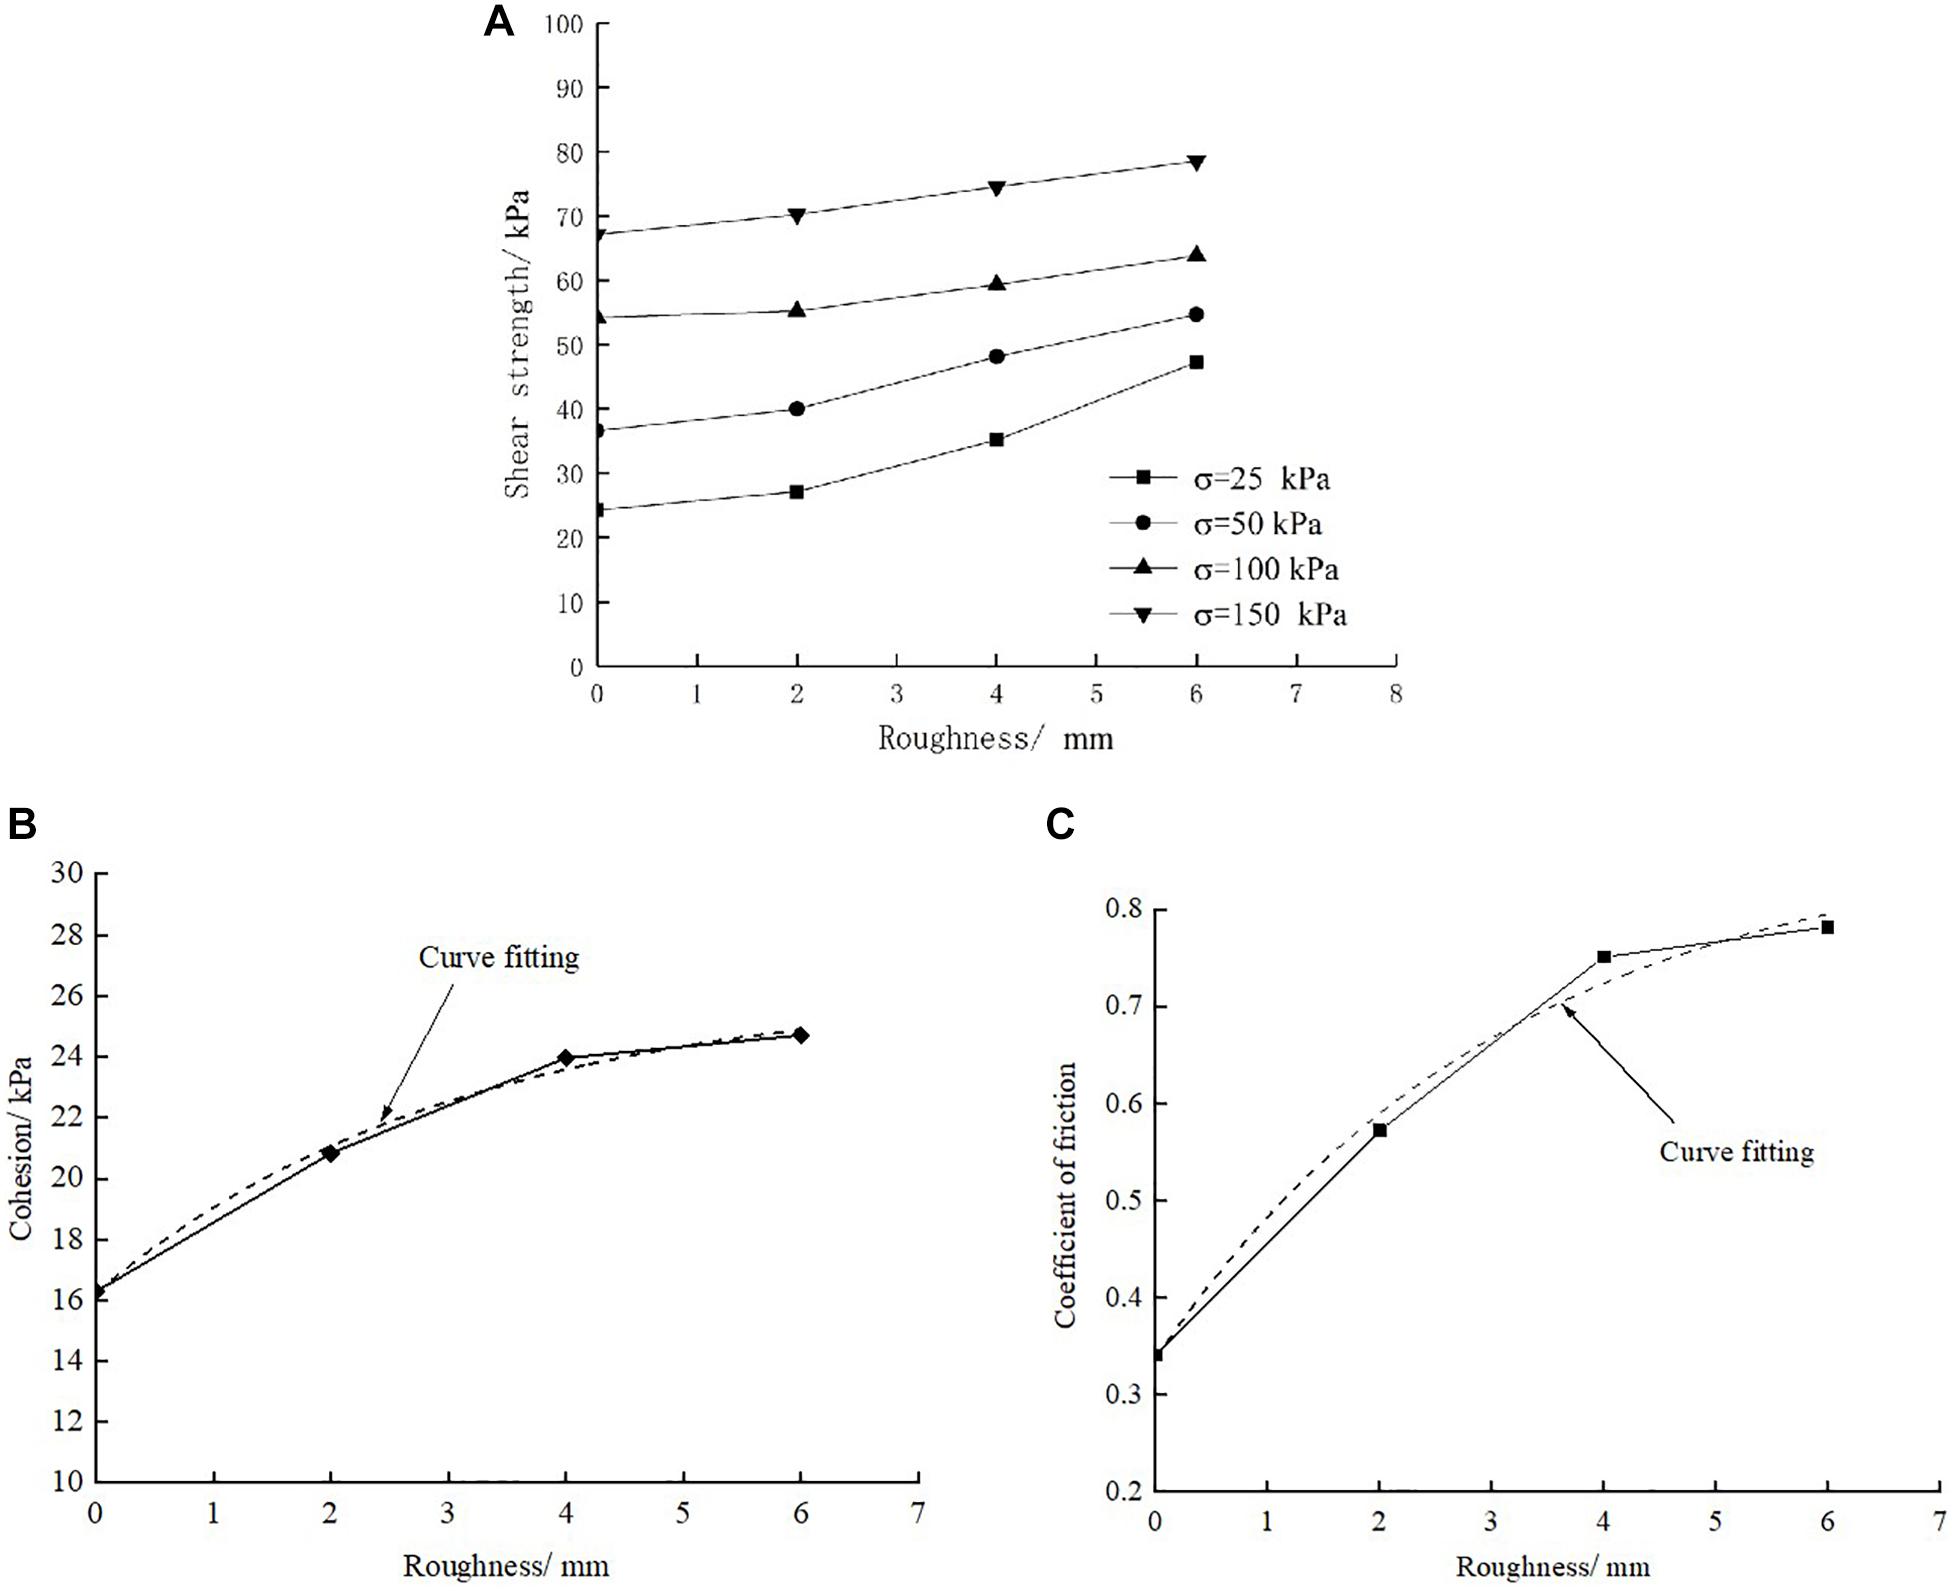
Figure 7. Interface shear strength and its parameters vary with roughness: (A) Relationship between shear strength and roughness; (B) Relationship between cohesion and roughness; (C) Relationship between coefficient of friction and roughness.
Some experts and scholars use the Mohr–Coulomb criterion (MCC) for shear failure (τ = σtanφ + c) to study the shear strength of contact surfaces (Zhao et al., 2012; Lu et al., 2013; Chen et al., 2016). From how the cohesion varies with roughness in Figure 7B, correlation analysis gives
Substituting that expression into the MCC gives
From Figure 7C, the relationship between the friction coefficient and the roughness is approximately exponential. The fitting coefficient is 0.97, and the function is
In summary, the MCC is obtained as
where τ is the shear stress, σ is the normal stress, φ is the angle of internal friction, and R is the roughness. The relationship between the shear stress and the roughness and normal stress is obtained, and the shear strength can be predicted based on the roughness and normal stress.
Influence of Water Content
Shear Stress Versus Shear Displacement
Figure 8 shows the τ-u curves of the PSI in cohesive soil with different values of water content. As can be seen, the PSI under various water content test conditions shear stress peak and shear failure displacement occurred. For a given water content, the larger the normal stress, the larger the maximum shear stress and the shear-failure displacement. For the highest water content ω of 28%, the τ-u curves exhibit insignificant strain softening. After the maximum shear stress, the strength decreases, enters the strain-softening stage, and finally stabilizes. For ω < 28%, the shear stress reached after the peak tends to be stable and the corresponding shear displacement continues to increase, showing typical elastoplastic deformation.
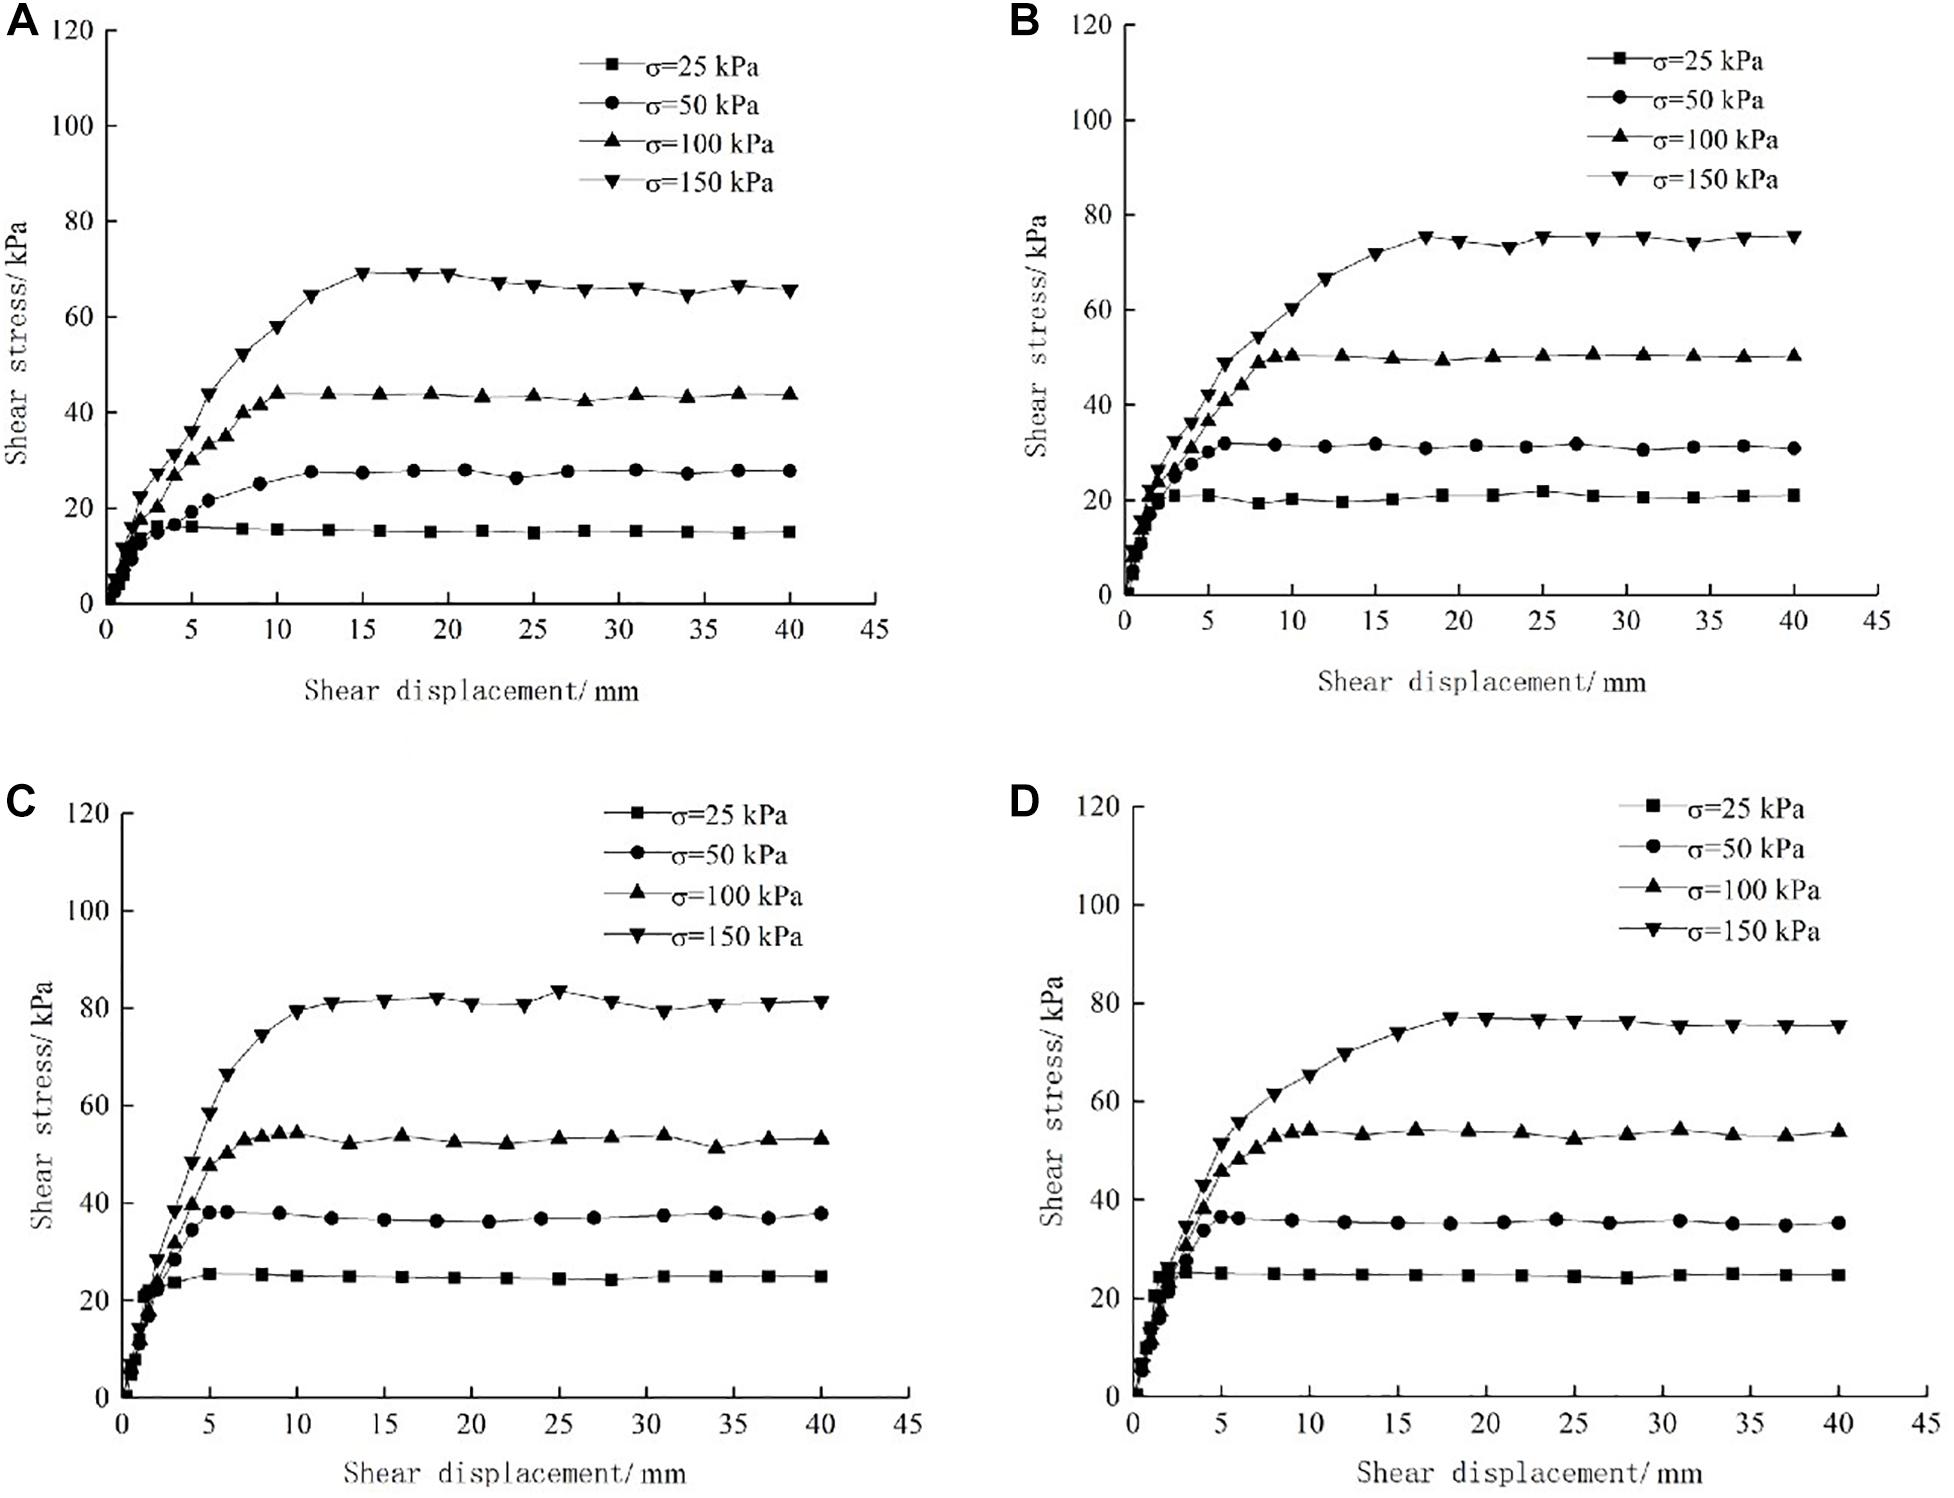
Figure 8. Shear-stress–shear-strain curves for given water content and varying normal stress: (A) ω = 18%; (B) ω = 20%; (C) ω = 25%; (D) ω = 28%.
Figure 9 shows the τ-u curves of water content change under different normal stresses, where again ω is the water content. The τ-u curves show the shear stress for different values of the normal stress. With increasing water content in the range investigated, the maximum shear stress decreases by 4.45–10.68 kPa and the shear-failure displacement increases by 1.67–6.73 mm. For a given normal stress, the initial slopes of the τ-u curves are basically the same, and the slope decreases with the water content. When the shear stress reaches a peak, the larger the water content, the smaller the peak value of the shear stress.
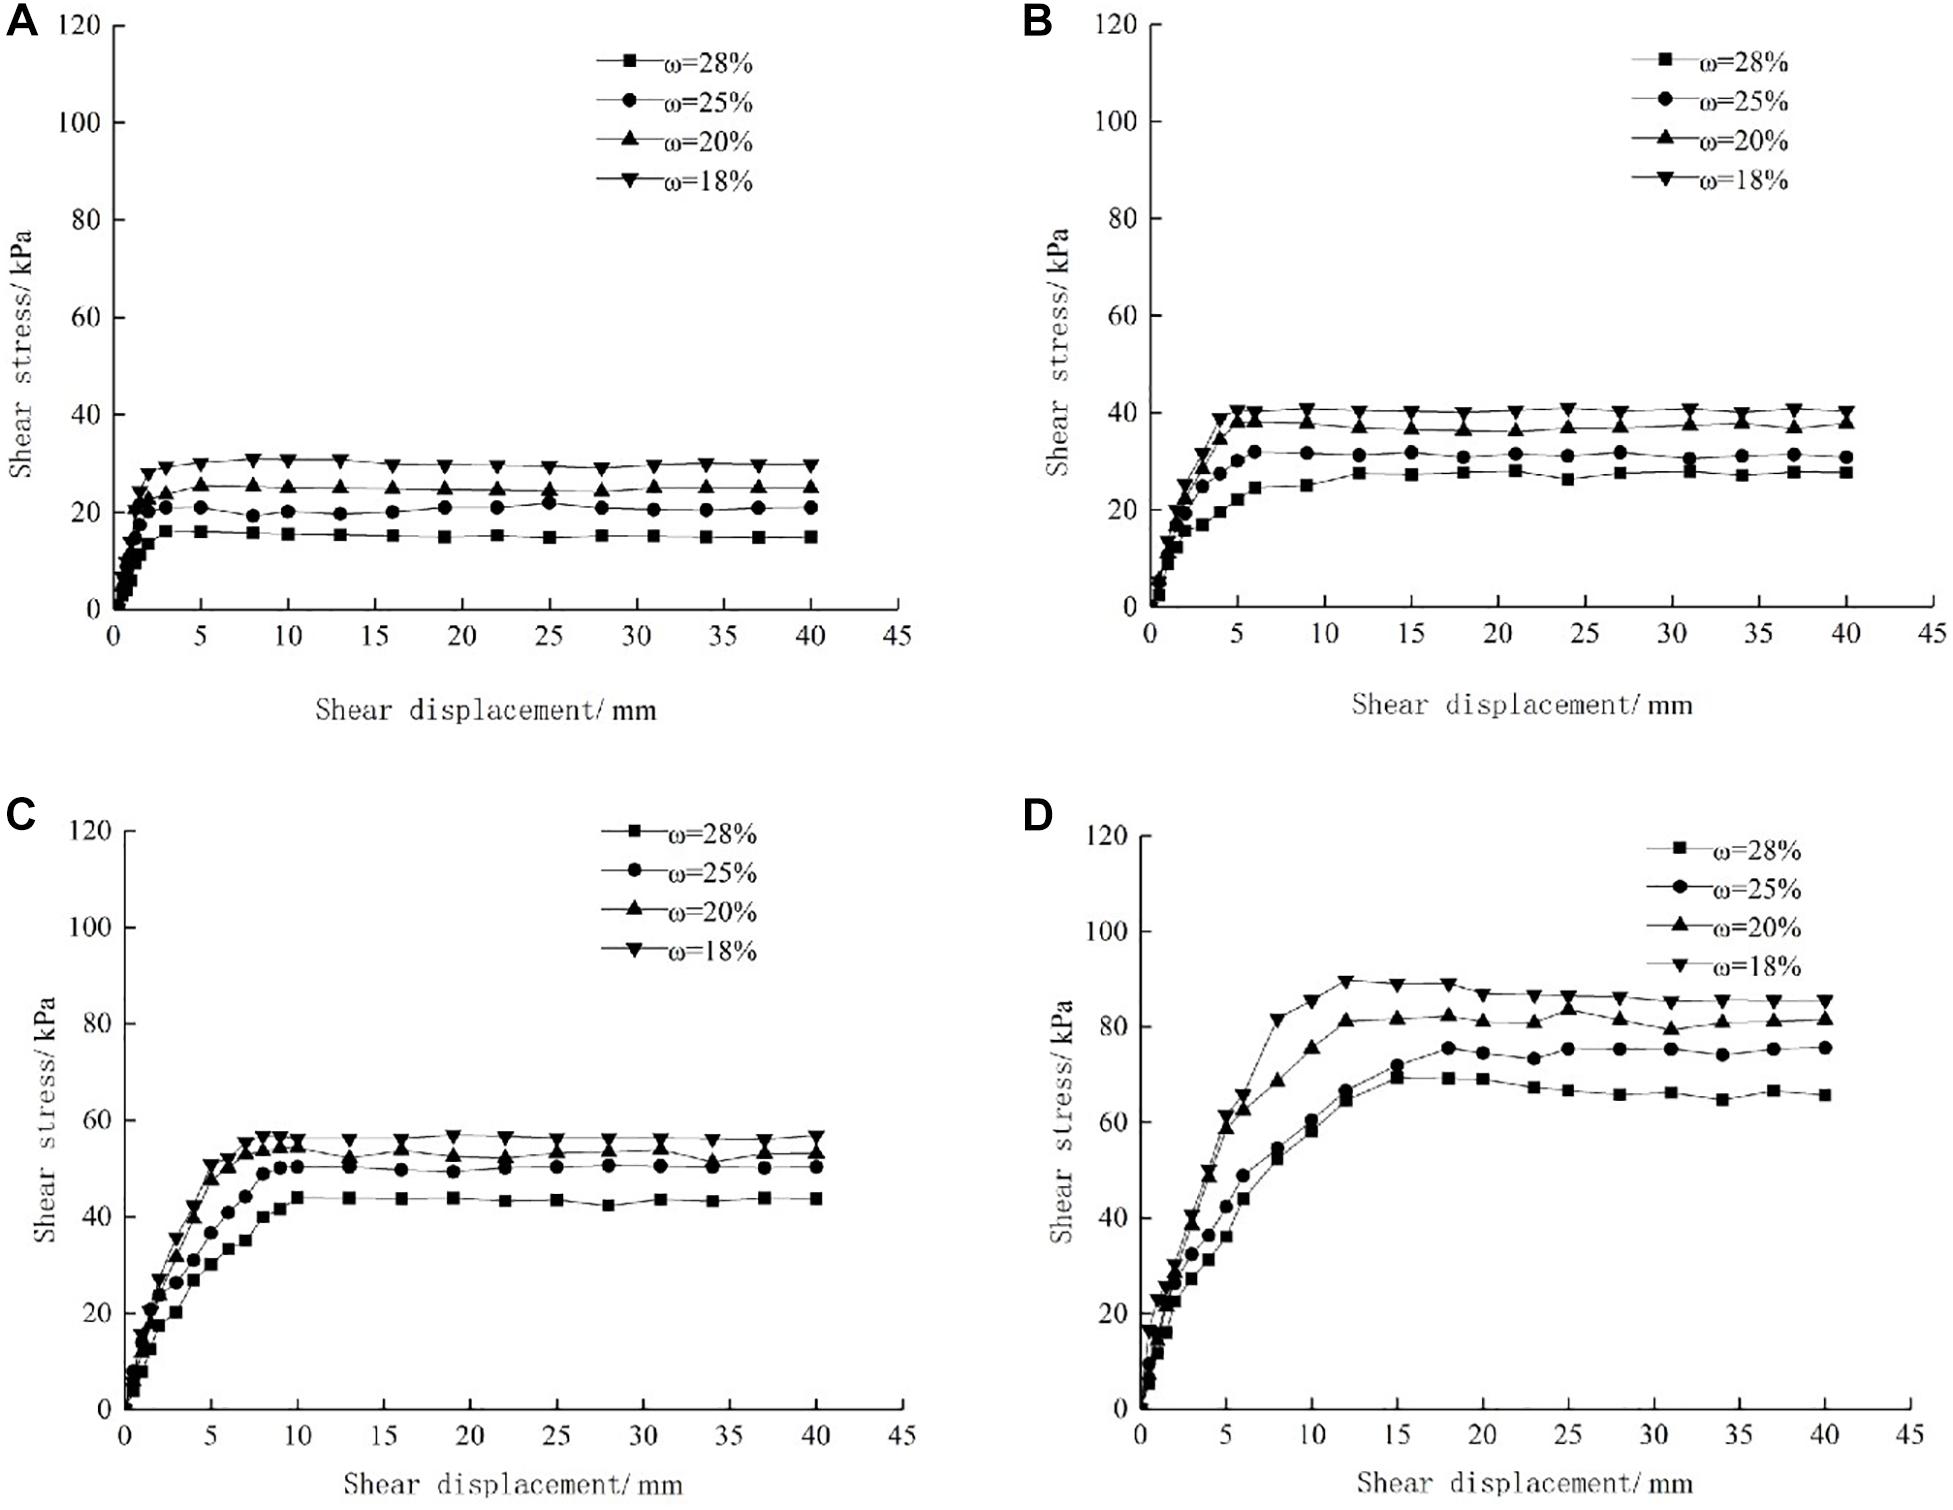
Figure 9. Shear-stress–shear-strain curves for given normal stress and varying water content: (A) σ = 25 kPa; (B) σ = 50 kPa; (C) σ = 100 kPa; (D) σ = 150 kPa.
Pile–Soil Interface Shear Strength and Its Parameters
The results of the direct shear tests show that the higher the water content, the lower the shear strength of the PSI (see Figure 10A). With increasing water content, the cohesive force increases initially and then decreases, reaching a maximum at a water content of 25% (see Figure 10B). This is the critical water content of the soil sample: at this value, the soil sample is in the plastic state and the bond with the pile is the best. With further increase in water content, there is likely to be water between the pile and the soil, and lubrication by this water film decreases the shear strength of the PSI (Wang et al., 2009). With increasing water content, the friction coefficient of the PSI decreases initially and then stabilizes, and the reduction is only around 5.5% (see Figure 10C). As can be seen, the water content mainly affects the cohesive force at the PSI, and the change in cohesion is the main reason for the change in the shear strength at the PSI.
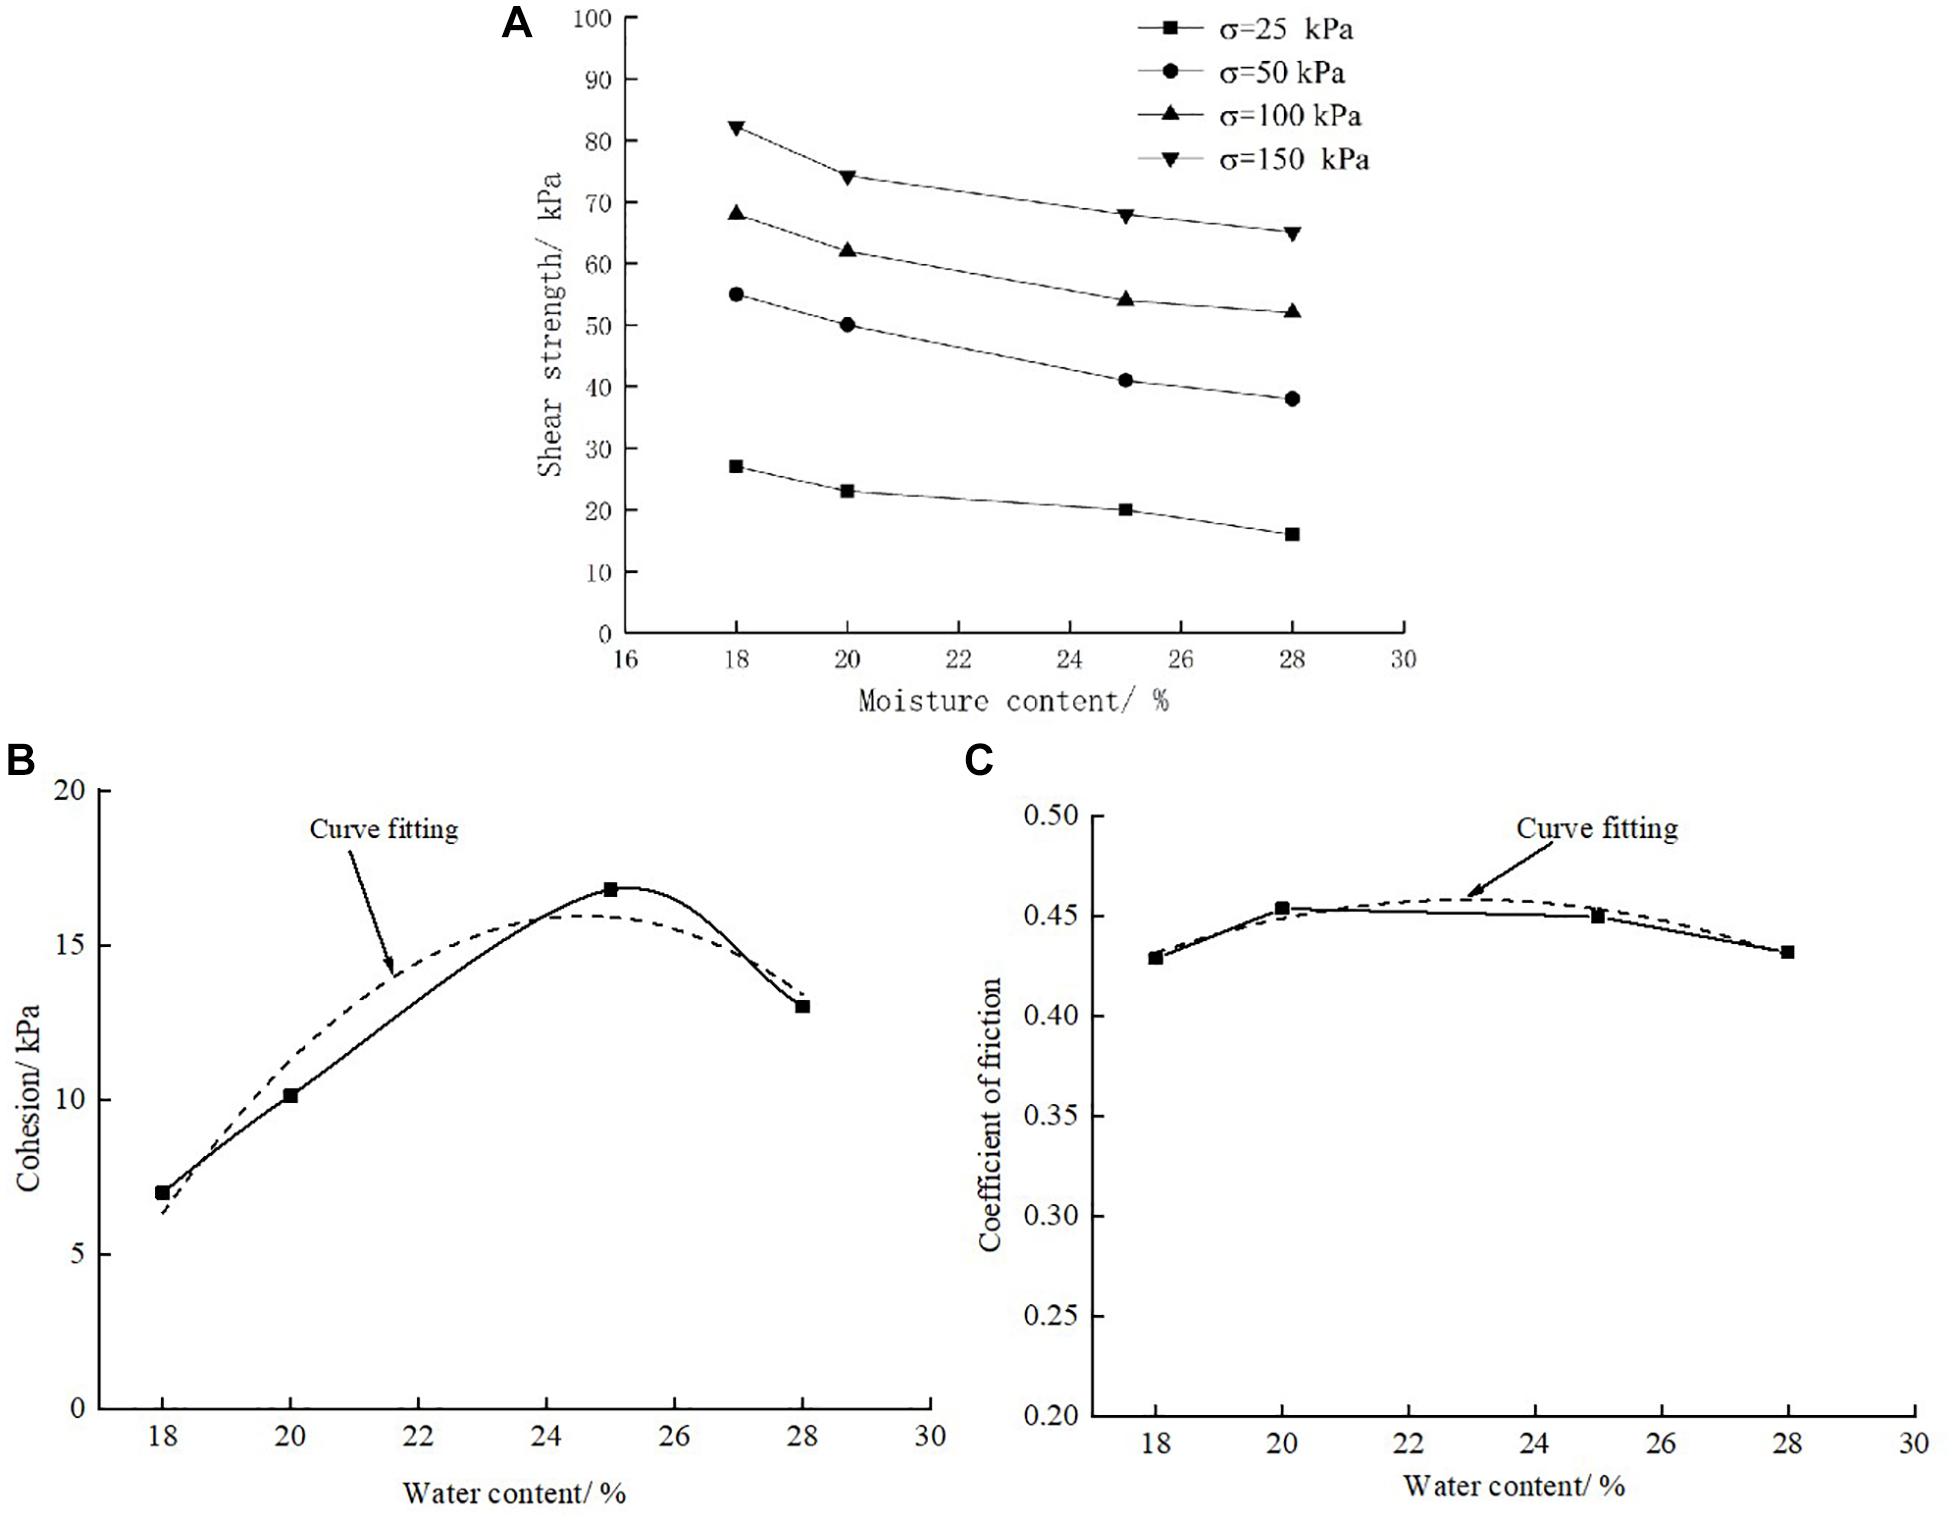
Figure 10. Interface shear strength and its parameters vary with moisture content: (A) Relationship between shear strength and water content; (B) Relationship between cohesion and water content; (C) Relationship between coefficient of friction and water content.
The curve in Figure 10B is approximately quadratic, and the fitting coefficient is 0.923. The expression of the fitted curve is
The relationship between the friction coefficient and water content in Figure 10C is also approximately quadratic. The fitting coefficient is 0.843, and the correlation is weak. The relational expression is
In summary, the MCC is obtained as
where ω is the water content, τ is the shear stress, v is the shear rate, and σ is the normal stress. As such, the shear strength can be predicted from the water content and normal stress. However, because the correlation degree of Eq. (6) is low, the prediction accuracy of Eq. (7) is lower than that of Eq. (4).
Influence of Shear Rate
Shear Stress Versus Shear Displacement
Figure 11 shows the τ-u curves of the PSI in cohesive soil at different shear rates. Take the same roughness grade R = 0 mm and the same water content as 28% as an example. As can be seen, at the same shear rate, the τ-u curve increases the shear stress peak and shear failure displacement with increasing normal stress. The greater the normal stress, the faster the shear stress peak and the shear failure displacement increase.
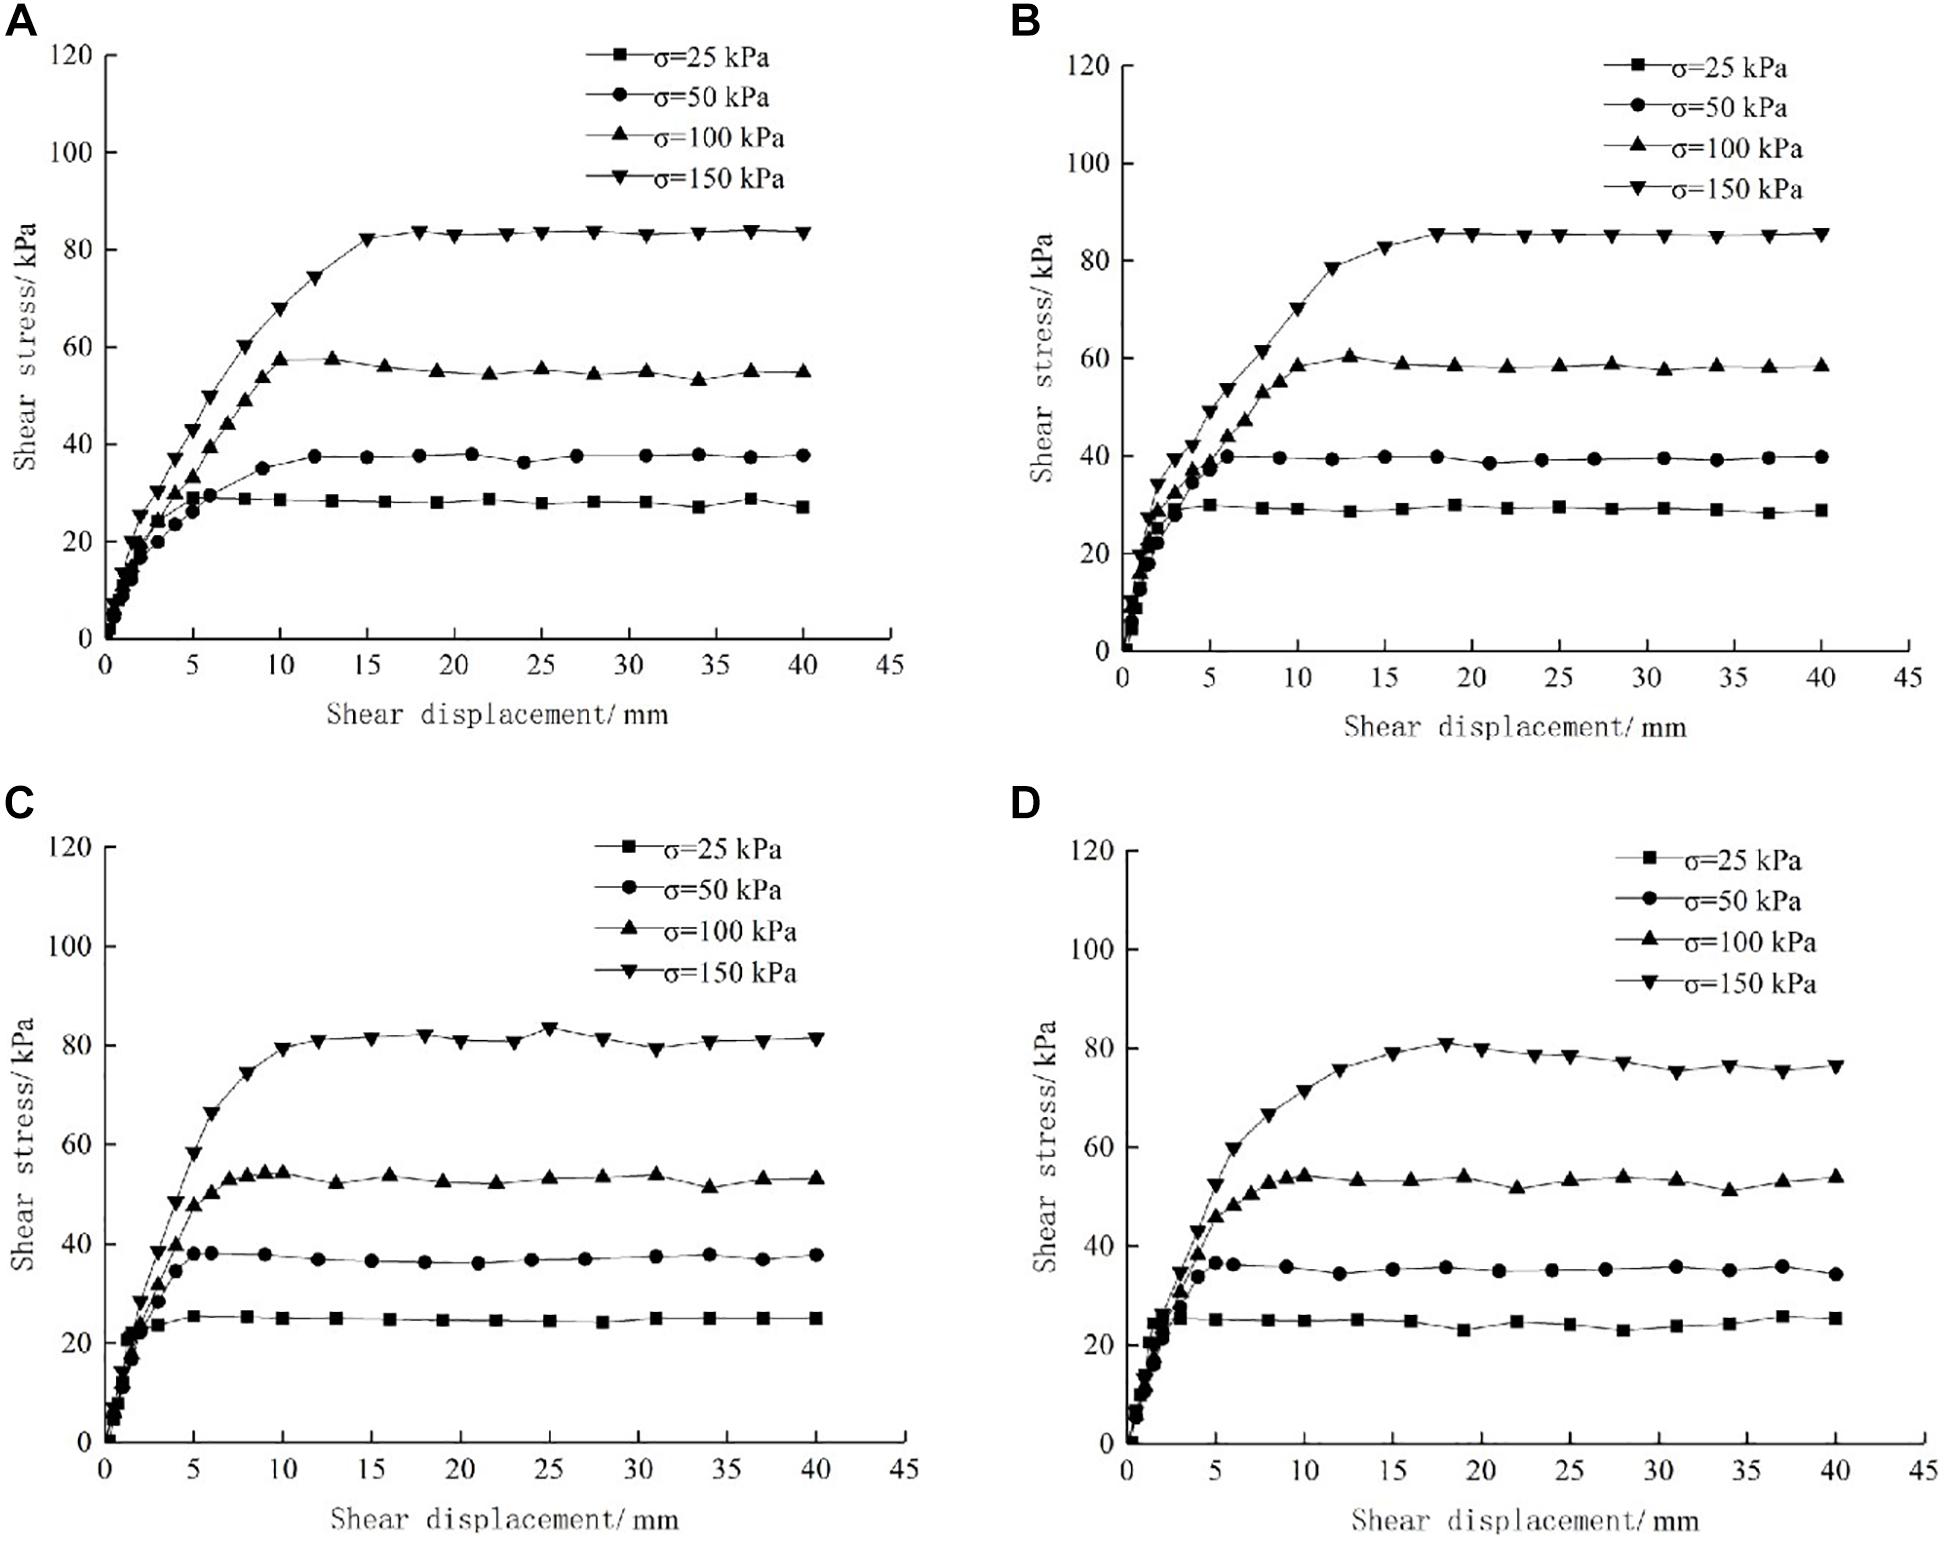
Figure 11. Shear-stress–shear-displacement curves for given shear rate and varying normal stress: (A) v = 0.4 mm/min; (B) v = 0.6 mm/min; (C) v = 0.8 mm/min; (D) v = 1.0 mm/min.
Figure 12 shows the variation of shear rate τ-u under different normal stresses. The shear rates are listed in each graph. As can be seen, for a given normal stress, the maximum shear stress does not change greatly with the shear rate, indicating that the shear rate has little effect on the maximum shear stress, and the shear-failure displacement corresponding to the maximum shear stress at the PSI does not change significantly. The τ-u curves of the PSI show a similar law at different shear rate; that is, the shear stress increases initially with the shear displacement and then becomes constant after reaching the maximum shear stress. Figure 12 shows that in the range of shear rate studied herein, the τ-u curves differ little, indicating that the shear rate has little effect on the mechanical shear properties of the PSI. This has also been verified in direct and ring shear tests of reinforced soil interfaces (Lu et al., 2013; Liu et al., 2016). How the shear rate affects the mechanical properties of the PSI requires further study.
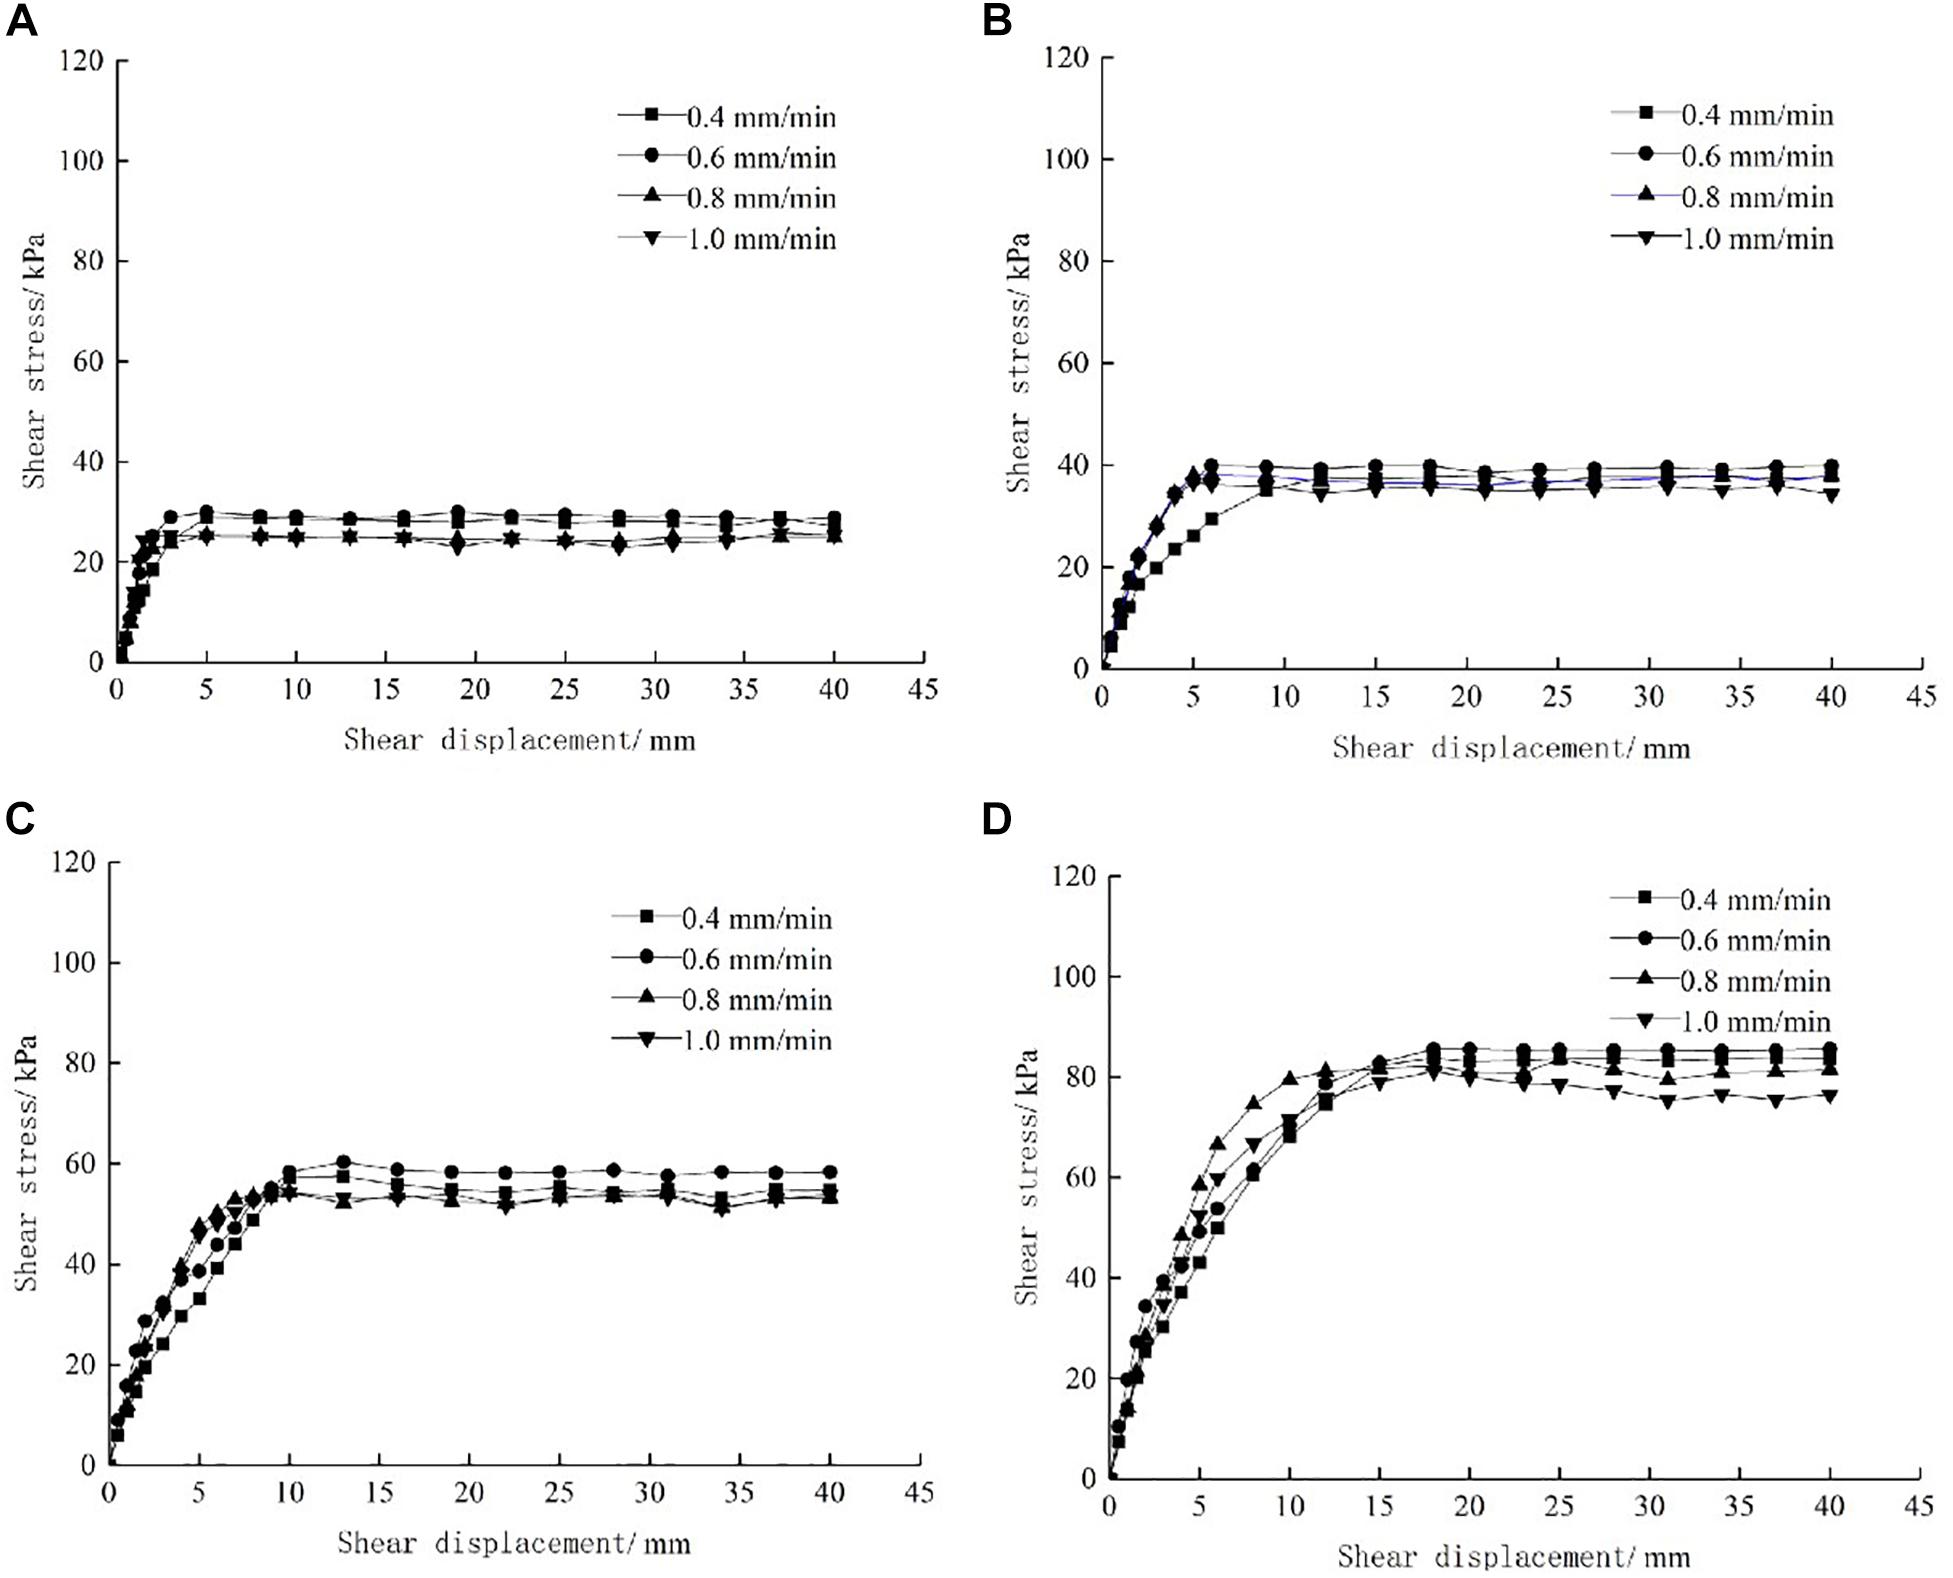
Figure 12. Shear-stress–shear-strain curves for given normal stress and varying shear rate: (A) σ = 25 kPa; (B) σ = 50 kPa; (C) σ = 50 kPa; (D) σ = 150 kPa.
Pile–Soil Interface Shear Strength and Its Parameters
The present results show that the shear strength decreases with the shear rate. When the normal stress σ is small, the shear strength decreases by less than 10%. For σ ≥ 100 kPa, the shear rate influences the shear strength of the PSI considerably, with the latter fluctuating by as much as 15% (see Figure 13A). The cohesion increases initially by 0.87 kPa with increasing shear rate and then decreases by 1.41 kPa with further increase (see Figure 13B). An increase in the shear rate results in a constant decrease in the coefficient of friction, but a smaller decrease (see Figure 13C). In actual engineering, the shear rate may cause excess pore water pressure, which then affects the PSI strength. However, it is difficult to simulate this process in the present experiment, which leads to the conclusion that the shear rate has little influence on the PSI shear strength.
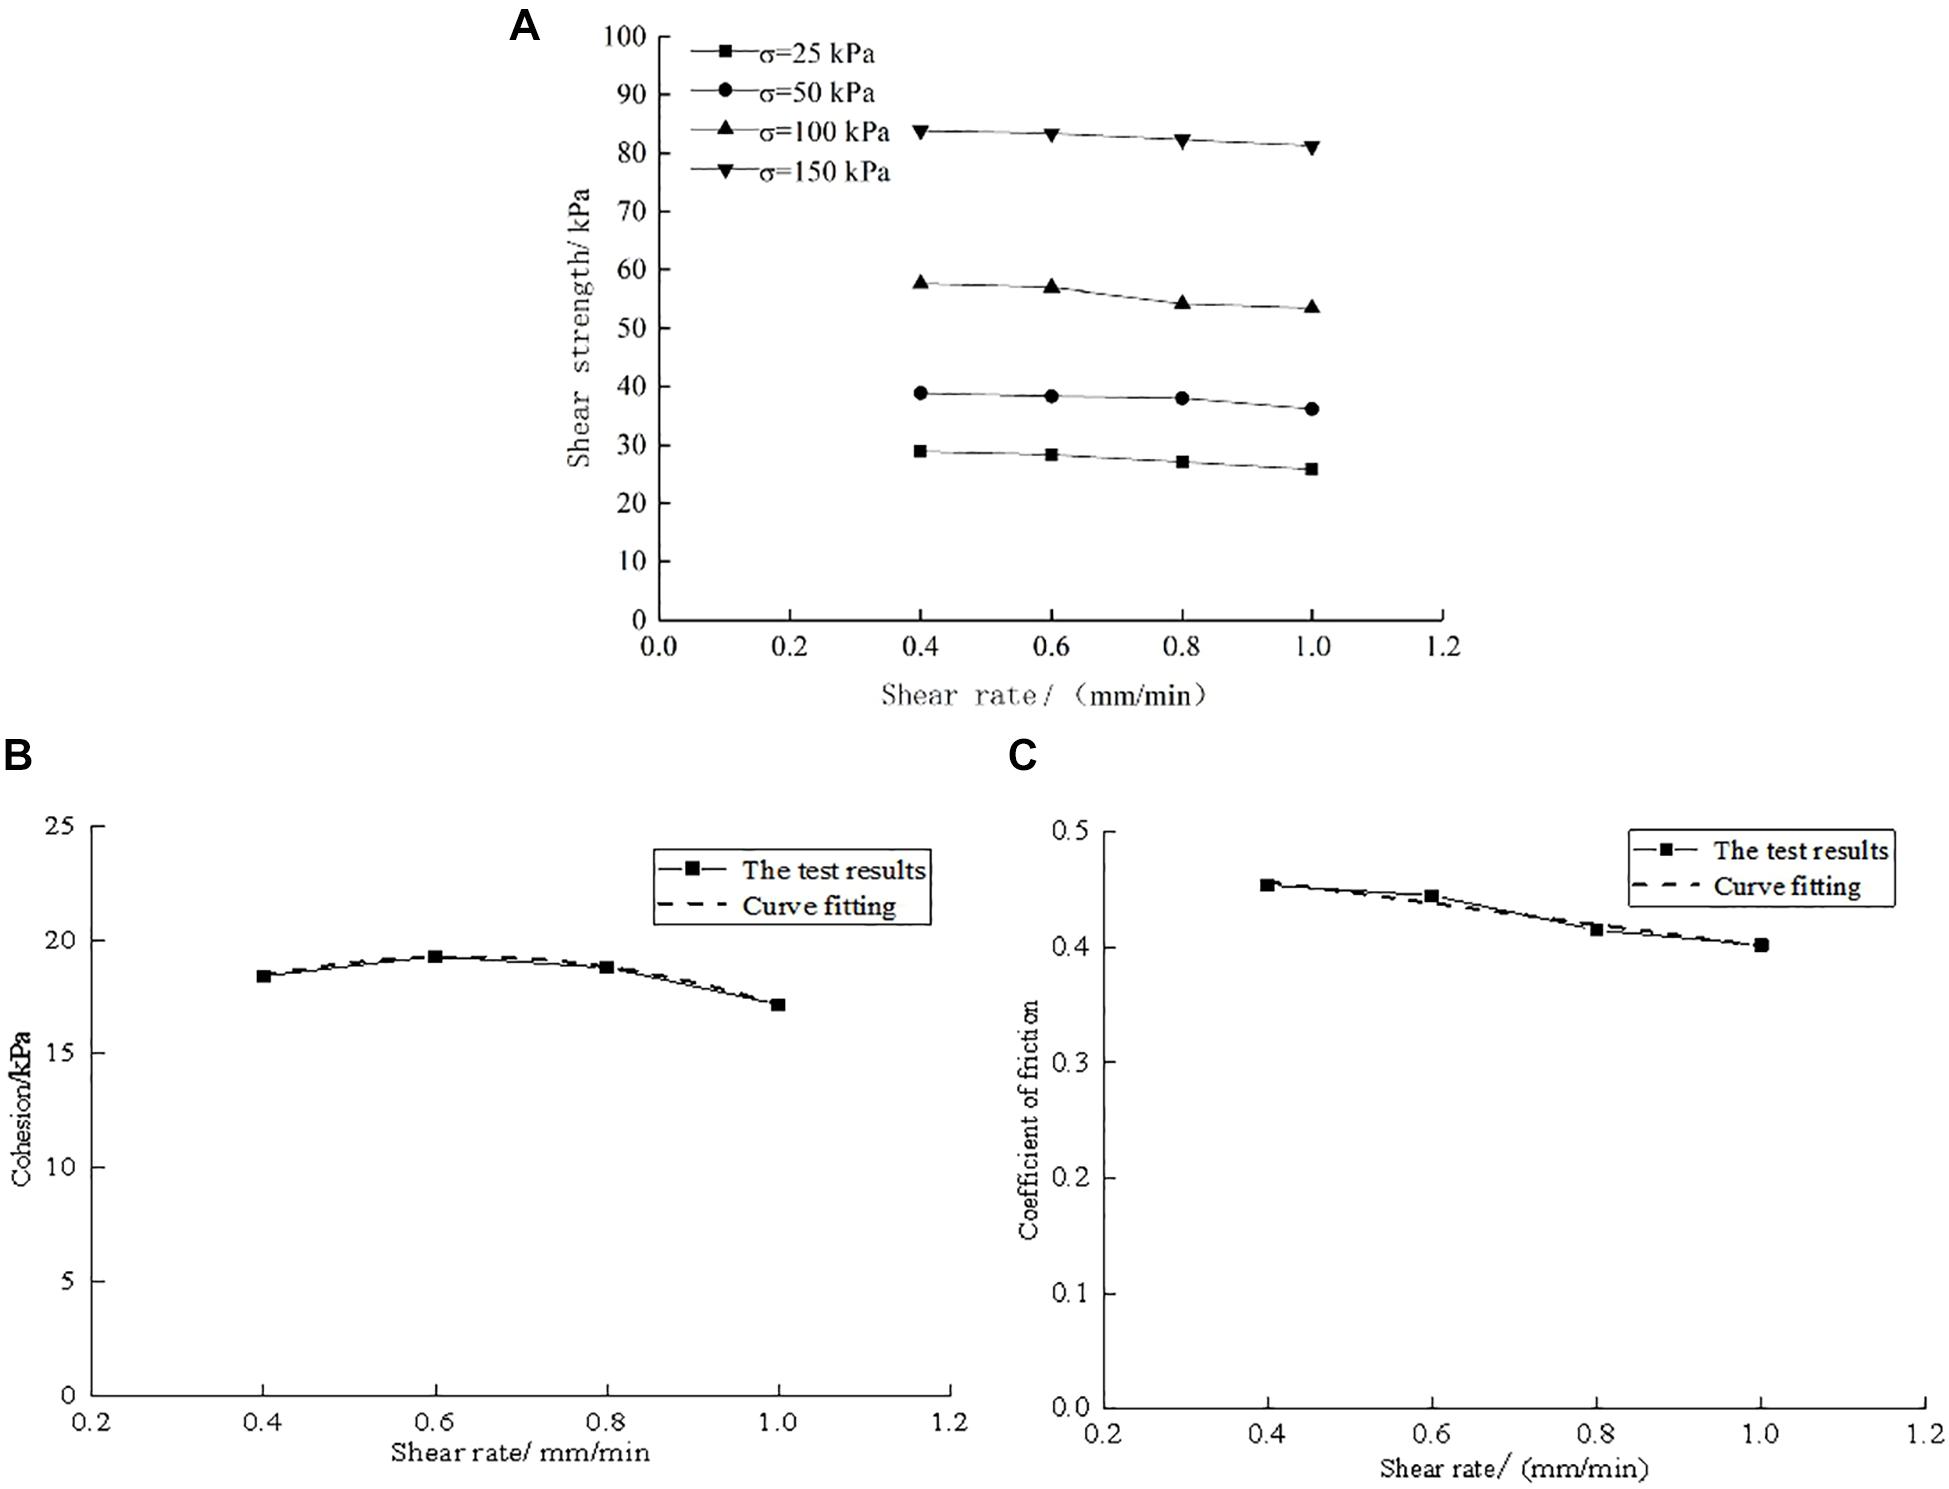
Figure 13. Interface shear strength and its parameters vary with shear rate: (A) Relationship between shear strength and shear rate; (B) Relationship between cohesion and shear rate; (C) Relationship between coefficient of friction and shear rate.
The curve of cohesive force versus shear rate in Figure 13B is approximately quadratic, and the fitting coefficient is 0.997. The fitted function is
From Figure 13C, the friction coefficient decreases with the shear rate, and the fitting coefficient is 0.937. The function is
In summary, the MCC is obtained as
where v is the shear rate, τ is the shear stress, and σ is the normal stress. As such, the shear stress can be predicted from the normal stress and the shear rate.
Conclusion
(1) The curves of shear stress versus shear displacement of the PSI have an obvious fold line shape, and strain softening is not obvious at the roughness levels considered herein. For a given normal stress, the PSI shear strength and its parameters increase with roughness. However, with increasing normal stress, the roughness has less effect on the PSI shear strength and its parameters.
(2) For high water content, the shear-stress–shear-displacement curves of the PSI show no obvious strain softening, while they show typical elastic–plastic deformation for low water content. The PSI shear strength decreases with the water content: the peak shear stress decreases and the shear-failure displacement increases. With increasing water content, the cohesion reaches its maximum value at a water content of 25% and the PSI friction coefficient decreases initially and then stabilizes.
(3) Within the present range, the shear rate has little influence on the mechanical shear properties of the PSI, and the shear strength has small reduction for smaller normal stress. The range of shear rate that affects the mechanical properties of the PSI requires further study.
(4) The shear strength of the PSI is affected by the three factors of roughness, water content, and shear rate of the contact surface. The degree of influence of each factor is related to the normal stress, indicating the lateral frictional resistance is affected by the soil pressure on the pile sides during pile penetration. With increasing pile penetration depth, the soil pressure on the pile sides becomes the main reason for the increasing pile resistance.
In summary, in this paper, the factors influencing the shear characteristics of PSI in clay soil were studied. The results show that roughness, water content and shear rate are related to cohesion and friction coefficient. Therefore, affecting the interface shear mechanical characteristics of piles and soil. It provides a theoretical basis for further study of shear mechanical properties of the interface between clay and structure.
Data Availability Statement
All datasets generated for this study are included in the article/supplementary material.
Author Contributions
SS wrote the manuscript. YW and XB prepared the test. MZ designed the test process and ideas.
Funding
This research was financially supported by the National Natural Science Foundation of China (51708316, 51778312, and 51809146), and Shandong Province Emphasis Research Program, China (2017GSF16107, 2018GSF117010, and 2018GSF117008).
Conflict of Interest
The authors declare that the research was conducted in the absence of any commercial or financial relationships that could be construed as a potential conflict of interest.
References
Airey, D. W., and Kelly, R. B. (2010). “Interface behaviours from large diameter ring shear tests. Characterization and Behavior of Interfaces,” in Proceedings of Research Symposium on Characterization and Behavior of Interfaces (Amsterdam: IOS Press).
Canakci, H., Hamed, M., Celik, F., Sidik, W., and Eviz, F. (2016). Friction characteristics of organic soil with construction materials. Soils and Found. 56, 965–972. doi: 10.1016/j.sandf.2016.11.002
Chen, J. H., Zhang, J. S., and Li, J. (2016). Experimental esearch on mechanical characteristics of cohesive soil-structure interface by considering its roughness. J. Central South University (Science and Technology) 47, 1682–1688.
Clough, G. W., and Duncan, J. M. (1971). Finite element analyses of retaining wall behavior. J. Soil Mech. Found. Division 97, 1657–1673.
Desai, C. S., and Drumm, E. C. (1985). Cyclic testing and modeling of interfaces. J. Geotech. Eng. 111, 793–815. doi: 10.1061/(asce)0733-9410(1985)111:6(793)
Fakharian, K., and Evgin, E. (1997). Cyclic simple-shear behavior of sand-steel interfaces under constant normal stiffness condition. J. Geotech. Geoenvironmental Eng. 123, 1096–1110.
Guo, J. H., Yu, H. X., and Zhao, W. B. (2000). Characteristics study of the interface between soil and concrete by using large size single shear apparatus and numerical analysis. China Civ. Eng. J. 33, 42–46.
Guo, P. (2008). Modified direct shear test for anisotropic strength of sand. J. Geotech. Geoenvironmental Engineering 134, 1311–1318. doi: 10.1061/(asce)1090-0241(2008)134:9(1311)
Hu, L. M., and Pu, J. L. (2001). Experimental study on mechanical characteristics of soil-structure interface. Chinese J. Geotech. Eng. 23, 431–435.
Jewell, R. A. (1989). Direct shear tests on sand. Geotechnique 39, 309–322. doi: 10.1680/geot.1989.39.2.309
Liu, F. C., Shang, S. P., and Wang, H. D. (2011). Study of shear properties of silty clay-concrete interface by simple shear tests. Chinese J. Rock Mech. Eng. 30, 1720–1728.
Liu, F. Y., Wang, P., Wang, J., and Cai, Y. (2016). Cyclic and post-cyclic shear behavior of sand-geogrid interface under different shear rates. Rock Soil Mech. 35, 387–395.
Lu, Y., Zhou, G. Q., Xia, C. H., and Wang, P. S. (2013). Effect of shape scale on characteristics of coarse grained soil-structural in-terface under medium and high pressures. Rock Soil Mech. 34, 3491–3499.
Lutenegger, A., Hallberg, G., Yong, R., and Townsend, F. (1981). “Borehole Shear Test in Geotechnical Investigations,” in Laboratory Shear Strength of Soil, eds R. Yong and F. Townsend (West Conshohocken, PA: ASTM International), 566–578.
Potyondy, J. G. (1961). Skin friction between various soils and construction material. Geotechnique 11, 339–353. doi: 10.1680/geot.1961.11.4.339
Quinteros, V. S., Dyvik, R., and Mortensen, N. (2017). Interface friction angle soil-on-steel from ring shear tests on offshore north sea sands. Geotech. Front. 2017, 358–367.
Ramsey, N., Jardine, R., Lehane, B., and Ridley, A. (1998). “A review of soil-steel interface testing with the ring shear apparatus. Offshore Site Investigation and Foundation Behaviour’ New Frontiers,” in Proceedings of an International Conference (London, UK: Society of Underwater Technology).
Rebelo, K. M. W. (2003). Resistência de Interface entre geomembranas e solos através do ensaio de Ring Shear. Escola de Engenharia de São Carlos. São Carlos: Universidade de São Paulo.
Reddy, E. S., Chapman, D. N., and Sastry, V. (2000). Direct shear interface test for shaft capacity of piles in sand. Geotech. Test. J. 23, 199–205.
Sun, T., Hong, Y., Luan, M., and Chen, R. (2009). Shear strength behavior of overconsolidated clay in ring shear tests. Rock Soil Mech. 30, 2000–2010.
The National Standards Compilation Group of People’s Republic of China, (1999). GB/T50123-1999 Standard for soil test method. Beijing: China Planning Press.
Wang, W., Lu, T. H., Zai, J. M., and Sun, B. X. (2009). Negative shear test on soil-concrete interface using simple shear apparatus. Rock Soil Mech. 30, 1303–1306.
Wang, Y., Guo, P., Dai, F., and Li, X. (2018). Behavior and modeling of fiber-reinforced clay under triaxial compression by combining the superposition method with the energy-based homogenization technique. Int. J. Geomech. 18:04018172. doi: 10.1061/(asce)gm.1943-5622.0001313
Wang, Y., Guo, P., Lin, H., and Li, X. (2019). Numerical analysis of fiber-reinforced soils based on the equivalent additional stress concept. Int. J. Geomech. 19:04019122. doi: 10.1061/(asce)gm.1943-5622.0001504
Wang, Y. X., Guo, P. P., Ren, W. X., and Yuan, B. X. (2017). Laboratory investigation on strength characteristics of expansive soil treated with jute fiber reinforcement. Int. J. Geomech. 17:04017101. doi: 10.1061/(asce)gm.1943-5622.0000998
Xu, C., and Meng, F. X. (2010). Effects of shear rate and material properties on shear strength of geosynthetic-soil interface. Rock Soil Mech. 31, 3101–3106.
Xu, X. F., Wei, H. Z., and Meng, Q. S. (2013). Effects of shear rate on shear strength and deformation characteristics of coarse-grained soils in large-scale direct shear tests. Chinese J. Geotech. Eng. 35, 728–733.
Yang, Y. L., Zhu, J. G., Yu, T., and Wu, X. (2009). Experimental study on mechanical behaviour of soil-structure interface by ring shear test. Rock Soil Mech. 30, 3256–3260.
Yuan, B., Sun, M., Wang, Y., and Zhai, L. (2019a). Full 3D displacement measuring system for 3D displacement field of soil around a laterally loaded pile in transparent soil. Int. J. Geomech. 19:04019028. doi: 10.1061/(asce)gm.1943-5622.0001409
Yuan, B., Xiong, L., Zhai, L., Zhou, Y., Chen, G., Gong, X., et al. (2019b). Transparent synthetic soil and its application in modeling of soil-structure interaction using optical system. Front. Earth Sci. 7:276. doi: 10.3389/feart.2019.00276
Yuan, B., Sun, M., Xiong, L., Luo, Q., Pradhan, S. P., Li, H., et al. (2020). Investigation of 3D deformation of transparent soil around a laterally loaded pile based on a hydraulic gradient model test. J. Build. Eng. 28:101024. doi: 10.1016/j.jobe.2019.101024
Yuan, B., Xu, K., Wang, Y., Rui, C., and Qingzi, L. (2016). Investigation of deflection of a laterally loaded pile and soil deformation using the PIV technique. Int. J. Geomech. 17:04016138. doi: 10.1061/(asce)gm.1943-5622.0000842
Zhao, C. F., Gong, H., and Zhao, C. (2012). Elastoplastic analysis of interface between clay and concrete considering effect of normal stress history. Chinese J. Rock Mech. Eng. 31, 848–855.
Keywords: clay soil, pile–soil interface, mechanical characteristics, roughness, water content, shear rate
Citation: Zhang M, Sang S, Wang Y and Bai X (2020) Factors Influencing the Mechanical Characteristics of a Pile–Soil Interface in Clay Soil. Front. Earth Sci. 7:364. doi: 10.3389/feart.2019.00364
Received: 25 November 2019; Accepted: 30 December 2019;
Published: 22 January 2020.
Edited by:
Yixian Wang, Hefei University of Technology, ChinaReviewed by:
Mohammed Y. Fattah, University of Technology, IraqBingxiang Yuan, Guangdong University of Technology, China
Copyright © 2020 Zhang, Sang, Wang and Bai. This is an open-access article distributed under the terms of the Creative Commons Attribution License (CC BY). The use, distribution or reproduction in other forums is permitted, provided the original author(s) and the copyright owner(s) are credited and that the original publication in this journal is cited, in accordance with accepted academic practice. No use, distribution or reproduction is permitted which does not comply with these terms.
*Correspondence: Yonghong Wang, aG9uZzc5ODZAMTYzLmNvbQ==