 Xiang Zhou
 Jiangteng Li
 Hang Lin
- School of Resources and Safety Engineering, Central South University, Changsha, China
In order to reveal the internal stress distribution and failure characteristics of a pre-existing cylindrical cavity in granite under triaxial cyclic loading, bonded particle models containing a cavity were established to investigate the variation in crack propagation, stress distribution, number of micro-cracks, elastic modulus, and Poisson’s ratio with an increase in cavity diameter. The results show that the cavity diameter has a significant effect on the tensile cracks, compression-shear failure zone, and compressive stress distribution. The peak strength decreases as the diameter of the cavity increases. However, the number of cracks increases and the plastic deformation increases more obviously. With the increase of the cyclic axial stress, the decrease rate of the elastic modulus shows the rule of “first slow, fast later,” and the Poisson’s ratio increases. The distribution of local stress of σ1,σ2, andσ3 explains the behavior of the cracks around the cylindrical cavity well.
Introduction
In the process of rock mass excavation and mineral mining (Yang et al., 2017; Wang et al., 2019; Zhang et al., 2019; Zhao et al., 2019b), an excavation damage zone will be formed in the surrounding rock within a certain range of the cave (Salehnia et al., 2015). In order to provide a theoretical basis for the stability and safety of rock masses in engineering contexts, physical experiments and scanning electron microscopy (SEM), Computed Tomography (CT), Acoustic emission (AE), and numerical simulation have been carried out on artificial jointed rock (Zhao et al., 2017b; Peng et al., 2019b; Zhao et al., 2019a) or rock-like materials (Zhao et al., 2016; Lin et al., 2019a).
Several studies have looked at rocks with a prefabricated cavity. According to laboratory experiments and numerical simulations conducted by Fakhimi et al. (2002), Huang et al. (2018), and Zhao et al. (2014), it can be concluded that the failure characteristics and crack propagation are determined by the shape, size, and angle of the prefabricated holes. Zhao et al. (2011) proposed the failure strength model of brittle materials with a pre-existing open hole defect, derived a modified Sammis–Ashby model, which can be used to calculate the peak strength of brittle material, and adopted a progressive elastic damage method, realistic failure process analysis (RFPA), to verify the modified model and simulate the damage process. Teng et al. (2018) used CT scanning to study the mechanical properties and fracture propagation of anchored rock with a hole under uniaxial compression. The results demonstrated that the supporting structure enhances the strength of the specimens greatly. Liu et al. (2015) used the Acoustic Emission (AE) technique and moment tensor (MT) analysis to study the spatiotemporal evolution of micro-cracks and the behavior of the ratios of three-mode cracks of coarse-grained granite samples with circular openings under uniaxial compression. The results showed that shear cracks are dominant, as the ratio is more than 40% of the total number of events, tension cracks are fewer, accounting for more than 30% of the total events, and mixed-mode cracks make up the smallest proportion. Lei et al. (2018) and Tao et al. (2018) used a split Hopkinson pressure bar (SHPB) to perform dynamic compressive tests on plate-shaped marble specimens with a single circular or elliptical cavity. The results showed that the axial tensile crack parallel to the loading direction and the X-shaped shear crack around the hole are the main factors leading to the damage of the samples. When specimens contain elliptical holes, the eccentricity and the angle between the loading direction and the long axes influence the cracking behavior and dynamic strength under impact loading.
In the case of multi-cavity rocks and fracture-hole rocks, Zhang et al. (2018) and Fan et al. (2018) carried out uniaxial compression tests for the numerical modeling of two circular holes with different angles of the center connection line of the holes. The mechanical behavior and acoustic emission (AE) characteristics of the defective rock materials were analyzed comprehensively, and the damage evolution law was studied. Chen et al. (2017) carried out uniaxial compression experiments on sandstone samples containing double fissures and a single circular hole and studied the effects of rock bridge angle and crack angle on the mechanical properties and fracture evolution characteristics. Wang and Tian (2018) established a variety of defective coal-rock specimens containing fractures with different inclinations and holes with different positions using PFC2D software and discussed the characteristics of stress-strain and the crack evolution law of coal-rock with different fracture-holes under uniaxial compression.
The study of rocks with a prefabricated cavity has not been limited to a single direction. Xie et al. (2011) conducted systematic experimental studies of rock specimens with a pre-existing circular opening under uniaxial, biaxial, and triaxial loading conditions and analyzed the failure process of the samples by means of numerical simulation. The results showed that the compressive strength of the specimen increases little under the action of biaxial compression but is greatly improved under triaxial compression. Zhu et al. (2005) employed a numerical code called RFPA (rock failure process analysis) to simulate the progressive fracturing processes around underground excavations under biaxial compression. The simulation results showed that the code cannot only generate a fracturing mode similar to that in previous research results but also predict the fracturing mode under various loading conditions. On this basis, the failure mechanism under different loading conditions was determined. Jia and Zhu (2015) discussed the factors affecting the failure pattern and failure mechanism of zonal disintegration around underground excavations under tri-axial stress and applied the RFPA3D code to study how the zonal disintegration develops under different triaxial stress conditions as well as its failure mechanism.
From the research work in the previous literature, it can be found that the fracture evolution of rocks with a prefabricated cavity under cyclic loading has rarely been reported. Therefore, in this paper, cyclic incremental loading and unloading tests (Zhao et al., 2017a) are carried out to investigate the crack propagation and failure characteristics of granite with a prefabricated cavity.
Establishment and Verification of Numerical Model and Micro-Parameters
Bonded Particle Model
The synthetic rock mass model was established by PFC software. The macroscopic mechanical behavior of the numerical model is determined by the contact model and the microscopic parameters of the particles. There are two models of bond contact between particles: the contact bond model and the parallel bond model. In the parallel bond model (Mas Ivars et al., 2011), particles are bonded together by a parallel bond that provides normal stiffness and shear stiffness at the contact point of the particles. The microcosmic diagram of the bonded particle model (BPM) (Potyondy and Cundall, 2004) and the mechanism of parallel bonds under normal and shear loads are shown in Figure 1. When the normal tensile stress or shear stress exceeds its respective parallel bond strength, the bond breaks, the parallel bond spring is removed, interface behavior changes back to the zero-length interface, and then the micro-cracks continue to propagate to form a macroscopic fracture. The bonded particle model (BPM) makes the inter-particle force transfer and micro-crack propagation more reasonable. Therefore, the bonded particle model shows good performance for the crack propagation and mechanical behavior of brittle rock materials.
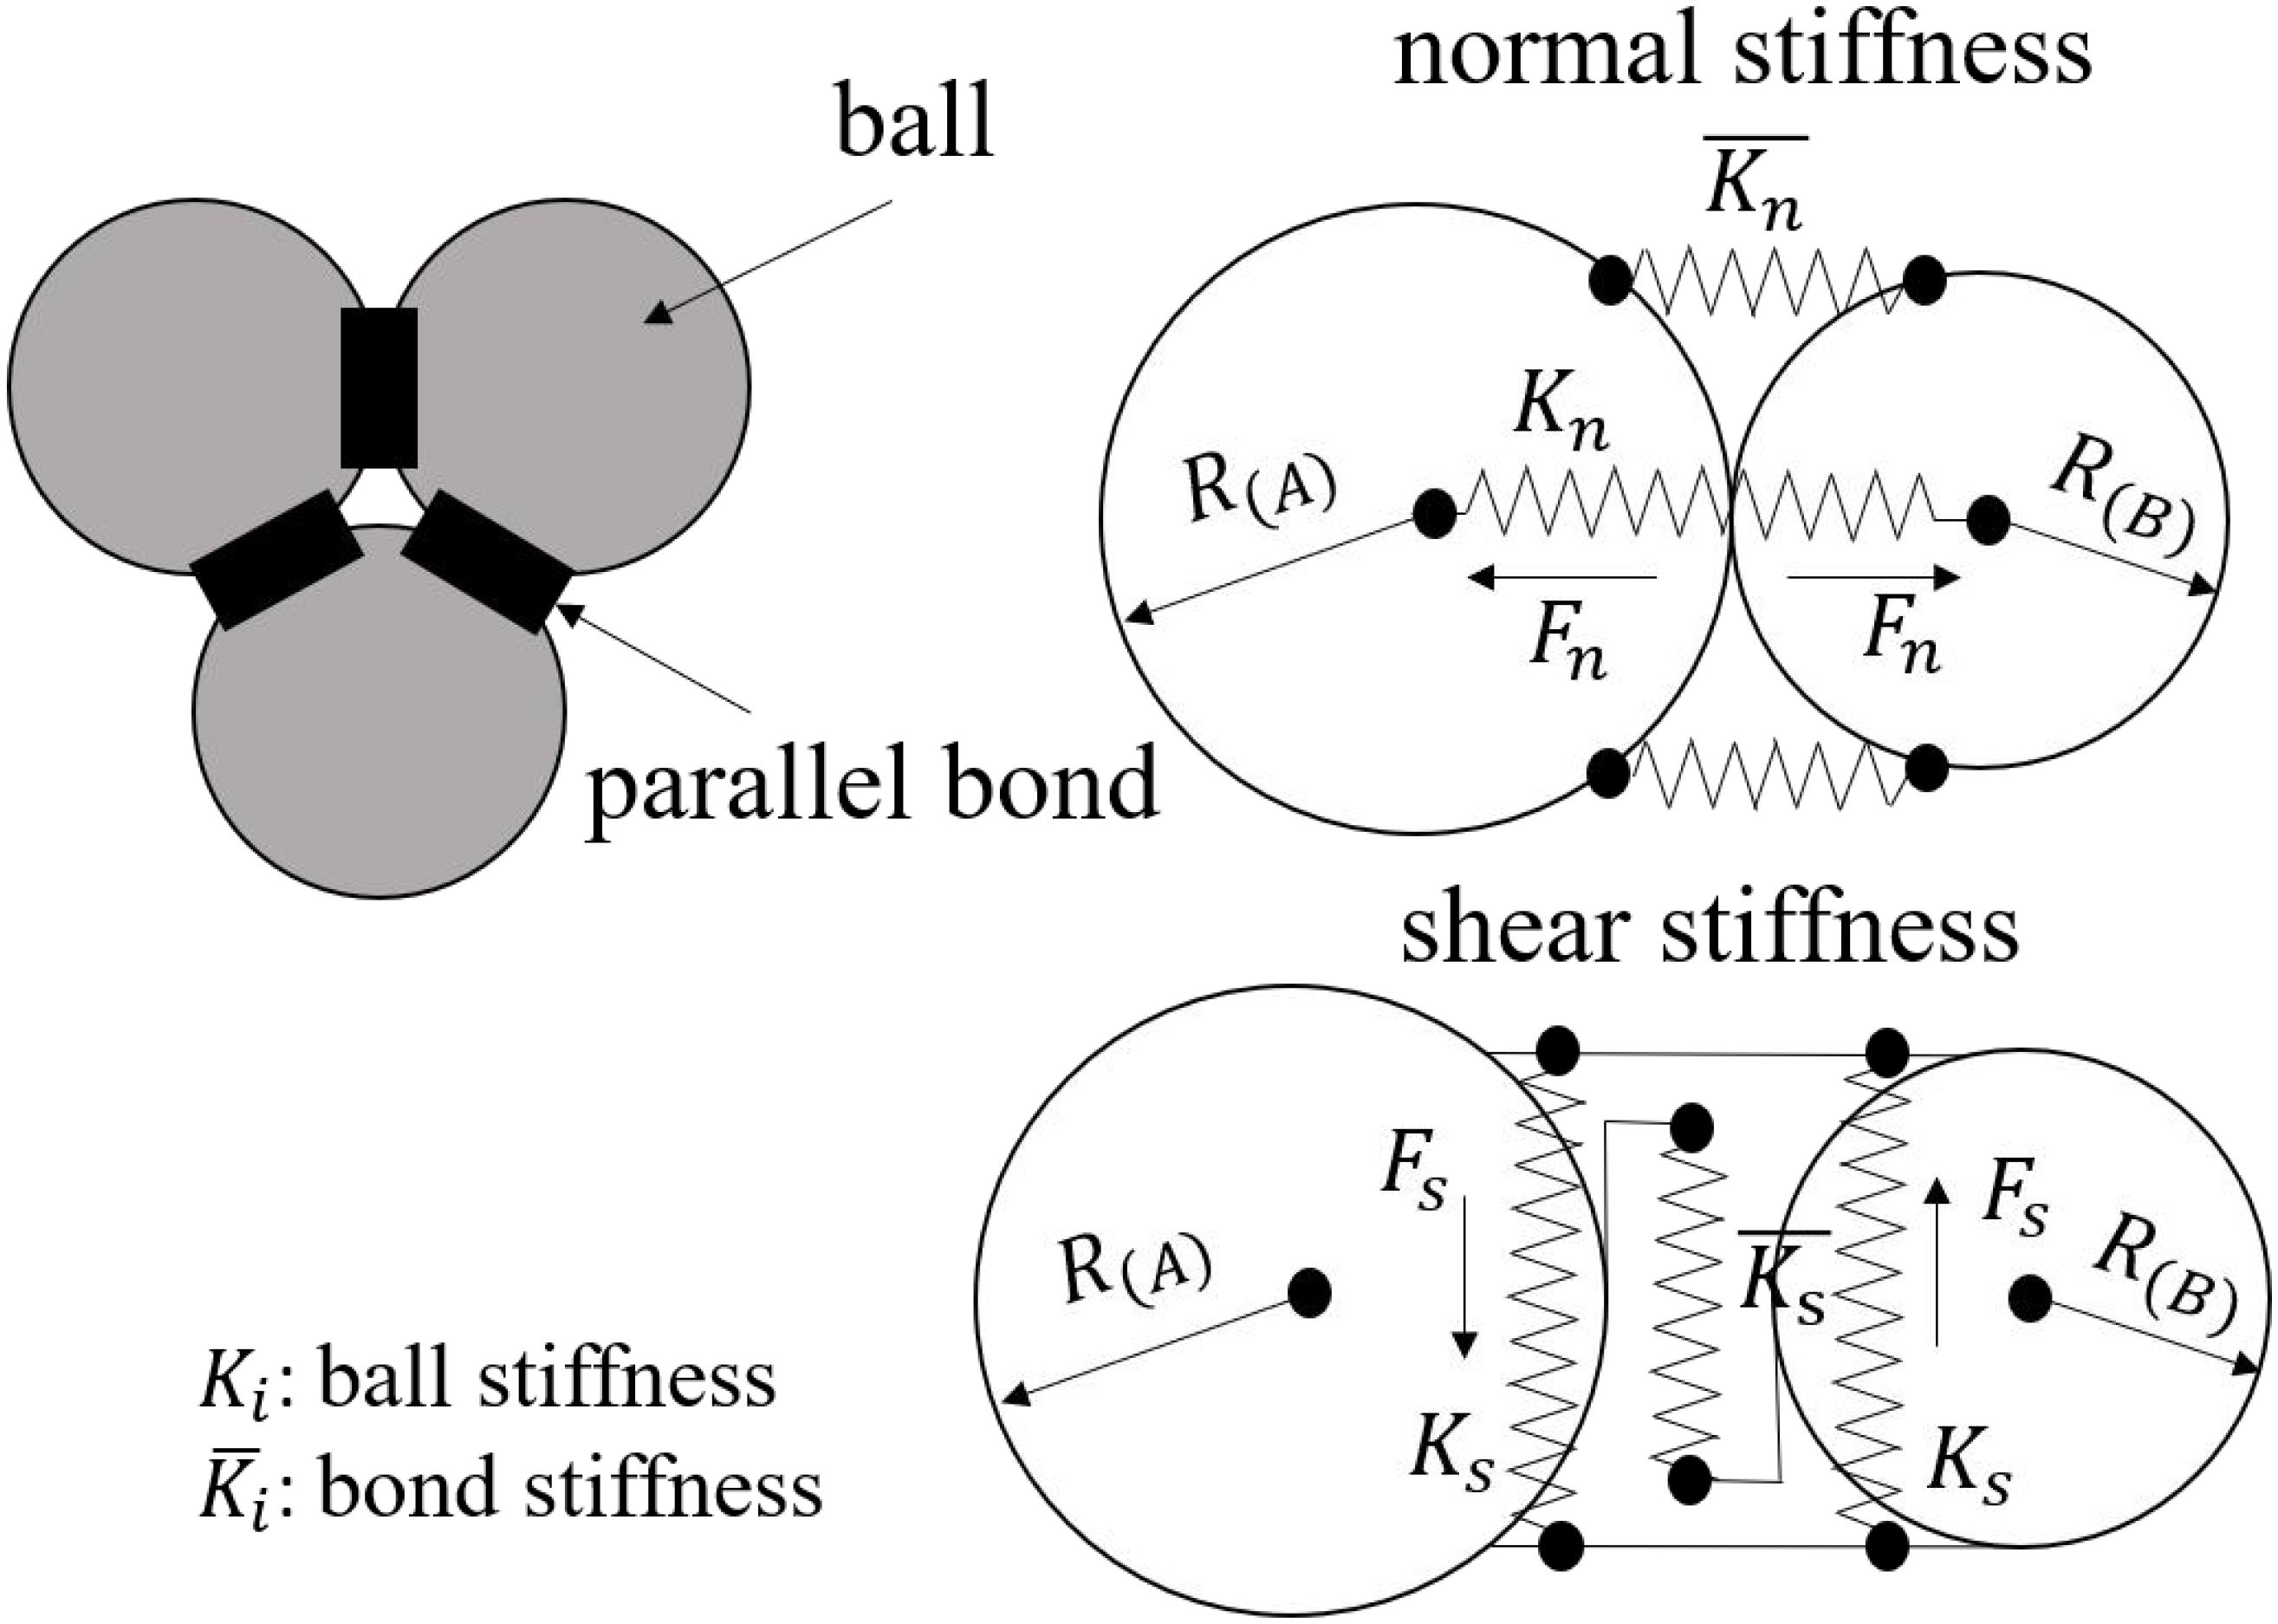
Figure 1. Schematic representation of the BPM and the mechanisms of parallel bonds.
Numerical Model
In the present study, particle flow code (PFC3D) was used to conduct numerical simulation research on the granite with a cavity model under triaxial cyclic loading. A BPM model with a geometric size of 200 × 100 × 100 mm (height × length × width) was established, and a through-cavity with a diameter of 20, 30, or 40 mm was generated in the center of the model, as shown in Figure 2. The serial numbers of the specimens were set as listed in Table 1. Particle size is mainly determined by minimum particle size (Rmin) and particle size ratio (Rmax/Rmin). It is necessary to consider the effect of particle size distribution (Ding et al., 2014; Lin et al., 2019b). On the premise of reasonably reflecting the sizes in granites and in order to improve the efficiency of the numerical calculation, a total of 46940 particles with particle sizes ranging from 1.5 to 2.49 mm were generated in the specimen. Displacement loading was used as the loading method, and the loading rate was set to 0.1 m/s. It should be noted that there are essentially different loading rates between PFC and laboratory tests, which are converted by a time-stepping algorithm.

Figure 2. Sample model containing a single circular cavity (unit: mm).
Table 1. Serial numbers of the specimens.
Micro-Parameter Calibration
According to the laboratory test results for lac du Bonnet granite with a cavity under uniaxial compression presented by Carter et al. (1991), a set of suitable micro-parameter values (Table 2) was determined by “trial and error” calibration. The macroscopic mechanical properties of the numerical model established by this set of micro-parameters should be similar to those indicated by the laboratory test. In order to verify the correctness of the micro-parameters of the numerical model, a uniaxial compression test and tensile test were carried out on the numerical model of an intact sample (size of 200 × 200 × 60 mm). As listed in Table 3, the macroscopic mechanical properties of the numerical model of intact samples, UCS, Elastic modulus, and Poisson’s ratio, are in good agreement with the laboratory experimental results of Carter et al. (1991). The deviation degrees are 0.88, 2.10, and 1.2%, respectively. Although the deviation degree of tensile strength is 9.3%, it is still less than 10%, and the deviation is within a reasonable range. In order to further verify the reliability of the micro-parameters, Figure 3 shows the crack propagation during the failure process of a pre-existing cylindrical cavity in granite. The simulated crack propagation is basically analogous to the experimental results.
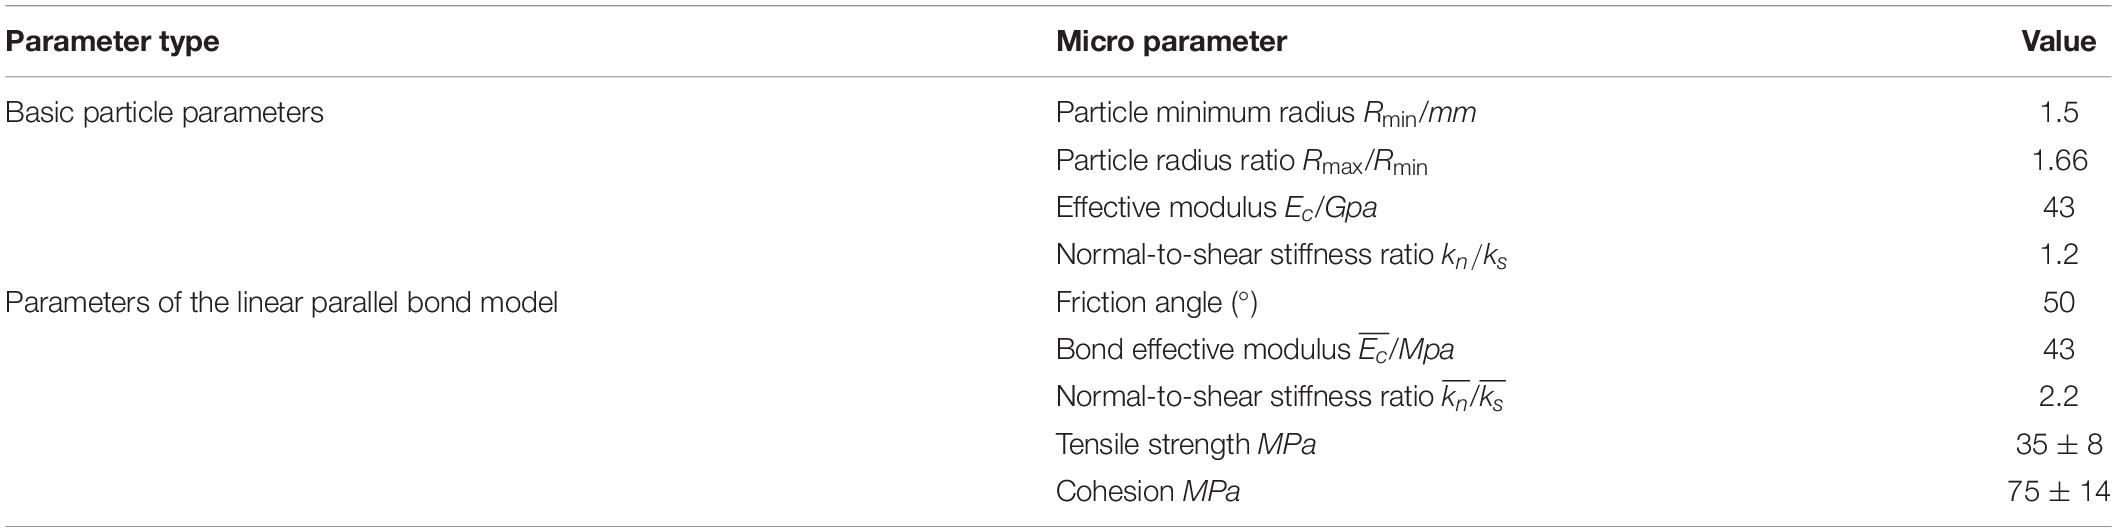
Table 2. Microscopic parameters of the simulated numerical model.
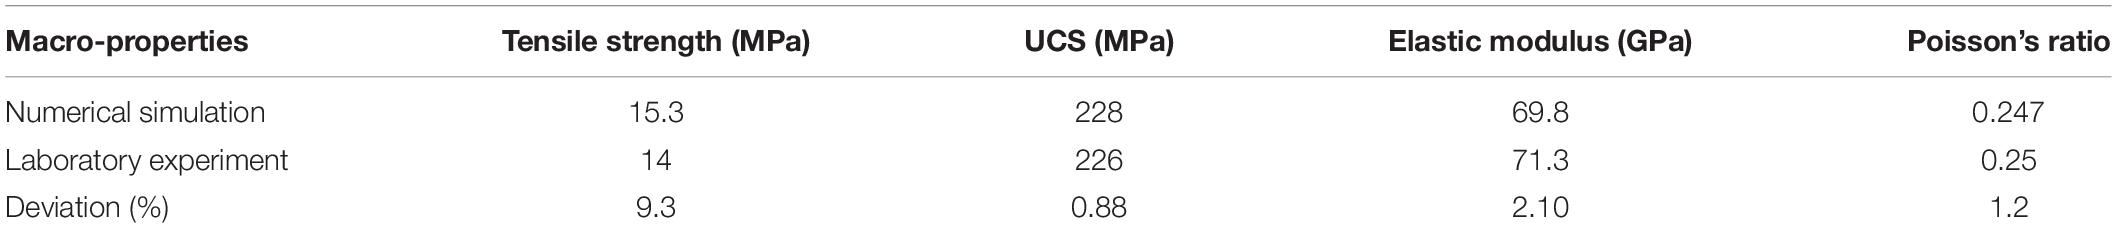
Table 3. Comparison of macro-properties determined by numerical simulation and laboratory experiment.
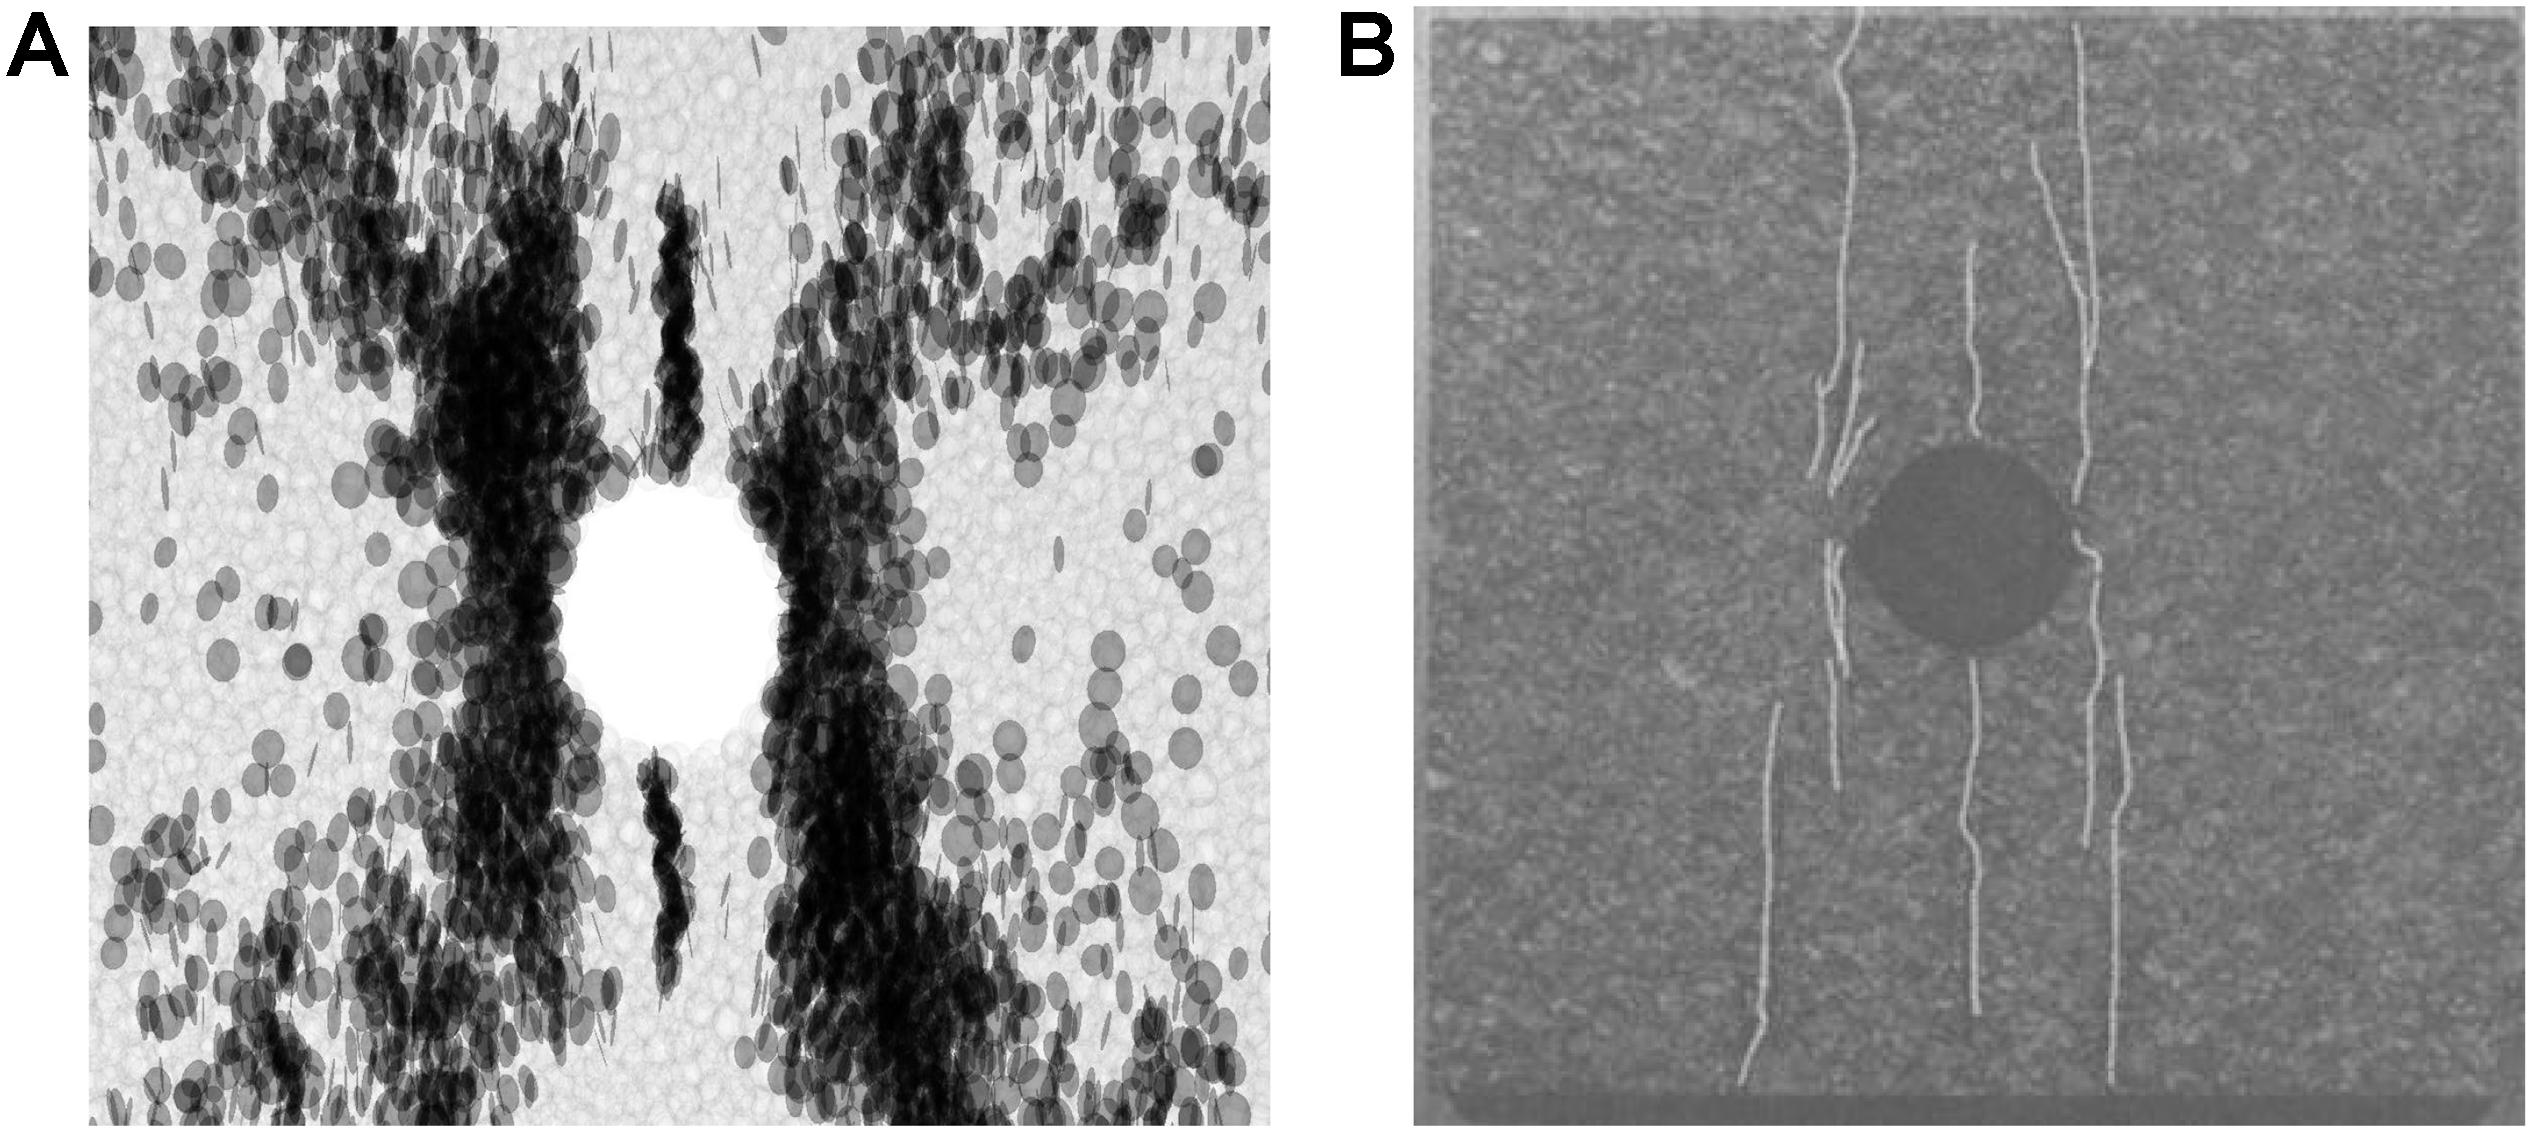
Figure 3. Failure modes of a specimen with a circular hole obtained through simulation and experiment. (A) Numerical result. (B) Experimental result. Adapted from Carter BJ, Lajtai EZ, Petukhov A. Primary and remote fracture around underground cavities. International Journal for Numerical & Analytical Methods in Geomechanics. 1991;15(1): 21–40 (Carter et al., 1991) with permission from the RightsLink automated permissions service.
Results and Discussion
Microscopic Analysis of Crack Propagation
To determine the effect of cavity diameter on the number of micro-cracks and mechanical properties under triaxial cyclic loading, the axial load was specified as a triangular wave cyclic compressive load. The loading path employed is illustrated in Figure 4. Firstly, a confining pressure of 5 MPa was applied to the rock sample, and the upper limit of the initial axial stress was 30 MPa. After unloading to the stress lower limit of 20 MPa, the rock specimen was reloaded to a maximum axial stress of 10 MPa greater than the upper level until the peak strength was reached, then loaded until the axial stress dropped to 70% of the specimen’s peak strength. The test was then stopped. It should be noted that the stress lower limit of a cyclic load has a certain impact on the mechanical properties of rocks (Peng et al., 2019a). The stress lower limit is set to approximately 10% of the peak compressive strength.
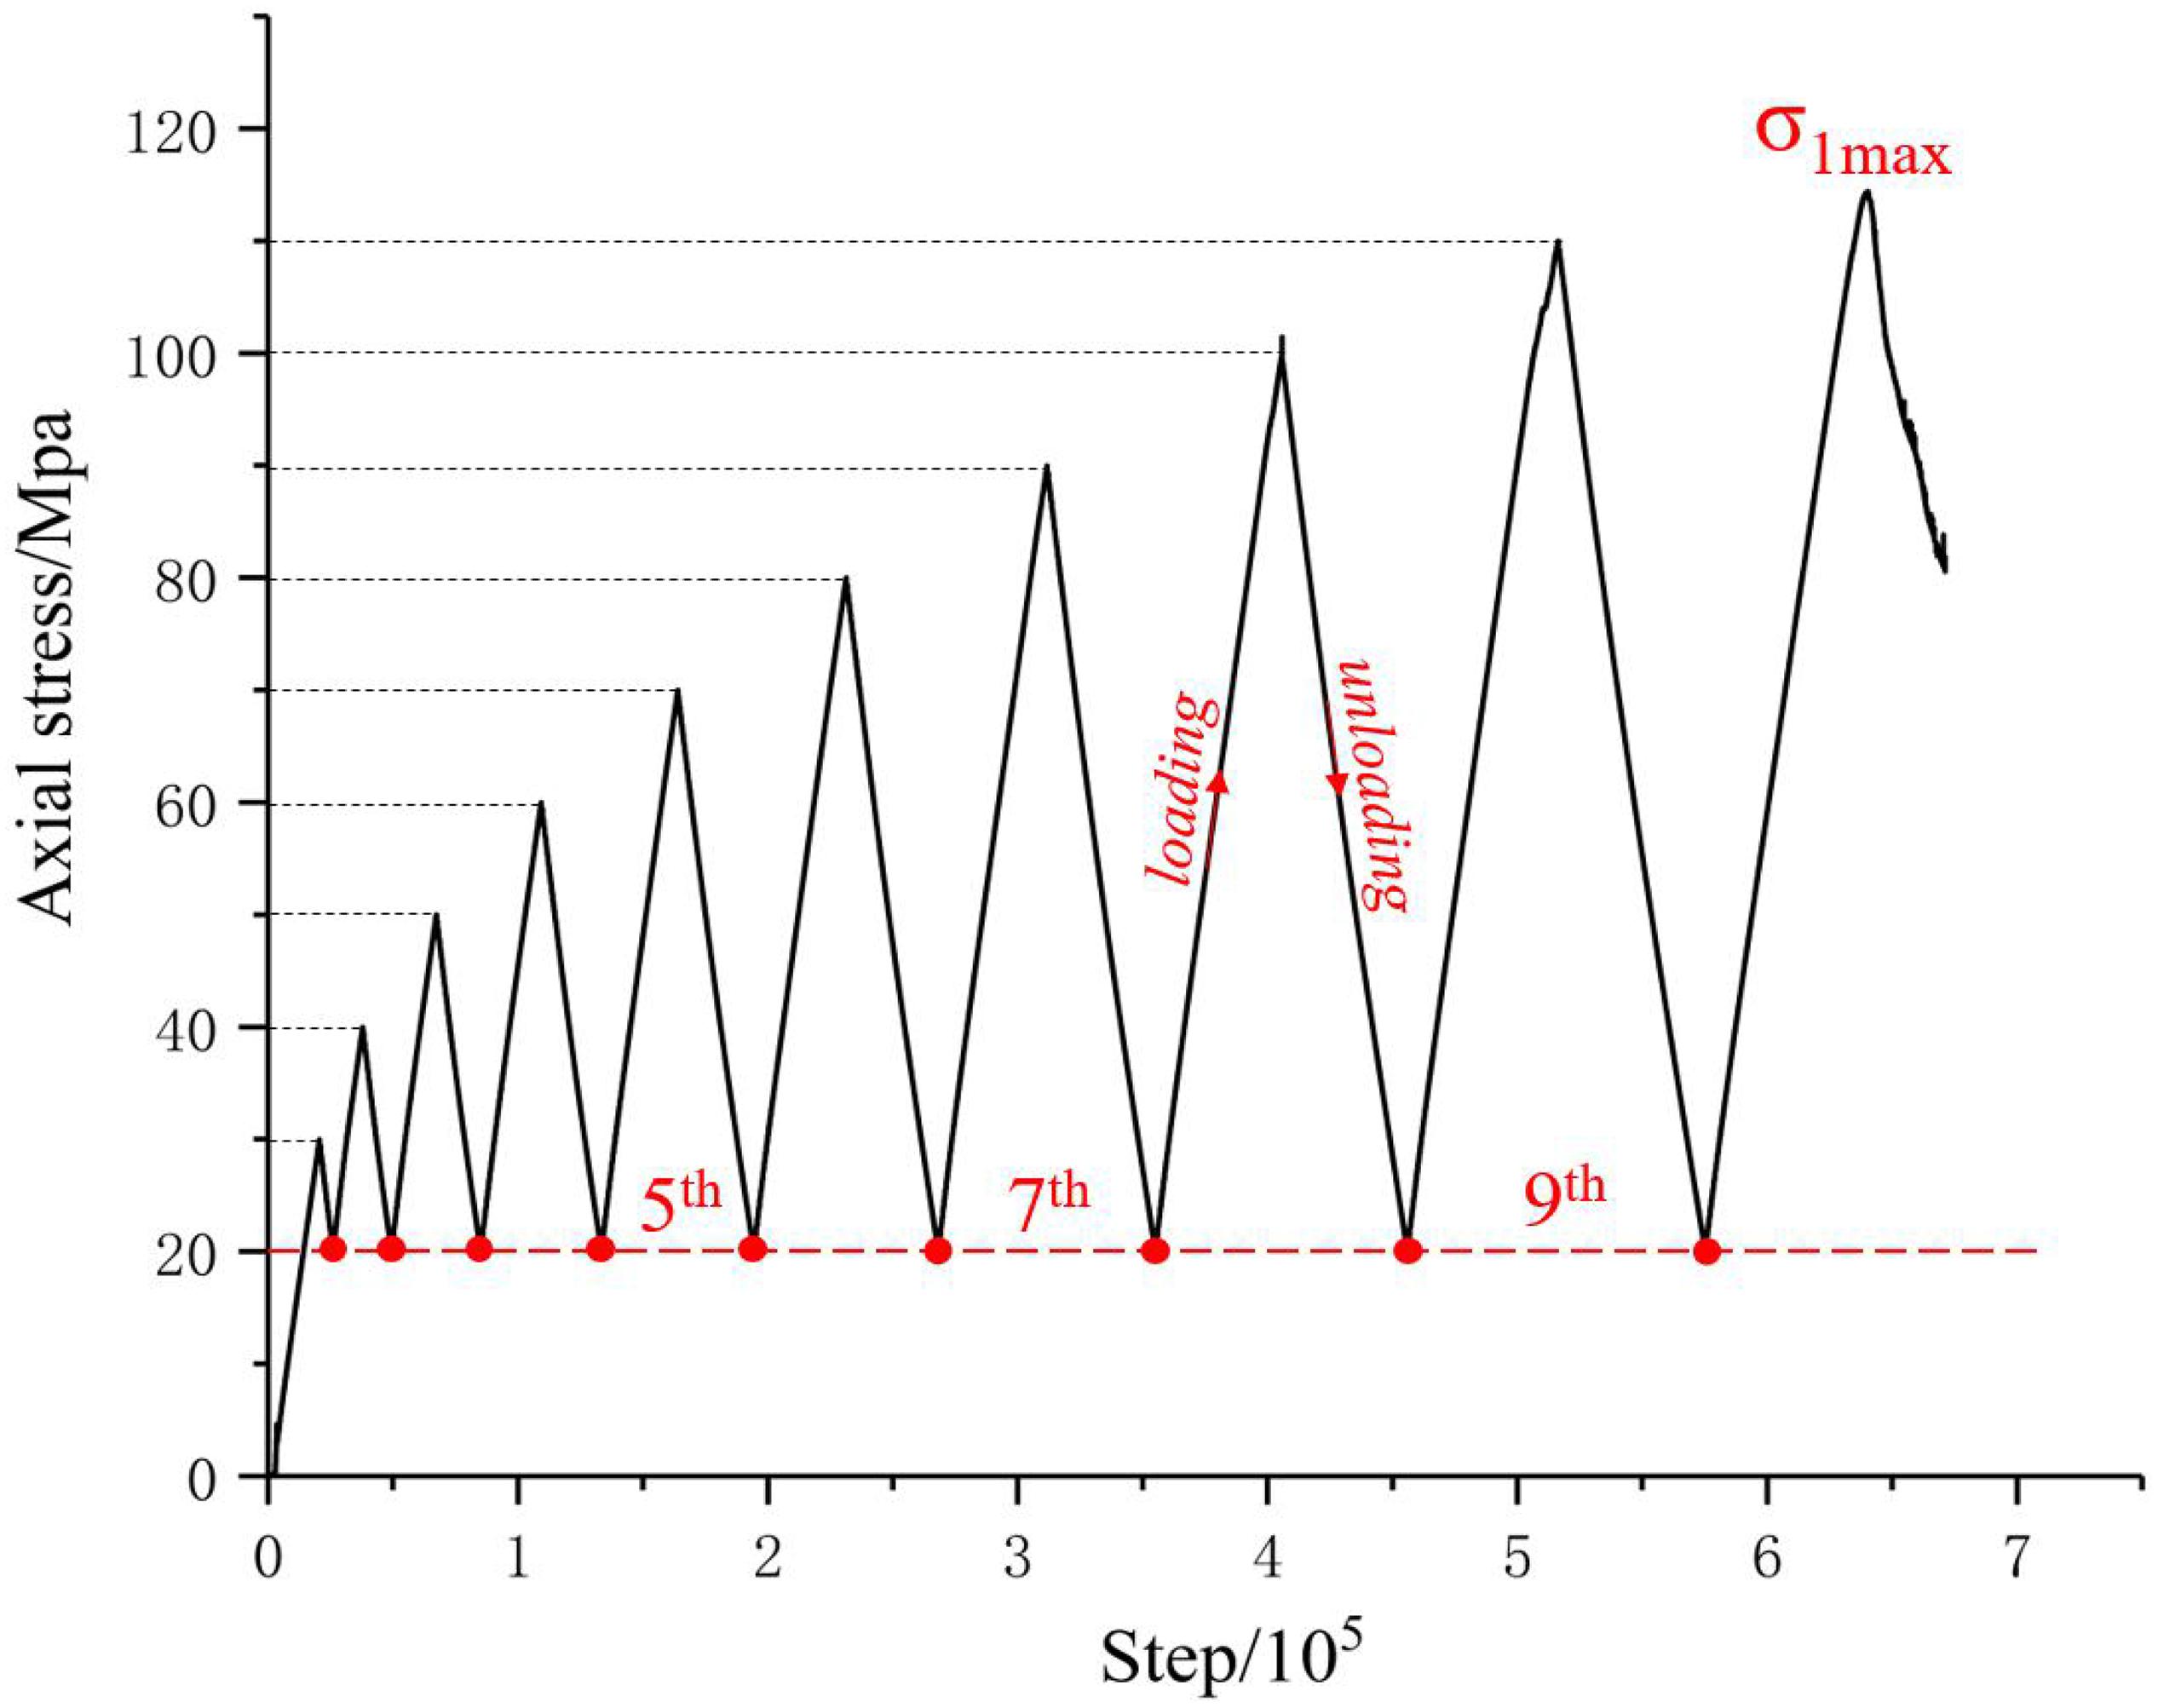
Figure 4. Stress path: triaxial cyclic loading and unloading under increased upper limit stress.
The fracture mode, force chain distribution, and displacement vector of SCS-30 at different cycle numbers are presented in Figure 5. It can be seen from the fracture mode diagram that during the sixth cycle, damage is first generated around the cavity, and, as the damage continues to accumulate, macroscopic cracks are gradually generated. Cracks form at the top and bottom of the cavity that are parallel to the maximum principal stress and develop along the upper and lower ends. The crack initiation direction on the left and right sides of the cavity is approximately perpendicular to the boundary of the cavity. However, with an increase in cycle number, the cracks gradually turn to the direction approximately parallel to the axial stress and extend to either side of the specimen. Finally, a macroscopic failure zone inclined to the XY plane is formed, which is characterized by compression-shear damage.
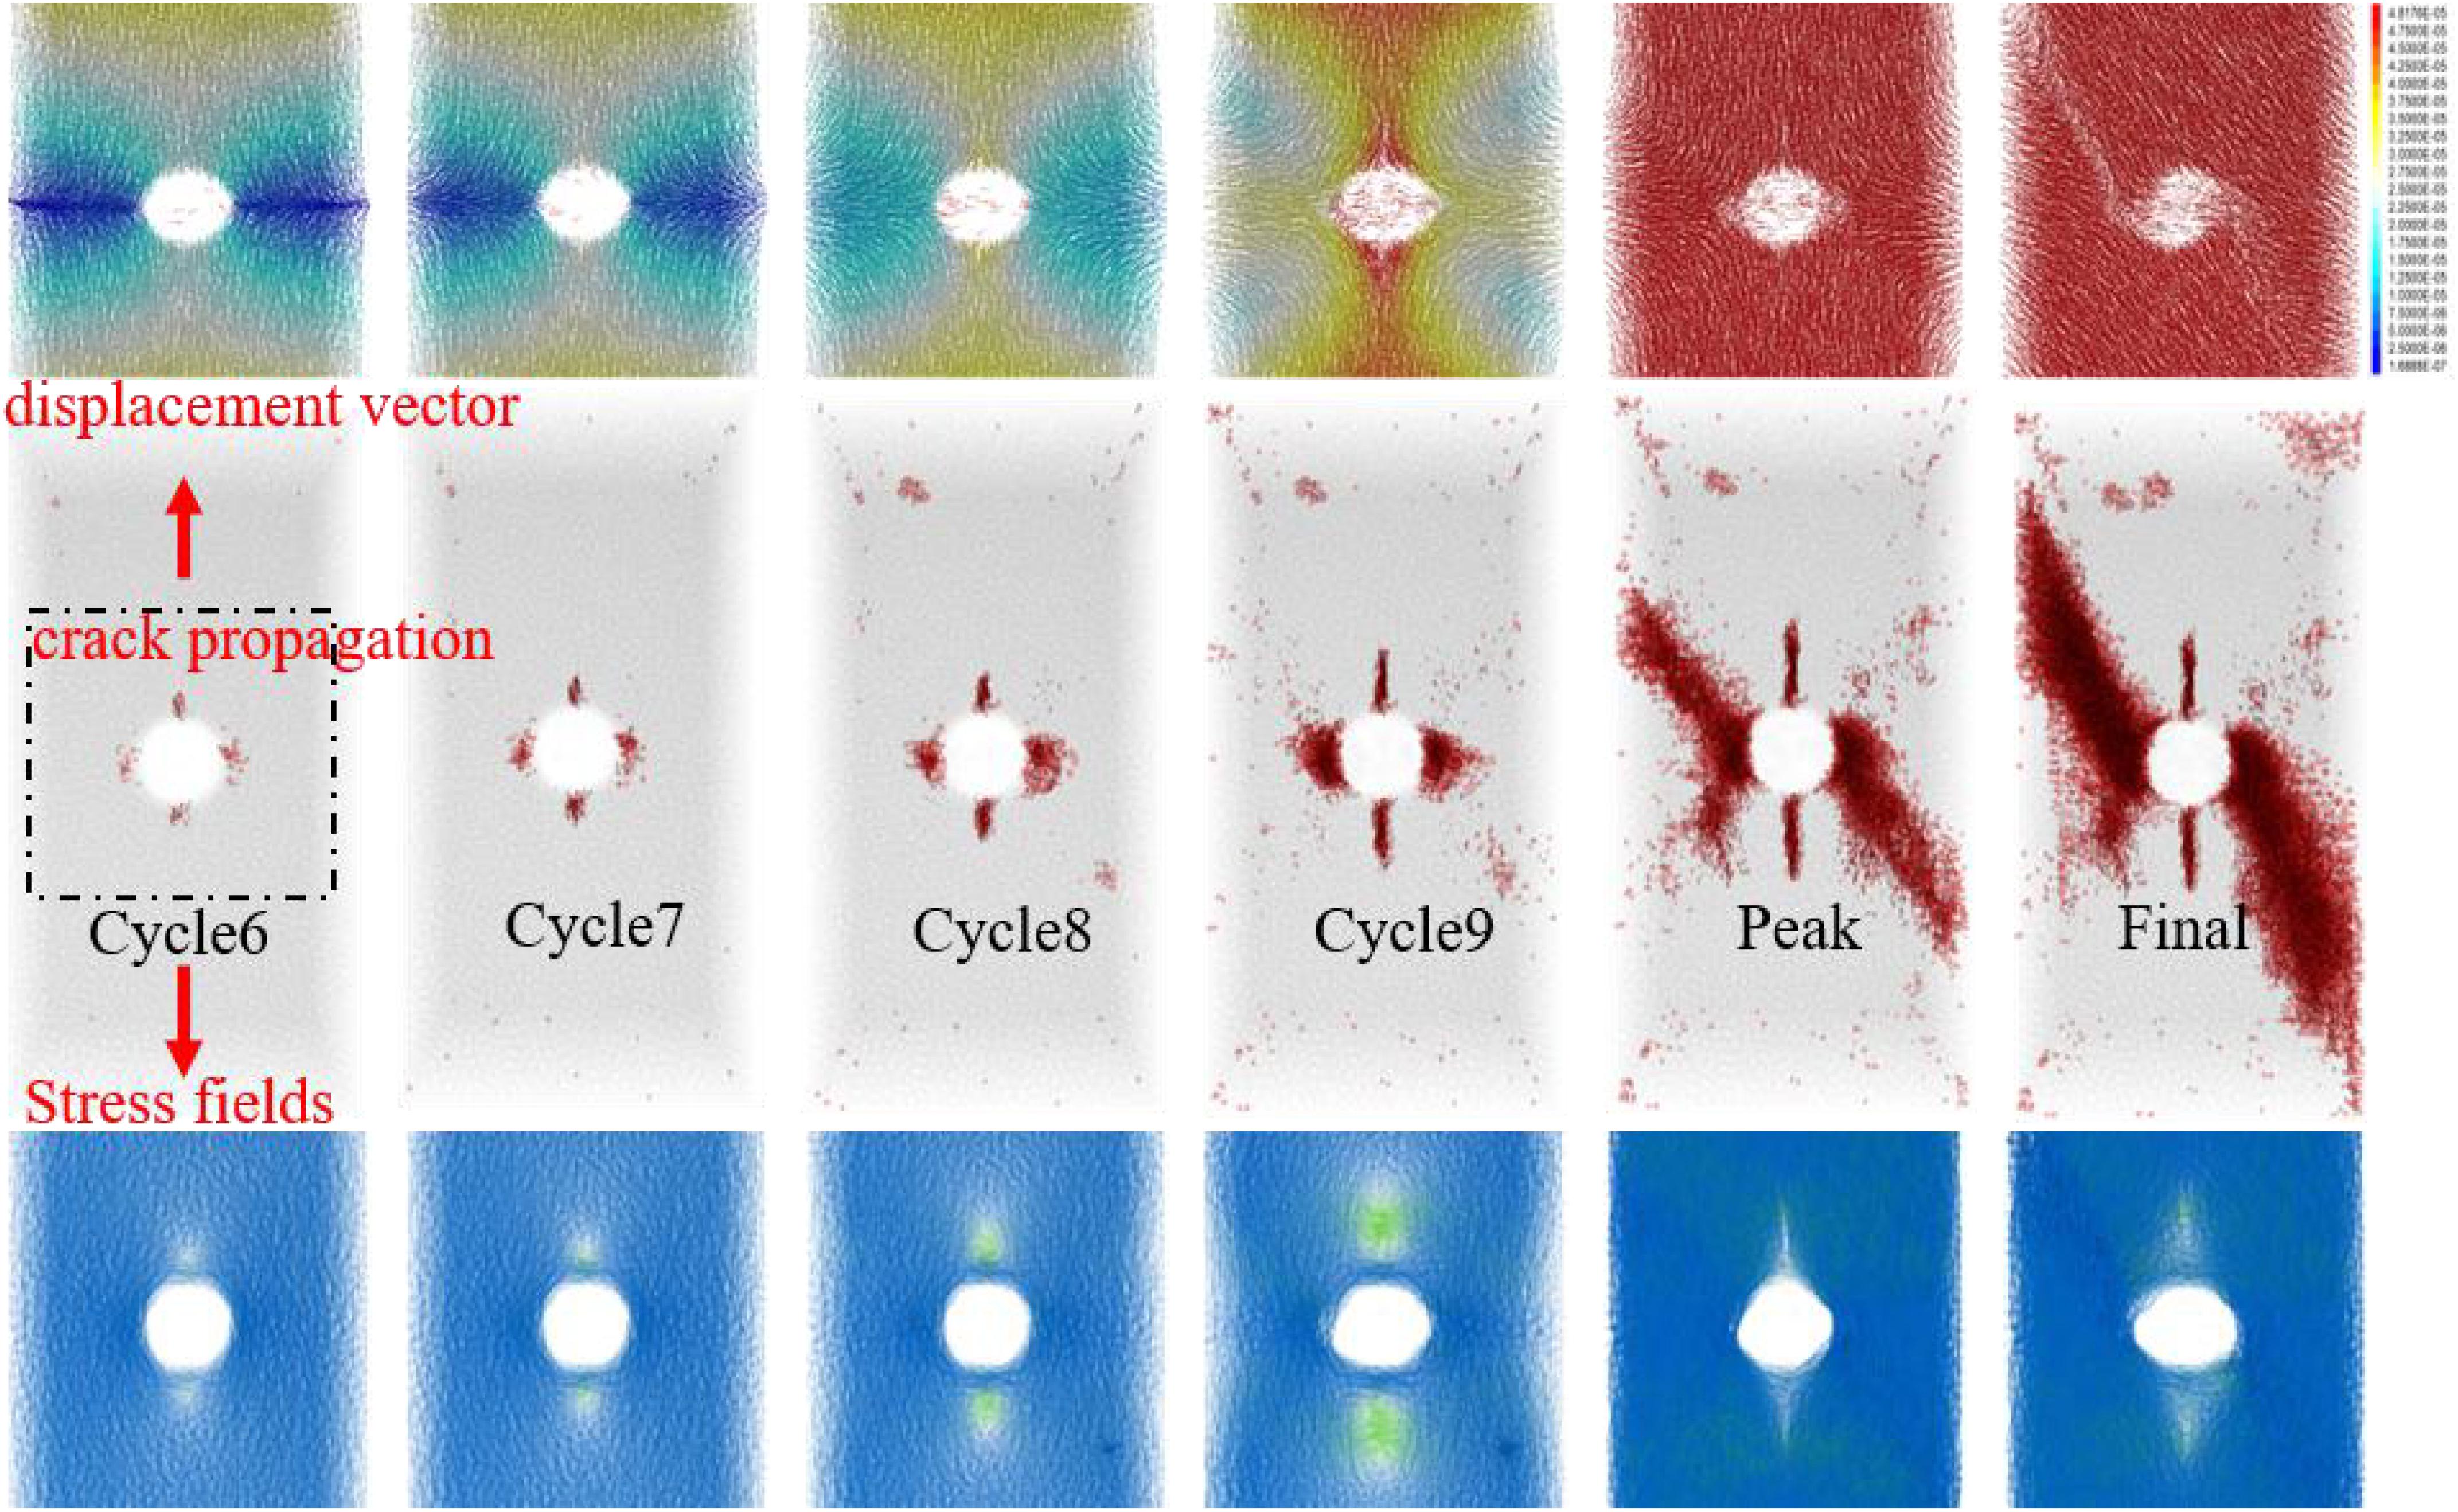
Figure 5. Fracture mode, force chain distribution, and displacement vector of SCS-30 with different cycle numbers.
From the force chain distribution diagram (blue represents compressive stress, green represents tensile stress), it can be seen that in the first several cycles, a pressure stress concentration is formed on the left and right sides of the cavity. As the number of cycles increases, the pressure stress concentration is more obvious, and a tensile stress zone is formed at the top and bottom of the cavity, which is particularly evident in the ninth cycle. At the same time, it can be observed from the displacement vector diagram that the particles at the top and bottom of the cavity move to the left and right sides, respectively, which indicates that the cracks at the top and bottom of the cavity are caused by tensile stress. In the displacement vector diagram of the eighth and ninth cycle, since the displacement of the particles on the left and right sides of the cavity is smaller than the displacement of the top and bottom of the cavity, an “X”-shaped shear failure zone is formed around the cavity. However, due to the limitation imposed by the confining pressure and the heterogeneity of rock, the characteristics of crack propagation in the sample change to localization. The cracks extend along the upper left and lower right of the cavity. Eventually, a compression-shear fracture forms.
According to Kirsch’s formula on the theory of elasticity, it can be seen that:
where σr is radial stress, σθ is tangential stress, τrθ is shear stress, an p and q are, respectively, the axial stress and horizontal stress of specimens. On the top and bottom of the cavity, ra = r, θ = 90°; in this case, σθ = 3q−p, σr = τrθ = 0, and tensile stress is generated. On the left and right sides of the cavity,ra = r, θ = 0°; in this case, σθ = 3p−q, σr = τrθ = 0, and compressive stress concentration is generated. It can be seen that the mesoscopic characteristics of granite with a pre-existing cylindrical cavity under triaxial cyclic load are consistent with the theoretical results of elastic mechanics.
The crack propagation, force chain distribution, and displacement vector diagram of SCS-20, SCS30, and SCS-40 at the peak of axial stress under triaxial cyclic load are presented in Figure 6. From the crack propagation diagram, it can be seen that tensile cracks parallel to the maximum principal stress will be generated on both sides of the rock specimens. The larger the cavity diameter is, the longer the length of the tensile crack will be. Meantime, the angle between the compression-shear failure zone formed on the left and right sides of the cavity and the direction of the maximum principal stress increases with an increase in the cavity diameter. By comparing the displacement vector diagram, it can be observed that the horizontal displacement of particles on the left and right sides of the cavity also increases with an increase in the cavity diameter. This is because the larger the cavity diameter of the specimen is, the thinner the rock on the left and right sides of the sample will be. Therefore, it is easy for the loading to cause the rock particles on either side of the cavity to be displaced. By comparing the force chain distribution diagrams, it can be seen that the area of the force chain of weak compressive stress on the top and bottom of the cavity increases with the increase in the cavity diameter, and the larger the cavity diameter is, the more significantly compressive stress concentrates in the left and right cavities.
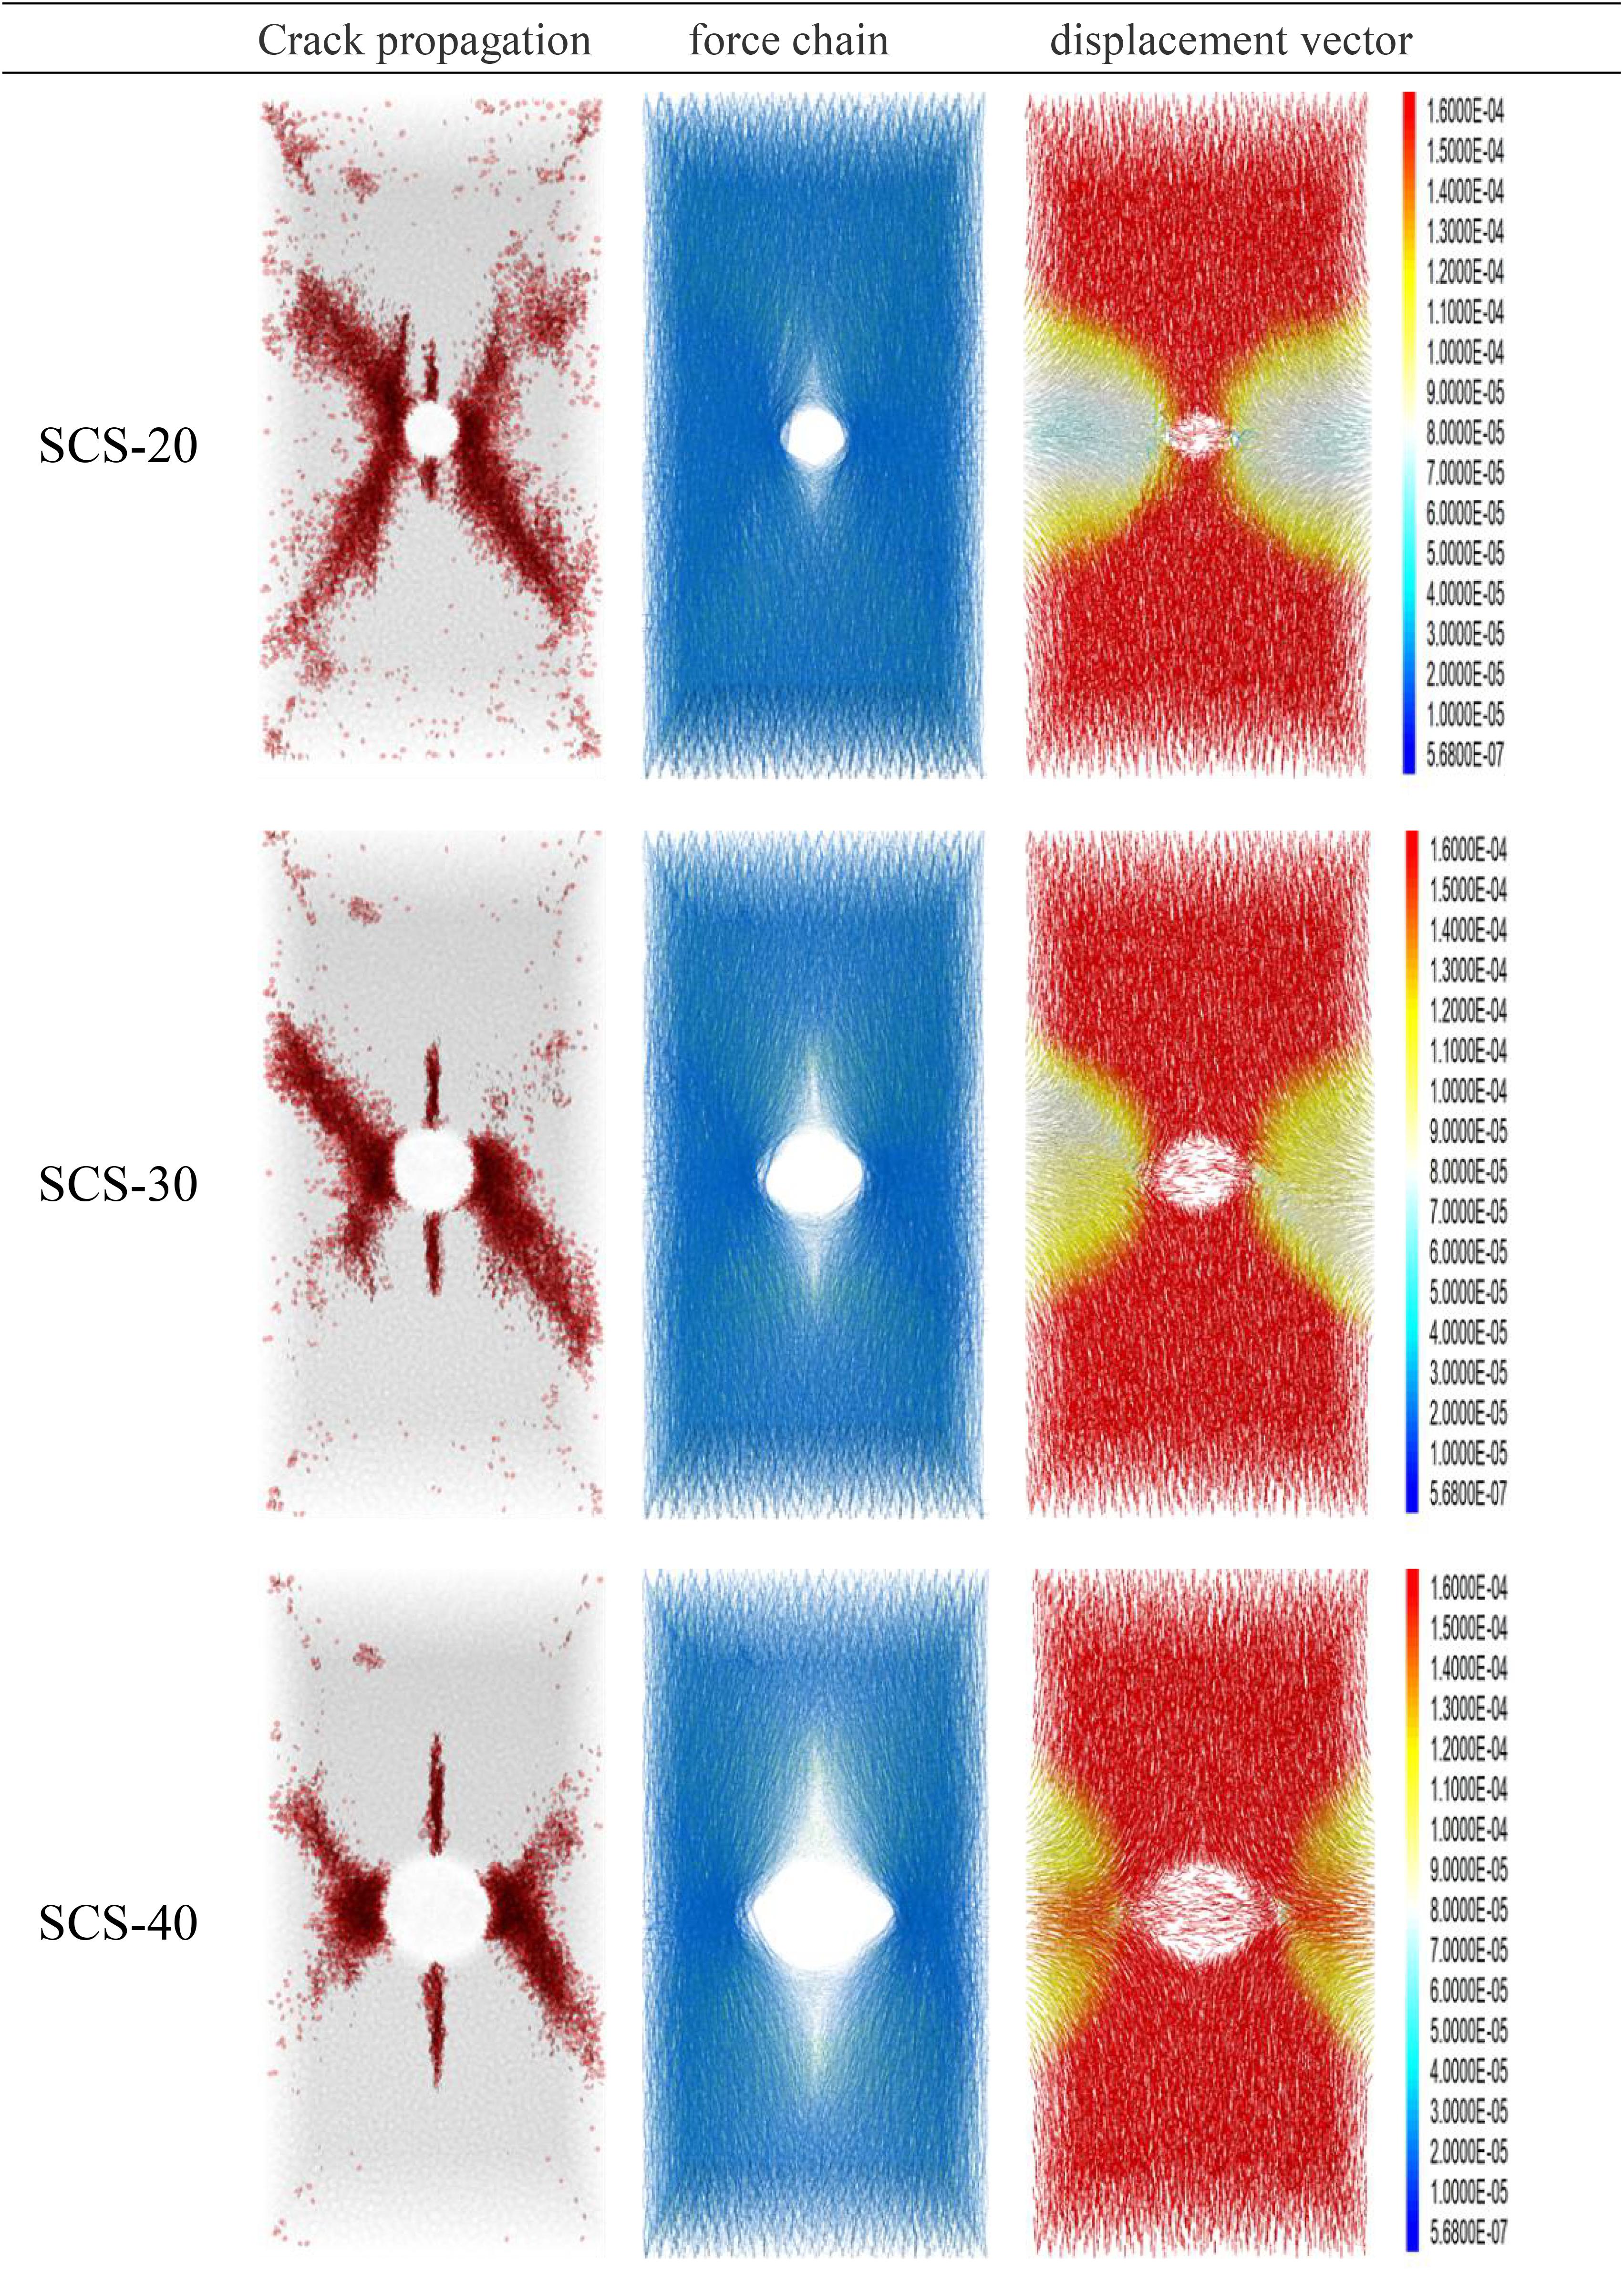
Figure 6. Crack propagation, force chain distribution, and displacement vector diagrams of SCS-20, SCS30, and SCS-40 at the peak of axial stress under triaxial cyclic load.
Number of Micro-Cracks and Mechanical Properties
The mechanical parameters extracted from the stress-strain curve can be a good reflection of the mechanical properties, and the damage mechanism (Zhao et al., 2018) of rock can be studied through the evolution law of micro-cracks. The influence of axial stress on the axial strain, horizontal strain, volume strain, and micro-crack number of SCS-30 under triaxial cyclic loading are shown in Figure 7A. Due to the action of cyclic load, the rock constantly generates damage accumulation. With the increase of cyclic levels, the hysteresis loop of the axial stress-strain curve constantly moves forward, which indicates that the plastic deformation of the rock also increases, and the distribution of hysteretic loops becomes sparse through compaction. When cyclic axial stress is close to the axial stress peak, horizontal strain suddenly increases. This is because the damage accumulation of the specimens reaches a peak with the increase in the cyclic axial stress, and local damage begins to occur. As the stress increases further, more and more micro-cracks occur, and the specimen continues dilating (Zhao et al., 2017; Lin et al., 2019c). It can be seen from the micro-crack number curve that the number of cracks grows slowly in the early stage of the cycle and increases as the cycle progresses. The “non-memory” phenomenon exhibited by the crack number curve is enhanced. This phenomenon is most obvious at the last cycle level, before reloading to the maximum axial stress of the previous cycle, when the crack number has increased significantly. Figure 7B depicts the variation in the number of micro-cracks and peak strength with cycle number to compare the SCS-20, SCS-30, and SCS-40 specimens. It can be seen that the axial stress peak of the specimens under the triaxial cyclic load decreases significantly with an increase in the cavity diameter. The number of micro-cracks in the three specimens has the same growth trend throughout the triaxial cyclic loading process. At the beginning of cyclic loading, micro-cracks are barely formed, which is called the quiet stage. Then, the number of micro-cracks begins to increase slowly, and this stage is called the initial increase stage. When the upper limit stress of cyclic loading approaches its peak, the number of micro-cracks begins to increase sharply, and this stage is called the rapid increase stage. The number of micro-cracks varies with the diameter of the cavity. The larger the cavity diameter of the specimen is, the shorter the quiet stage will be, and the rapid increase stage will be reached at a lower cycle number. For example, at the sixth cycle, the number of micro-cracks in SCS-40 has increased significantly, while the numbers in SCS-20 and SCS-30 are still in the initial increase stage, which indicates that local damage begins to occur in SCS-40, and crack number also rises sharply at this stage. At this time, the rock specimen is almost destroyed.
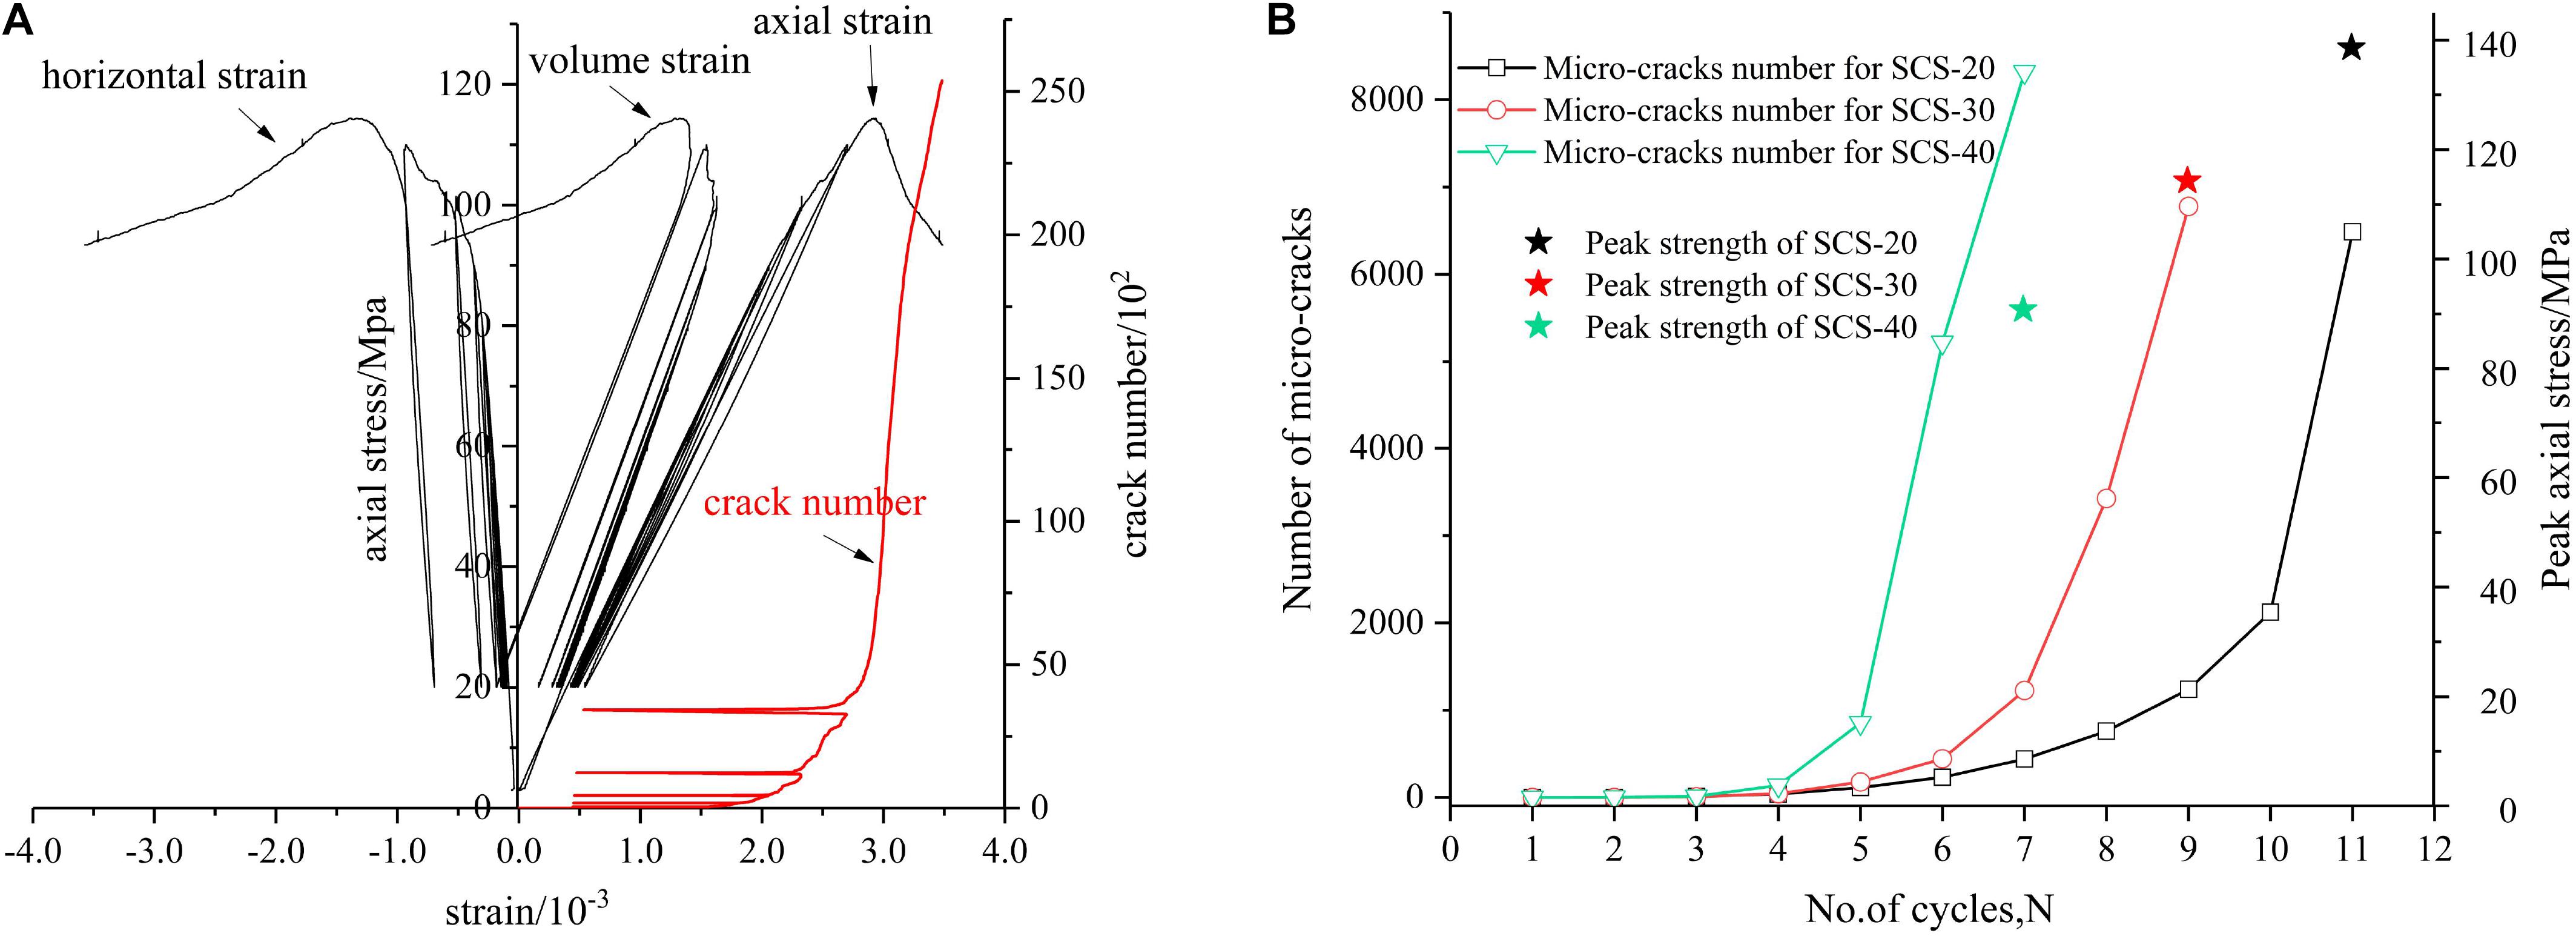
Figure 7. (A) Influence of axial stress on the axial strain, horizontal strain, volume strain, and crack number of specimen SCS-30 under triaxial cyclic loading. (B) Numbers of micro-cracks with the number of cycles and peak strength.
As shown in Figure 8, with the increase in cavity diameter, the average elastic modulus decreases significantly. This is because an increase in cavity diameter promotes the horizontal deformation of the rock. During the whole process of cyclic loading and unloading, the average elastic modulus decreases with an increase in cycle number. The decrease rate of the average elastic modulus shows the characteristics of “slow first and fast later,” and this characteristic becomes more obvious in the cavity with a larger diameter. The Poisson’s ratio of granite increases with the increase in the cycle number, and the larger the cavity diameter is, the greater the increase will be. With the increase in cyclic level, local failure occurs inside the rock specimen, internal cracks develop continuously, and the stress concentration on either side of the cavity is strengthened. Therefore, the growth rate of horizontal strain is higher than that of axial strain. From the displacement vector diagram in Figure 6, it also can be seen that the horizontal displacement of particles on the left and right sides of the cavity increases with the increase of cavity diameter, so the increase in Poisson’s ratio is also greater.
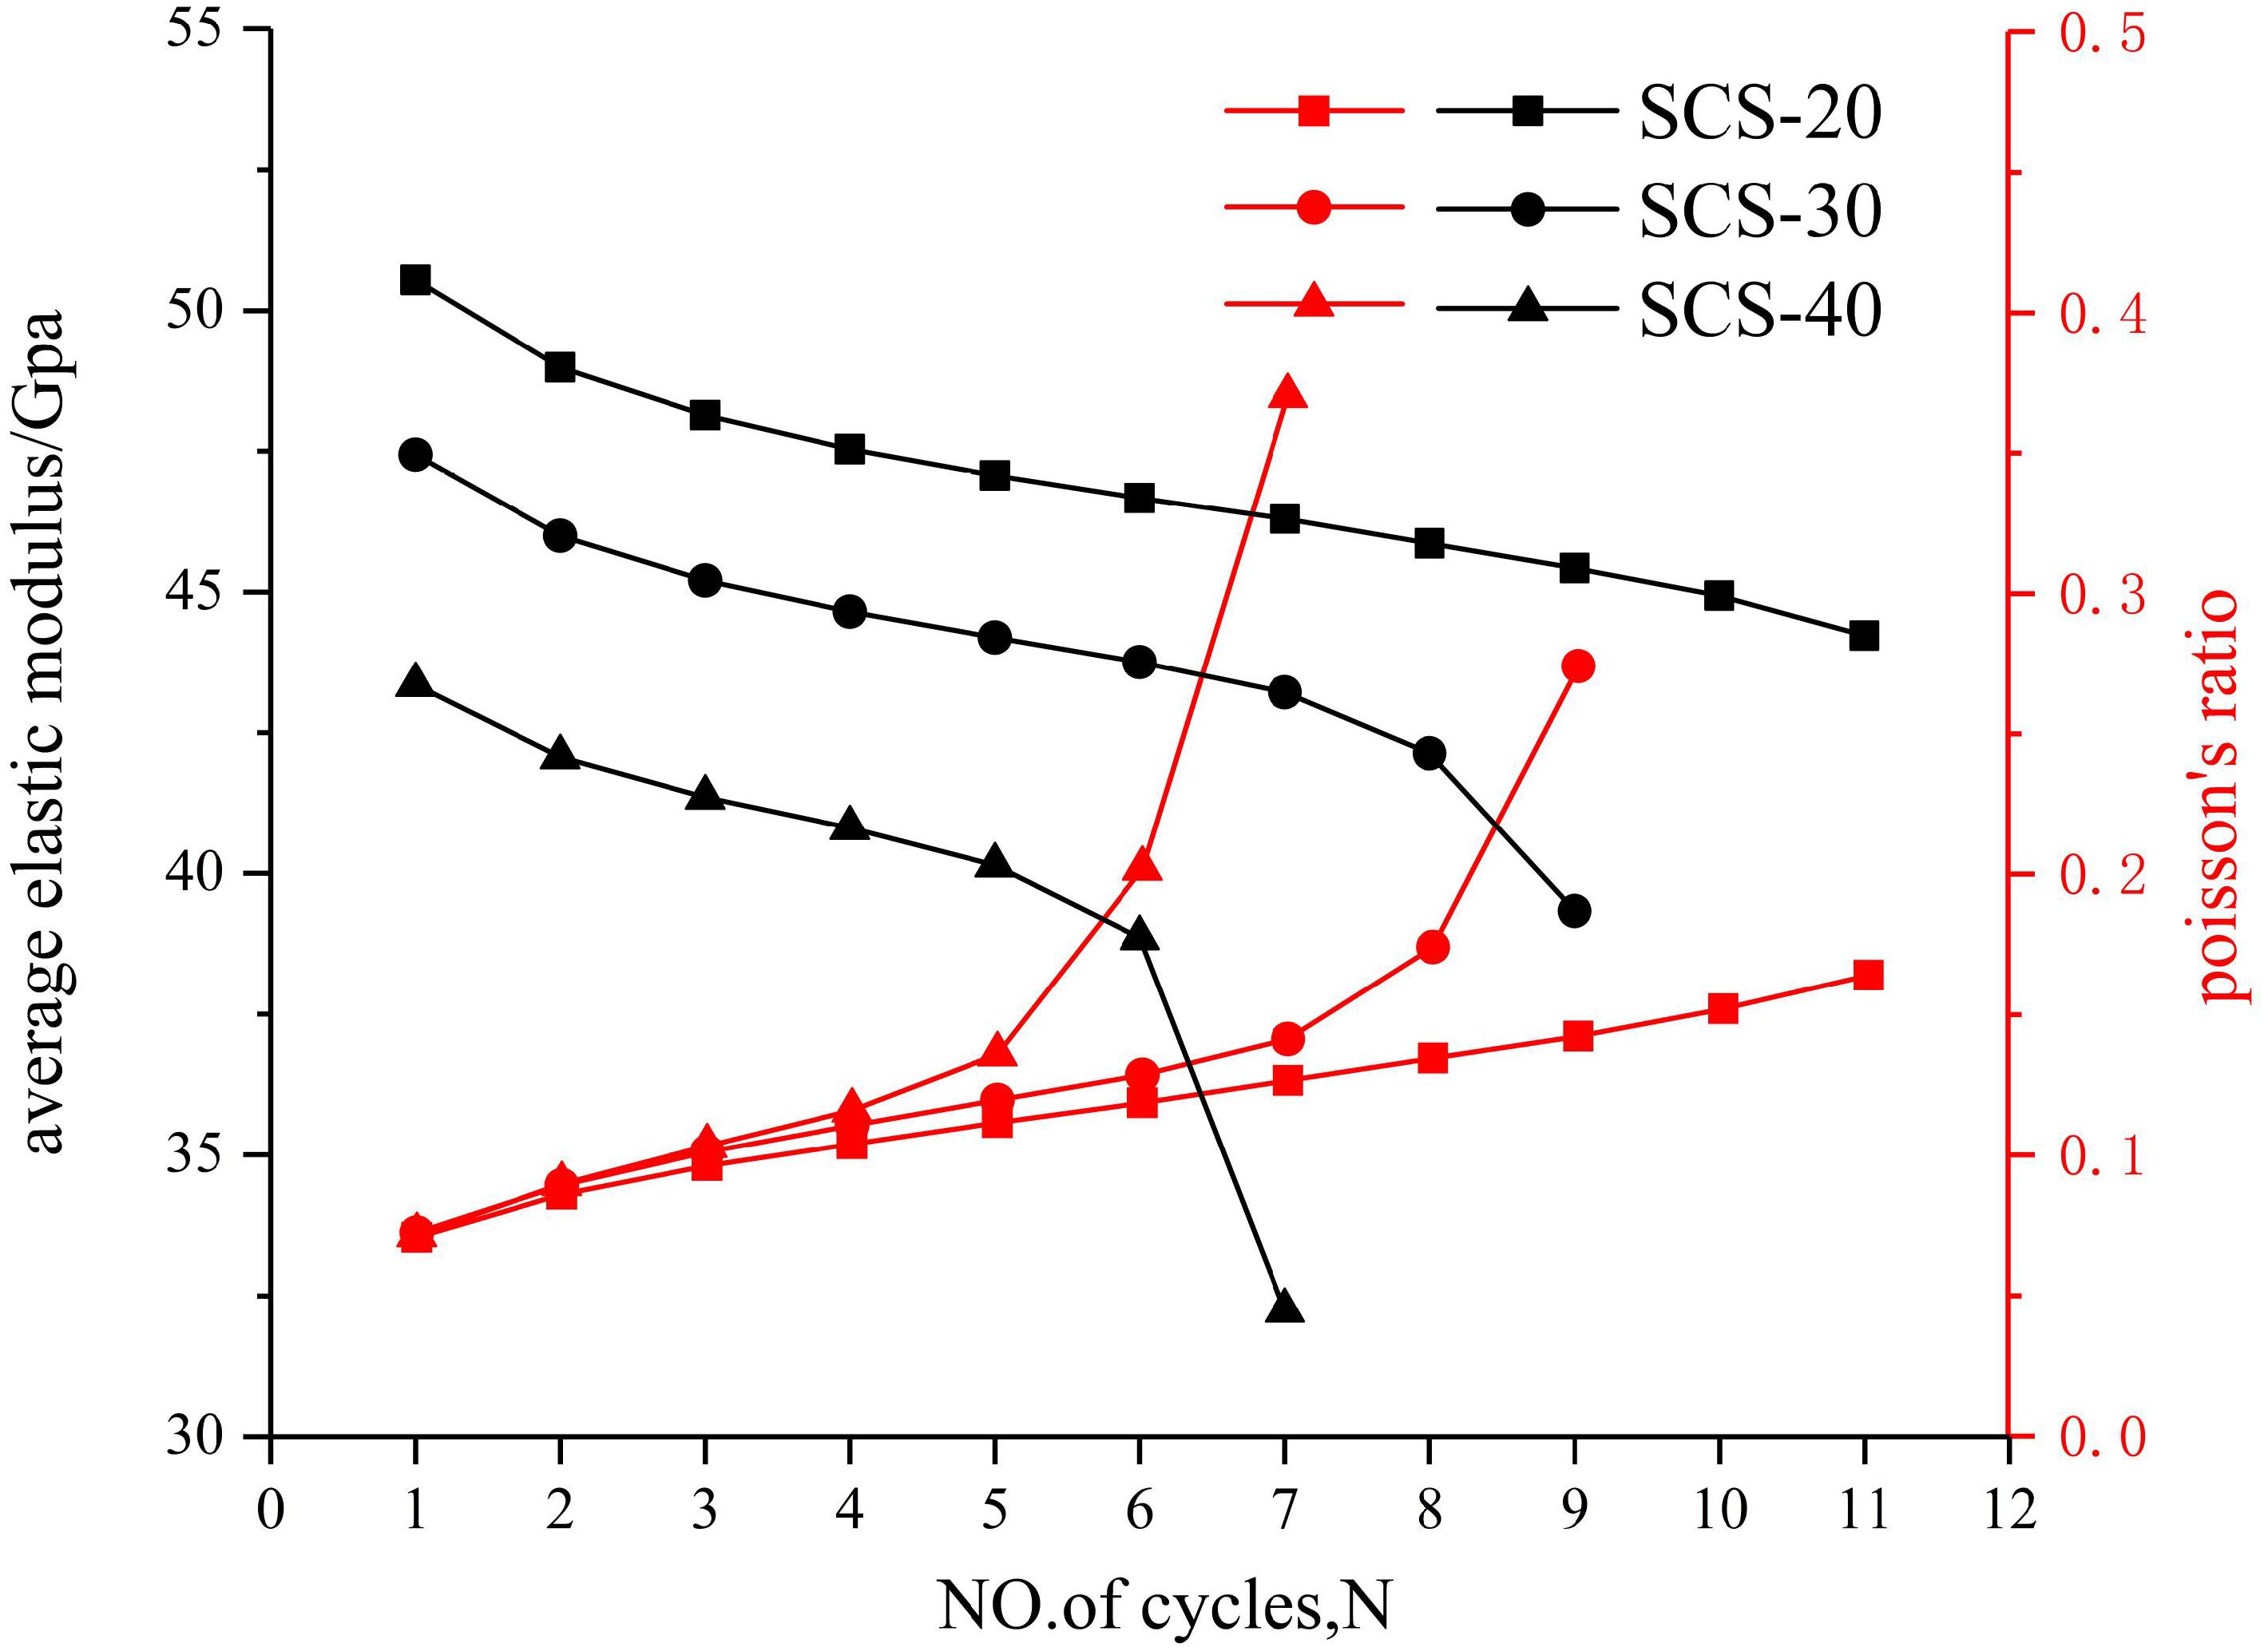
Figure 8. Influence of cycle number on the average elastic modulus (black) and Poisson’s ratio (red) in SCS-20, SCS-30, and SCS-40.
Principal Stress Distribution Around a Circular Cavity
Recording the local stress distribution data around the cavity can further reflect the influence of cyclic loading on the cavity specimen. Therefore, the method of measuring a sphere is adopted to measure the local stress of the cavity. As shown in Figure 9, eight measurement spheres with different directions and symmetry about the center of the cavity were generated on the XZ plane (Y = 0). In order to verify that the results of this group of measurement spheres were representative, three groups of measurement spheres around the cavity at different positions on the Y-axis (Y = −40, 0, 40 mm) were set to compare and monitor stress. The results showed that the stress measurement results of each group were basically the same, so the group of measurement spheres with Y = 0 was used for monitoring. The size of the measurement sphere also needs to be taken into account. If the measurement sphere is too large or too small, the measured data may not truly reflect the stress field. By analysis (Itasca-Consulting-Group, 2014; Liu et al., 2016), a measurement sphere with a diameter of 7 mm is adopted.
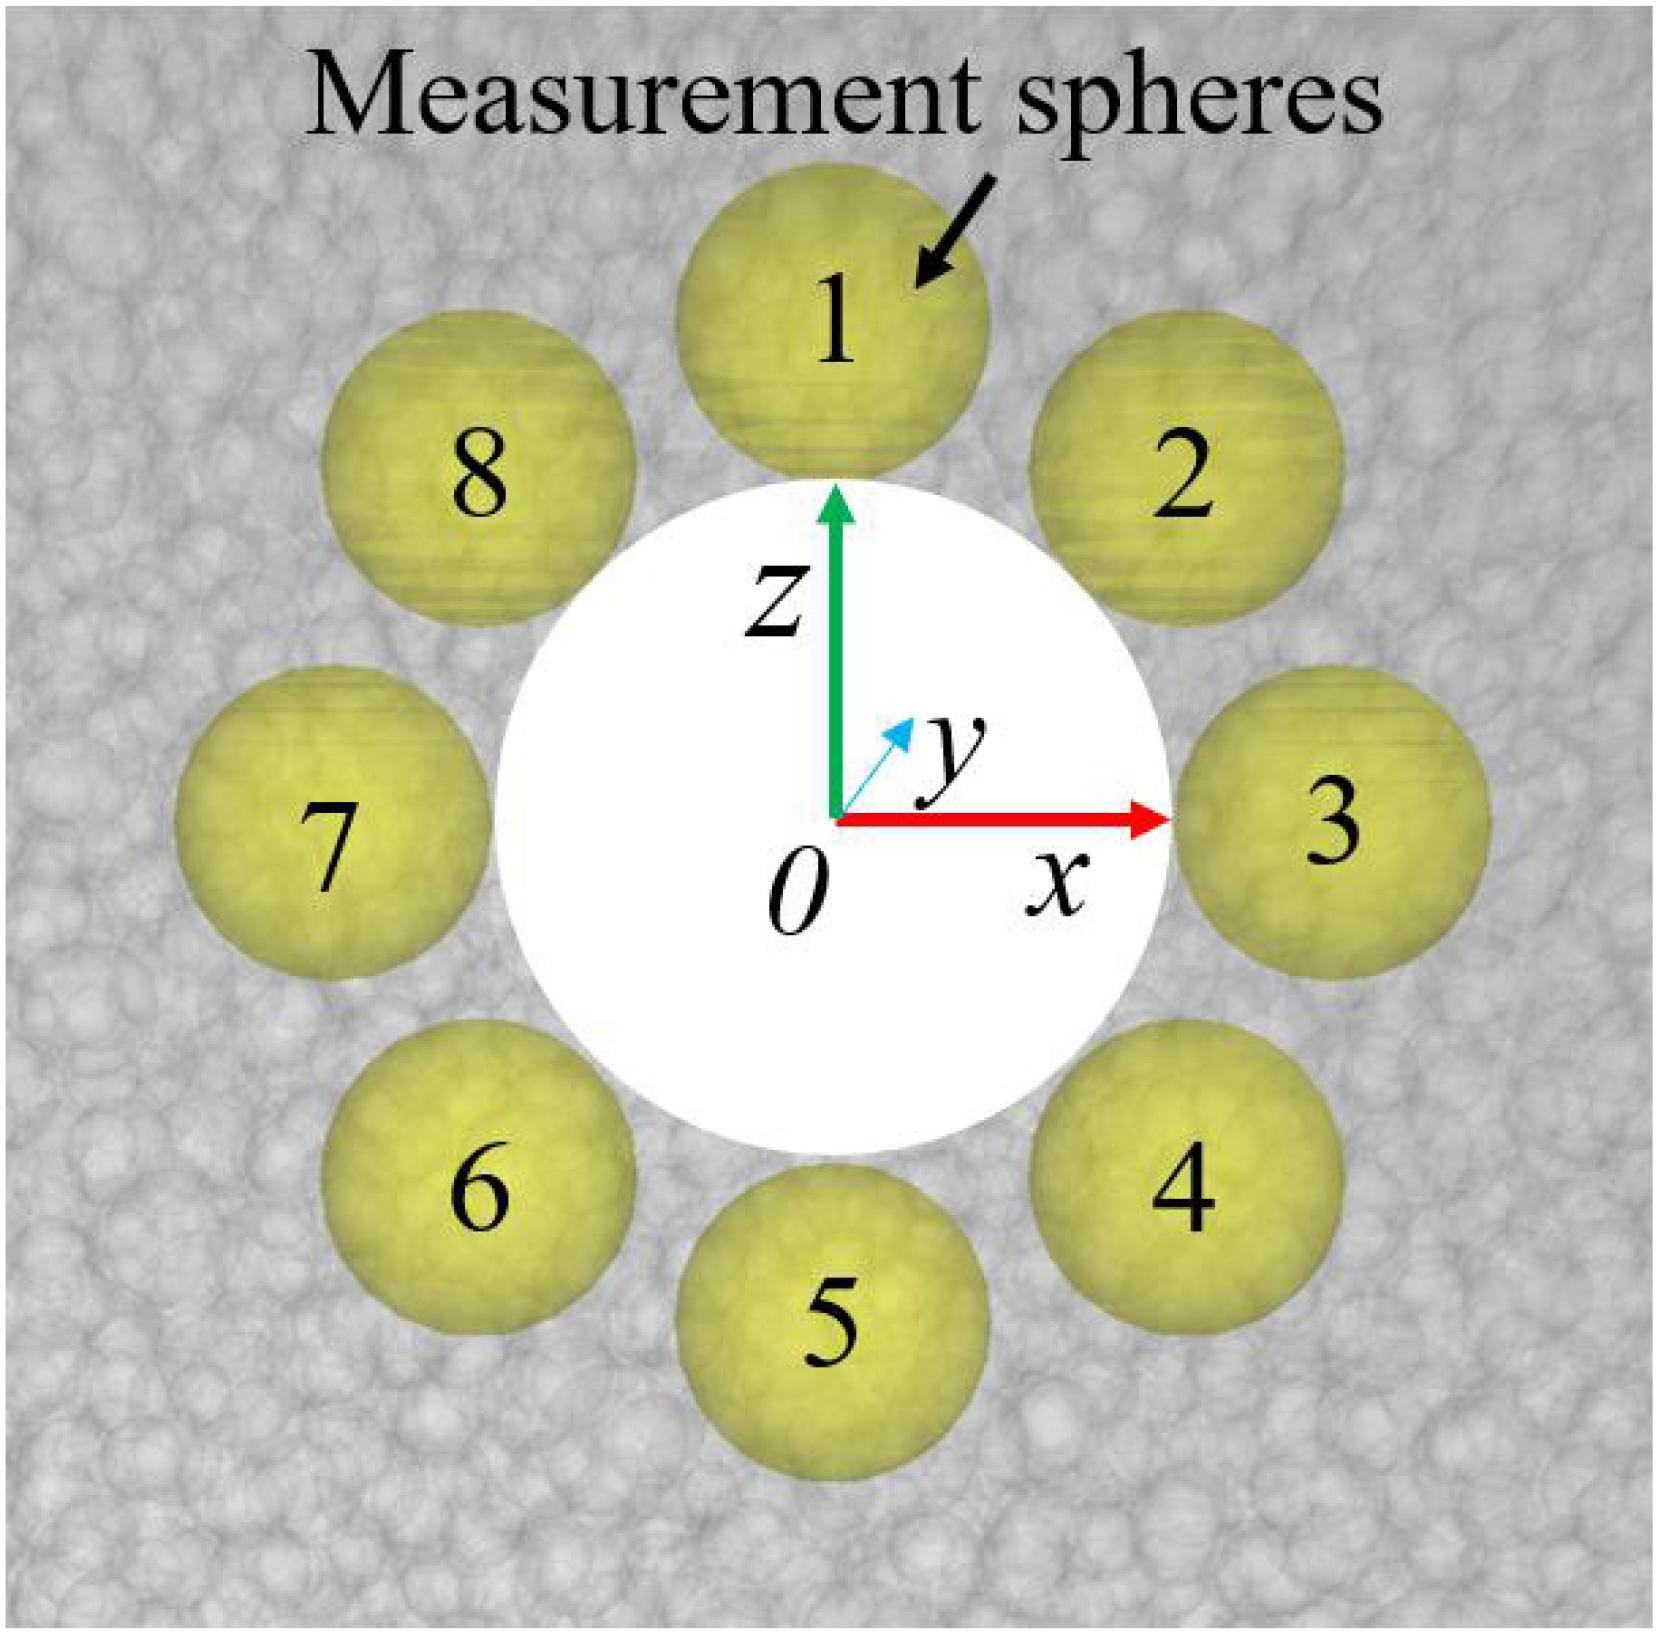
Figure 9. Arrangement of measurement spheres (measurement spheres around a circular opening).
The measurement sphere is used to monitor the maximum principal stress (σ1), intermediate principal stress (σ2), and minimum principal stress (σ3) around the cavity under triaxial cyclic loading. The state of the stress field around the cavity can be obtained by extracting the monitoring results of each measurement sphere. Figure 10A shows the stress field of σ1, σ2, and σ3 in SCS-20 at different cycle numbers. The shape of the stress fields of σ1, σ2, and σ3 are similar. The σ1 value of the measurement spheres in all directions around the cavity increases with the number of cycles, and the closer the measurement sphere is to the left and right boundary of the specimen, the larger σ1 is. This is consistent with the phenomenon of compressive stress concentration in Figure 5. The upper limit stress of the cyclic load in each stage is greater than the σ1 values of the upper and lower parts of the cavity, but far less than the σ1 values of the left and right sides of the cavity. The σ1 values of the left and right sides are about five times those of the top and bottom parts of the cavity. In the initial several cycles, σ2 on the upper and lower sides of the cavity appears as compressive stress (σ2 is positive). As the number of cycles increases, it appears as tensile stress (σ2 is negative). This is because at the beginning of the test, σ2 appears as compressive stress under the suppression of confining pressure, but as the upper limit stress increases, the suppressing effect of confining pressure is canceled out, and σ2 at the upper and lower parts of the cavity appears as tensile stress. This verifies that there is no crack in the upper and lower portions of the cavity in the initial stage of the cyclic loading, and a long macroscopic crack is generated after the sixth cycle. Moreover, σ3 also exhibits a similar law to σ2 during the entire cyclic loading process. When the cyclic upper stress approaches the peak strength, the trend of the stress field of σ1, σ2, and σ3 is almost the same. The difference in σ1 between two neighboring measuring spheres is much larger than that in σ2 and σ3.
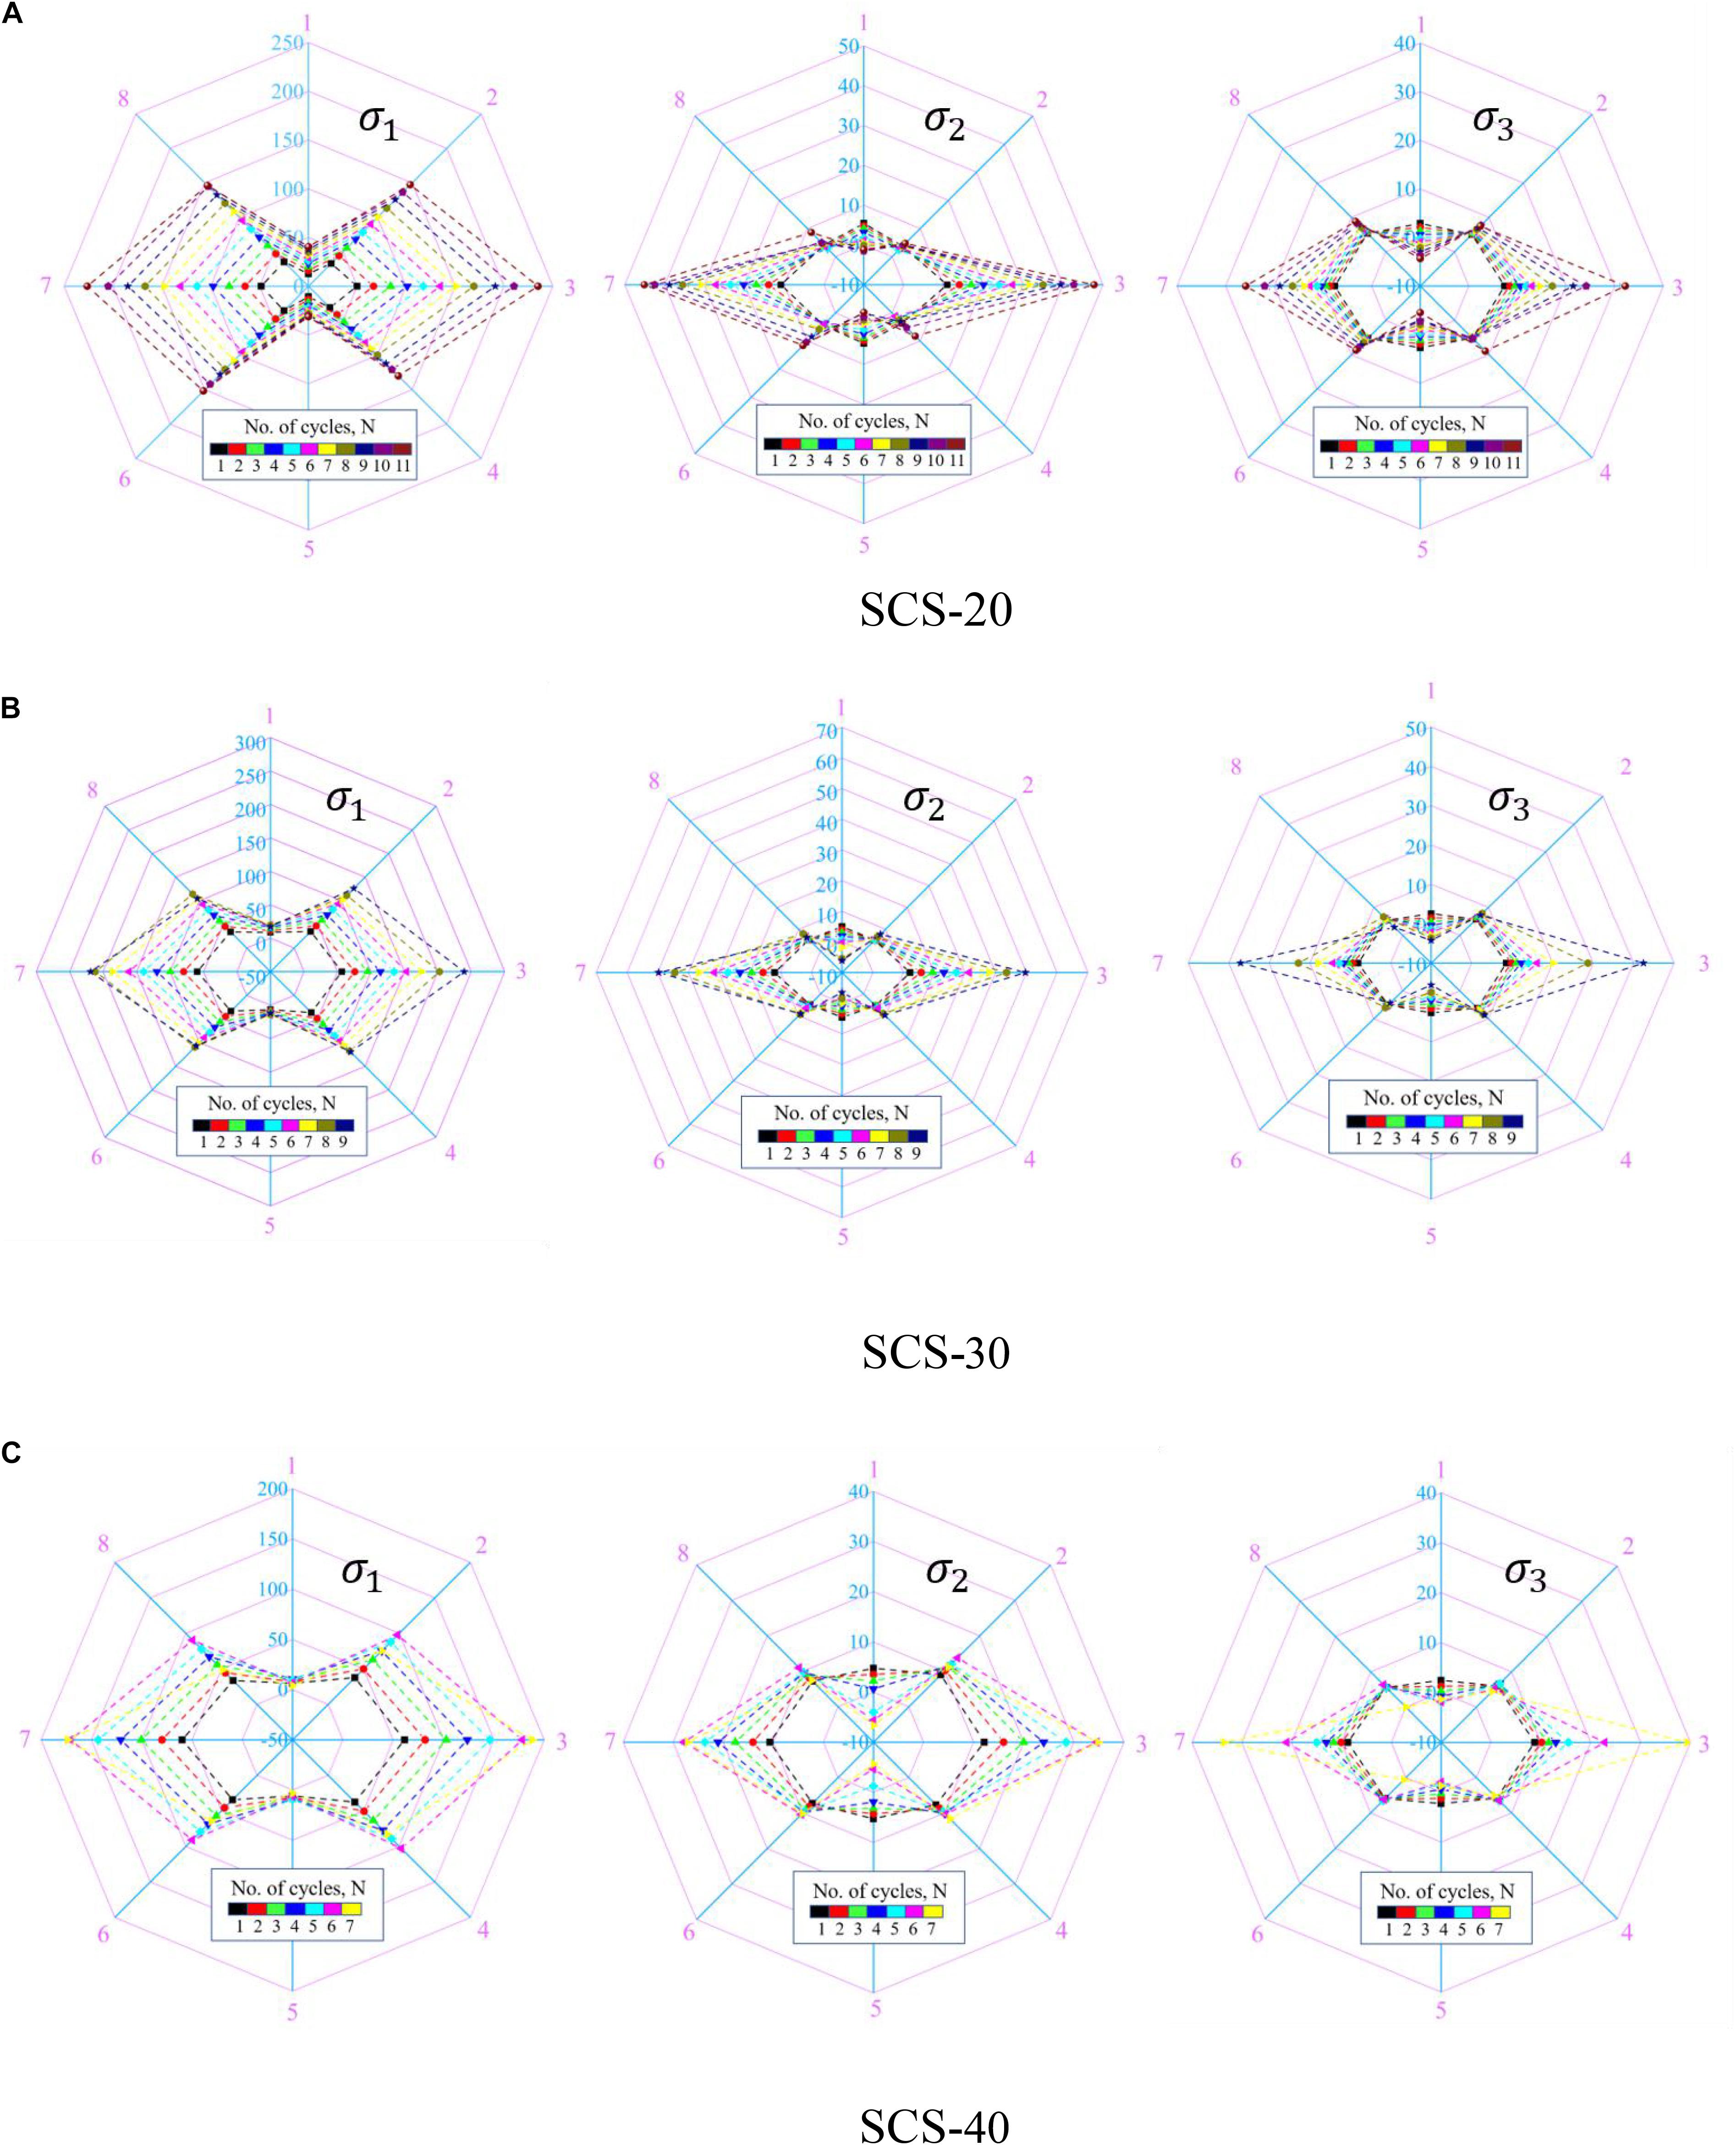
Figure 10. σ1, σ2, and σ3 stress fields of (A) SCS-20, (B) SCS-30, and (C) SCS-40 at different cycle numbers (Unit: MPa).
Comparing Figures 10A–C, the stress distributions surrounding the cavity of SCS-20 are approximately the same as those of SCS-30 and SCS-40. Under the same number of cycles, the σ1 values on the left and right sides of the cavity increase with the increase in cavity diameter. However, the change in the cavity diameter has little effect on the σ1 values of the upper and lower sides of the cavity. During the experiment with three samples, σ2 changes from compressive stress to tensile stress, and the larger the cavity diameter is, the lower the number of cycles required for σ2 to become negative. For example, at the seventh cycle, the σ2 value in the top and bottom of the cavity of SCS-40 is −8 MPa, while it is positive in sample SCS-20. The increasing trend of σ2 increases as the cavity diameter increases. The σ3 values of the left and right sides of the cavity increase more sharply with the increase in the cavity diameter, while the σ3 values of the upper and lower sides of the cavity are not affected.
Conclusion
(1) Under triaxial cyclic load, tensile cracks appear at the top and bottom of the cavity and parallel to the direction of maximum principal stress. Shear cracks appear on both sides of the cavity with an increase in cyclic level. An “X”-shaped shear failure zone forms around the cavity, which is consistent with the theoretical results of Kirsch’s formula in elastic mechanics.
(2) The effects of cavity diameter on tensile cracks and the compression-shear failure zone were studied, and the changes in particle displacement and compressive stress concentration on the two sides of the cavity as the cavity diameter increased were analyzed.
(3) The effects of cavity diameter on peak strength and number of micro-cracks under triaxial cyclic loading were analyzed. The changes in elastic modulus and Poisson’s ratio at different cavity diameters and different cycle stages were discussed in numerical ways.
(4) The stress field surrounding the cavity was further analyzed by the method of a measuring sphere, and the stress fields of σ1, σ2, and σ3 under different apertures were analyzed and compared.
Data Availability Statement
All datasets generated for this study are included in the article/supplementary material.
Author Contributions
XZ performed the tests, processed the data and wrote the manuscript and also he was responsible for contacting the journal editor. JL designed the tests, provided funds, and experimental apparatus. HL performed the tests, provided experimental apparatus.
Funding
This manuscript recieved funding from Project 51979293 supported by the National Natural Science Foundation of China and Project 2018JJ2500 supported by the Hunan Provincial Natural Science Foundation of China.
Conflict of Interest
The authors declare that the research was conducted in the absence of any commercial or financial relationships that could be construed as a potential conflict of interest.
Acknowledgments
The authors wish to acknowledge these supports. The reviewers are gratefully acknowledged for their valuable comments on the manuscript.
References
Carter, B. J., Lajtai, E. Z., and Petukhov, A. (1991). Primary and remote fracture around underground cavities. Int. J. Numer. Anal. Methods Geomec. 15, 21–40. doi: 10.1002/nag.1610150103
Chen, M. L., Jing, H. W., Ma, X. J., Su, H. J., Du, M. R., and Zhu, T. T. (2017). Fracture evolution characteristics of sandstone containing double fissures and a single circular hole under uniaxial compression. Int. J. Min. Sci. Technol. 27, 499–505. doi: 10.1016/j.ijmst.2017.03.027
Ding, X. B., Zhang, L. Y., Zhu, H. H., and Zhang, Q. (2014). Effect of model scale and particle size distribution on PFC3D simulation results. Rock Mech. Rock Eng. 47, 2139–2156. doi: 10.1007/s00603-013-0533-1
Fakhimi, A., Carvalho, F., Ishida, T., and Labuz, J. F. (2002). Simulation of failure around a circular opening in rock. Int. J. Rock Mech. Min. Sci. 39, 507–515. doi: 10.1016/s1365-1609(02)00041-2
Fan, X., Li, K. H., Lai, H. P., Xie, Y. L., Cao, R. H., and Zheng, J. (2018). Internal stress distribution and cracking around flaws and openings of rock block under uniaxial compression: a particle mechanics approach. Comput. Geotech. 102, 28–38. doi: 10.1016/j.compgeo.2018.06.002
Huang, Y. H., Yang, S. Q., Hall, M. R., Tian, W. L., and Yin, P. F. (2018). Experimental study on uniaxial mechanical properties and crack propagation in sandstone containing a single oval cavity. Arch. Civil Mecha. Eng. 18, 1359–1373. doi: 10.1016/j.acme.2018.04.005
Itasca-Consulting-Group (2014). PFC5.0 Suite Documentation: Minneapolis, Minnesota, Chap. s, MS. Minneapoli: Itasca-Consulting-Group, 55415.
Jia, P., and Zhu, W. C. (2015). Mechanism of zonal disintegration around deep underground excavations under triaxial stress – Insight from numerical test. Tunnell. Undergr. Space Techno. Inc. Trenchless Technol. Res. 48, 1–10. doi: 10.1016/j.tust.2015.01.005
Lei, W., Li, X. B., Taheri, A., Wu, Q. H., and Xie, X. F. (2018). Fracture evolution around a cavity in brittle rock under uniaxial compression and coupled static–dynamic loads. Rock Mech. Rock Eng. 51, 1–15.
Lin, H., Ding, X., Yong, R., Xu, W., and Du, S. (2019a). Effect of non-persistent joints distribution on shear behavior. C. R. Mécanique. 347, 477–489. doi: 10.1016/j.crme.2019.05.001
Lin, H., Xie, S. J., Yong, R., Chen, Y. F., and Du, S. G. (2019b). An empirical statistical constitutive relationship for rock joint shearing considering scale effect. Comptes rendus Mec. 347, 561–575. doi: 10.1016/j.crme.2019.08.001
Lin, H., Yang, H., Wang, Y., Zhao, Y., and Cao, R. (2019c). Determination of the stress field and crack initiation angle of an open flaw tip under uniaxial compression. Theoretical Appl. Fract. Mech. 104:102358. doi: 10.1016/j.tafmec.2019.102358
Liu, J. P., Li, Y. H., Xu, S. D., Xu, S., Jin, C. Y., and Liu, Z. S. (2015). Moment tensor analysis of acoustic emission for cracking mechanisms in rock with a pre-cut circular hole under uniaxial compression. Eng. Fract. Mech. 135, 206–218. doi: 10.1016/j.engfracmech.2015.01.006
Liu, T., Lin, B. Q., Yang, W., Zou, Q. L., Kong, J., and Yan, F. Z. (2016). Cracking process and stress field evolution in specimen containing combined flaw under uniaxial compression. Rock Mech. Rock Eng. 49, 3095–3113. doi: 10.1007/s00603-016-0982-4
Mas Ivars, D., Pierce, M. E., Darcel, C., Reyes-Montes, J., Potyondy, D. O., Paul Young, R., et al. (2011). The synthetic rock mass approach for jointed rock mass modelling. Int. J. Rock Mech. Min. Sci. 48, 219–244. doi: 10.1016/j.ijrmms.2010.11.014
Peng, K., Wang, Y., Quanle, Z., Zhaopeng, L., and Junhui, M. (2019b). Effect of crack angles on energy characteristics of sandstones under a complex stress path. Eng. Fract. Mech. 218:106577. doi: 10.1016/j.engfracmech.2019.106577
Peng, K., Zhou, J., Zou, Q., Zhang, J., and Wu, F. (2019a). Effects of stress lower limit during cyclic loading and unloading on deformation characteristics of sandstones. Constr. Build. Mater. 217, 202–215. doi: 10.1016/j.conbuildmat.2019.04.183
Potyondy, D. O., and Cundall, P. A. (2004). A bonded-particle model for rock. Inte. J. Rock Mech. Min. Sci. 41, 1329–1364. doi: 10.1016/j.ijrmms.2004.09.011
Salehnia, F., Collin, F., Li, X. L., Dizier, A., Sillen, X., and Charlier, R. (2015). Coupled modeling of excavation damaged zone in boom clay: strain localization in rock and distribution of contact pressure on the gallery’s lining. Comput. Geotech. 69, 396–410. doi: 10.1016/j.compgeo.2015.06.003
Tao, M., Zhao, H. T., Li, X. B., Li, X., and Du, K. (2018). Failure characteristics and stress distribution of pre-stressed rock specimen with circular cavity subjected to dynamic loading. Tunnell. Undergr. Space Technol. 81, 1–15. doi: 10.1016/j.tust.2018.06.028
Teng, J. Y., Tang, J. X., and Li, X. Y. (2018). Mechanical properties and crack propagation law of rock with pores and anchors. Chin. J. Rock Mech. Eng. 37, 87–103.
Wang, C., Pan, L., Zhao, Y., Zhang, Y., and Shen, W. (2019). Analysis of the pressure-pulse propagation in rock: a new approach to simultaneously determine permeability, porosity, and adsorption capacity. Rock Mech. Rock Eng. 52, 4301–4317. doi: 10.1007/s00603-019-01874-w
Wang, X., and Tian, L. G. (2018). Mechanical and crack evolution characteristics of coal–rock under different fracture-hole conditions: a numerical study based on particle flow code. Environ. Earth Sci. 77, 297.
Xie, L. M., Zhu, W. C., Wang, S. H., and Niu, L. L. (2011). Parallel computational analysis of three-dimensional fracture process of rock samples with holes. Chin. J. Geotechn. Eng. 33, 1447–1455.
Yang, S. Q., Chen, M., Jing, H. W., Chen, K. F., and Meng, B. (2017). A case study on large deformation failure mechanism of deep soft rock roadway in Xin’An coal mine. China. Eng. Geol. 217, 89–101. doi: 10.1016/j.enggeo.2016.12.012
Zhang, C. Y., Pu, C. Z., Cao, R. H., Jiang, T. T., and Huang, G. (2019). The stability and roof-support optimization of roadways passing through unfavorable geological bodies using advanced detection and monitoring methods, among others, in the sanmenxia bauxite mine in China’s Henan Province. Bull. Eng. Geol. Environ. 78, 5087–5099. doi: 10.1007/s10064-018-01439-1
Zhang, Q., Wang, X., Tian, L-G, and Huang, D.-M. (2018). Analysis of mechanical and acoustic emission characteristics of rock materials with double-hole defects based on particle flow code. Shock Vib. 2018, 1–11. doi: 10.1155/2018/7065029
Zhao, C., Matsuda, H., Morita, C., and Shen, M. R. (2011). Study on failure characteristic of rock-like materials with an open-hole under uniaxial compression. Strain 47, 405–413. doi: 10.1111/j.1475-1305.2009.00701.x
Zhao, X. D., Zhang, H. X., and Zhu, W. C. (2014). Fracture evolution around pre-existing cylindrical cavities in brittle rocks under uniaxial compression. Trans. Nonferrous Metals Soc. China 24, 806–815. doi: 10.1016/s1003-6326(14)63129-0
Zhao, Y., Wang, C., Zhang, Y., and Liu, Q. (2019b). Experimental study of adsorption effects on shale permeability. Nat. Resour. Res. 28, 1575–1586. doi: 10.1021/acs.langmuir.9b00813
Zhao, Y. L., Tang, J. Z., Chen, Y., Zhang, L. Y., Wang, W. J., Wan, W., et al. (2017). Hydromechanical coupling tests for mechanical and permeability characteristics of fractured limestone in complete stress–strain process. Environ. Earth Sci. 76, 1–18. doi: 10.1007/s12665-016-6322-x
Zhao, Y., Wang, Y., Wang, W., Tang, L., Liu, Q., and Cheng, G. (2019a). Modeling of rheological fracture behavior of rock cracks subjected to hydraulic pressure and far field stresses. Theoretical Appl. Fract. Mech. 101, 59–66. doi: 10.1016/j.tafmec.2019.01.026
Zhao, Y. L., Wang, Y. X., Wang, W. J., Wan, W., and Tang, J. Z. (2017a). Modeling of non-linear rheological behavior of hard rock using triaxial rheological experiment. Int. J. Rock Mech. Mi. Sci. 93, 66–75. doi: 10.1016/j.ijrmms.2017.01.004
Zhao, Y. L., Zhang, L. Y., Wang, W. J., Tang, J. Z., Lin, H., and Wan, W. (2017b). Transient pulse test and morphological analysis of single rock fractures. Int. J. Rock Mech. Min. Sci. 91, 139–154. doi: 10.1016/j.ijrmms.2016.11.016
Zhao, Y. L., Zhang, L. Y., Wang, W. J., Pu, C. Z., Wan, W., and Tang, J. Z. (2016). Cracking and stress-strain behavior of rock-like material containing two flaws under uniaxial compression. Rock Mech. Rock Eng. 49, 2665–2687. doi: 10.1007/s00603-016-0932-1
Zhao, Y. L., Zhang, L. Y., Wang, W. J., Wan, W., and Ma, W. (2018). Separation of elastoviscoplastic strains of rock and a nonlinear creep model. Int. J. Geomech. 18:04017129. doi: 10.1061/(ASCE)GM.1943-5622.0001033
Keywords: triaxial cyclic loading, granite, crack propagation, bonded particle model, failure characteristics
Citation: Zhou X, Li J and Lin H (2020) Analysis of Internal Stress Distribution and Mechanics Characteristics of Pre-existing Cavity in Brittle Rock Under Triaxial Cyclic Loading. Front. Earth Sci. 8:33. doi: 10.3389/feart.2020.00033
Received: 10 September 2019; Accepted: 29 January 2020;
Published: 20 February 2020.
Edited by:
Sébastien Merkel, Lille University of Science and Technology, FranceReviewed by:
Matthew Louis Whitaker, Stony Brook University, United StatesKang Peng, Chongqing University, China
Yujun Zuo, Guizhou University, China
Copyright © 2020 Zhou, Li and Lin. This is an open-access article distributed under the terms of the Creative Commons Attribution License (CC BY). The use, distribution or reproduction in other forums is permitted, provided the original author(s) and the copyright owner(s) are credited and that the original publication in this journal is cited, in accordance with accepted academic practice. No use, distribution or reproduction is permitted which does not comply with these terms.
*Correspondence: Jiangteng Li, bGp0Y3N1QDE2My5jb20=; bGp0Y3N1MjAxOUAxMjYuY29t