 Xueying Liu
 Jin Yu1*
- 1Fujian Research Center for Tunneling and Urban Underground Space Engineering, Huaqiao University, Xiamen, China
- 2College of Engineering, Fujian Jiangxia University, Fuzhou, China
For the underground engineering, time-dependent behavior (i.e., creep) of rocks is one of the main reasons for instability of surrounding rock in great stress conditions. It is important to investigate more details on time-dependent deformation for understanding the mechanical behavior of rock over timescales. In the present work, conventional compression tests were performed firstly to study mechanical properties and determine the stress levels for creep tests. Secondly, the creep behavior of the marble was investigated at the great stress proportion of 80, 85, and 90% of corresponding peak strength under uniaxial and triaxial compression, combined with Acoustic Emission (AE) technique. Results show that creep curves at the stress ratio of 80 and 85% exhibit three stages of the idealized creep curves, while curves at the stress ratio of 90% exhibit two stages. Damage variables, calculated based on instantaneous cumulative AE energy and total amount, augment slightly initially and increase rapidly subsequently before failure, and the turning points in D-t/tf curves can be observed when t/tf is 0.3, defined as the initial-damage escalation threshold, and D increases moderately when t/tf exceeds 0.85. These results provide a foundation to study creep behavior and predict creep failure.
Notation
ν, Poisson ratio; VP m/s, P-wave velocity; VS m/s, S-wave velocity; εV, volumetric strain; ε1, axial strain; ε3, lateral strain; σcd MPa, crack damage stress; σP MPa, peak strength; σ1 MPa, axial stress; σ3 MPa, confining pressures; C MPa, cohesion; φ, friction angle; h–1, axial strain rate; h–1, volumetric strain rate; εc, creep strain; ε0, transient strain; εt, total strain; β, the percentage of creep strain to the total strain.
Introduction
Rocks under constant stresses have time-dependent characteristics, namely, creep. In some great-stress conditions, creep can cause instability and failure of rock. The characteristics of creep behavior are important to predict the long-term evolution of rock engineering. In 1939, Griggs performed creep studies on rock and reported that rock deformation varied with time at a certain stress level (Griggs, 1939). Researchers have made great efforts to perform experiments to analyze features on different kinds of rock, such as granite (Lin et al., 2009; Chen et al., 2015; Xu et al., 2017), shale (Sone and Zoback, 2014), rock salt (Mansouri and Ajalloeian, 2018), sandstone (Brantut et al., 2014b; Chen et al., 2018), limestone (Brantut et al., 2014a; Nicolas et al., 2017), and coal (Ma et al., 2018; Zhang et al., 2019). Additionally, effects of loading history, including single-stage, multi-level loading (Zhao et al., 2017b; Yang et al., 2018), cycle loading and unloading (Chen et al., 2018) were investigated, and numerous researches focused on the temperatures (Xu et al., 2017), water (Liu and Shao, 2017; Yu C. et al., 2019), as well as initial porosity (Brantut et al., 2013). On the other hand, theoretical analysis has been also conducted. Because traditional models, such as Kelvin and Burgers, cannot be directly used to estimate the accelerated stage, researchers revised those traditional models to investigate and stimulate creep behaviors (Cao et al., 2016; Zhao et al., 2017a, b,c; Singh et al., 2018; Niu et al., 2019; Wu et al., 2019; Yu J. et al., 2019). For example, researchers proposed a new model based on variable-order fractional derivatives assuming the coefficient constant as a function of time (Singh et al., 2018; Wu et al., 2019). Previous work reveals that brittle creep exhibits three stages of idealized creep behavior, decelerated creep, steady creep, and accelerated creep until failure. The failure of rock is a result of damage evolution induced by cracks production and extension during the process.
Some methods have been used to estimate the damage over the failure process, such as CT scanning and Acoustic Emission (AE) (Yu et al., 2015b). AE technique, a non-destructive method, has been used to monitor and forecast the rockburst since the mid-1950s. Researchers have studied the relationship between AE characteristics and rock damage (Viitanen et al., 2019; Zhu et al., 2019). Additionally, AE was used to predict earthquakes and damage characterization (Wang et al., 2017; Yao et al., 2020). AE is a promising method for investigating rock damage and failure.
Although researchers have studied the creep deformation and failure, however, specific damage evolution over the creep process is paid little attention. The present work aims to study the creep behavior and damage evolution of rock specimens using AE under stresses approaching the peak strength. Conventional compression experiments were performed initially to determine mechanical properties, and subsequently, a series of creep experiments were performed at various stress ratios, namely 80, 85, and 90% of the corresponding peak strength combined with AE technique.
Experimental Materials and Methods
Material
Marble blocks were obtained from Hezhou, Guangxi Province, China with the depth of 100–150 m and in situ stress of approximately 2.3–3.7 MPa. All specimens were from the same rectangular block in the same direction. Specimens were drilled, cut and polished into 50 mm × 100 mm cylinder standard specimens in accordance with the experiment specification recommended by International Society for Rock Mechanics (ISRM) as shown in Figure 1A. Specimens with obvious flaws were dismissed, and remained specimens were subjected to acoustic tests to measure P-wave and S-wave velocities. Subsequently, specimens with similar velocities were selected for experiments. Poisson ratio can be determined based on wave velocities by the following Eq. 1. Mechanical properties of marble specimens were presented in Table 1.
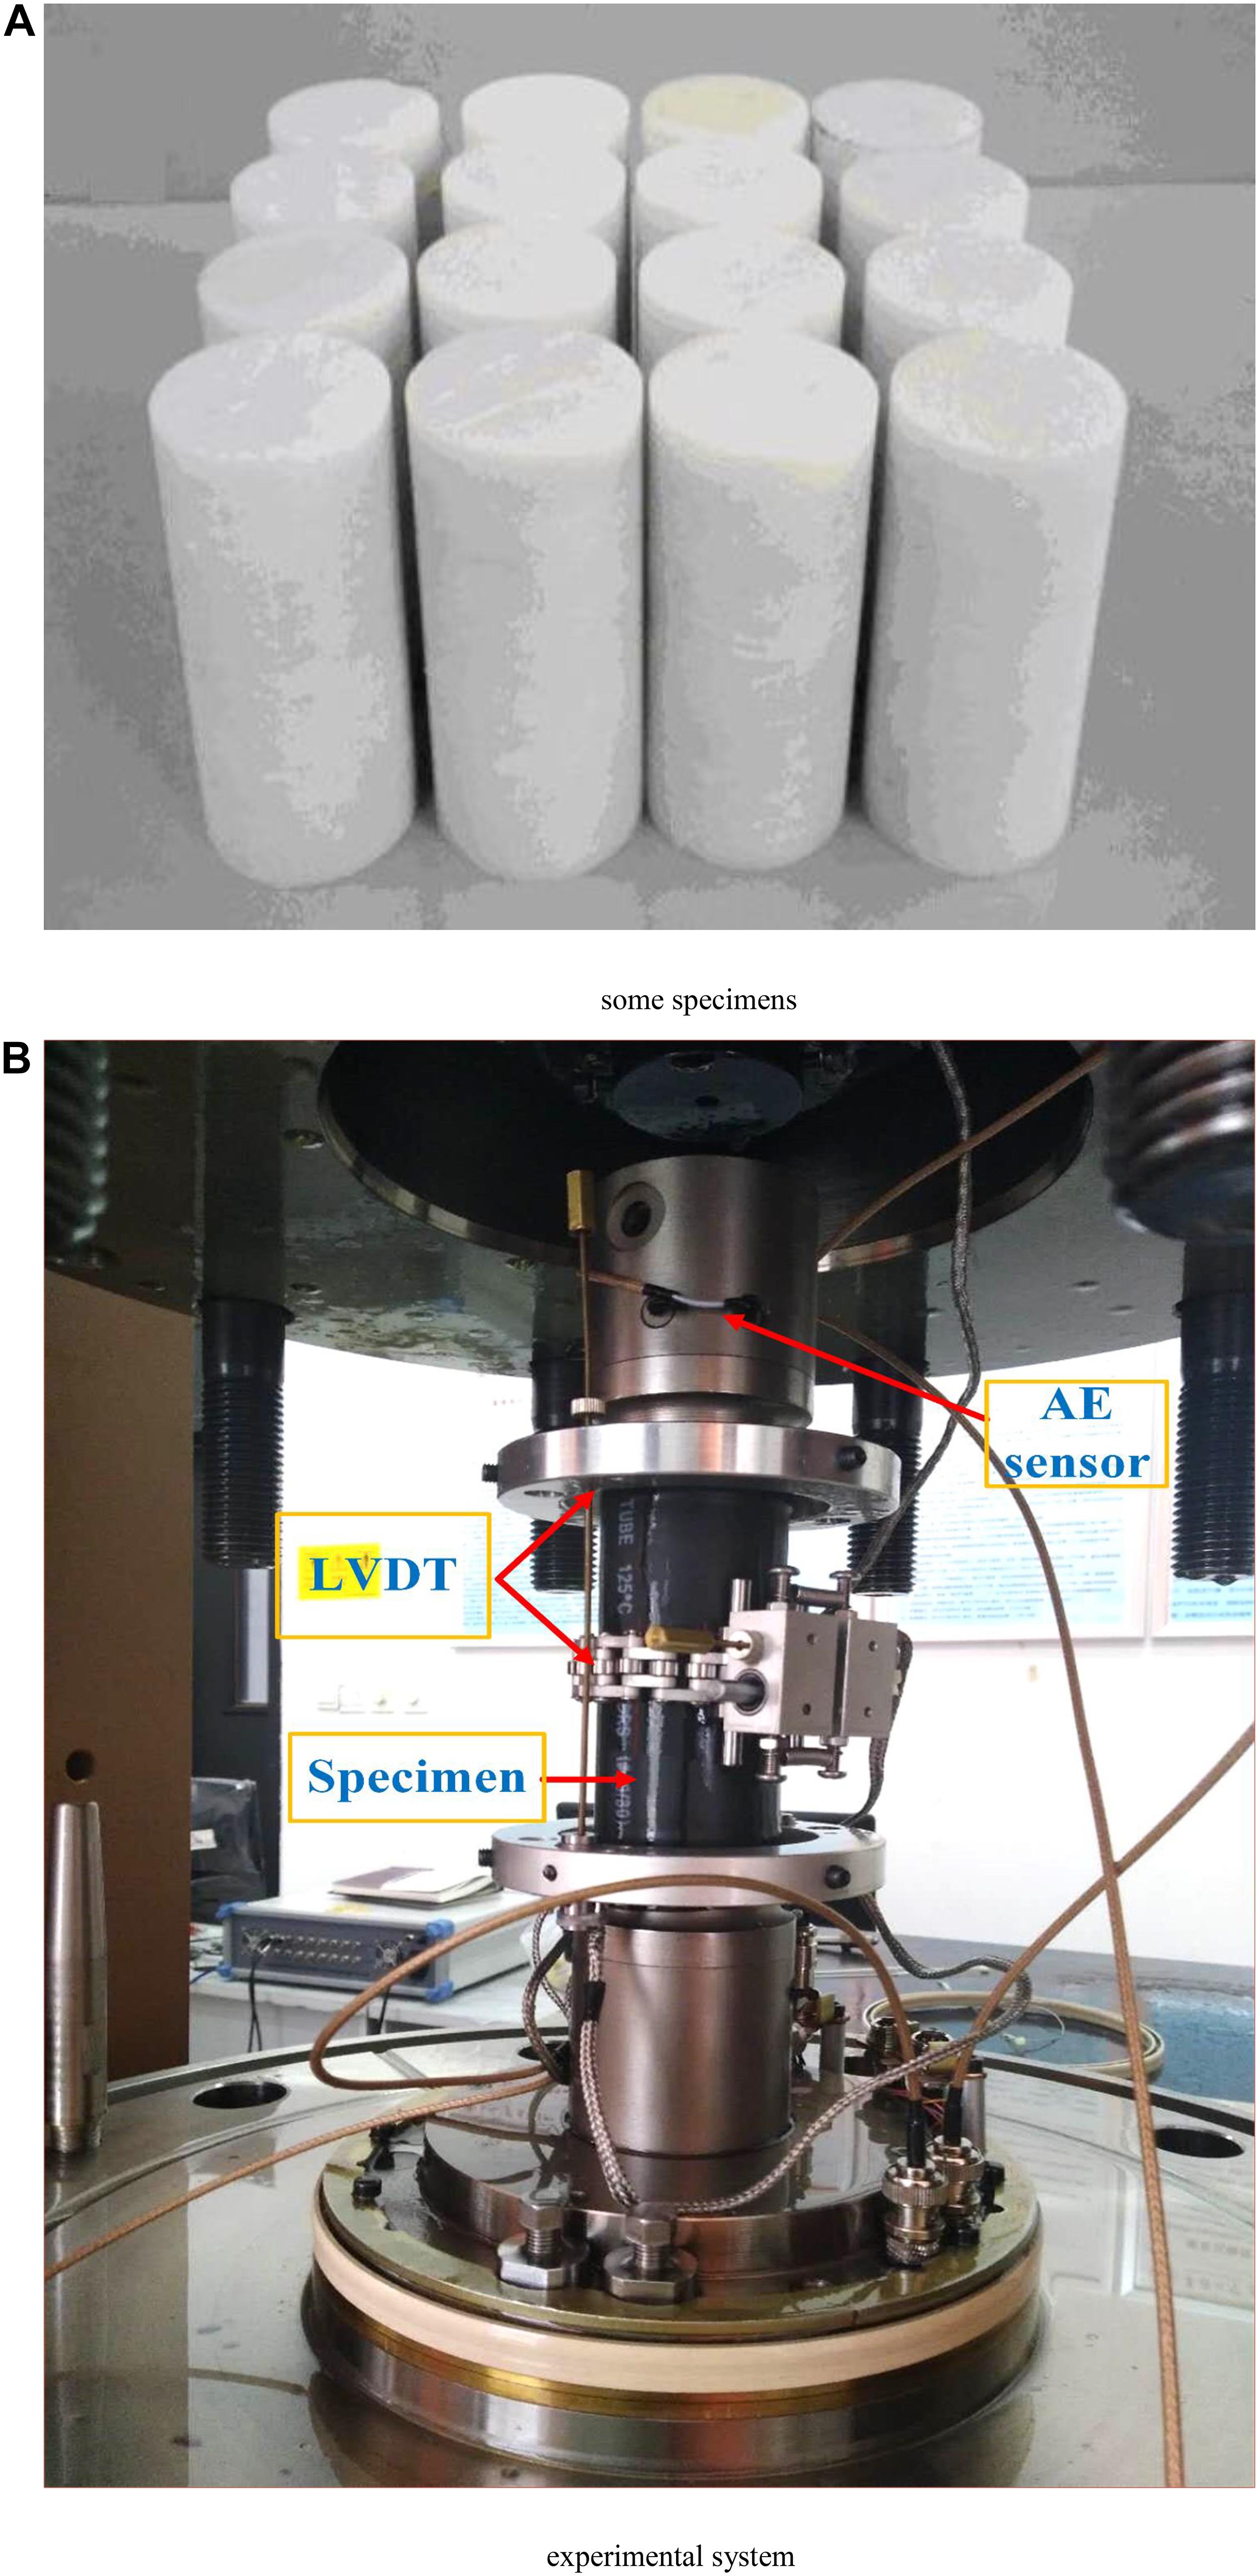
Figure 1. Specimens and system. (A) Some specimens. (B) Experimental system.
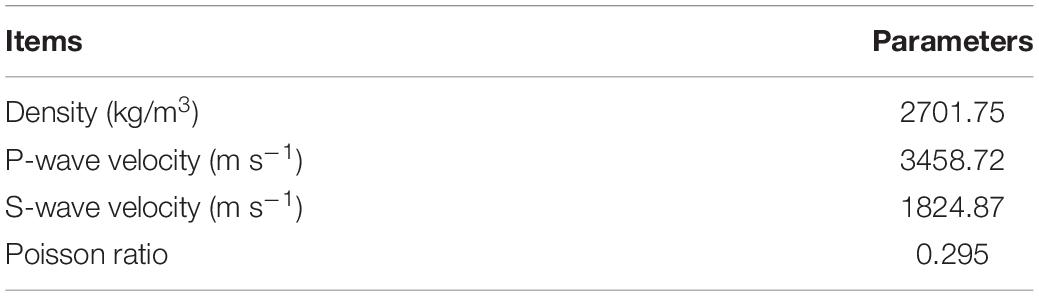
Table 1. Physical properties of marble specimens.
where v is Poisson ratio, and VP and VS are P- and S-wave velocity, respectively.
Experiment Apparatus
Experiments in the present work were performed with the TFD-2000/D servo-controlled triaxial test system as shown in Figure 1B (Chen and Zhang, 2017). This self-developed system included three main parts, a loading system, a pore water loading system, and a dynamic disturbance system. The maximum axial loading was 2000 KN and the maximum confining pressure was 70 MPa. The axial and lateral strains were measured by a pair of linear variable differential transformers (LVDT) placed between the top and middle surface of a specimen, respectively, which is similar to that in conventional compression tests (Yu et al., 2016; Yao et al., 2019). The volume strain can be determined,
where εV, ε1, and ε3 are volumetric, axial and lateral strains respectively.
Furthermore, The AE system (DS5-16), manufactured by the Beijing Softland Times Scientific Technology Corporation, was used to monitor the damage process. In the present work, two sensors were attached to the pressing head shown in Figure 1B. The frequency of the sensors ranges from 16 to 60 kHz, and the central frequency is 40 kHz. The threshold was fixed at the 100 dB and preamplifier gain was 40 dB with the accuracy of 1 dB. The sampling rate was 1 M/s. This system can record AE events over the rock damage and failure process.
Experimental Method
Firstly, a series of conventional compression experiments were performed to determine the stress threshold in creep experiments under confining pressures of 0, 2.5, and 5 MPa at a constant axial displacement rate of 0.05 mm/min until specimen failure respectively. Figure 2 presents stress-strain curves at various confining pressures. The crack damage stresses, σcd, were 32, 40, and 45 MPa, respectively for the confining pressures of 0, 2.5, and 5 MPa, and the peak stresses, σP, were 45, 55, and 65 MPa, respectively. The proportion of σcd/σP was approximately 70% and consequently, after analysis and comparison, the stress threshold for creep was determined as 80, 85, and 90% of the corresponding peak strength at each confining pressure.
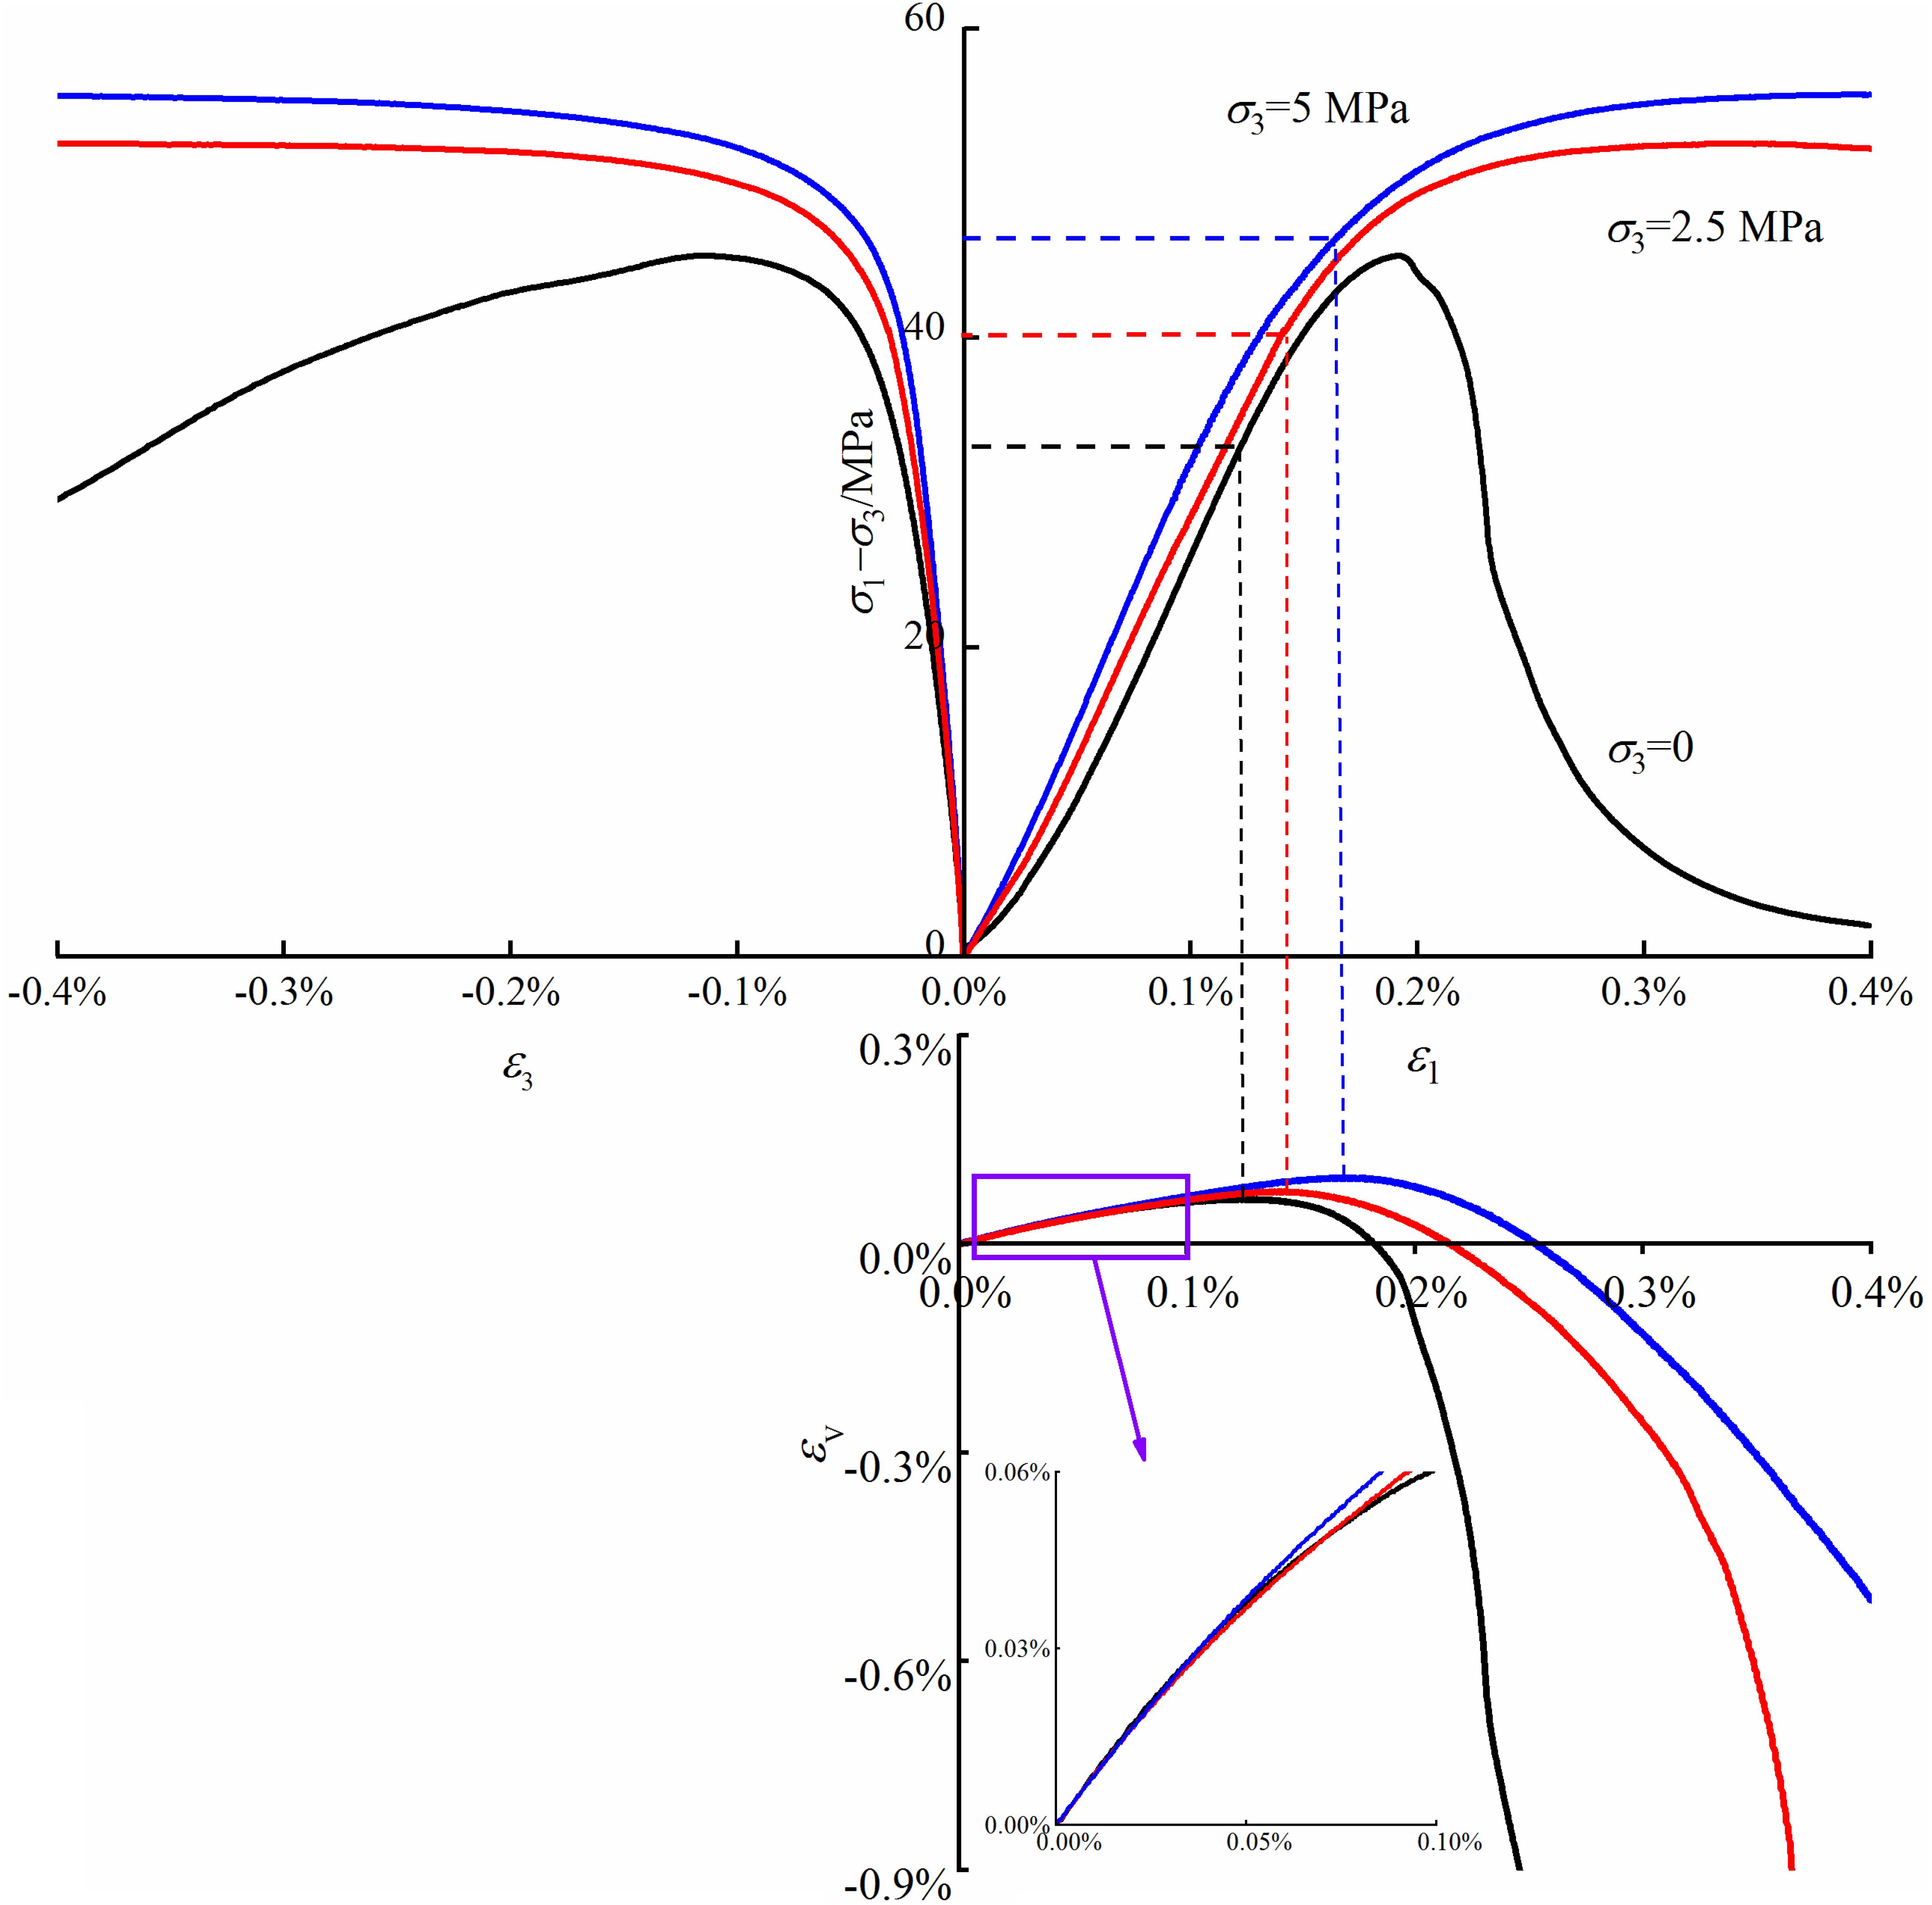
Figure 2. Stress–strain curves under different confining pressures.
Experiments were performed firstly by loading at a constant loading rate of 500 N/s to the predefined stress. Subsequently, the stress was kept constant, and all of the strain, stress and AE parameters were kept recording until specimen failure.
Results and Discussion
Conventional Compression Tests
When rock specimens are subjected to load, microcracks are produced, propagated, and interconnected, resulting in the occurrence of a great number of damage in the interior of specimens. During the damage evolution, the elastic energy is released, namely AE, and it is indicated that AE characteristics are related to the damage and failure of rock specimens. The AE waveform is surrounded by an envelope, and the area under the envelope is AE energy. AE energy is rather representative and can be used to assess the strength of AE, and further the damage of rock. In the present work, the damage variable, D, is defined using AE energy by the following function (Zhang et al., 2015).
where N is the instantaneous accumulated AE energy and Nf is total AE energy over the creep failure process.
Figure 3 illustrates the variation of volumetric strain rates, AE energy and D plotted with axial strains under uniaxial compression, as the typical specimen. The failure process is generally divided into five stages of the typical failure process, crack closure, elastic deformation, stable crack growth, unstable crack growth and failure after the peak in earlier studies (Yu et al., 2015a; Cai et al., 2016). Besides, a division in the post-peak stage, decelerating expansion, was proposed after the peak of the maximum volumetric rate (Cai et al., 2017) (shown in Figure 3). In the first stage, because some pre-exist microcracks become closed, stress-strain curve is not linear and volumetric strain rates decrease. Obvious AE energy can be noted and D increases moderately. As the stress approaches the crack closure stress, the pre-exist microcracks are closed completely and D reaches 0.08. Subsequently, the deformation enters into the next stages and the elastic deformation can be observed. Meanwhile, volumetric strain rates and D increases slightly. With a further increase of the stress, the new cracks occur and the AE energy is observed densely. D increases moderately to approximately 0.25. As the load exceeds σcd, the coalescence of microcracks begins, and crack density may reach a critical state. The volumetric strain rate increases rapidly and AE energy occurs densely. D augments to 0.5 with the stress approaching the peak. When the load exceeds σP, numerous cracks propagate continuously, and consequently volumetric strain rates and AE energy augments continuously. As the volumetric strain rates exhibit the maximum, D rises to approximately 0.8. In the final stage, volumetric strain rates decrease rapidly and great AE energy can be noted densely, indicating the specimen failure. In general, both volumetric strain rate and D are similar from the second to fifth stage to some extent.
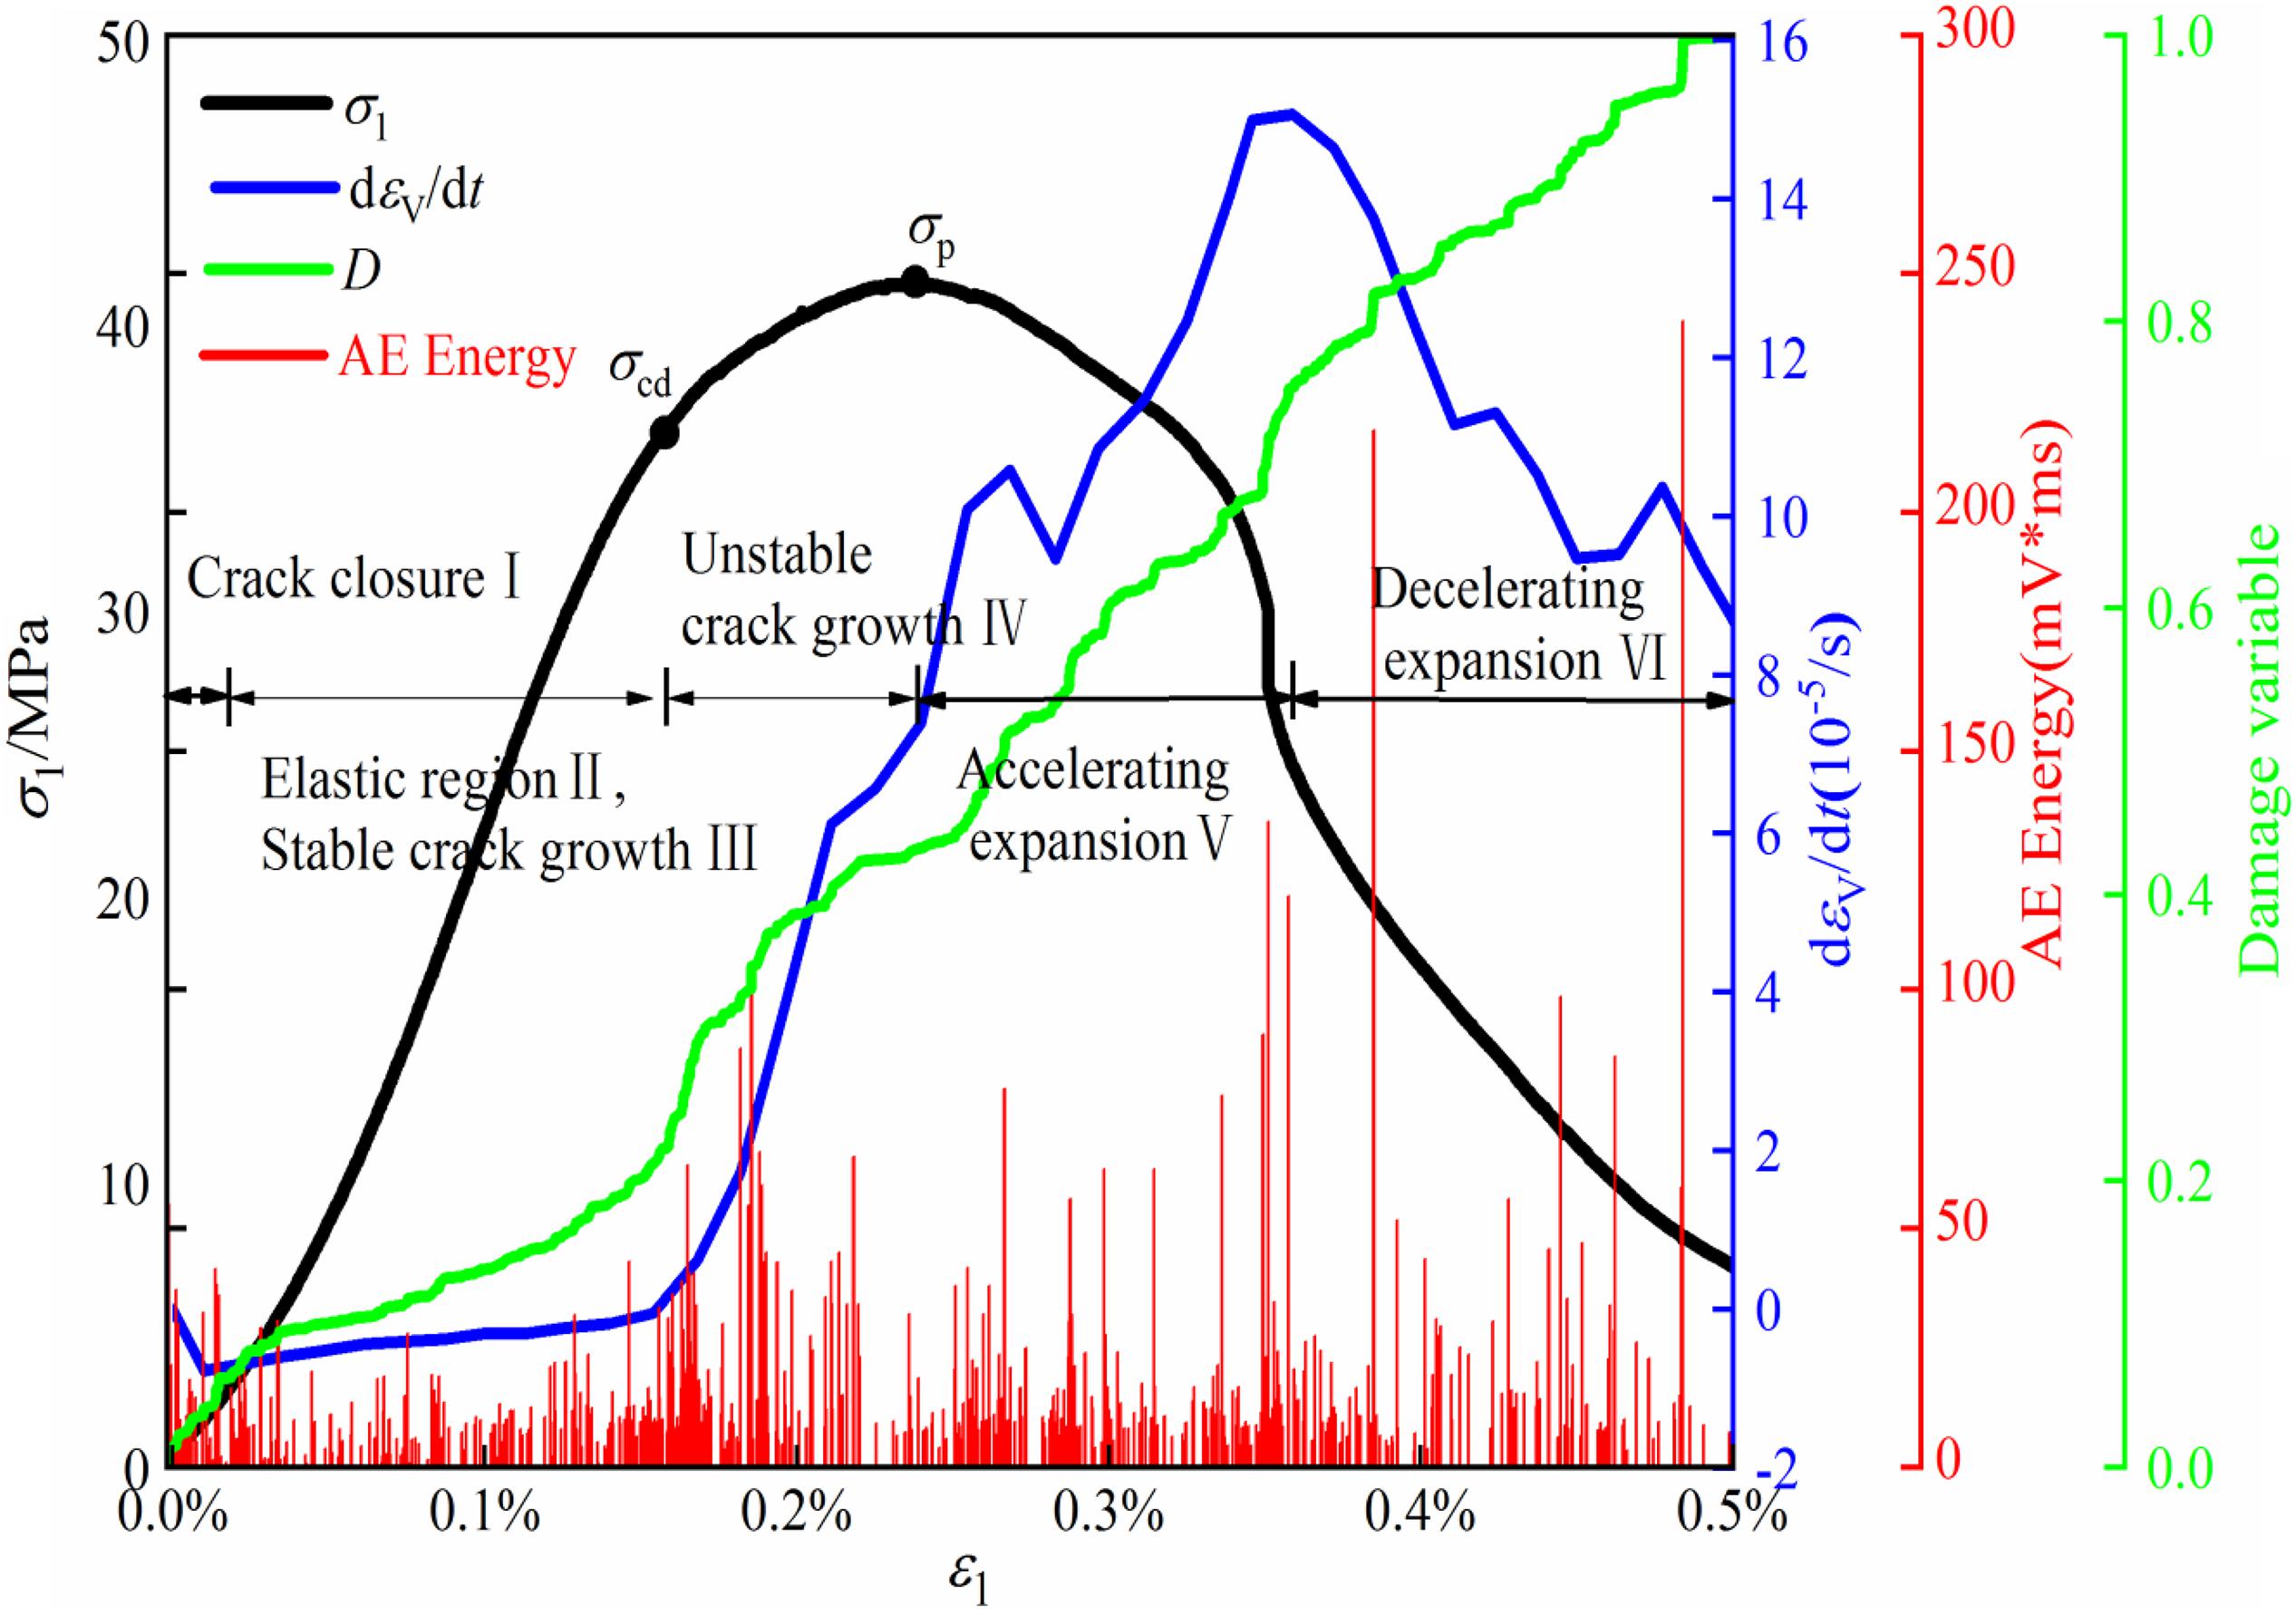
Figure 3. Failure process under unaxial compression.
Experimental Results of Creep Failure and Discussion
The Evolution of Strain and Its Rates
Figure 4 illustrates the axial and volumetric strain under different confining pressures at the constant stresses corresponding to 80, 85, and 90% of the peak strength. It is noted that marble specimens exhibit three-stage creep failure, transient, steady and accelerated creep phase at low stress ratios, namely 80 and 85%, while specimens exhibit two-stage creep failure, transient and accelerated phase at the stress ratio of 90%. The transient axial strain increases slightly with the increase of stress ratios under the same confining pressure. Compared with the axial strain, the volumetric strain augments moderately due to the fast increase of lateral strain. The significant variation of volumetric strain reveals that creep failure is the main result of compression-induced expansion in the lateral dimension.
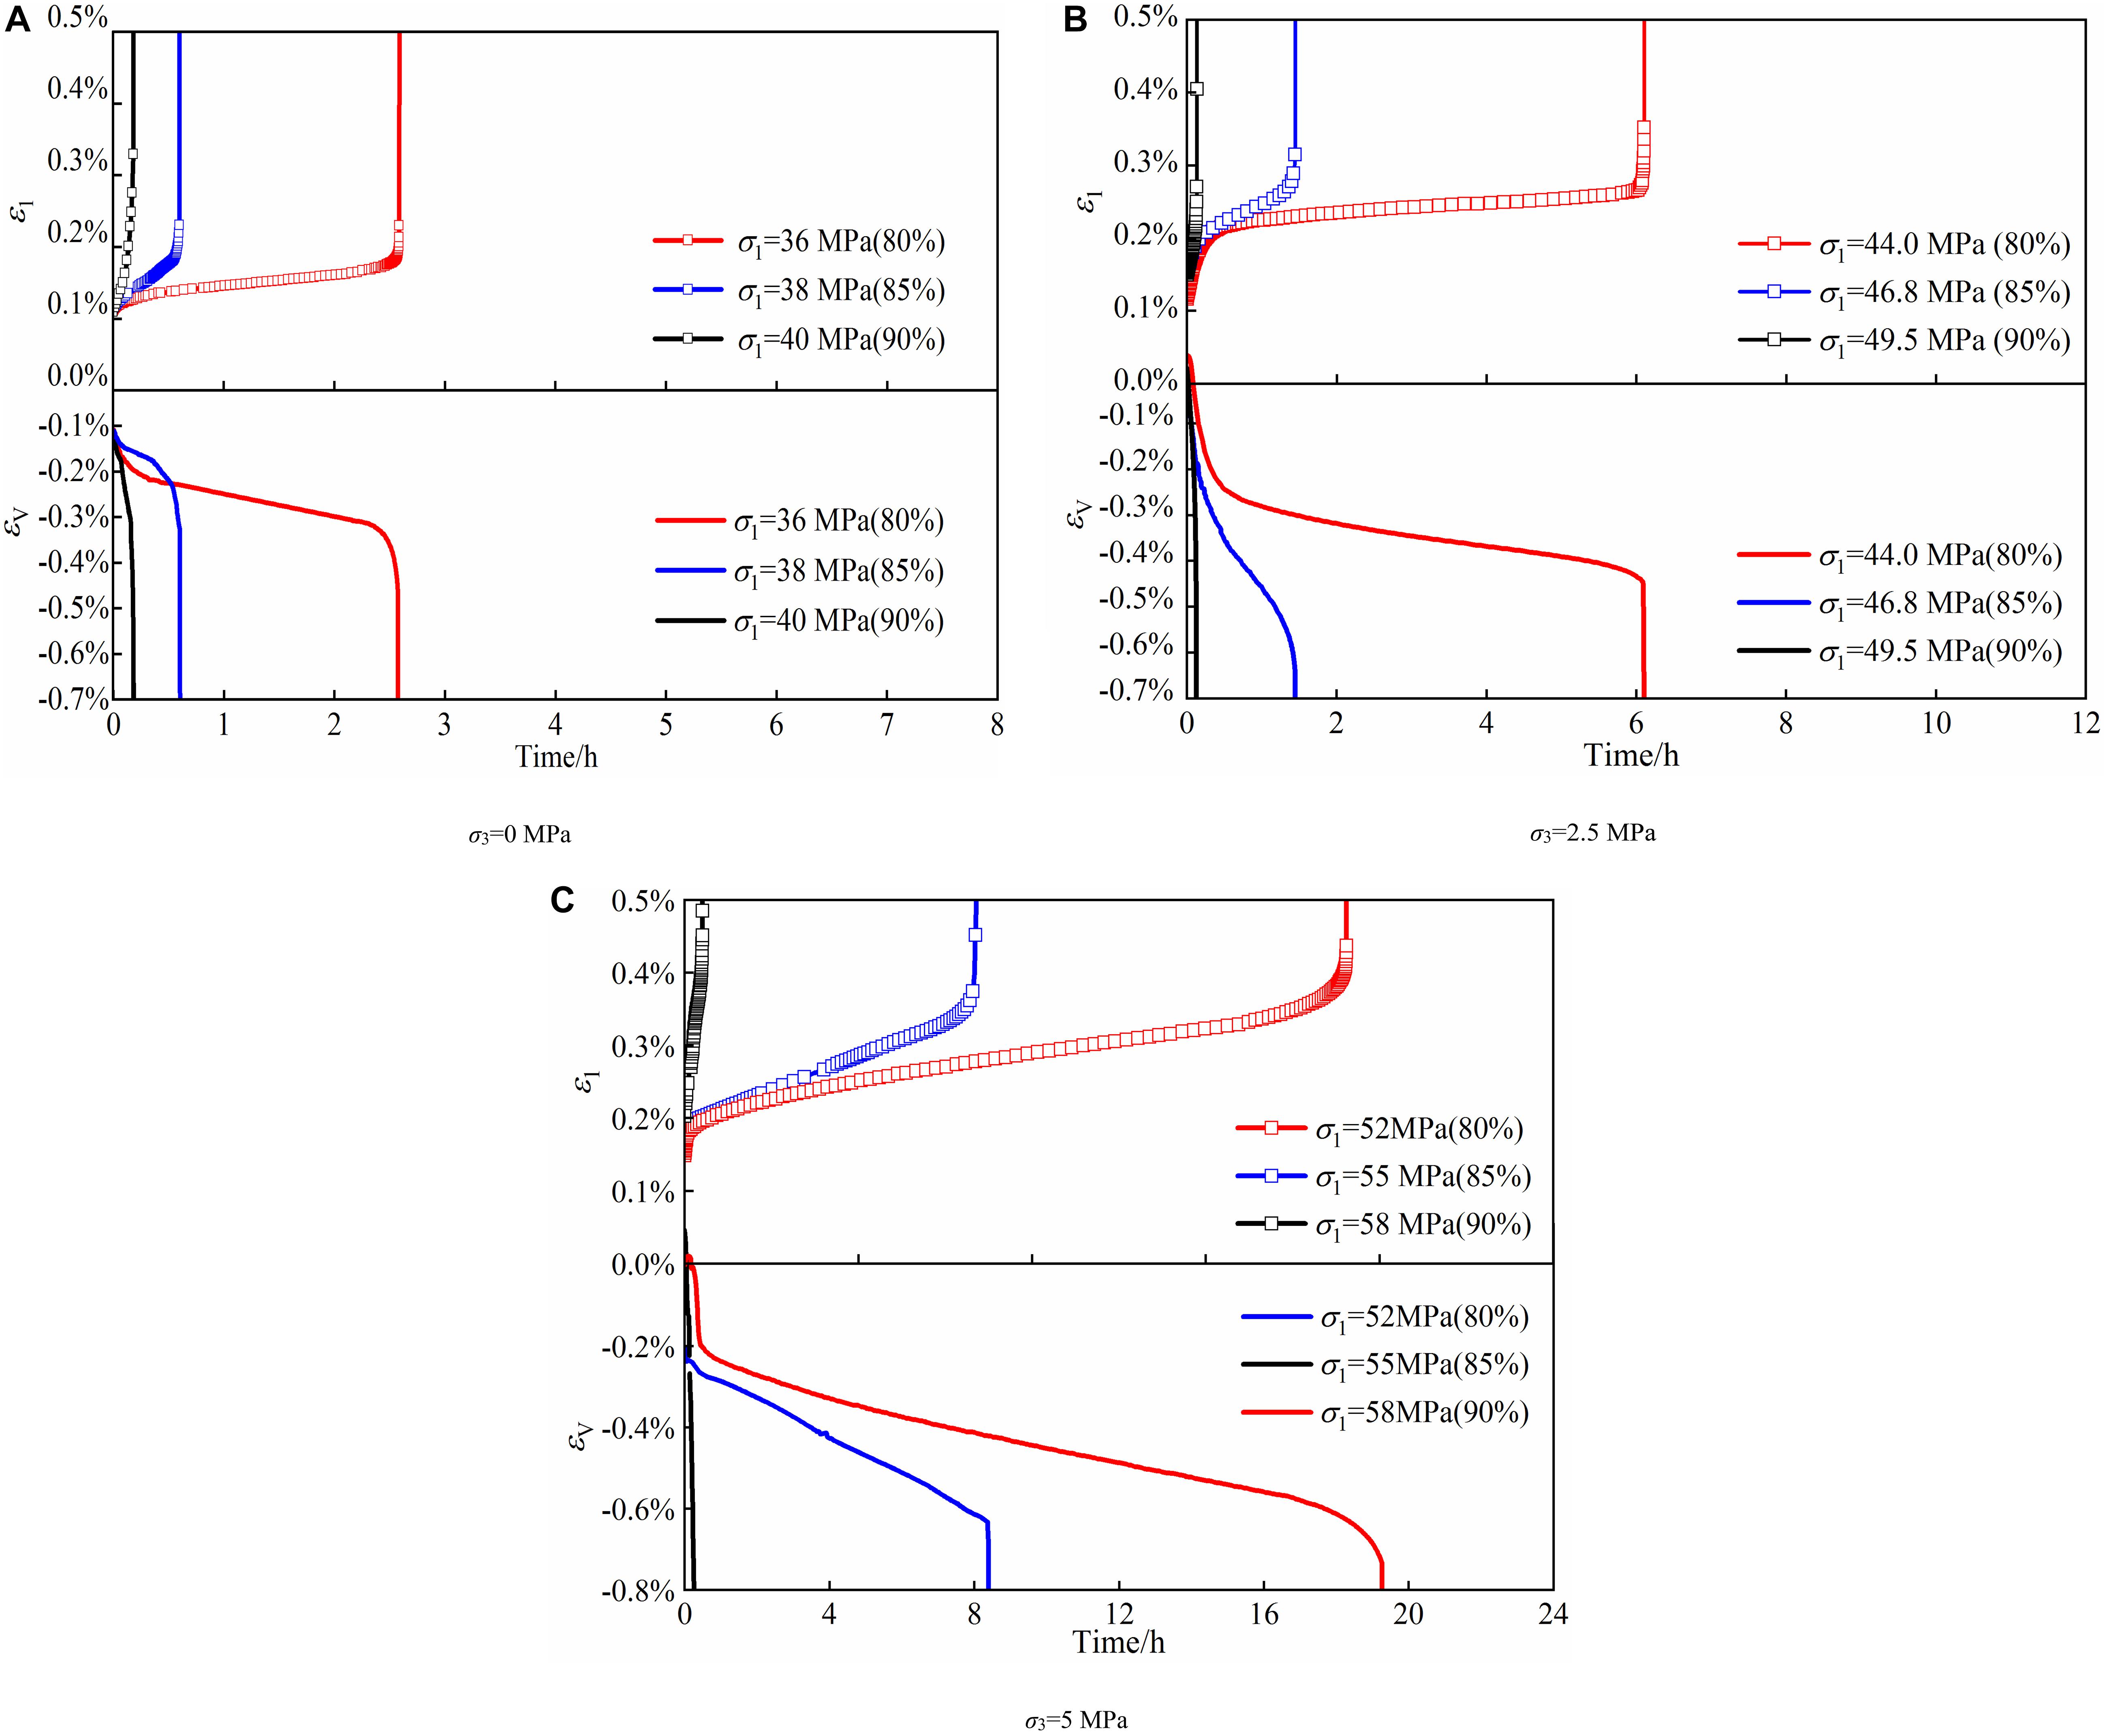
Figure 4. Axial strain vs. time under various confining pressures. (A) σ3 = 0 MPa. (B) σ3 = 2.5 MPa. (C) σ3 = 5 MPa.
The percentage of creep strain (εc) to the total strain (εt) of transient strain (ε0) and creep strain is defined as β.
Figure 5 shows the relationship between the percentages with the stresses. β ranges from 46 to 49% with the increase of stresses from 36 to 46.8 MPa, and it augments moderately to 55% as the stress reaches 55 MPa. This indicates both transient strain and creep strain are equally important components in the total deformation. The previous literature reported the transient strain is the main reason for the damage and there is a threshold on the stress level, approximately 45% of peak strength (Yu C. et al., 2019). Transient strain could be the main dominant portion of the deformation under low stresses (for example, <50% corresponding strength), and creep strain could become increasingly significant with the increase of loading.

Figure 5. Relationship between β with aixial stresses.
Instantaneous axial and volumetric strain rates are calculated based on equations as follows,
As shown in Figure 6, the axial strain rate decreases from 0.003 to 10–4 h–1, and the volumetric strain rate declines from 0.01 h–1 to 3.27 × 10⁻⁴ h–1 at the stress portion of 80% under confining pressure of 2.5 MPa. It is noted that both axial and volumetric strain rates increase continuously at the stress ratio of 90% until specimen failure, which are similar to those in previously conventional compression tests to some extent.
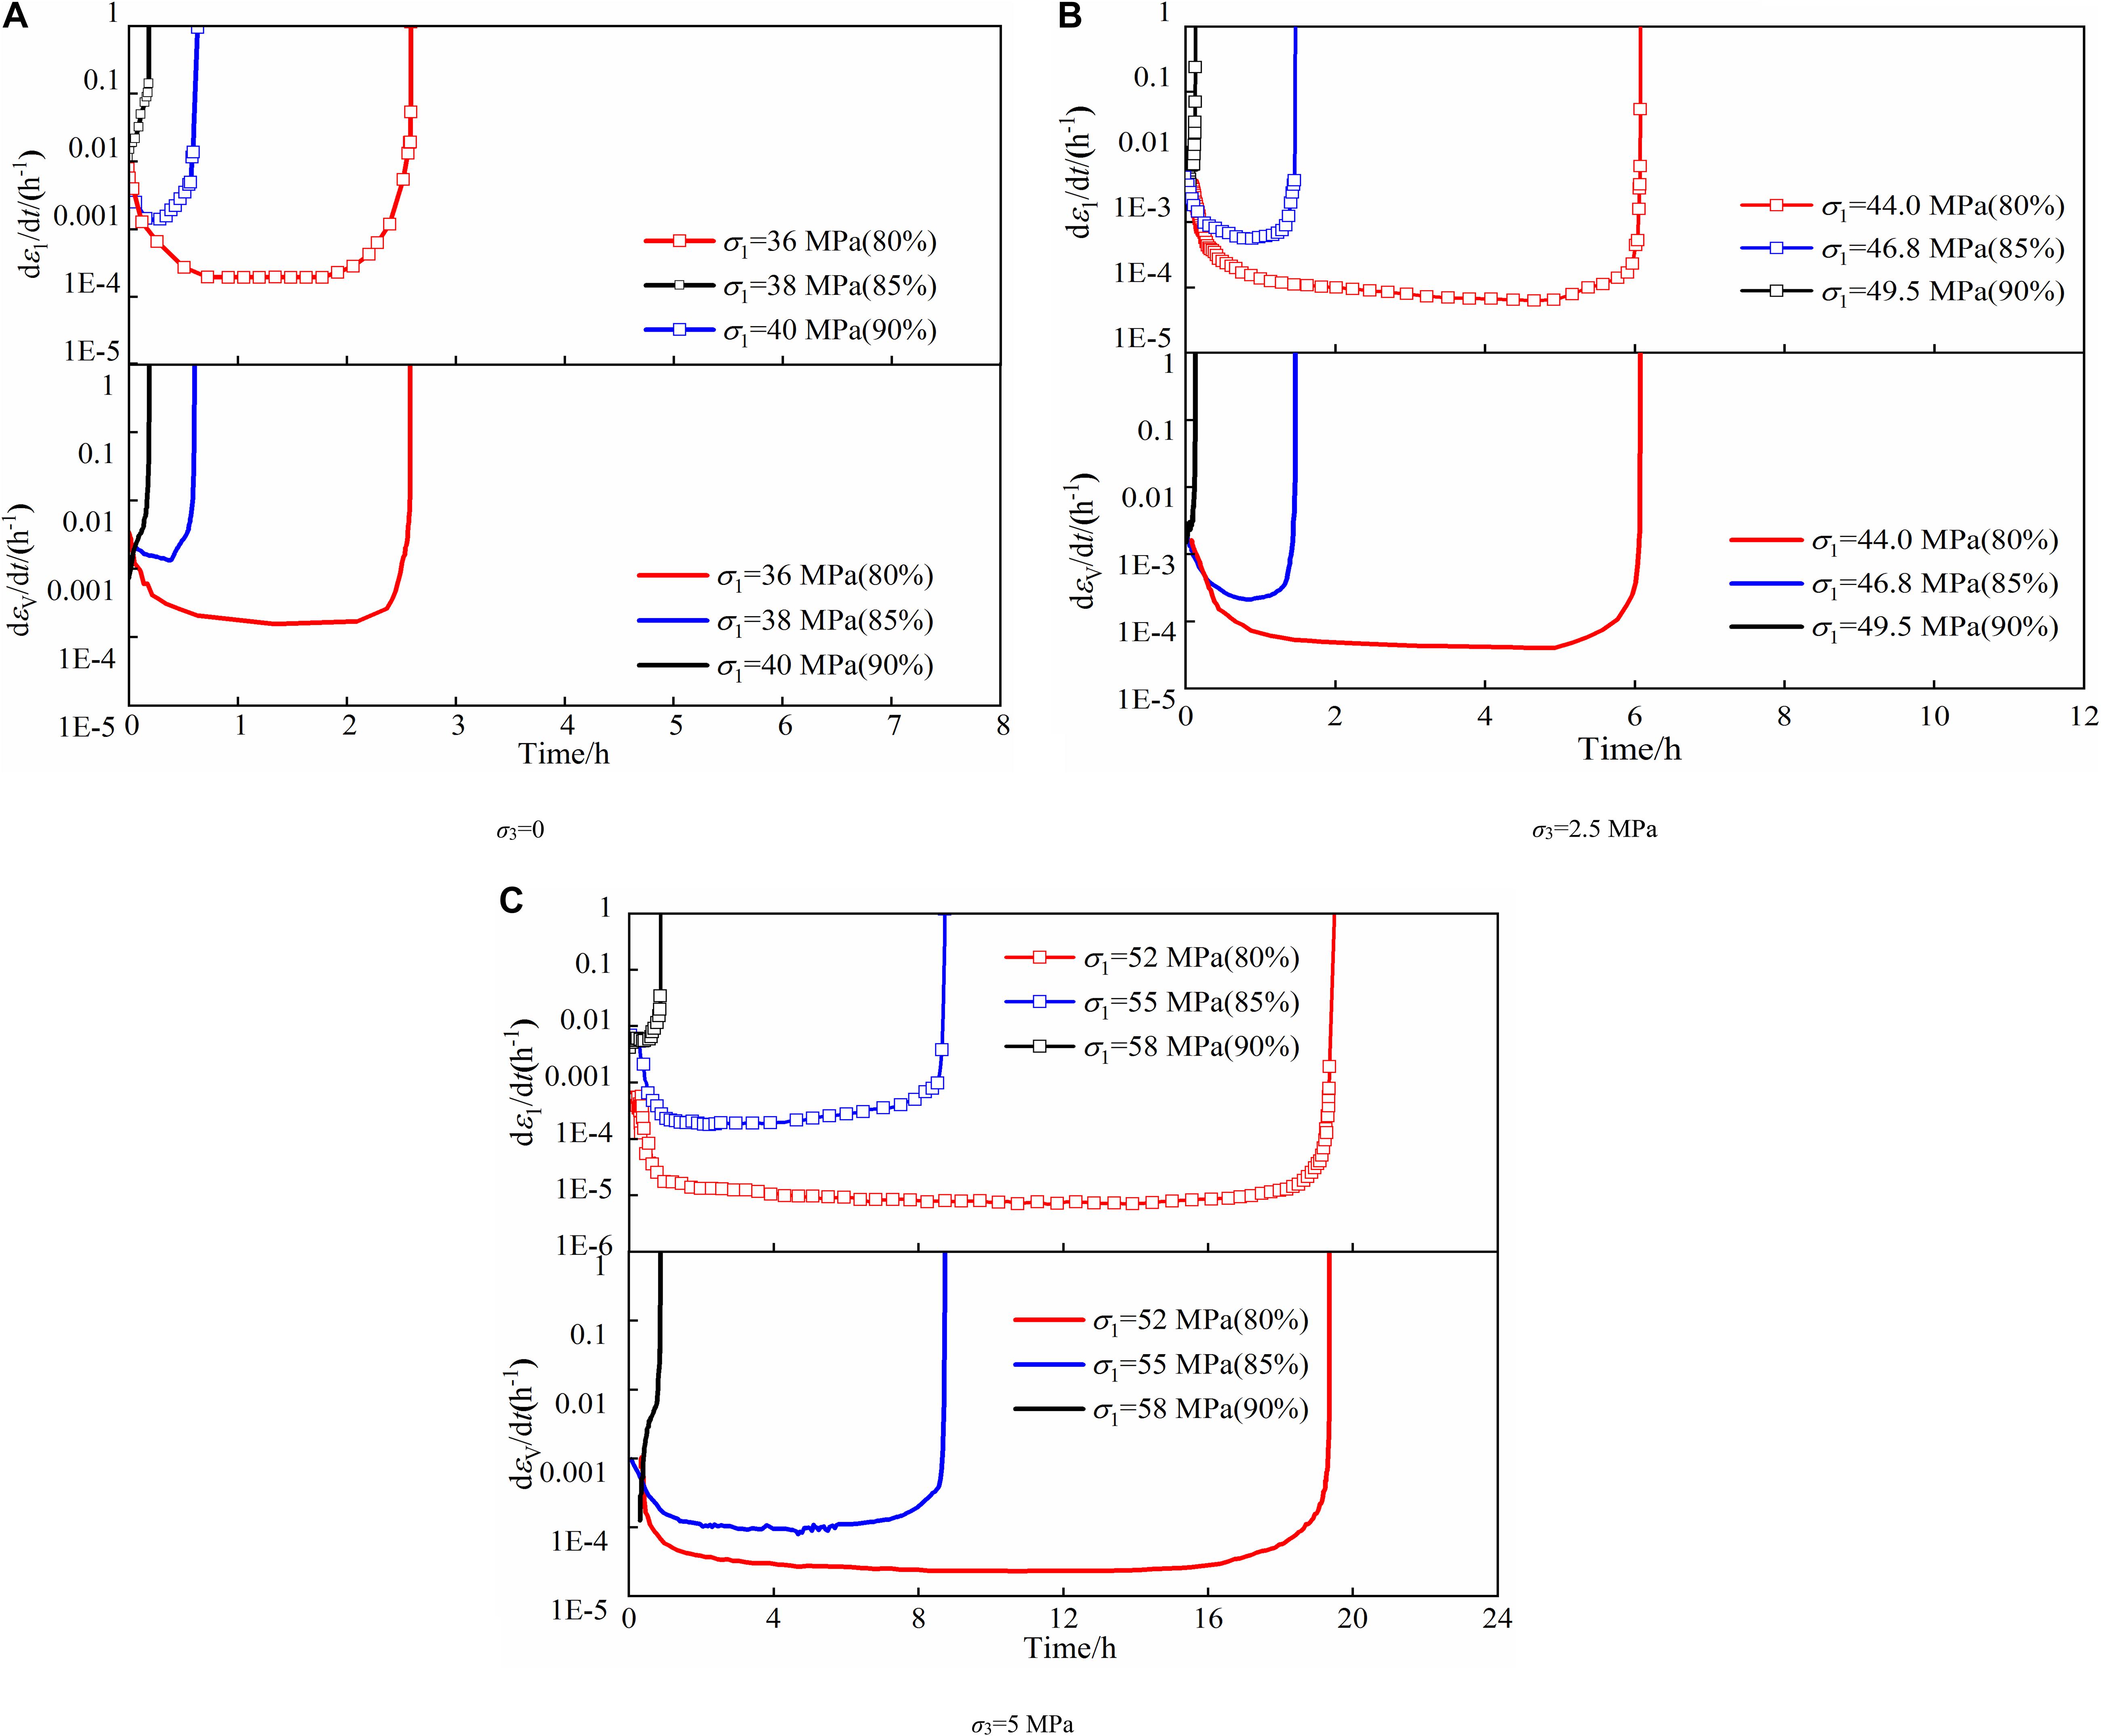
Figure 6. Axial and volumetric strain rates under various confining pressures. (A) σ3 = 0. (B) σ3 = 2.5 MPa. (C) σ3 = 5 MPa.
Figure 7 illustrates the variation in volumetric strain rates at the stress ratio of 80 and 85% under different stress conditions, plotted with the ratio of time and time-to-failure, t/tf. The volumetric strain rate decreases initially, and it becomes stable relatively when t/tf ranges from 0.1 to 0.85. This period can be considered as the second creep stage. The sharp increase reveals that the time ratio of 0.85 is a mark of the beginning of accelerated creep.
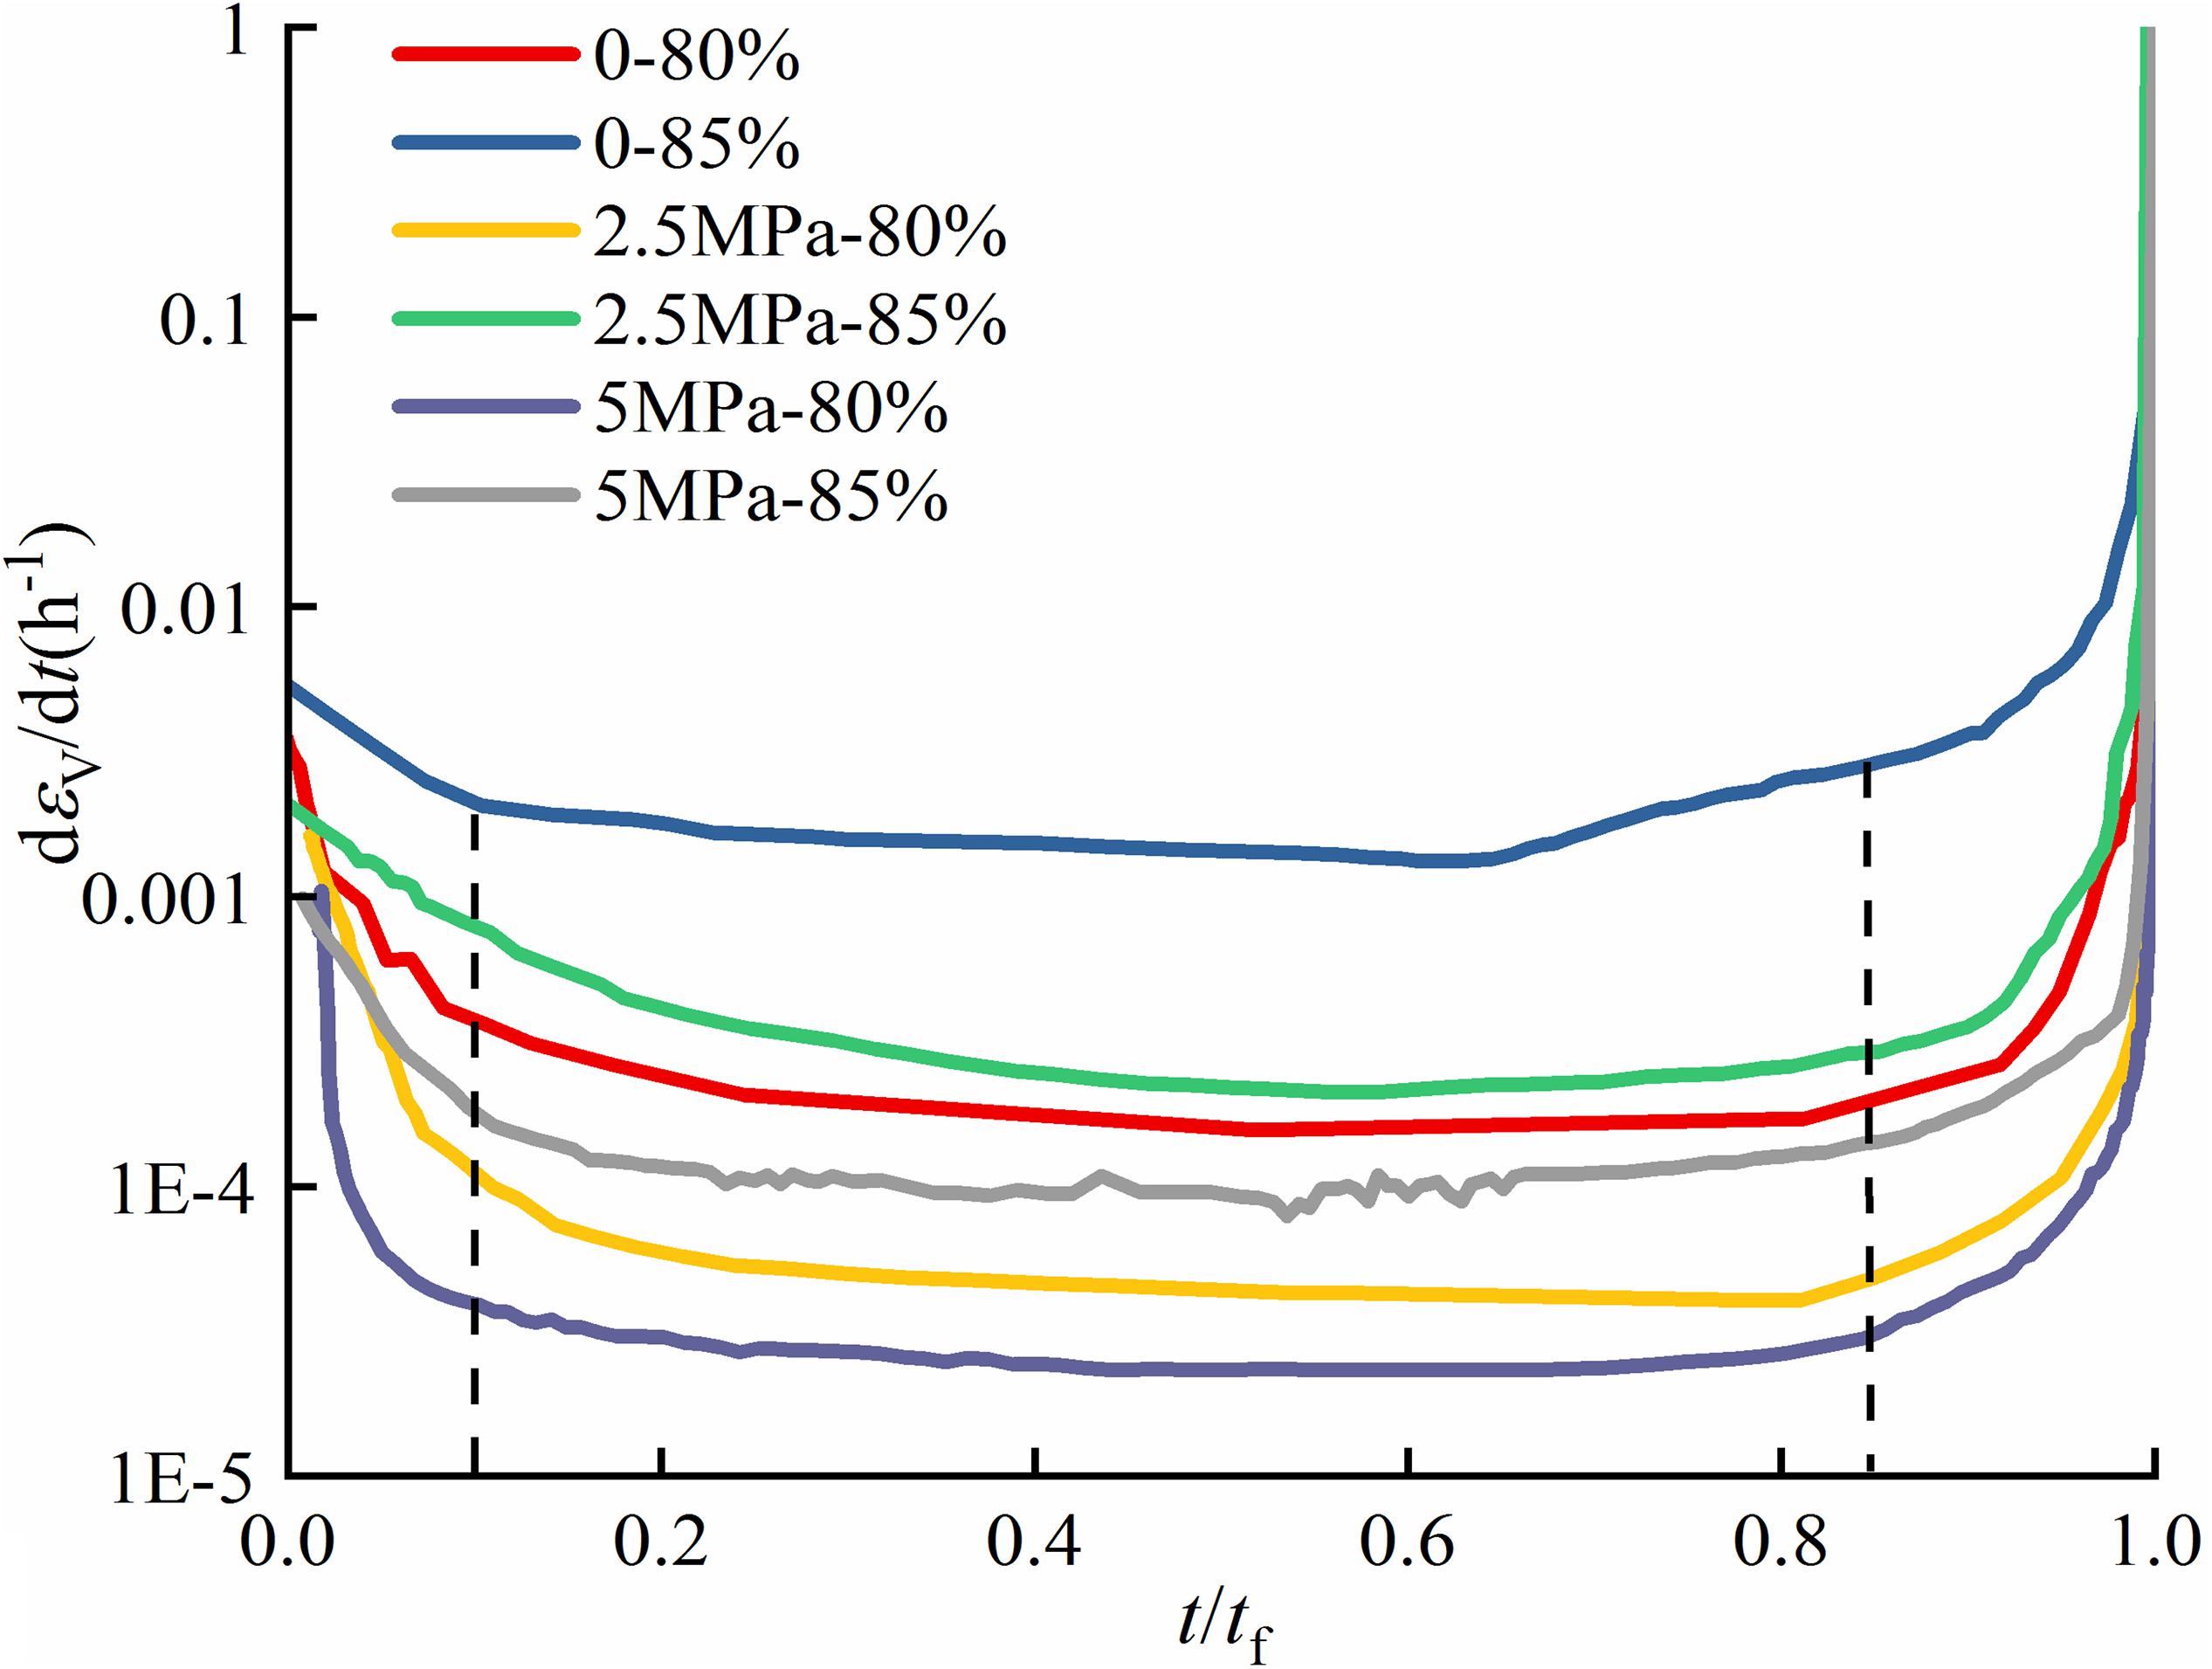
Figure 7. Variation of volumetric strain rates with t/tf.
Figure 8 demonstrates time-to-failure at the stress ratio of 80% is approximately 2 times than that at 85%, and 20 times than that at 90% under the confining pressure of 5 MPa. The phenomenon of time-lag failure becomes obscured when the stresses approach the peak strength. tf is determined as a negatively exponential function of steady volumetric strain rates with the great determination of 0.93, as follows,
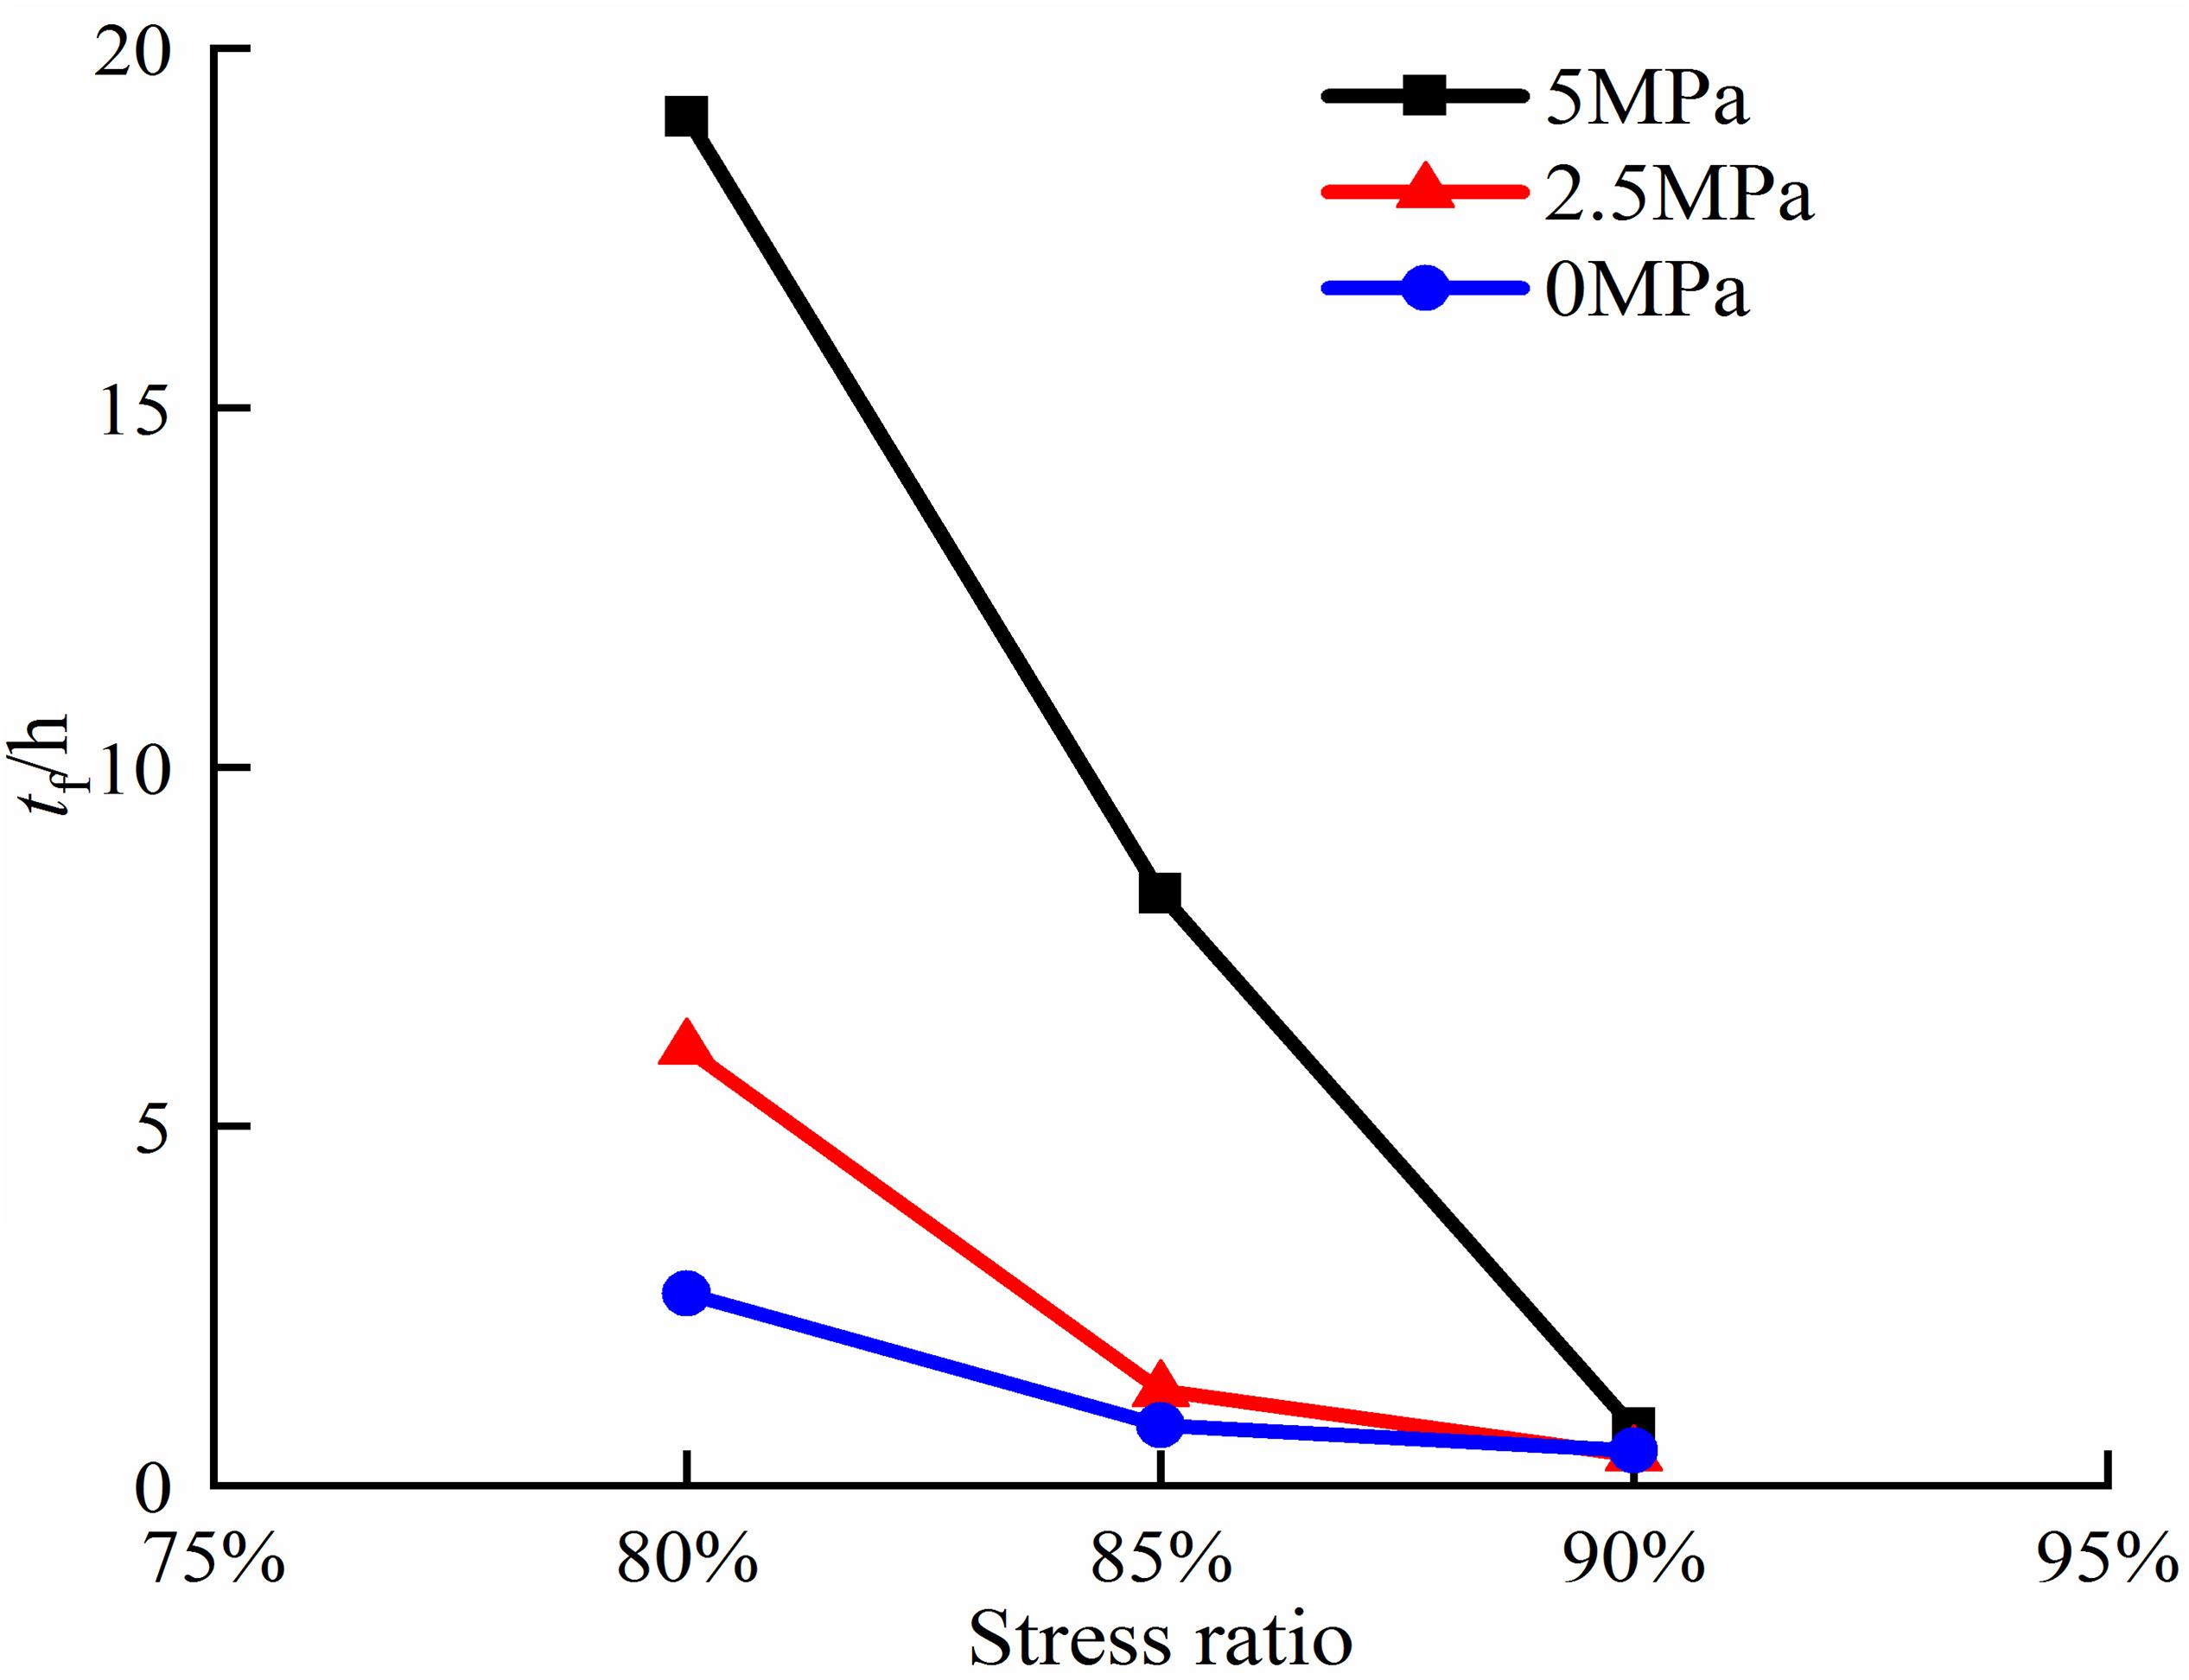
Figure 8. tf at various stress level under each confining pressure.
AE Characteristics
Figure 9 demonstrates the trend of instantaneous AE energy and deformation of specimens under the confining pressures of 2.5 MPa. In the first stage, the axial strain increases slightly and a transient quiet period in AE energy is observed. Subsequently, a peak in AE energy is noted, indicating the start of the second stage. In such stage, new microcracks are produced and extended stably, resulting in the gradual increase of deformation and AE energy occurs in a relatively low degree under the stress ratio of 80%. Numerous microcracks are widened and connected, leading to the significant expansion, and AE energy occurs continuously and densely under the stress ratio of 90%. As the time goes by, macrocracks are formed, and AE energy densely exhibits the great values, indicating the specimen enters into the third stage. Besides, the continuous and dense degree is noteworthy under the stress ratios of 85 and 90%, and peak values of AE energy become greater with the increase of stress ratio.
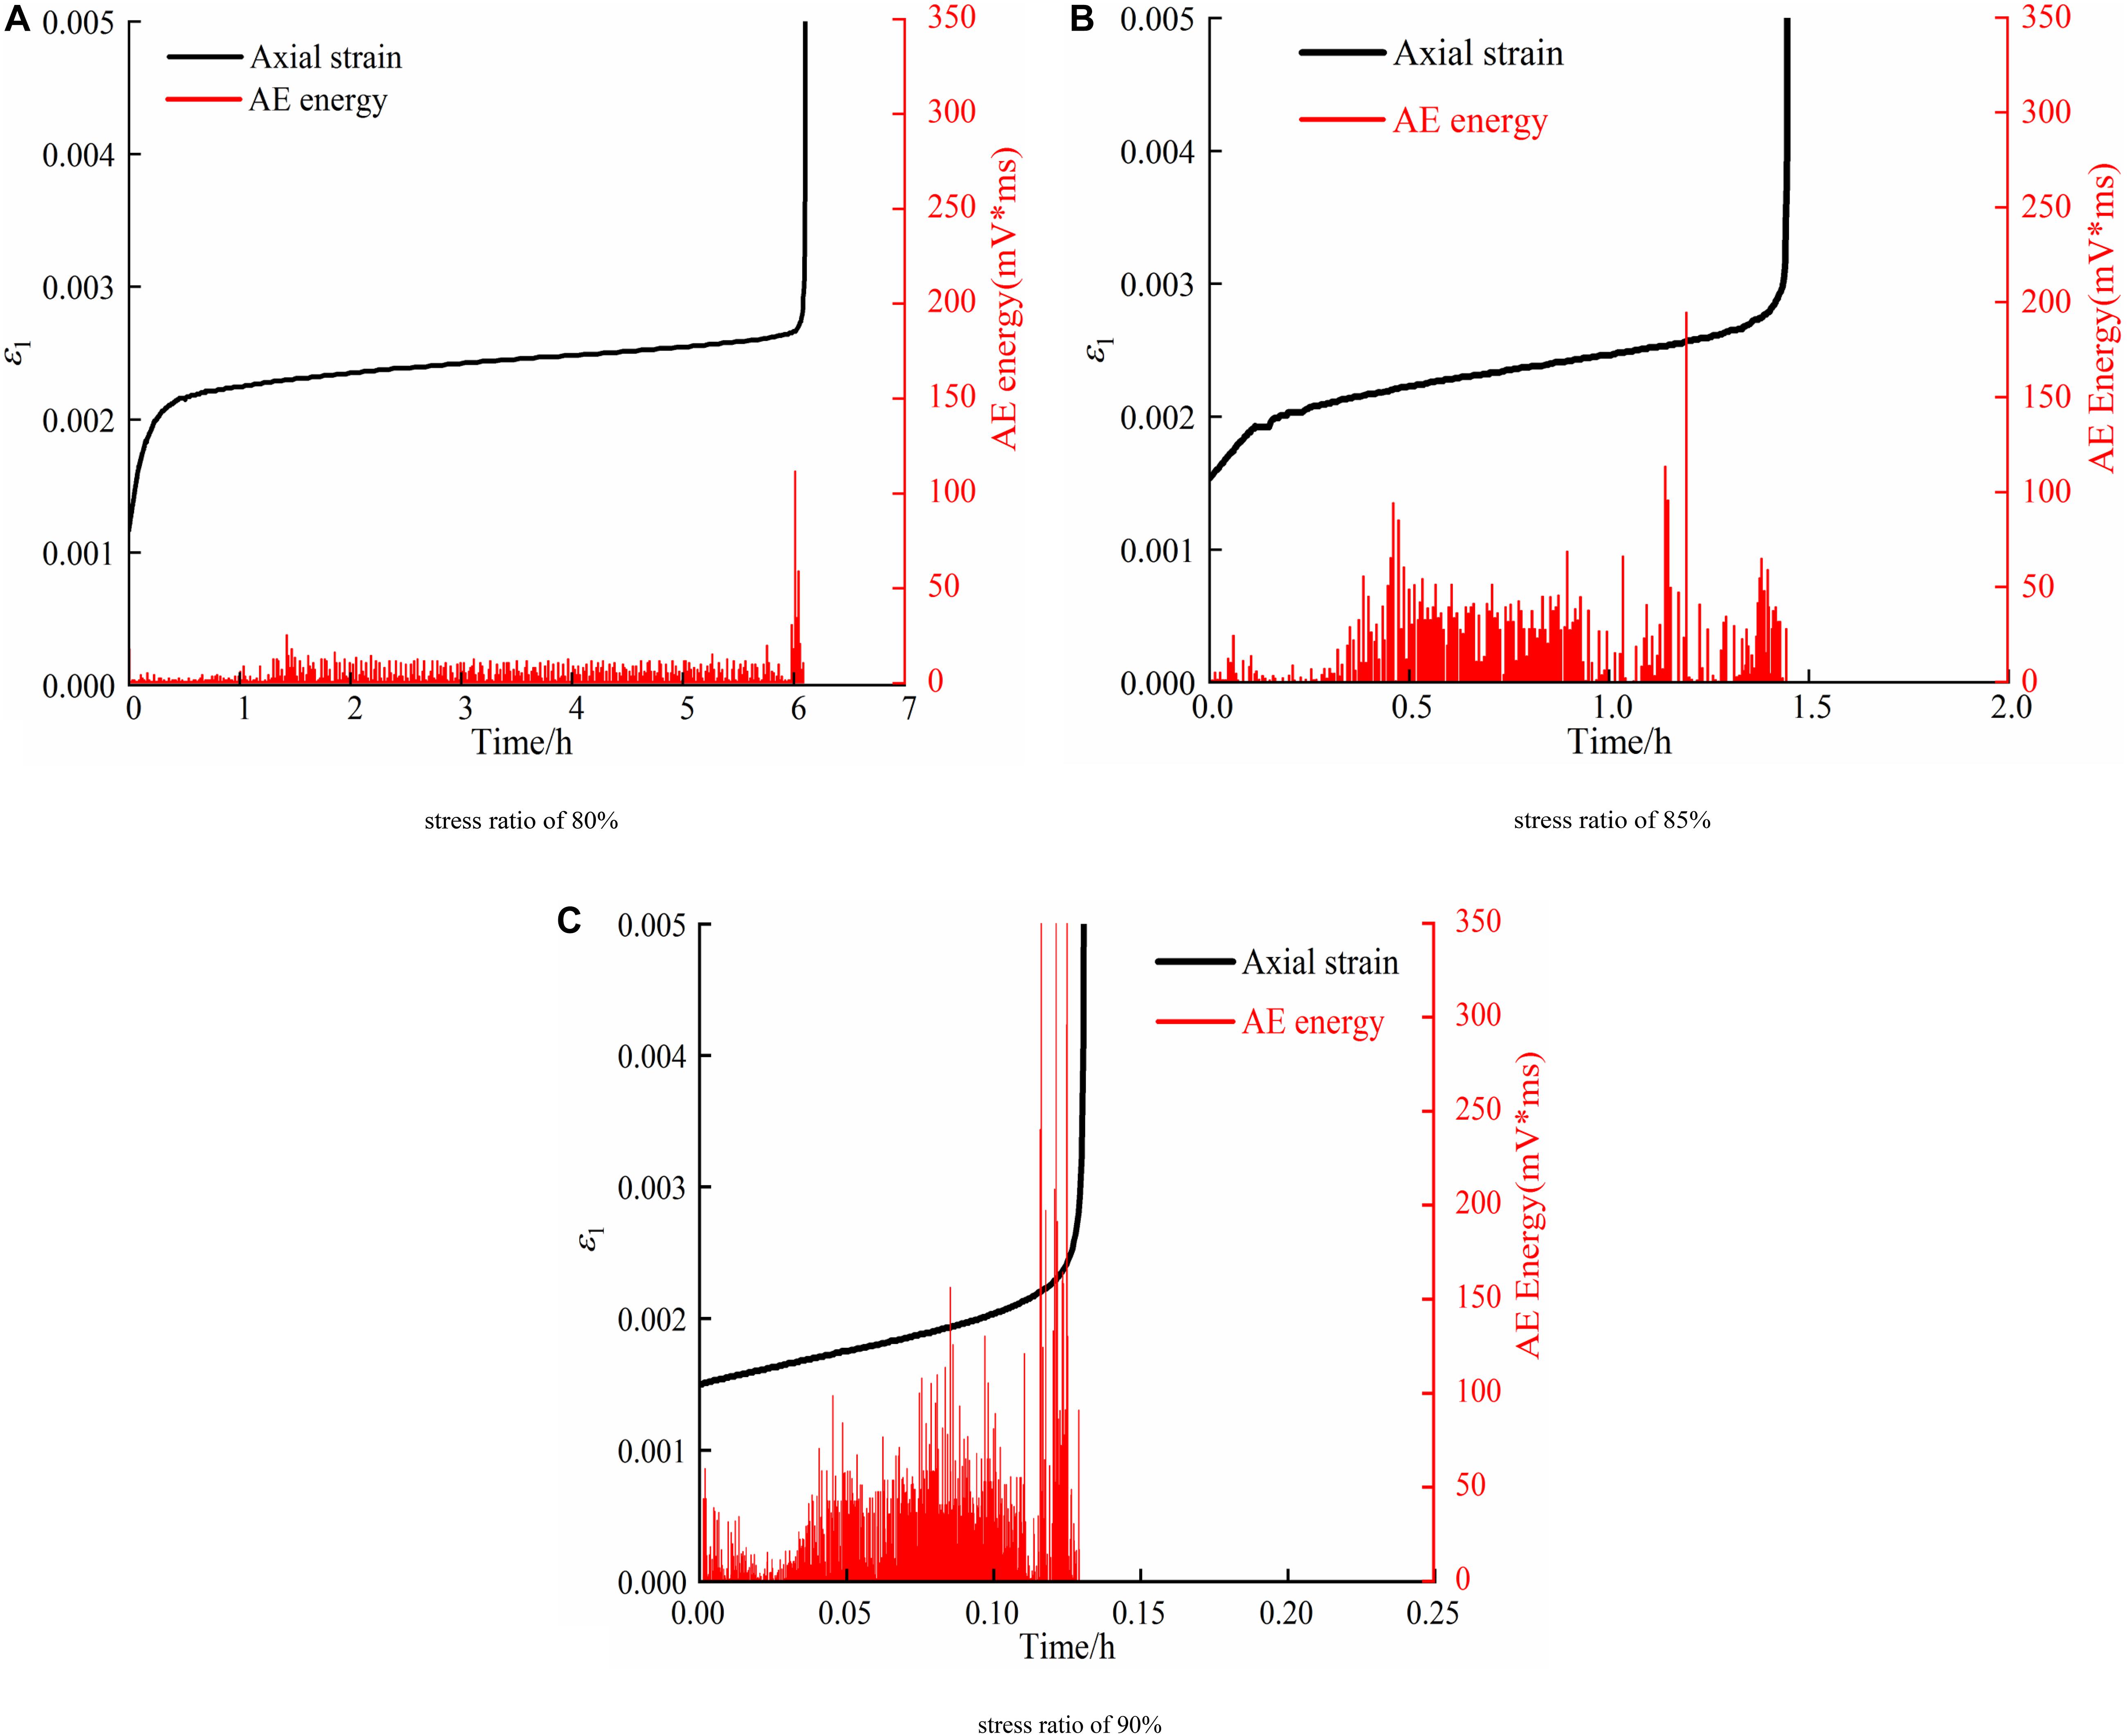
Figure 9. Instantaneous AE energy plotted with time under the confining pressure of 2.5 MPa. (A) Stress ratio of 80%. (B) Stress ratio of 85%. (C) Stress ratio of 90%.
According to the previous analysis, volumetric strain rates are significant in the rock failure process. To further analyze the damage, D together with volumetric strain rates is demonstrated in Figure 10, under the confining pressure of 2.5 MPa as the typical example. D increases slightly in the first stage, and subsequently, the curve shows a linear augment with a sharp increase before failure. In the second stage, volumetric strain rates are noted at a low level while D augments linearly to approximately 0.8 at the end of this stage. In the third stage, both volumetric strain rate and D increase rapidly until failure. In order to further quantify and estimate the damage, D values are replotted with t/tf under different confining pressures in Figure 11A. Turning points can be observed remarkably with t/tf ranging from approximately 20–35%, and D at turning points is between 0.03 and 0.1, as illustrated in Figure 11B. The average t/tf and D at turning points are 0.3 and 0.05, respectively. Therefore, D0.3 is considered as the initial-damage escalation threshold. After this moment, microcracks propagate and AE energy augments significantly, indicating damage becomes greater and accumulated. When t/tf is 0.85, D ranges from 0.6 to 0.8 under different conditions, marked as the start of accelerated creep. When t/tf reaches 0.9, D increases to approximately 0.9 under some stress levels. D in previous research (Baud and Meredith, 1997; Zhou et al., 2018) shows a similar tendency, in which creep experiments were performed under an effective confining pressure of 30 MPa and uniaxial compression, respectively. The tertiary stage can be predicted with the help of AE, and it requires further researches to assess this method.
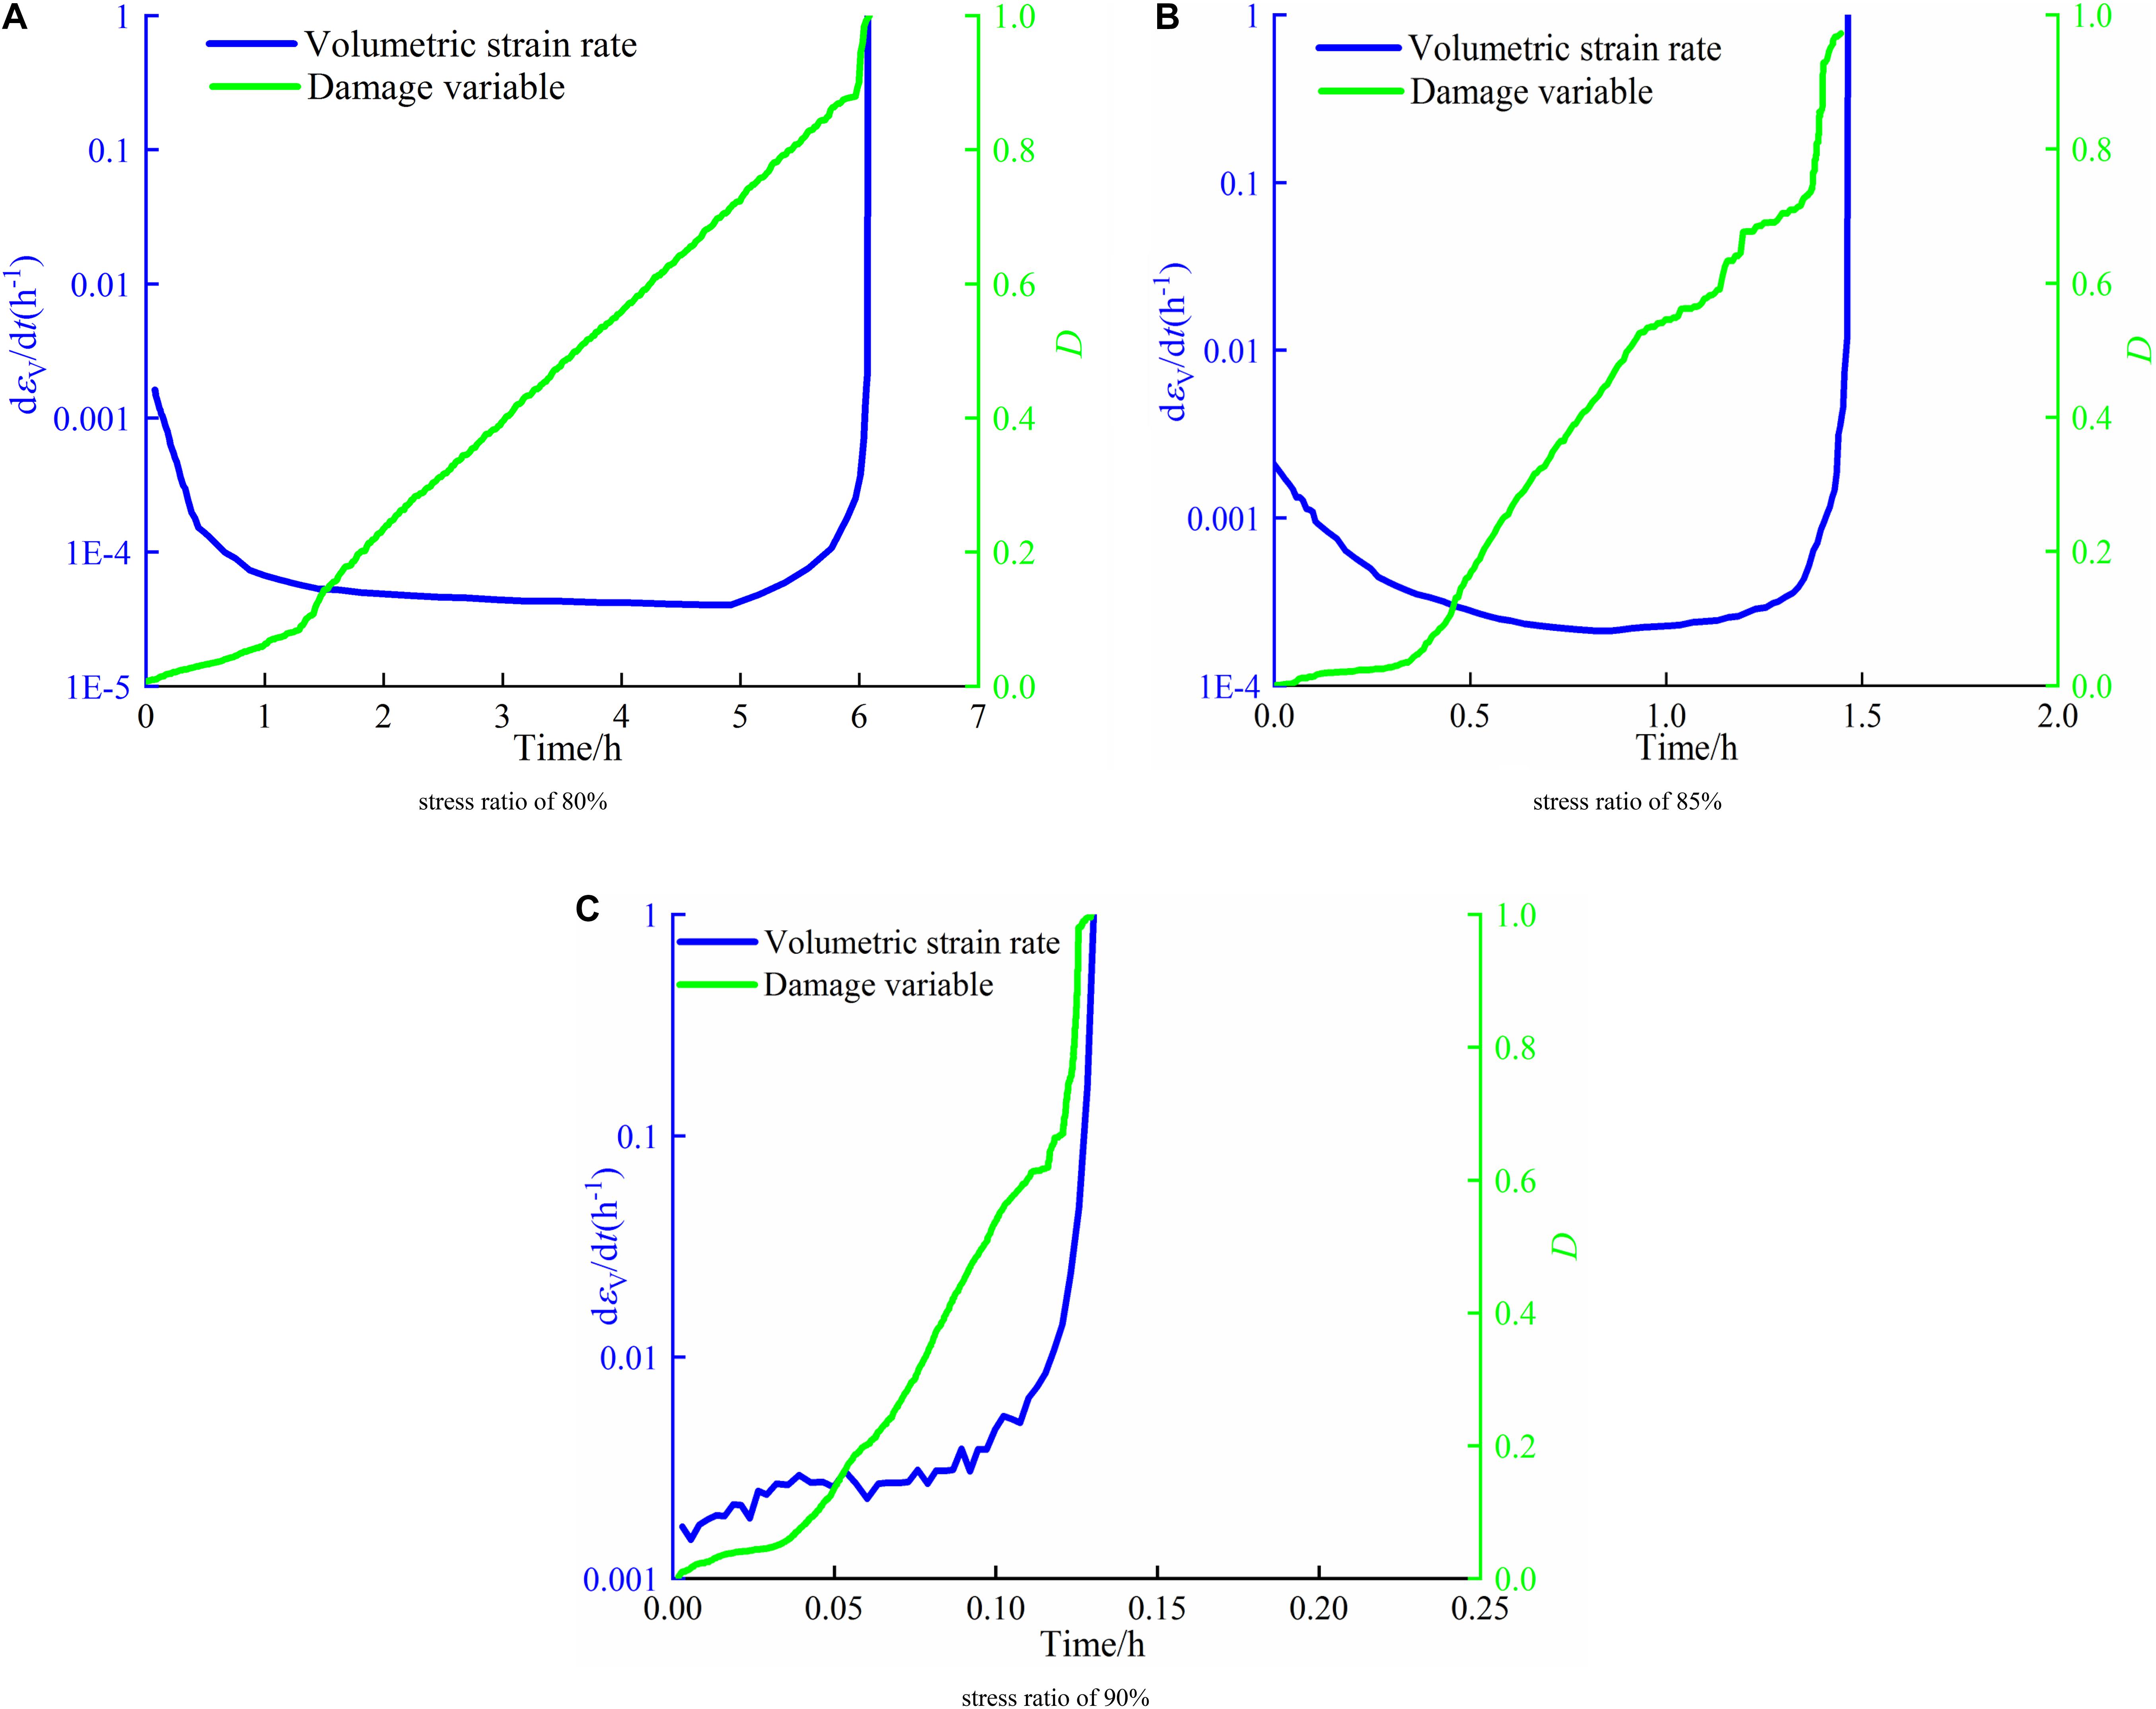
Figure 10. Damage variable and volumetric strain rates under the confining pressure of 2.5 MPa. (A) Stress ratio of 80%. (B) Stress ratio of 85%. (C) Stress ratio of 90%.
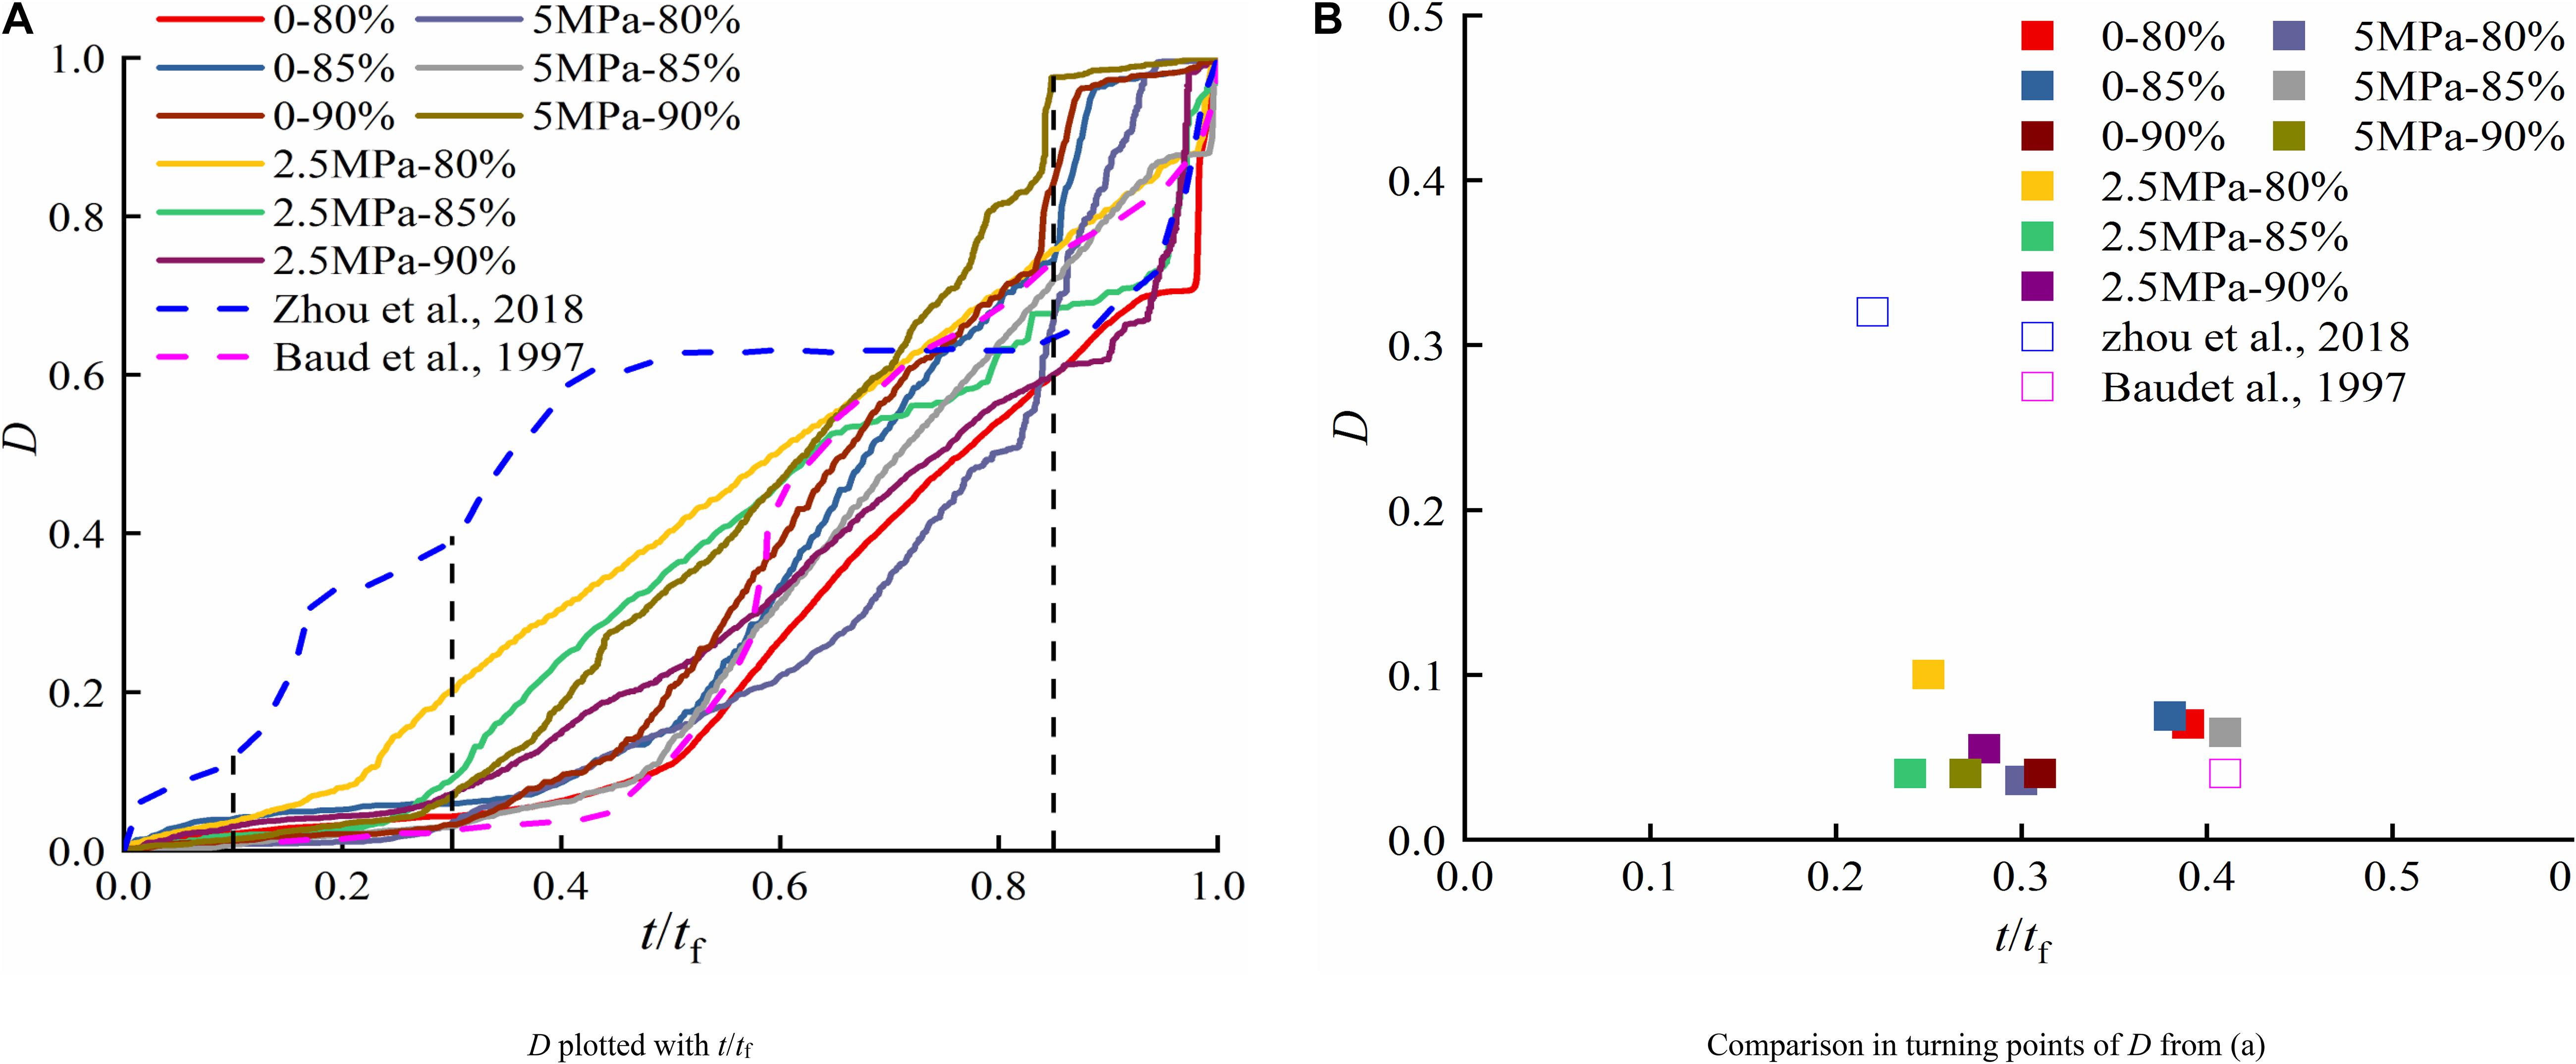
Figure 11. Damage variable characteristics with t/tf. (A) D plotted with t/tf. (B) Comparison in turning points of D from panel (A).
Failure Modes
Table 2 lists the failure characteristics of conventional compression and creep under various confining pressures. Evidently, specimens fail by shear localization along an inclined macroscopic shear fracture in conventional compression tests. The shear angle shows a slight reduction by 4° with the increase of confining pressures by 5 MPa. The average shear angle is 55°, approximately equal to 45 + φ/2. In creep tests, generally, failure patterns are splitting dominant modes under uniaxial conditions, along with some debris, and there is less debris with the increase of creep stresses. With the increase of confining pressures, failure patterns convert into shear dominant modes. When creep stress is 90% corresponding strength, shear angles are nearly equivalent to those in conventional compression under the confining condition. Failure patterns in creep may be similar to that in conventional compression tests when stresses exceed a certain level and approach the strength.
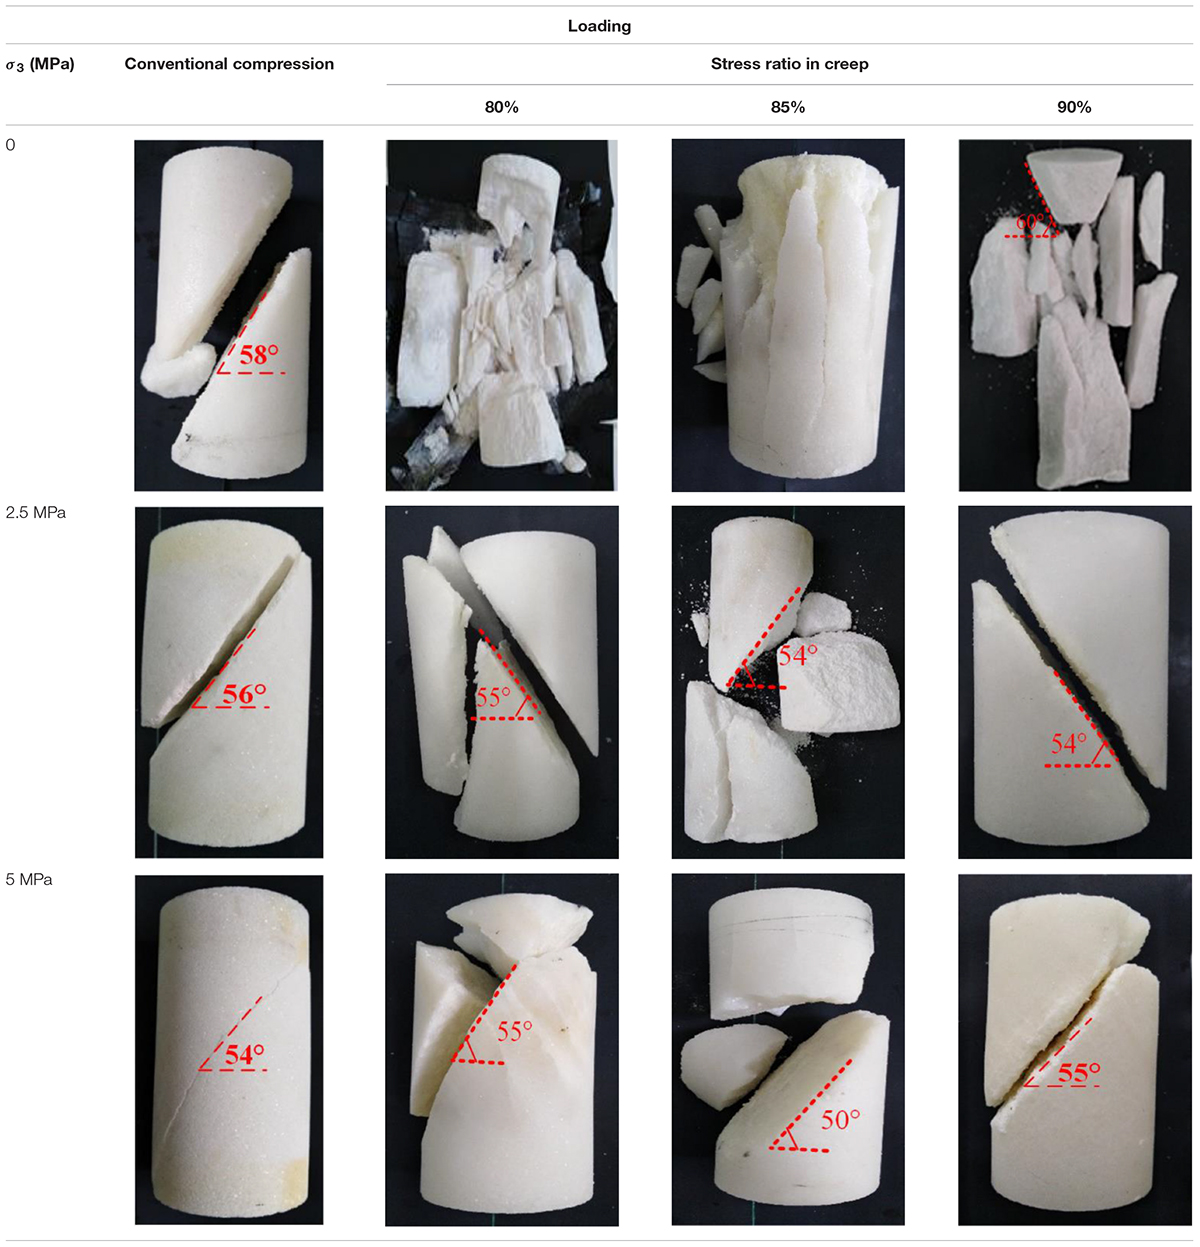
Table 2. Failure characteristics of marble in conventional compression and creep tests.
Conclusion
The present work investigates mechanical properties of marble specimens under conventional compression initially, and subsequently creep behavior at the stress ratios of 80, 85, and 90% of corresponding strength, combined with AE monitored. The damage was estimated based on the AE energy over the process.
In the conventional compression tests, both volumetric strain rates and D increase rapidly in the fourth and fifth stage, and after rates exceed the peak, D augments continuously until specimen failure.
In the creep tests, specimens exhibit a three-creep stage at the constant stress of 80 and 85% peak strength, while specimens exhibit a two-stage at 90% peak strength. The lateral dimension is the main reason for creep failure, and time-to-failure is a negatively exponential function of the steady creep rate.
In the creep tests, damage variables show a sharp increase after a slight variation initially until specimen failure. The turning points in D curves are observed at t/tf of 0.3, marked as the initial-damage escalation threshold. When t/tf exceeds 0.85, D augments sharply to 1. D0.85 can be regarded as a mark of entering the accelerated creep.
Shear angles are generally ranging from 50° to 60° in both two series tests. In conventional compression tests, failure patterns are shear dominant modes, and in the creep tests, failure patterns convert from the splitting dominant modes to the shear dominant with the increase of confining pressures.
Data Availability Statement
The datasets generated for this study are available on request to the corresponding author.
Author Contributions
JY and XL: study design. All authors: study conduct, approving final version of manuscript. XL, YZ, WY, and YL: data collection. XL, YZ, and WY: data analysis. XL, WY, and YL: data interpretation. XL: figures. XL, JY, and YZ: drafting manuscript.
Funding
This study was supported by the National Natural Science Foundation of China (Nos. 51874144 and 51679093), the National Natural Science Foundation of Fujian Province (No. 2018J01630), and the Scientific and Technology Plan Projects in Xiamen (No. 3502z20193040).
Conflict of Interest
The authors declare that the research was conducted in the absence of any commercial or financial relationships that could be construed as a potential conflict of interest.
References
Baud, P., and Meredith, P. G. (1997). Damage accumulation during triaxial creep of Darley Dale sandstone from pore volumometry and acoustic emission. Int. J. Rock Mech. Min. Sci. 34:024.
Brantut, N., Heap, M. J., Baud, P., and Meredith, P. G. (2014a). Mechanisms of time-dependent deformation in porous limestone. J. Geophys. Res. Solid Earth 119, 5444–5463. doi: 10.1002/2014jb011186
Brantut, N., Heap, M. J., Baud, P., and Meredith, P. G. (2014b). Rate-and strain-dependent brittle deformation of rocks. J. Geophys. Res. Solid Earth 119, 1818–1836. doi: 10.1002/2013jb010448
Brantut, N., Heap, M. J., Meredith, P. G., and Baud, P. (2013). Time-dependent cracking and brittle creep in crustal rocks: a review. J. Struct. Geol. 52, 17–43. doi: 10.1016/j.jsg.2013.03.007
Cai, Y., Sun, Q., Yu, J., Liu, S., Chen, X., and Liu, L. (2017). Experimental study on strength and deformation characteristics of marble after creep (in Chinese). Chin. J. Rock Mech. Eng. 36, 2768–2777.
Cai, Y., Yu, J., Fu, G., and Li, H. (2016). Experimental investigation on the relevance of mechanical properties and porosity of sandstone after hydrochemical erosion. J. Mt. Sci. 13, 2053–2068. doi: 10.1007/s11629-016-4007-2
Cao, P., Wen, Y., Wang, Y., Yuan, H., and Yuan, B. (2016). Study on nonlinear damage creep constitutive model for high-stress soft rock. Environ. Earth Sci. 75:900.
Chen, C., Xu, T., Heap, M. J., and Baud, P. (2018). Influence of unloading and loading stress cycles on the creep behavior of Darley Dale sandstone. Int. J. Rock Mech. Min. Sci. 112, 55–63. doi: 10.1016/j.ijrmms.2018.09.002
Chen, L., Liu, J., Wang, C., Liu, J., and Wang, J. (2015). Experimental investigation on the creep behaviour of Beishan granite under different temperature and stress conditions. Eur. J. Environ. Civil Eng. 19, s43–s53. doi: 10.1080/19648189.2015.1064619
Chen, X., and Zhang, J. (2017). Development of a servo-controlled rock triaxial test system with dynamic disturbance and its application (in Chinese). Rock Soil Mech. 38, 918–924.
Lin, Q. X., Liu, Y. M., Tham, L. G., Tang, C. A., Lee, P. K. K., and Wang, J. (2009). Time-dependent strength degradation of granite. Int. J. Rock Mech. Min. Sci. 46, 1103–1114. doi: 10.1016/j.ijrmms.2009.07.005
Liu, Z., and Shao, J. (2017). Strength behavior, creep failure and permeability change of a tight marble under triaxial compression. Rock Mech. Rock Eng. 50, 529–541. doi: 10.1007/s00603-016-1134-6
Ma, D., Zhou, Y., and Liu, C. (2018). Creep behavior and acoustic emission characteristics of coal samples with different moisture content. Acta Geodynam. Geomater. 15, 405–412. doi: 10.13168/agg.2018.0030
Mansouri, H., and Ajalloeian, R. (2018). Mechanical behavior of salt rock under uniaxial compression and creep tests. Int. J. Rock Mech. Min. Sci. 110, 19–27. doi: 10.1016/j.ijrmms.2018.07.006
Nicolas, A., Fortin, J., Regnet, J. B., Verberne, B. A., Plümper, O., Dimanov, A., et al. (2017). Brittle and semibrittle creep of Tavel limestone deformed at room temperature. J. Geophys. Res. Solid Earth 122, 4436–4459. doi: 10.1002/2016jb013557
Niu, S., Feng, W., Yu, J., Qiao, C., Liu, S., and Sun, Y. (2019). Experimental study on the mechanical properties of short-term creep in post-peak rupture damaged sandstone. Mech. Time Depend. Mater. 1–23.
Singh, A., Kumar, C., Kannan, L. G., Rao, K. S., and Ayothiraman, R. (2018). Estimation of creep parameters of rock salt from uniaxial compression tests. Int. J. Rock Mech. Min. Sci. 107, 243–248. doi: 10.1016/j.ijrmms.2018.04.037
Sone, H., and Zoback, M. D. (2014). Time-dependent deformation of shale gas reservoir rocks and its long-term effect on the in situ state of stress. Int. J. Rock Mech. Min. Sci. 69, 120–132. doi: 10.1016/j.ijrmms.2014.04.002
Viitanen, L., Ovaska, M., Ram, S. K., Alava, M. J., and Karppinen, P. (2019). Predicting creep failure from cracks in a heterogeneous material using acoustic emission and speckle imaging. Phys. Rev. Appl. 11:024014.
Wang, X., Liu, X., Wang, E., Li, X., Zhang, X., Zhang, C., et al. (2017). Experimental research of the AE responses and fracture evolution characteristics for sand-paraffin similar material. Constr. Build. Mater. 132, 446–456. doi: 10.1016/j.conbuildmat.2016.12.028
Wu, F., Chen, J., and Zou, Q. (2019). A nonlinear creep damage model for salt rock. Int. J. Damage Mech. 28, 758–771. doi: 10.1177/1056789518792649
Xu, T., Zhou, G., Heap, M., Zhu, W., Chen, C., and Baud, P. (2017). The influence of temperature on time-dependent deformation and failure in granite: a mesoscale modeling approach. Rock Mech. Rock Eng. 50, 2345–2364. doi: 10.1007/s00603-017-1228-9
Yang, S., Hu, B., Ranjith, P., and Xu, P. (2018). Multi-step loading creep behavior of red sandstone after thermal treatments and a creep damage model. Energies 11:212. doi: 10.3390/en11010212
Yao, W., Cai, Y., Yu, J., Zhou, J., Liu, S., and Tu, B. (2019). Experimental and numerical study on mechanical and cracking behaviors of flawed granite under triaxial compression. Measurement 145, 573–582. doi: 10.1016/j.measurement.2019.03.035
Yao, W., Yu, J., Liu, X., Zhou, X., Cai, Y., and Zhu, Y. (2020). Study on acoustic emission characteristics and failure prediction of post-high-temperature granite. J. Test. Eval. 48:20190575. doi: 10.1520/jte20190575
Yu, C., Tang, S., Tang, C., Duan, D., Zhang, Y., Liang, Z., et al. (2019). The effect of water on the creep behavior of red sandstone. Eng. Geol. 253, 64–74. doi: 10.1016/j.enggeo.2019.03.016
Yu, J., Chen, S., Chen, X., Zhang, Y., and Cai, Y. (2015a). Experimental investigation on mechanical properties and permeability evolution of red sandstone after heat treatments. J. Zhejiang Univ. Sci. A 16, 749–759. doi: 10.1631/jzus.a1400362
Yu, J., Chen, X., Cai, Y., and Li, H. (2016). Triaxial test research on mechanical properties and permeability of sandstone with a single joint filled with gypsum. KSCE J. Civil Eng. 20, 2243–2252. doi: 10.1007/s12205-015-1663-7
Yu, J., Chen, X., Li, H., Zhou, J., and Cai, Y. (2015b). Effect of freeze-thaw cycles on mechanical properties and permeability of red sandstone under triaxial compression. J. Mt. Sci. 12, 218–231. doi: 10.1007/s11629-013-2946-4
Yu, J., Liu, G., Cai, Y., Zhou, J., Liu, S., and Tu, B. (2019). Time-dependent deformation mechanism for swelling soft rock tunnels in coal mines and its mathematical deduction. Int. J. Geomech. 20:04019186. doi: 10.1061/(asce)gm.1943-5622.0001594
Zhang, L., Li, X. C., Gao, J. X., An, Z. X., Yang, X. H., and Nie, B. S. (2019). Creep characteristics and constitutive model of coal under triaxial stress and gas pressure. Energy Sci. Eng. 8, 501–514. doi: 10.1002/ese3.532
Zhang, Z., Zhang, R., Xie, H., Liu, J., and Were, P. (2015). Differences in the acoustic emission characteristics of rock salt compared with granite and marble during the damage evolution process. Environ. Earth Sci. 73, 6987–6999. doi: 10.1007/s12665-015-4406-7
Zhao, Y., Wang, Y., Wang, W., Wan, W., and Tang, J. (2017a). Modeling of non-linear rheological behavior of hard rock using triaxial rheological experiment. Int. J. Rock Mech. Min. Sci. 93, 66–75. doi: 10.1016/j.ijrmms.2017.01.004
Zhao, Y., Zhang, L., Wang, W., Wan, W., Li, S., Ma, W., et al. (2017b). Creep behavior of intact and cracked limestone under multi-level loading and unloading cycles. Rock Mech. Rock Eng. 50, 1409–1424. doi: 10.1007/s00603-017-1187-1
Zhao, Y., Zhang, L., Wang, W., Wan, W., and Ma, W. (2017c). Separation of elastoviscoplastic strains of rock and a nonlinear creep model. Int. J. Geomech. 18:04017129. doi: 10.1061/(asce)gm.1943-5622.0001033
Zhou, H., Liu, D., Lei, G., Xue, D., and Zhao, Y. (2018). The creep-damage model of salt rock based on fractional derivative. Energies 11:2349. doi: 10.3390/en11092349
Keywords: creep failure, various stress ratios, volumetric strain rate, AE energy, damage variable
Citation: Liu X, Yu J, Zhu Y, Yao W and Lai Y (2020) Creep Damage Evolution of Marble From Acoustic Emission and the Damage Threshold. Front. Earth Sci. 8:58. doi: 10.3389/feart.2020.00058
Received: 10 December 2019; Accepted: 19 February 2020;
Published: 26 March 2020.
Edited by:
Yanlin Zhao, Hunan University of Science and Technology, ChinaReviewed by:
Kang Duan, Shandong University, ChinaDiyuan Li, Central South University, China
Jie Chen, Chongqing University, China
Copyright © 2020 Liu, Yu, Zhu, Yao and Lai. This is an open-access article distributed under the terms of the Creative Commons Attribution License (CC BY). The use, distribution or reproduction in other forums is permitted, provided the original author(s) and the copyright owner(s) are credited and that the original publication in this journal is cited, in accordance with accepted academic practice. No use, distribution or reproduction is permitted which does not comply with these terms.
*Correspondence: Jin Yu, YnVneXUwNzE3QDE2My5jb20=