 Jianguo Li
 Yi Wang
 Lili Liu1
- 1School of Geography, Geomatics, and Planning, Jiangsu Normal University, Xuzhou, China
- 2Department of Geography, School of Global Studies, University of Sussex, Brighton, United Kingdom
- 3Department of Earth System Science, Institute for Global Change Studies, Tsinghua University, Beijing, China
The terrestrial ecosystem productivity (hereafter, TEP) is a key index of global carbon cycles and a fundamental constraint of carbon sequestration capacity, and also an important measure of ecosystem services and food security. However, the TEP has been significantly affected by the long-lasting droughts. Identifying the spatial relationship between droughts and the TEP is crucial for enhancing ecosystem services in China. Here the net primary production (hereafter, NPP) derived from the Carnegie-Ames-Stanford Approach model (CASA-NPP) and two drought indices, namely the Standard Precipitation Index (hereafter, SPI) and the Standard Precipitation Evaporation Index (hereafter, SPEI), are used to examine the spatial relationship between droughts and the NPP in China for the period of 1982–2012. Our main results have shown that: (1) China’s annual NPP has increased slowly from 3.82 to 4.35 PgC per year (hereafter, PgC/yr), while droughts have become much severer from 1982 to 2012; (2) on the 3-month timescale, the NPP in arid and semi-arid ecosystems has decreased at a rate of 1.28 TgC per month with per “unit” decrease in the drought index (indicating drier conditions). (3) Overall, the NPP in China has increased 5.71 TgC per month with per “unit” increase in the drought index (indicating wetter conditions); the contribution of this NPP increase is mainly from forests and farmlands; (4) the SPEI is a relatively more effective and sensitive index in representing China’s droughts. In southern China, the lagging period for the NPP response to droughts is about 3-month, while a 6-month lagging period is found in the arid and semi-arid ecosystems in northern China.
Introduction
The terrestrial ecosystem productivity (hereafter, TEP) is the fundamental indicator for ecosystem services, and an integrated component of global carbon cycles, biodiversity, and regional food security (e.g., Piao et al., 2005; Zhu and Pan, 2007; Luo et al., 2019) and is generally controlled by many interplaying factors (Li et al., 2018; Liu et al., 2019). Under the threats of global warming, both the broadness and devastation of droughts and floods will continue to intensify, which will greatly affect the TEP, especially under long-lasting droughts (e.g., Yu et al., 2007; Doughty et al., 2015; Lei et al., 2015; Huang et al., 2016; Su et al., 2018; Gherardi and Sala, 2019; Xu et al., 2019). Droughts are a comprehensive and frequently occurred natural disaster, involving both precipitation and temperature changes, and they also control the soil moisture and vapor pressure deficit that will greatly influence the plant growth (Eamus et al., 2013). Many studies have shown that long-lasting droughts can significantly constrain vegetation activity and reduce the net primary production (hereafter, NPP) (e.g., Zhao and Running, 2010; Mk et al., 2011; Pei et al., 2013; Hou et al., 2014; Lai et al., 2018; Anderegg et al., 2019; Li et al., 2019a). As one of the major agricultural countries in the world, China has suffered from the strong interannual variability of monsoonal climate changes (e.g., Liu and Wang, 2011), the higher frequency of floods and droughts, especially in northern China. According to the “China Flood and Drought Disaster Bulletin” (2016), on average, 2.17 × 10⁵ km2 farmlands were influenced by droughts each year from 1950 to 2007, resulting in a loss of nearly 15.8 billion kilograms of grain, accounting for 60% of the total loss caused by all-natural disasters (MWRPRC, 2016).
Droughts can significantly diminish plant growth by cutting back the availability of soil water and therefore reducing crop yields (e.g., Chen et al., 2013; Heyer et al., 2018). A previous study has revealed that the grain loss induced by droughts has contributed about 7% of the total reduction of the global grain yield (Lesk et al., 2016). During a drought, plants can survive by closing their stomata, stabilizing intracellular water potential, and reducing the rate of autotrophic respiration, which can remarkably decrease the gross primary production (e.g., Mk et al., 2011; Doughty et al., 2015; Su et al., 2018; Kannenberg et al., 2019). There are wide-range differences among the responses of the plant growth to droughts for different ecosystems and at different spatial–temporal scales.
As concluded from previous studies, the effect of droughts on NPP variation has generally been examined at annual timescale or specific events (e.g., Huang et al., 2016; Li et al., 2019a). For example, an earlier study has argued that the interannual NPP variation in semi-arid and arid ecosystems was driven mainly by droughts (Huang et al., 2016). Their study has shown that about 29% of the interannual variation of the global NPP is explained by droughts-dominated NPP in semi-arid ecosystems, and 33% of the interannual variation of the global NPP is contributed by droughts prone ecosystems in the Southern Hemisphere (Huang et al., 2016). Furthermore, Zhao and Running (2010) have reported that a total loss of 0.55 PgC/yr global NPP between 2000 and 2009 could be explained by droughts, occurred in the Southern Hemisphere. Compared with forest ecosystems, grass ecosystems are more sensitive to droughts (e.g., Lei et al., 2015; Fei et al., 2018). In addition, long-lasting and severe droughts can also significantly lower the regional NPP in semi-humid and humid areas (Vicente−Serrano et al., 2015). Many drought indices can be used to represent regional drought level and further to explore the impact of the droughts on ecosystem evolution, such as Palmer Drought Severity Index (hereafter, PDSI, reference-PDSI) and Standardized Precipitation–Evapotranspiration Index (hereafter, SPEI, reference-SPEI), Standardized Precipitation Index (hereafter, SPI, reference-SPI), and standardized evapotranspiration deficit index (hereafter, SEDI, reference-SEDI) (e.g., Li et al., 2016, 2019a; Peng et al., 2016). Vegetation growth is generally controlled by periodic/seasonal and interannual changes of major driving factors, including climatic factors and human activities. Therefore, it is crucial to investigate the NPP variation and meteorological droughts overall a wide range of timescales. Compared with the PDSI and SEDI, the multi-timescale indices of SPI and SPEI have a remarkable advantage in representing the impacts of droughts to consider their delayed impacts on ecosystems.
However, the relationships between the monthly variability of NPP and intensive droughts in China are still unclear, because the drought distribution and plant growth processes are controlled by inconclusive factors at different spatial–temporal scales. In particular, determining the interannual relationship between NPP and intensive droughts cannot reveal the actual influence of droughts on monthly ecosystem production, which may result in some misleading conclusions (e.g., Zhao and Running, 2010; Zarei and Eslamian, 2017; Piao et al., 2019). Most previous studies have paid more attention to responses of the forest NPP to annual droughts (Vicente−Serrano et al., 2015), and the grassland and farmland NPP to annual droughts (Ji and Peters, 2003). Other studies have mainly focused on the issues of different timescales and lagging effects of droughts (e.g., Vicenteserrano et al., 2013; Anderegg et al., 2015; Wu et al., 2015; Huang et al., 2016; Huang and Xia, 2019). In China, the terrestrial ecosystems are so diverse that the relationships between NPP and intensive droughts at multiple spatiotemporal scales need further detailed analyses. Moreover, how and to what extent droughts affect monthly NPP variation in China are still unclear (Pei et al., 2013). Precisely determining the effect of droughts on monthly NPP changes is beneficial to assess the impacts of the potential extreme climate on TEP in the near future.
Our main objectives here are: (1) to identify the hotspots where droughts have some significant impacts on the NPP, (2) to examine the response time or lagging effect of ecosystems to droughts, and (3) to determine a suitable drought index representing the relationship between the monthly variability of NPP and droughts well. The following paper is arranged as below. The section “Materials and Methods” describes briefly the datasets used and our methods. The section “Results and Analyses” presents our main results. The discussion is shown in the section “Discussion,” followed by the section “conclusion.”
Materials and Methods
In this study, two drought indices, namely the SPI and the SPEI, are used to estimate the impact of droughts on NPP in China at monthly timescales (see Supplementary Section S3 for more details). The NDVI images used to estimate the parameter, FPAR for CASA model (see Supplementary Section S1 for more details), are from the Global Inventory Modeling and Mapping Studies-NDVI dataset (see GIMMS-NDVI1) (Ruimy et al., 1994). The GIMMS-NDVI dataset is constructed by Tucker et al. (2004), which includes the 31-year (372-month) period from 1982 to 2012, and covers the whole China at a spatial resolution of 8 km × 8 km. The NPP in China during the period of 1982–2012 is estimated using the CASA model (Zhu et al., 2006). The meteorological data (including monthly precipitation, monthly mean temperature, and monthly total solar radiation, see Supplementary Section S2 for more details) is downloaded from the China Meteorological Administration (CMA) Meteorological Data Center2 (in total 823 meteorological stations, see Figure 1 for locations of these meteorological stations). All meteorological data downloaded from the Data Center of CMA is imported into ArcGIS 10.2, and then spatially interpolated to a grid space of 8-km in order to obtain maps of monthly precipitation, monthly mean temperature, and monthly total solar radiation using the inverse distance weight method (Bartier and Keller, 1996). The detailed processes for all datasets and the CASA-NPP model can be found in Supplementary Sections S1–S3.
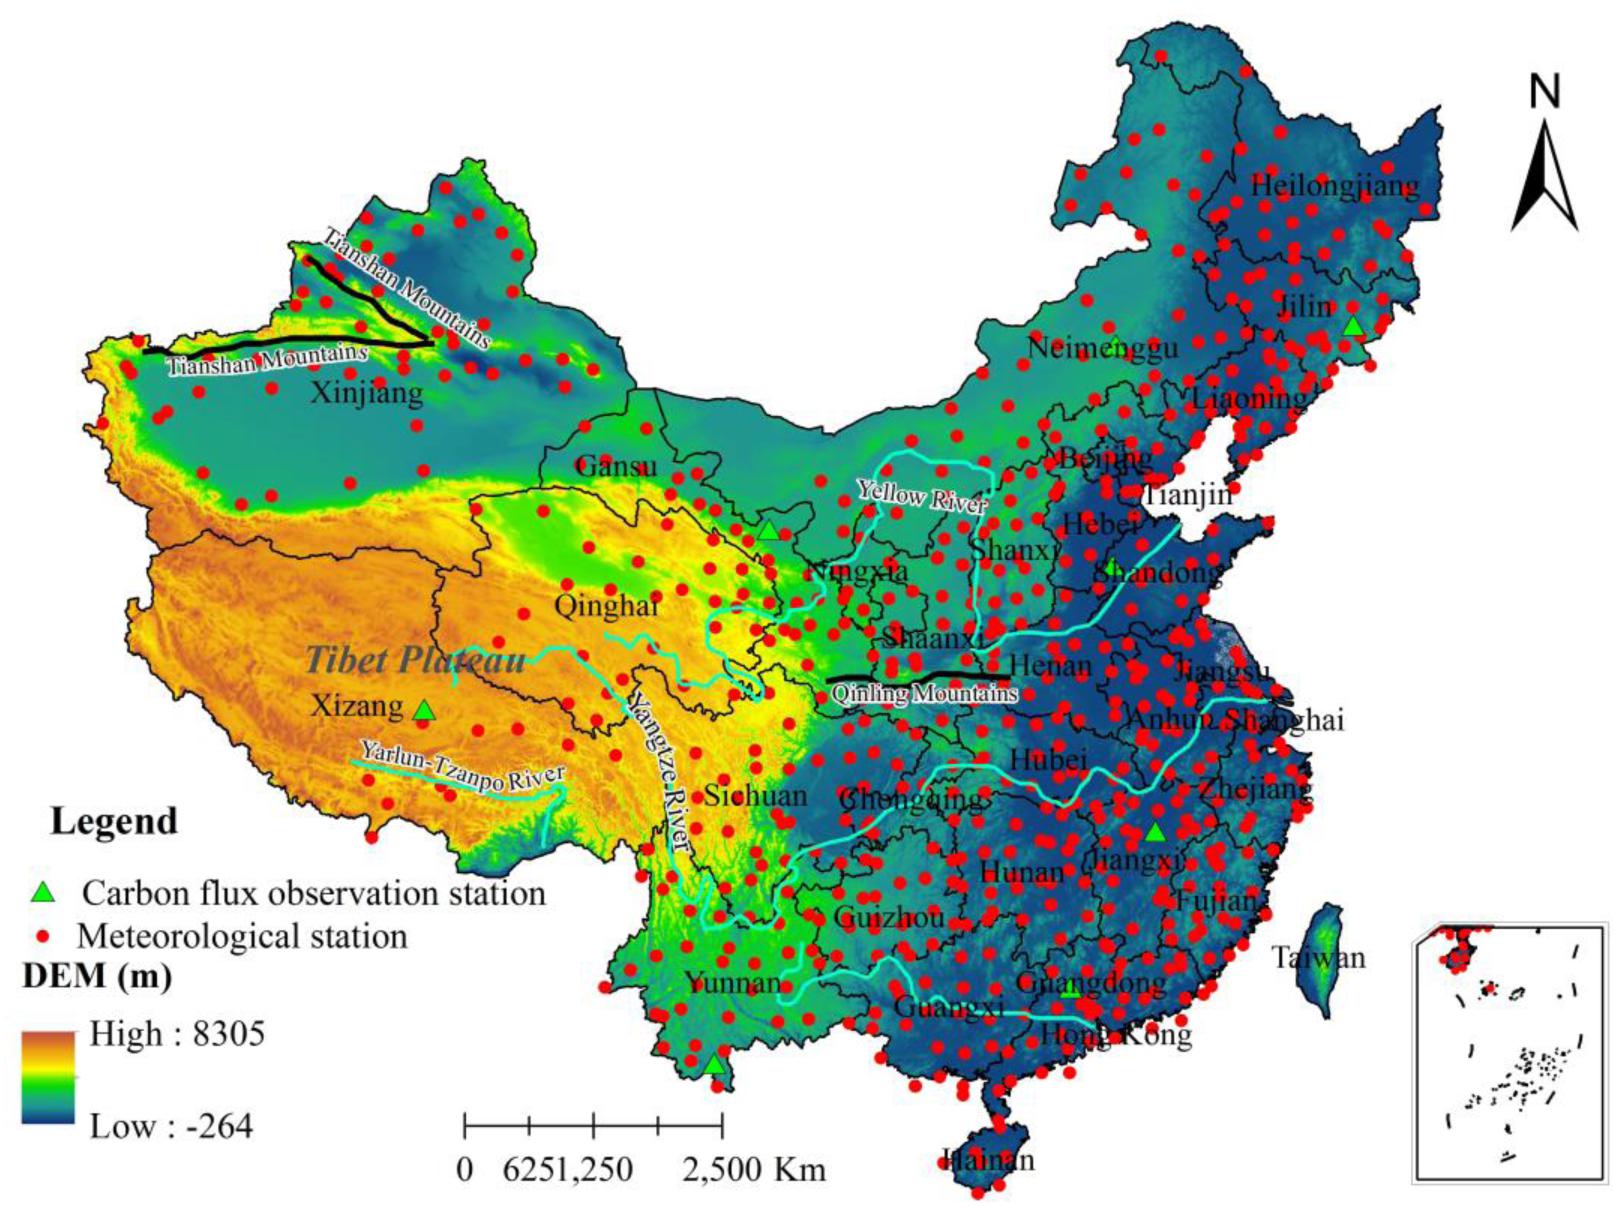
Figure 1. The meteorological stations (red dots), carbon flux observation station (green triangles), and our study area including the DEM in color shades.
Results and Analyses
The Evaluation of Derived NPP
In this study, the CASA model shown in Supplementary Section S1 is employed to derive the NPP in China from 1982 to 2012, which includes the annual NPP and monthly net photosynthesis. On average, our derived NPP has continuously increased from 3.7 PgC/yr in 1982 to 4.35 PgC/yr in 2012. Our result is similar to the work of Tao et al. (2003) and Yuan et al. (2014), but much larger than the results of Liu et al. (2013) and Piao et al. (2005). The different parameters in CASA model, namely the maximum efficiency of light energy utilization, and the more realistic classification of vegetation types, may explain the different results (Zhu and Pan, 2007). Our NPPs using the CASA model are generally higher than those derived from the MODIS products (MOD17 A3), which are produced by the Numerical Terradynamic Simulation Group (NTSG) of University of Montana (UMT) using MOD17 algorithm (Asrar et al., 1992; Figure 2). In fact, the MOD17 algorithm integrates maximum light energy utilization derived from Biome-BGC model, which does not consider many local factors (e.g., the water stress and vegetation types) that influence vegetation growth based on the high-precision vegetation classification. Therefore, the uncertainty of MOD17-derived NPP is relatively larger. To verify our estimation, mean NPPs in higher vegetated (e.g., humid zone) and lower vegetated (e.g., semi-arid and arid zones) regions have been extracted and compared with those derived from MOD17A3 dataset (Figure 2). Overall, our NPP in humid zones is larger than that derived from MOD17A3. In particular, from 2000 to 2006, our NPP is ∼400 gC/m2/yr larger (Figure 2A). Using FPAR constrained from the satellite NDVI retrieval, CASA model calculates more realistic NPPs in densely vegetated regions (Figure 2A). On the other hand, in arid and semi-arid zones, our estimated NPP is on average ∼100 gC/m2/yr smaller than that derived by MOD17A3 (Figure 2B). We speculate this may be caused by the different spatial resolutions between CASA and MOD17A3 calculations. At 1 km × 1 km resolution, the assignment of deserts in MOD17A3 is more realistic than that in CASA at 8 km × 8 km resolution. In China, deserts cover 1.33 million km2, 13.6% of the total land area of China. Deserts have been assigned a zero NPP in MOD17A3 and CASA. However, at 8 km × 8 km resolution, the same assignment of the wide-spread deserts is much larger than that in the MOD17A3 model, which may directly result a potential reduction in the NPP calculation in CASA model for the arid and semi-arid regions.
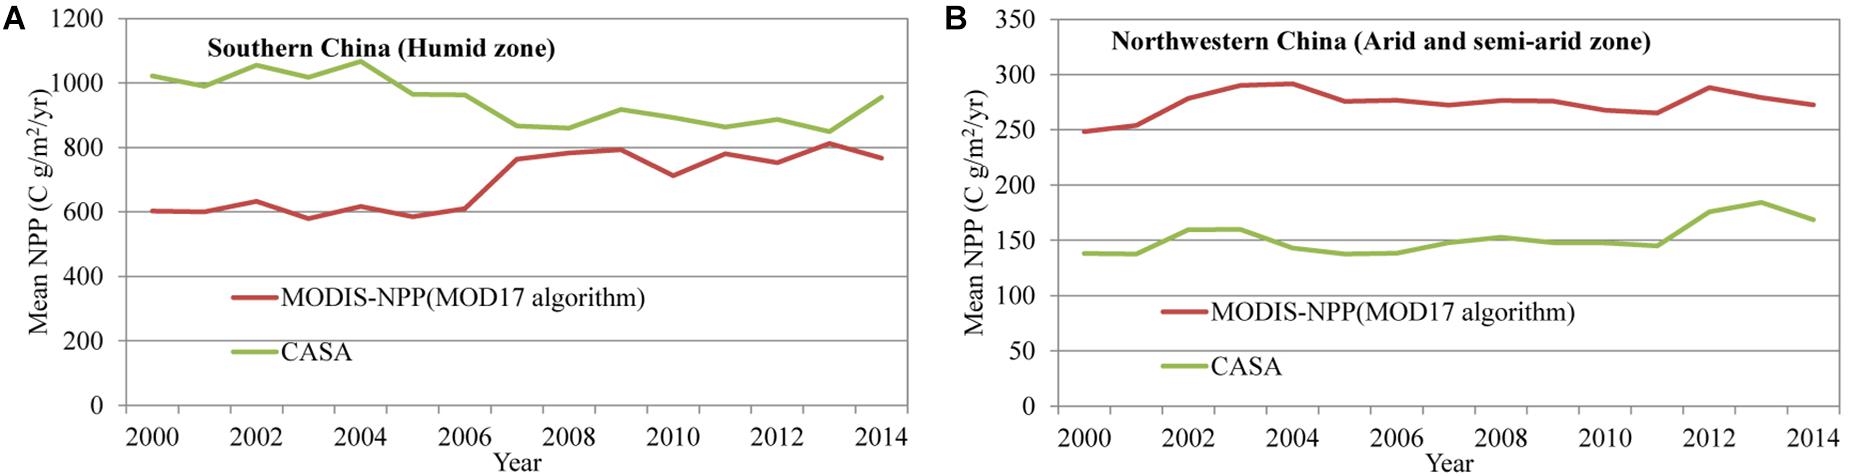
Figure 2. A comparison of two NPP estimations across different vegetation zones. (A) Higher vegetation coverage zones. (B) Lower vegetation coverage zones.
Table 1 shows a comparison of NPP values in the year 2005 for different plant functional types within China. Most of our derived NPPs is similar to those observed, except for the farmland NPP. CASA model has underestimated the farmland NPP compared to observation (eddy covariance tower). This is because in the CASA model, factors involving agricultural productions (e.g., fertilization, agricultural management, and irrigation) have been excluded. In fact, these factors play an important role in promoting agricultural yield (Knapp and van der Heijden, 2018). Compared to other studies, our derived NPPs for evergreen broad-leaf forest and deciduous needle-leaf forest are very similar to observed NPP. However, our derived NPPs are significantly different from the result of Piao et al. (2005) and Shang et al. (2018). We speculate that this is mainly due to the difference in the maximum light use efficiency and other constraint factors, such as temperature and soil water content in CASA model.
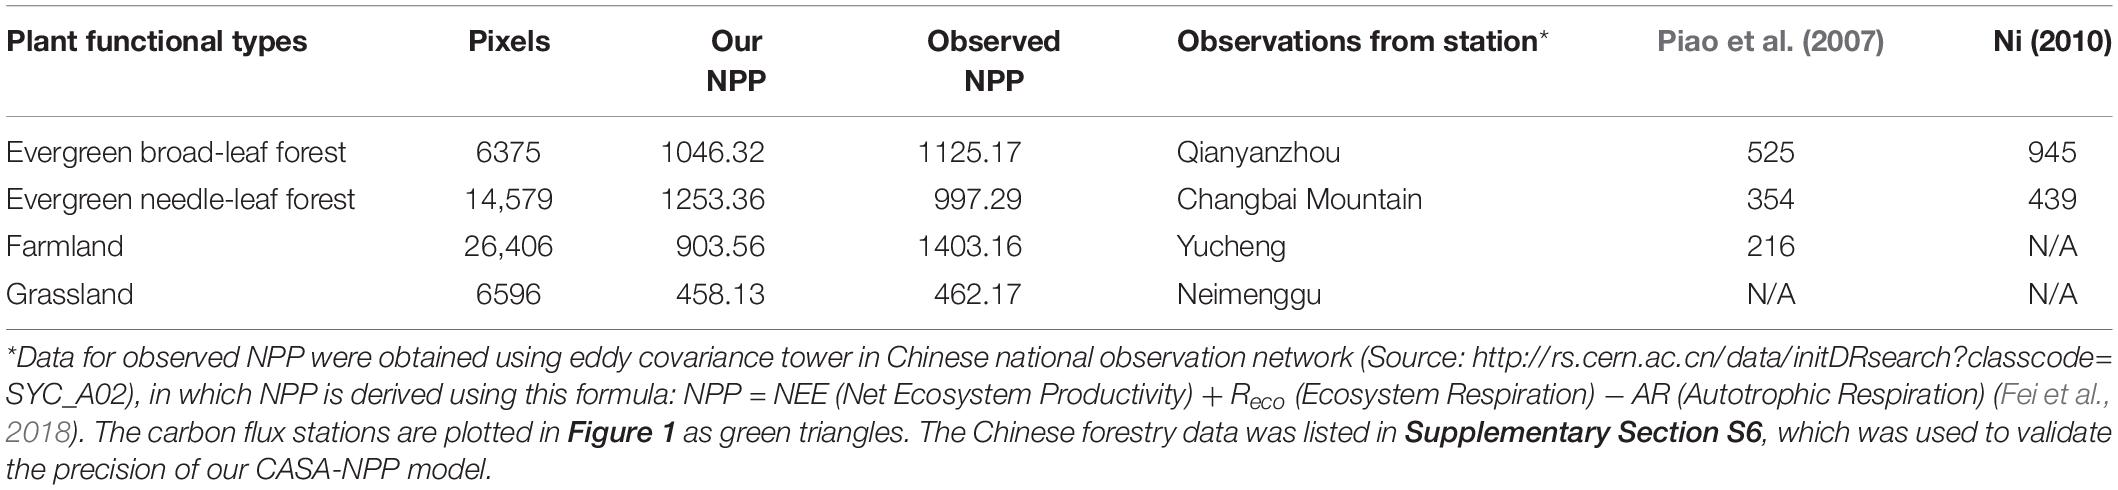
Table 1. A comparison of derived NPPs using CASA model of this study with previous studies and eddy covariance tower data for the year of 2005 (unit: gC/m2/yr).
The Characteristics of Annual Mean NPP in China From 1982 to 2012
Figure 3A shows the annual NPP in southern China is generally higher than in northern China. In addition, the annual NPP in western China is remarkably lower than in eastern China. The spatial distribution of Chinese NPP ranges from 0 to 2108 gC/m2/yr with a mean value of 433.04 gC/m2/yr. The lowest NPP values are found in the northern Tibet Plateau, southern Xinjiang, northern Gansu, and western Inner Mongolia. The highest NPP values are mainly located in the Qinling Mountains, southwestern Sichuan Mountains, Yarlun-Tzanpo River valley, the areas to south of the Yangtze River basin, and most of Hainan, Yunnan, and Taiwan. The NPP hotspots (locations with annual NPP values over 1600 gC/m2/yr) are found in the Hainan province and southern Yunnan where the tropical rainforest is widely distributed. As shown in Figure 3B, the annual total NPP in China has increased substantially from 1982 (3.82 PgC/yr) to 2012 (4.35 PgC/yr), at an average rate of 16.97 TgC/yr.
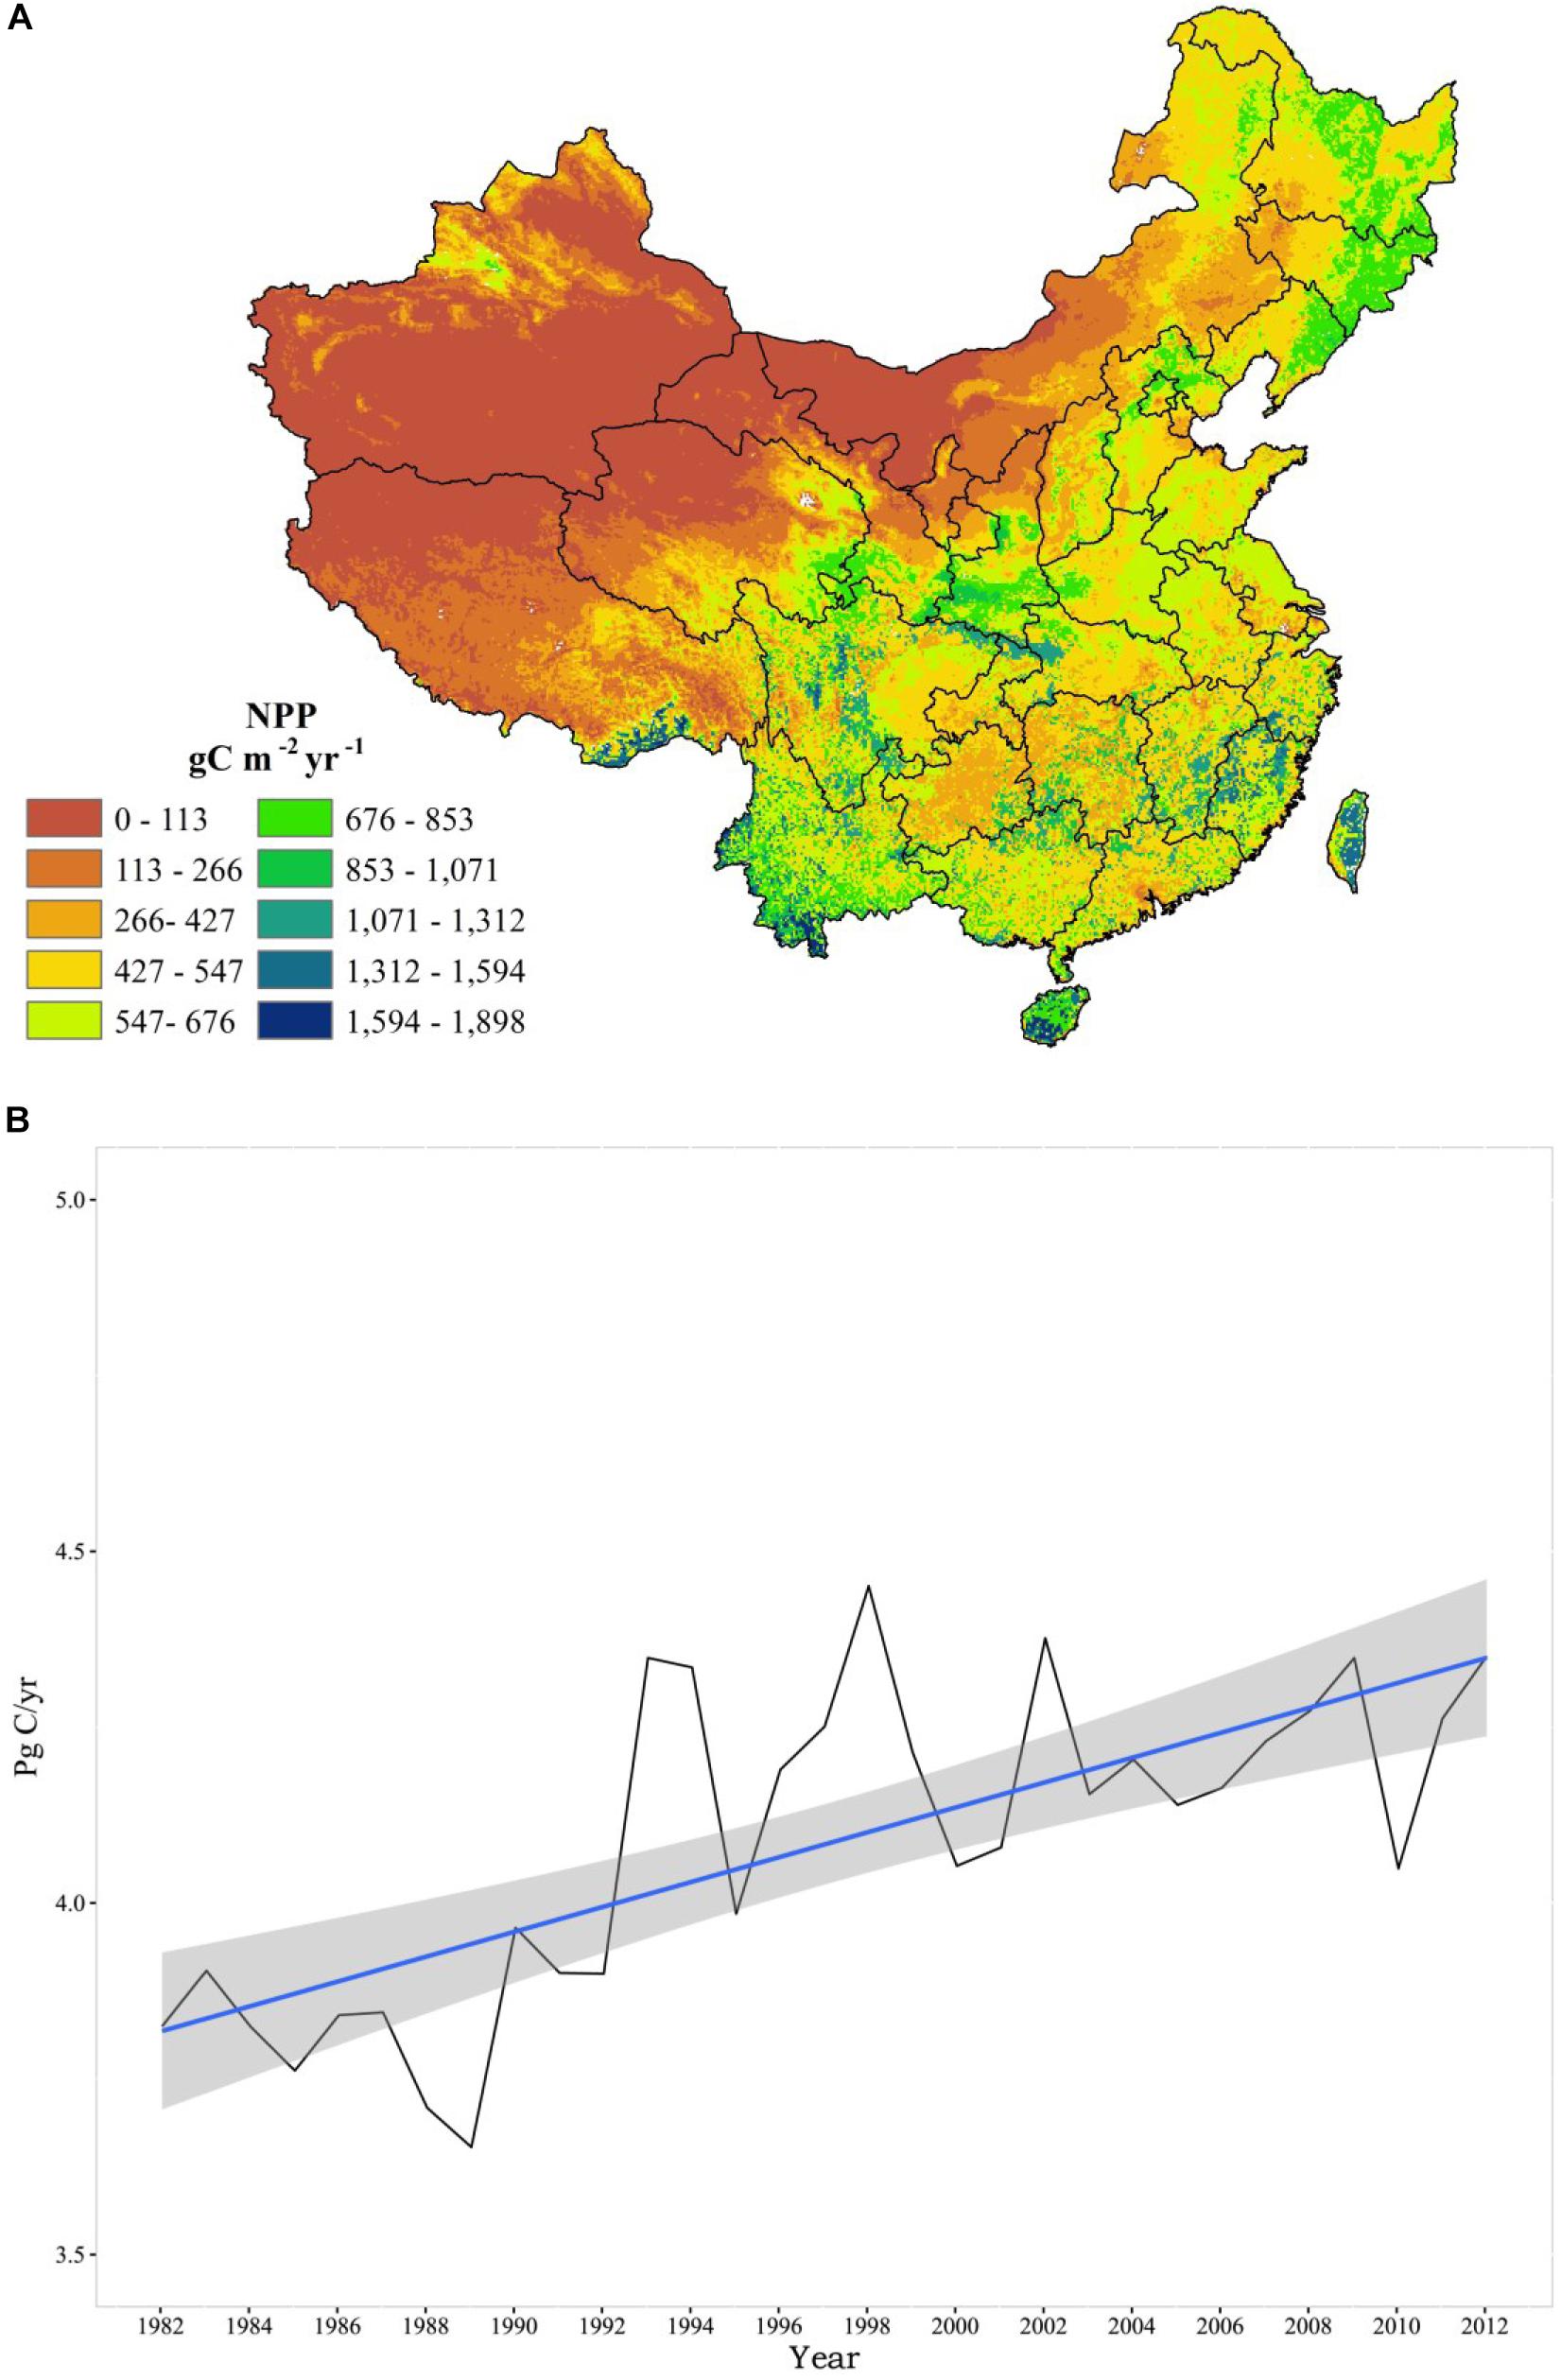
Figure 3. (A) The spatial distribution of annual mean NPP in China from 1982 to 2012 and (B) the timeseries of total annual NPP in China.
The Characteristics of Droughts in China
The SPI and SPEI indices are characterized by multi-timescales, such as 3-, 6-, 9-, and 12-month (and longer) timescales. The drought status over a 3-month period (including current month) can be identified by using the SPI3 and SPEI3 indices. According to the SPEI ranking criteria (Yang et al., 2018), three classifications are defined: (1) SPEI < 0 (mild drought), (2) SPEI < −1 (moderate drought), and (3) SPEI < −1.5 (severe drought). In this study, our drought frequency has been defined as the ratio between the total month of drought’s occurrences and the whole study period (372 months from 1982 to 2012) (see Supplementary Section S4.1 and Eq. 3). In this study, the datasets of SPI and SPEI were derived and validated based on the dataset at each meteorological station (see Supplementary Sections S3, S5). Figure 4A shows the mild drought is mainly located in the middle of the Tibet plateau. According to Eq. 3 in Supplementary Section S4.1, the frequency of mild drought is above 50% in most parts of China with a mean value of 56.25% (Figure 4A). The average frequency of moderate and severe droughts in China is 19.48 and 8.85%, respectively (Figures 4B,C). The areas to the north of Qinling Mountains-Huaihe River line generally have a higher severe drought frequency (see Figure 4B, >20%), among which eastern Shanxi and western Hebei are the most pronounced areas. For moderate droughts, higher frequency (>40%) is mainly distributed in Turpan and Hami of Xinjiang province. Nevertheless, higher drought frequency (Figure 4C) appeared in farming-pastoral ecotones (around the Heihe-Tengchong line), where agriculture and animal husbandry are developed very rapidly, indicating a high risk to China’s NPP.
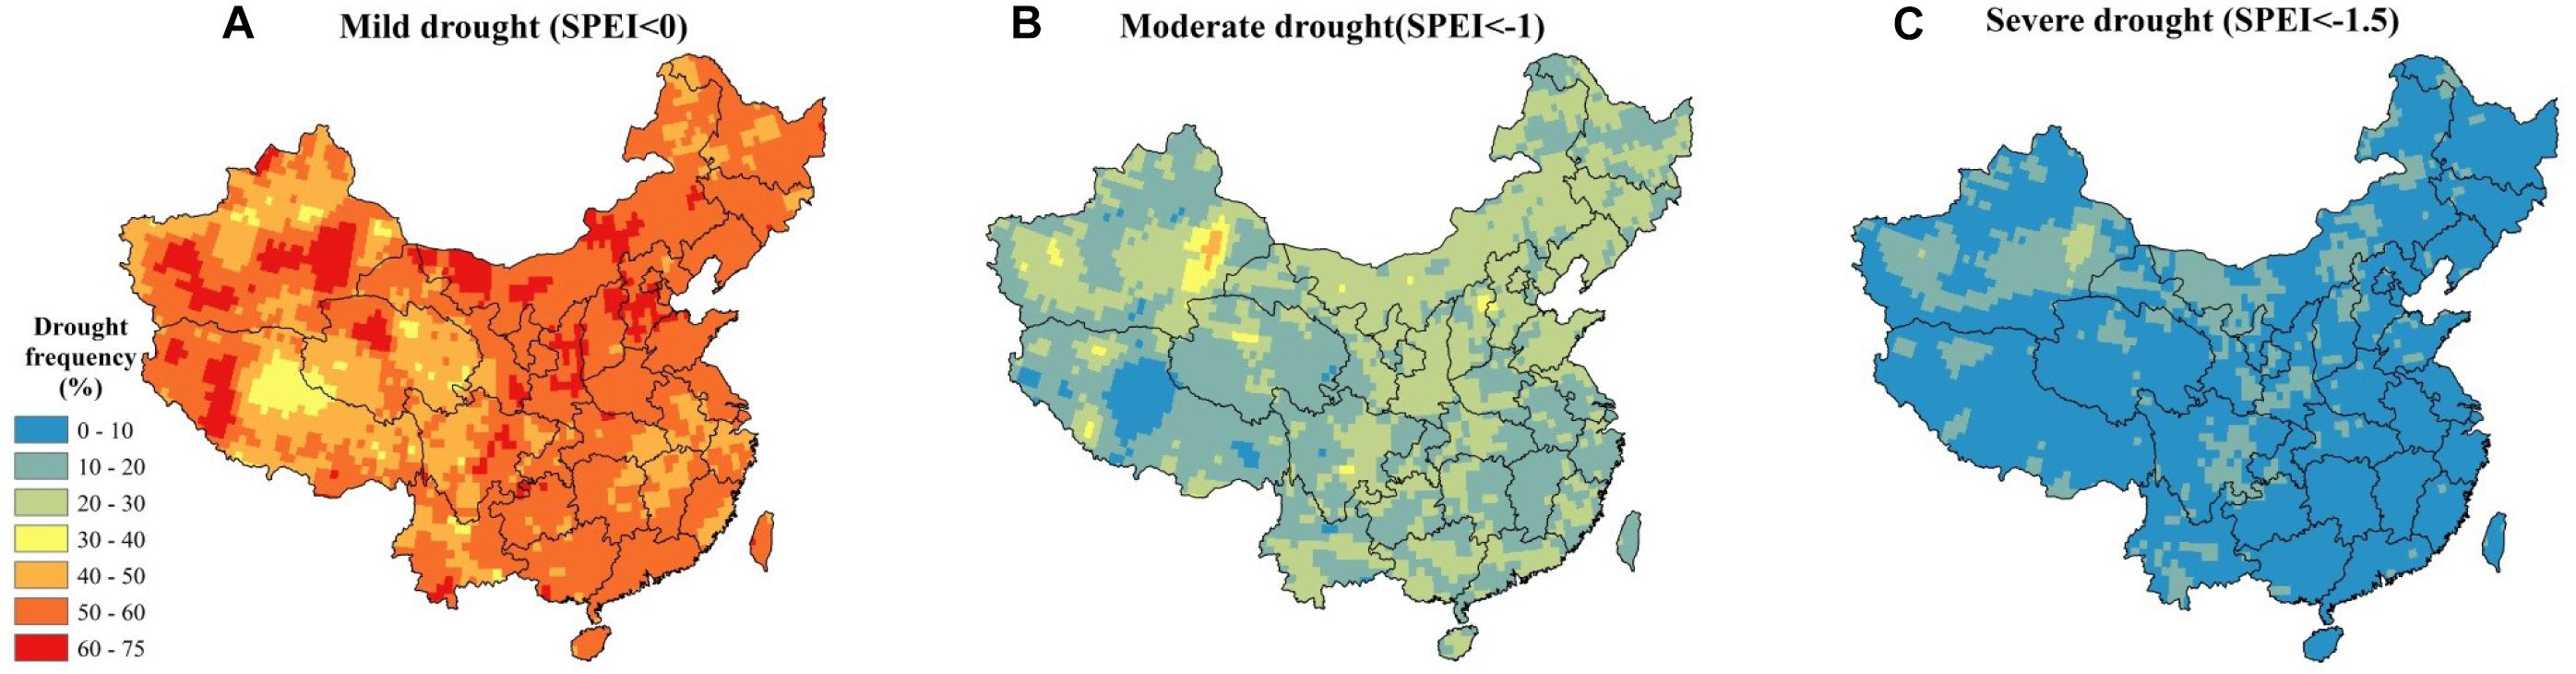
Figure 4. The frequency of droughts in China from 1982 to 2012 (SPEI3). (A) Mild droughts (SPEI3 < 0), (B) moderate droughts (SPEI3 < –1), and (C) severe droughts (SPEI3 < –1.5).
The Correlation Between Droughts and Monthly NPP in China
At different timescales, the SPI and SPEI drought indices are used to examine the relationships between droughts and monthly NPP in China (i.e., net photosynthesis), respectively, and also to show the reliability of our correlation analyses using different drought indices (i.e., SPI and SPEI). Pixels with significant coefficient of correlation (P < 0.1 or 90% significance level) are plotted. Figure 5 suggests that regardless which drought indices used, the results across different timescales (e.g., 3-, 6-, and 12-month) are quite similar. At the 3-month timescale, positive relationships between the monthly NPP and drought index are found in the Loess Plateau and the XilinGol League of Inner Mongolia (Figures 5A,D), in which corn planting and grassland are extensive. This indicates that the localized NPP (mainly from the agricultural production) would be significantly increased (decreased) under a wetter (drier) condition. The areas with negative relationships, mainly locate in Yangtze River Basin and its south, suggesting that excessive rainfall in these areas could cause a negative impact on the localized NPP at shorter timescales (i.e., 3 months). Our result is supported by a previous study about the heavy rainfall triggering saturated ground water and surface flooding, further decreases plant growth efficiency and results in hypoxia or death in some extreme cases (Tan et al., 2009). In southern China, very heavy rainstorms and typhoons often occur in the summer that will likely intensify this negative impact on the regional NPP. At the 6-month timescale (Figures 5B,E), the negative impact in southern China disappears. On the other hand, the positive correlation in northern China continues to increase, showing expanding influences of droughts at longer timescales (Figure 5B). The expanded areas now cover the whole Sanjiangyuan region, northern Sichuan, western Chongqing, and most parts of Shanxi and Gansu Provinces. Compared with the SPI, the more diverse relationships between the SPEI and monthly NPP have been identified, especially in the high mountains of western China. The positive relationship is mainly found in the northern and central China largely due to insufficient water supply in those arid and semi-arid regions. On the other hand, the negative relationship generally distributes in the shadow and nearby snow line (Figure 5E). At the 12-month timescale (Figures 5C,F), the statistically significant regions mainly concentrate in western China, especially in the Xinjiang and Sanjiangyuan regions. The main reason could be that everlasting droughts have significant impacts on arid or semi-arid ecosystems during the longer timescale (Chen et al., 2012). In summary, the areas with a significant relationship between drought indices and monthly NPPs at the 3-month timescale are much larger than those at 6- and 12-month timescales regardless which drought index is used.
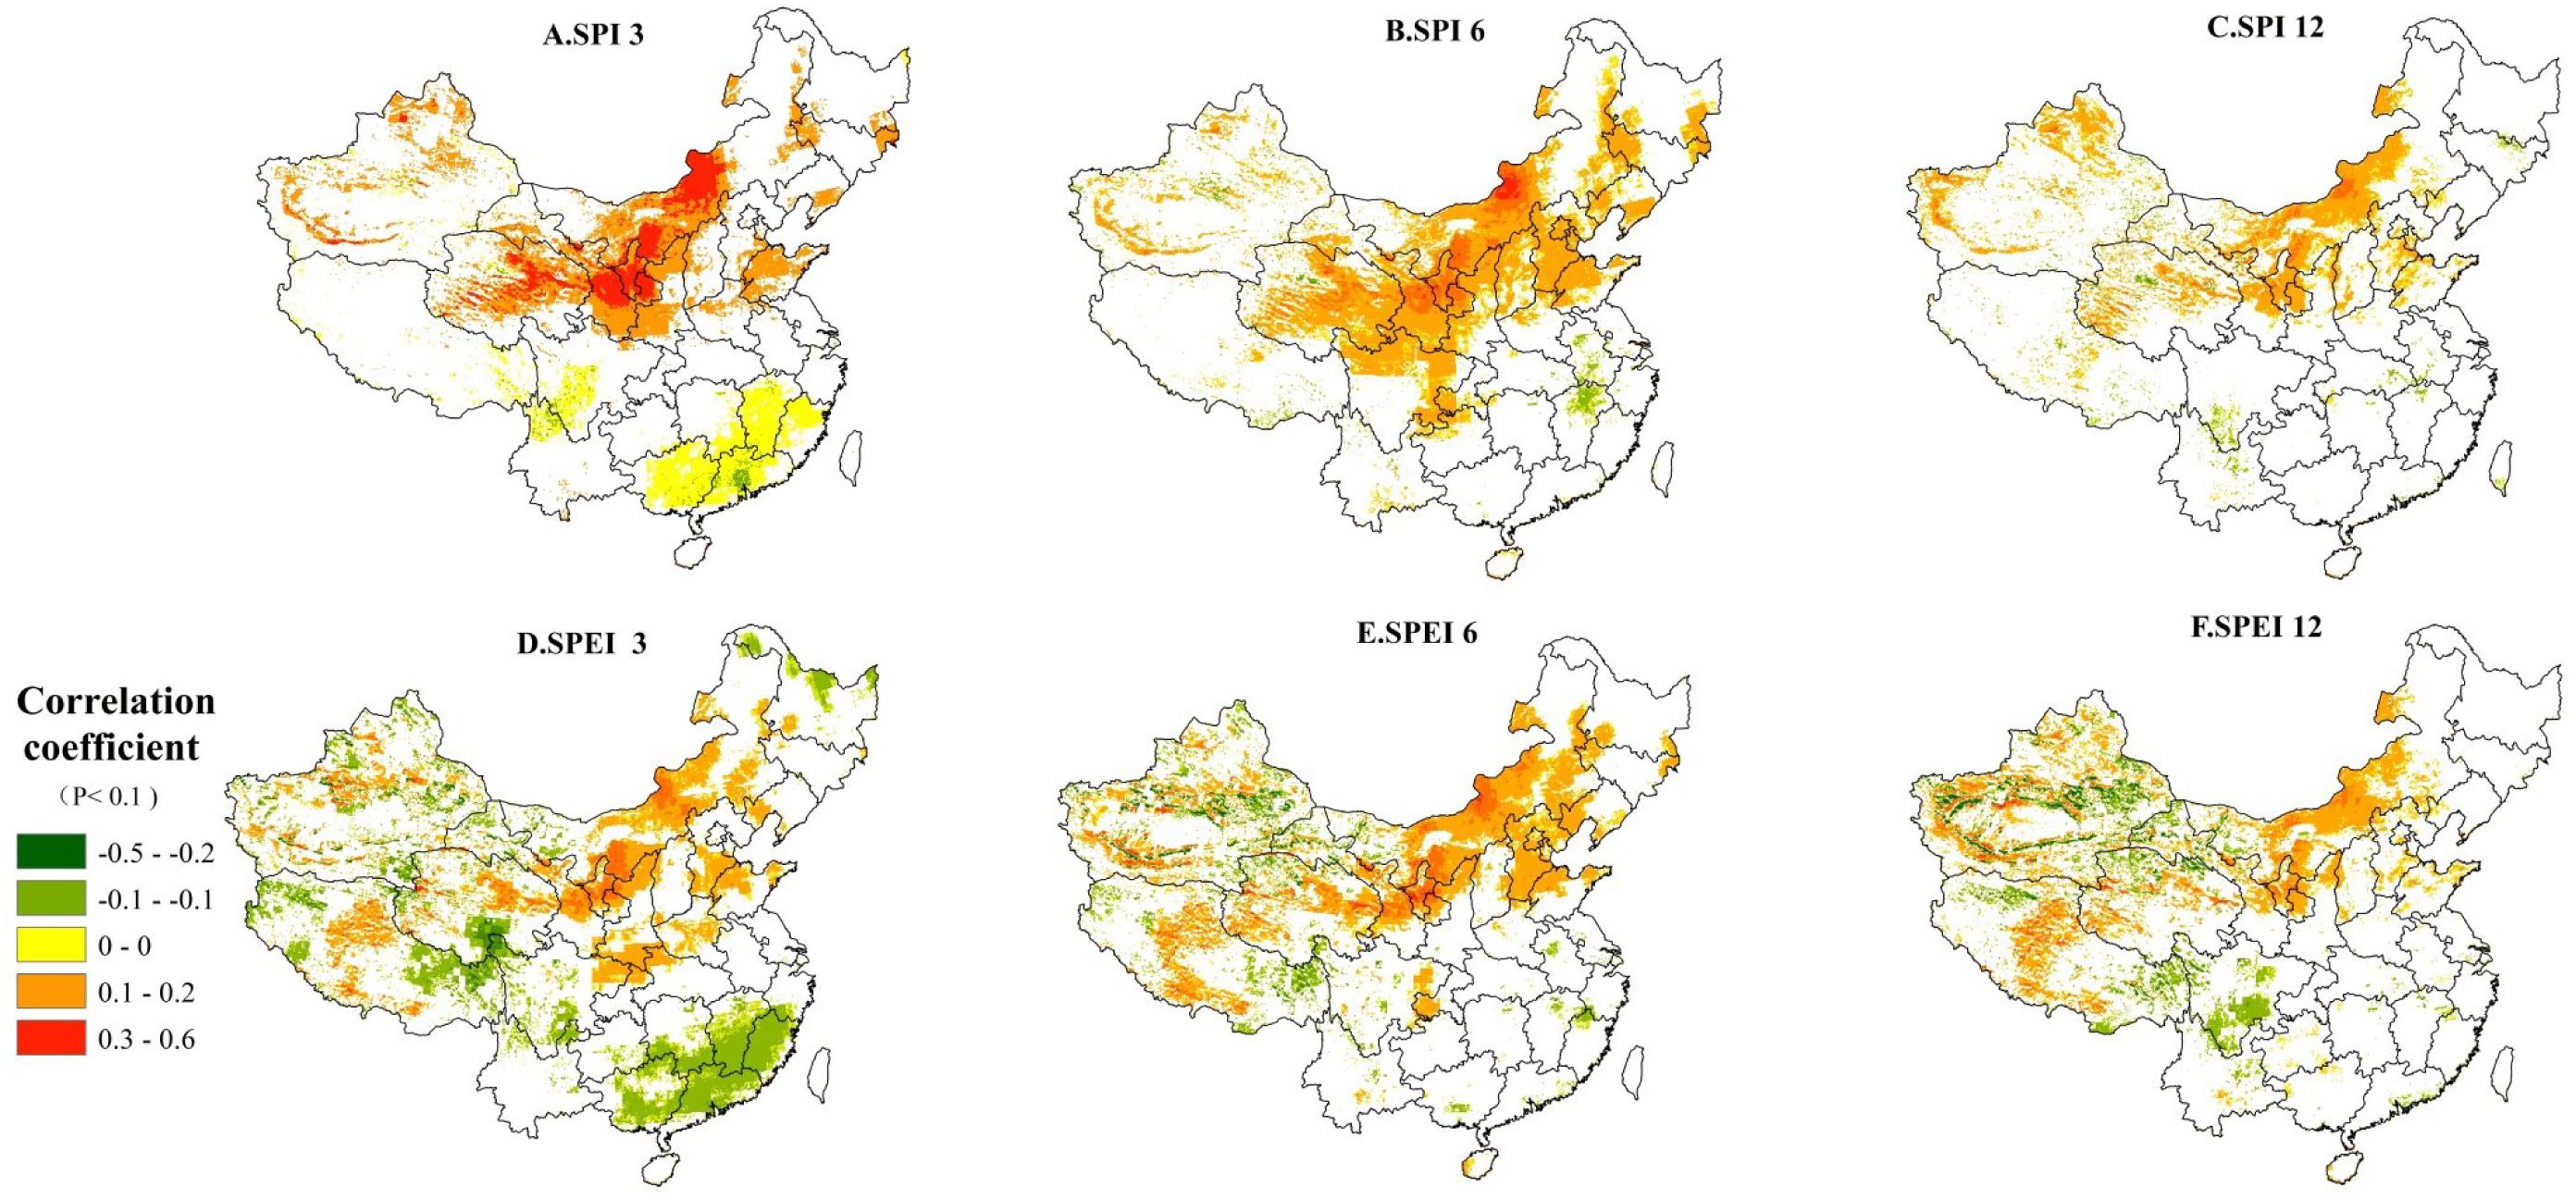
Figure 5. The significant correlation coefficient (hereafter CC) between SPI/SPEI and monthly NPP (P < 0.1 or 90% significance level). (A) CC between SPI3 and monthly NPP, (B) CC between SPI6 and monthly NPP, (C) CC between SPI12 and monthly NPP, (D) CC between SPEI3 and monthly NPP, (E) CC between SPEI6 and monthly NPP, and (F) CC between SPEI12 and monthly NPP.
The Contributions of the SPI/SPEI to Monthly NPPs Across Different Timescales
Contributions of the SPI/SPEI to the variability of NPP are determined using Eq. 5 in Supplementary Section S4.5, which represents the amount of NPP variation under the per-unit change of the drought index (unit: gC/m2 per unit change of drought index). Our results (Figures 6A,D) show that significant contributions of droughts on monthly NPP have been identified in northern and southern China over shorter timescales (e.g., SPI3 and SPEI3). At longer timescales, positive contributions of droughts tend to become significant in the semi-arid and arid ecosystems in western and northern China. In areas with positive impacts between the drought index and monthly NPP, the mean values of contributions are 2.28, 3.55, and 1.75 (unit: gC/m2 per unit change of drought index) at 3-, 6-, and 12-month timescales, respectively (Figures 6A–C). Our result shows that monthly NPP variation of arid and semi-arid ecosystems is driven mainly by the 6-month timescale droughts. On the 3-month timescale, droughts can only affect the monthly NPP in northern China, such as the North China Plain, the Chinese Loess Plateau, and the farming-pastoral ecotones. The strongest positive contribution is found in the catchment of River Wei and Guanzhong Plain in the southern boundary of the Chinese Loess Plateau (Figures 6A,D). Here, an increase of 20 gC/m2 monthly NPP could occur under an increase of per unit of drought index (wetter conditions). Conversely, at 3-month timescale, the negative contributions are mainly found in southern China (Figures 6A,D), such as Jiangxi, Fujian, and Guangdong provinces, with a monthly NPP decrease of 2.54 gC/m2 would result from per drought index unit increase (wetter conditions). The strongest negative contributions are found in the Sanjiangyuan Region and southern Sichuan Province. The probable reason for this phenomenon is that the ongoing increase in temperature (lowering the drought index) in these areas promotes the melting of snow and ice, causing a further increase of monthly NPP. On the 6-month timescale, the significant contributions between droughts and the NPP in southern China tend to disappear, while the same contributions are enhanced in semi-arid and arid regions in northern China. At the 12-month timescale, the stronger positive contributions are found in semi-arid and arid regions in northern China (Figures 6C,F). In addition, the influences of droughts on monthly NPP variation in eastern China tend to become weaker at longer timescales, except for the North China Plain. Compared to the SPI, the SPEI index is more effective to contribute to monthly NPP variation in China due to a relatively higher coefficient and larger areas with statistically significant relationships (see Figure 6, P < 0.1 or 90% significance level).
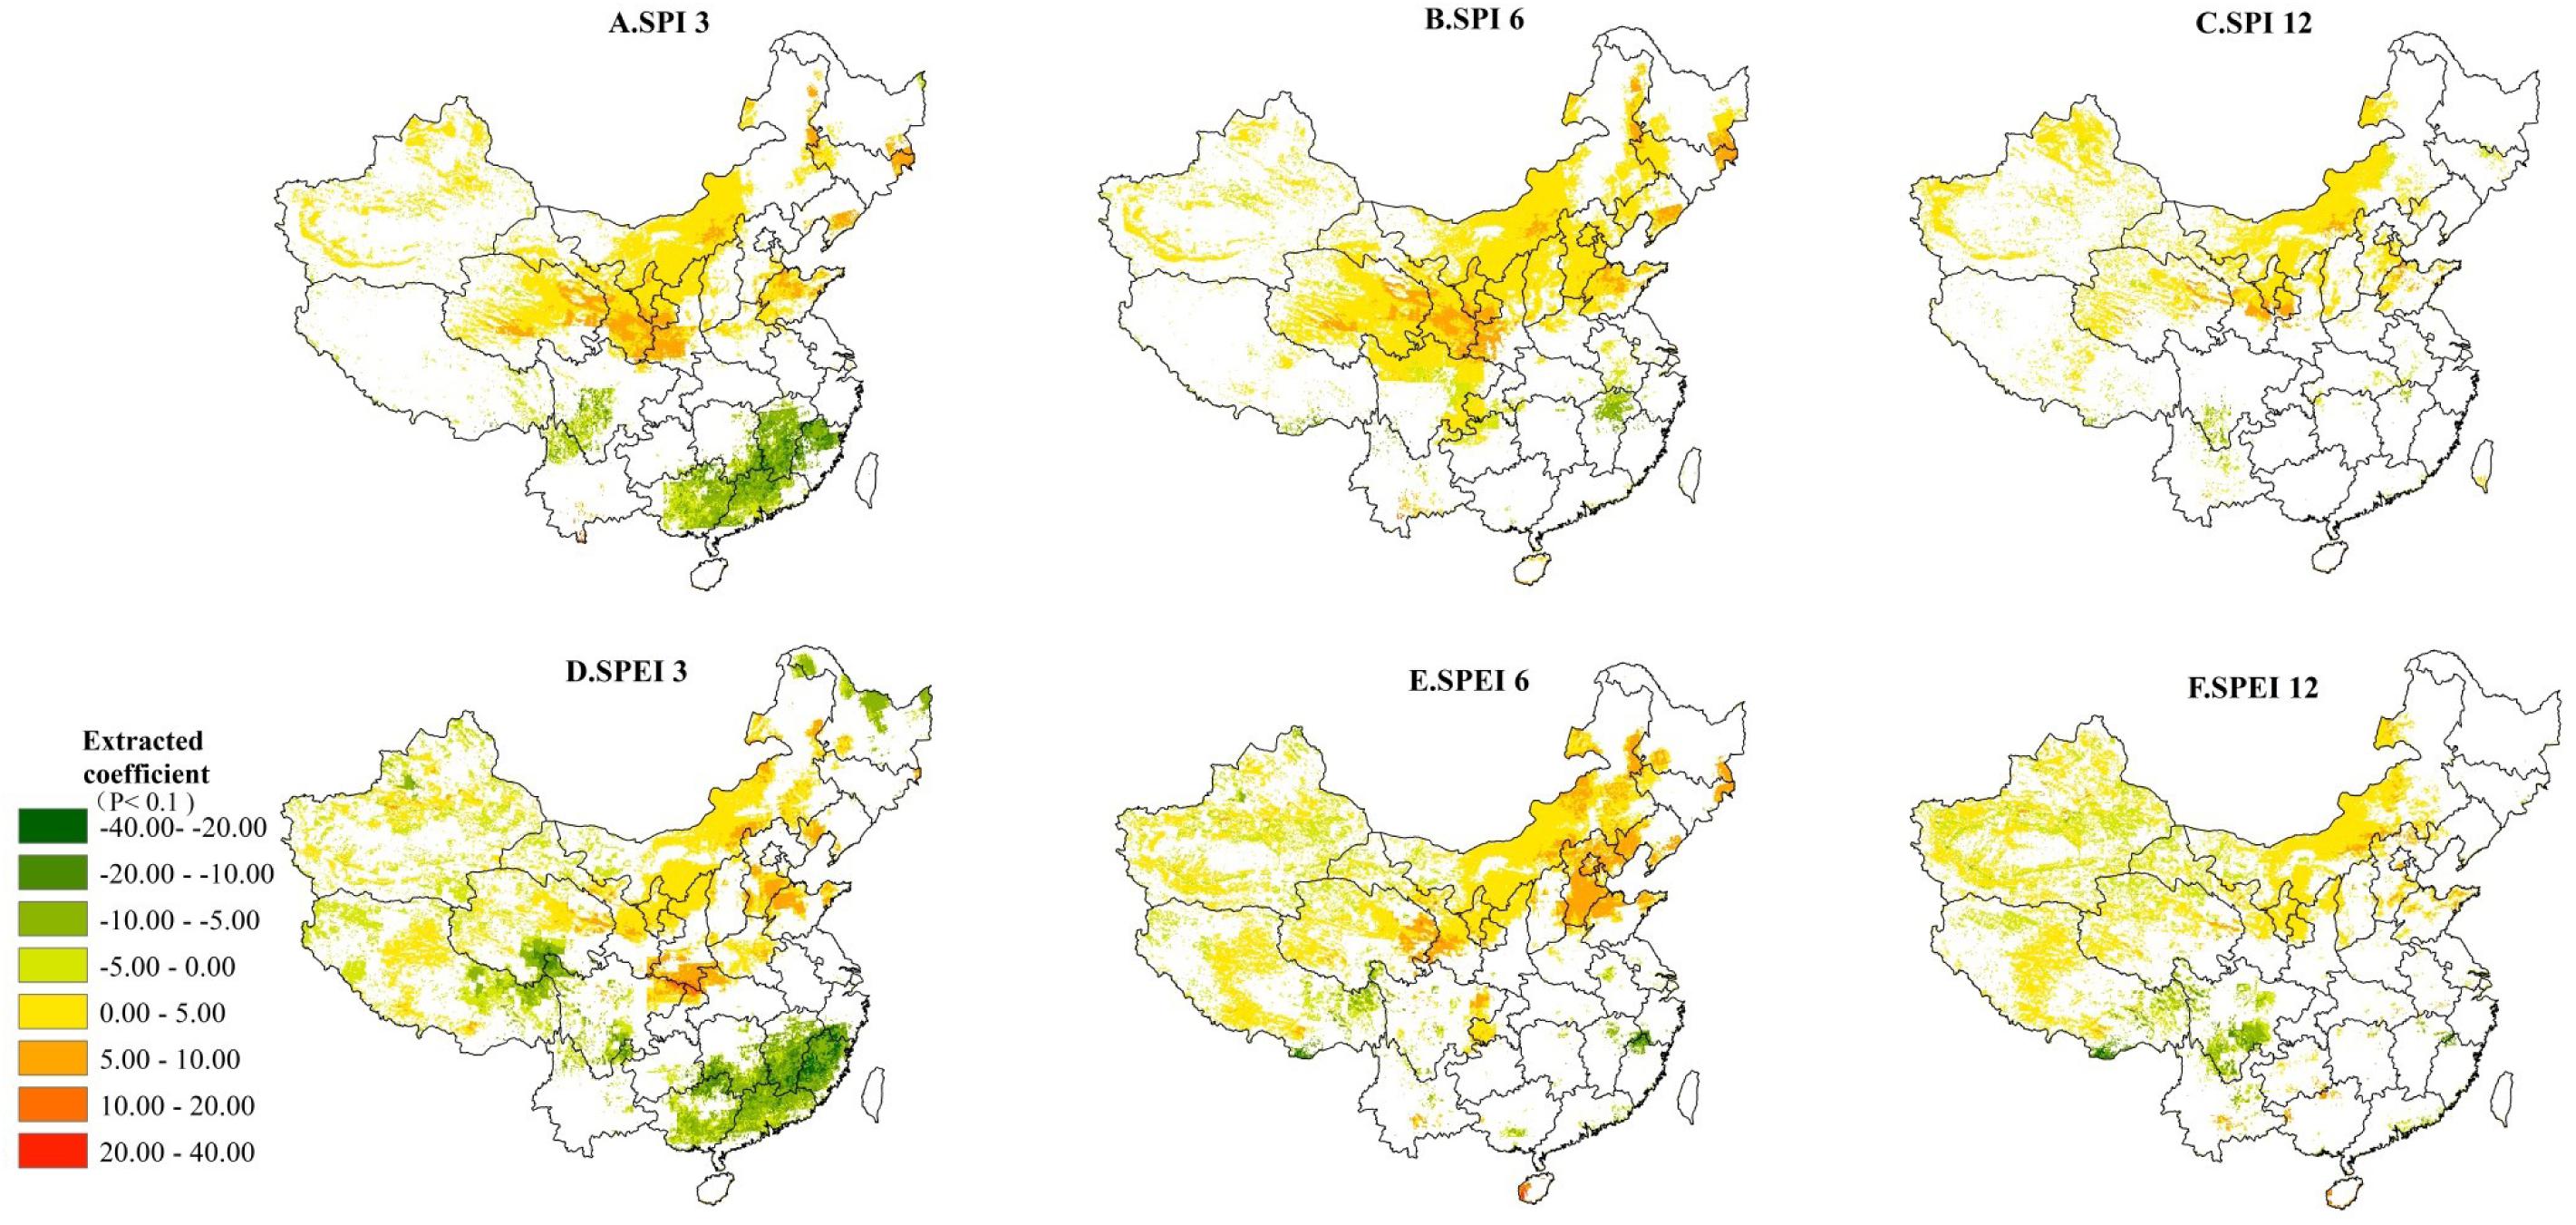
Figure 6. The contributions (unit: gC/m2 per unit of drought index) of SPI/SPEI to monthly NPP as defined by Eq. 6 in Supplementary Section S4.4. (A) SPI3 contributions, (B) SPI6 contributions, (C) SPI12 contributions, (D) SPEI3 contributions, (E) SPEI6 contributions, and (F) SPEI12 contributions. Only 90% statistically significant pixels are plotted here.
Relative Contributions of Droughts (SPEI3) to Monthly NPP Changes in Individual Months
Based on the section “The Correlation Between Droughts and Monthly NPP in China,” the SPEI3 is selected to examine the relative contribution (R2, unitless, and in percentage) of droughts to monthly NPP in individual months (January–December) as explained in our Eq. 7 in Supplementary Section S4.5. Figure 7 suggests that a unimodal tendency of R2 (at first an increase followed by a decrease) is observed from January to December. Across different months, minimal impacts of droughts are found in December with a mean value of 12.25%. However, the greatest impacts are identified in June with a mean value of 22%. The greatest impact occurs between June and September, with a mean value of over 20%. In January–February, the strong relationships are mainly in the North China Plain. The average impacts are generally lower due to the non-growing season, with a mean value about 16%. Between March and May, the influence level of water tends to increase in southern China (to nearly 18%), especially in Sichuan, Hunan, Chongqing, Guizhou provinces, and a small portion of Jiangxi province. This is because the evergreen forests begin to grow in these areas and vegetables are sowing and germinating at that time. During this period, the northern winter wheat is in the tillering stage, and spring wheat is sown, which results in an increasing demand for water. Hence, the impacts continue to increase in northern China (however, the pixels with higher percentages are scatteredly distributed; see Figure 7). In June and July, the main grasses (Leymus chinensis, Agropyron grass, Stipa grandis, and Artemisia frigida) and corn in northern China begin to grow (Zhang and Yang, 2007); hence, the impact of droughts on monthly NPP increases to 50% in the Xilingol grassland and the Chinese Loess Plateau due to water deficits. In August and September, much more water is needed due to the growth of vegetables and upland crops in southern China as well as the grass and staple crops in northern regions. This causes a significant increase in the impact of drought, but the areas with a significant value of R2 (P < 0.1 or 90% significance level) gradually decreases. Between October and December, the significant drought impact tends to decrease continuously. Interestingly, the period from May to September is the key season for vegetation growth in the Tibet Plateau and agricultural production of the isolated oasis farms in western China, which is significantly impacted by droughts.
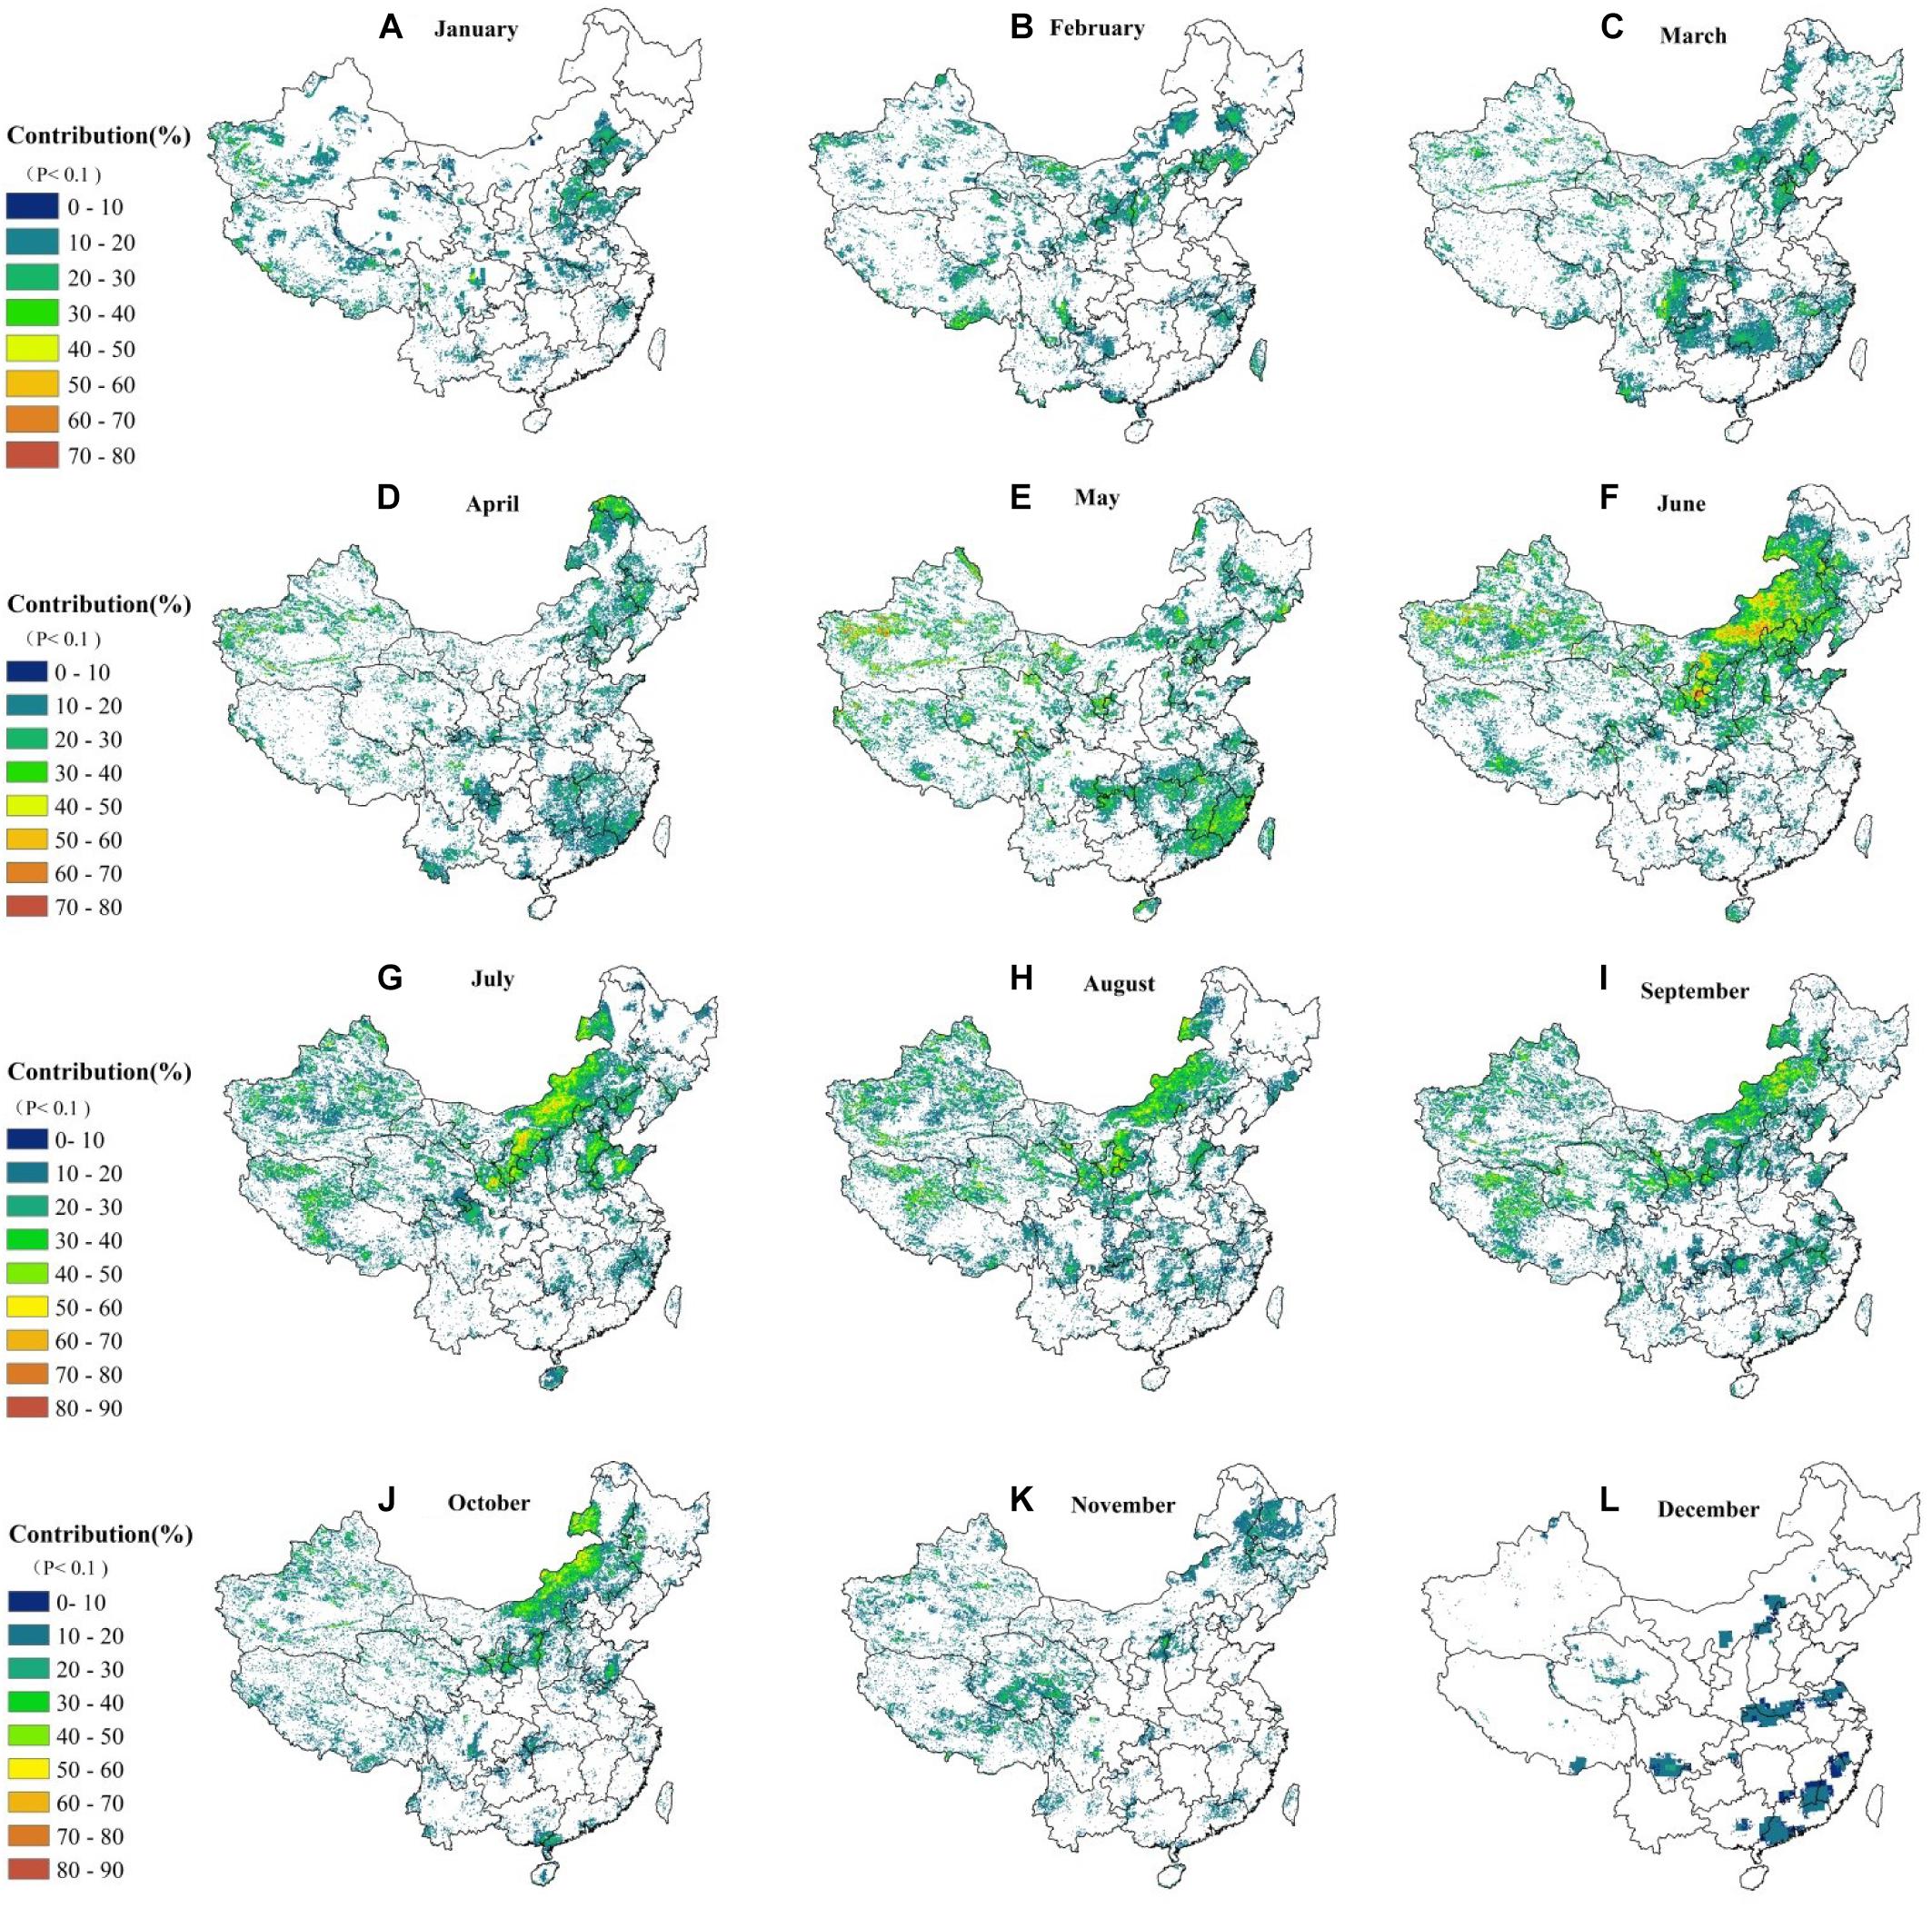
Figure 7. The R2 of monthly NPP and SPEI 3 in different months over a period of 1982–2012. From Images (A) to (L) stands from January to December.
Discussion
Droughts can significantly limit plant growth and further decrease the NPP by restricting the availability of soil water (Xu et al., 2019). In this study, the strongest correlation between drought and monthly NPP is identified in the semi-arid ecosystems in the farming-pastoral ecotones in northern China (Figure 5). This information will help to promote the terrestrial ecosystem management in the area. At multi-timescales, the strategies for coping with droughts are different among individual biomes (Vicente−Serrano et al., 2015). The humid biomes are usually sensitive to droughts, and their NPP tends to sharply decrease under the water stress (Vicenteserrano et al., 2013). However, except for upland crops, the resistance of arid or semi-arid biomes to water deficits is much stronger when they change leaf and root morphology to reduce evaporation and retain water during long-term droughts. Therefore, the monthly NPP of semi-arid biomes tends to decrease gradually. The response time of biomes toward drought is called the “lagging time.” Concerning interannual NPP variation, a significant lagging time usually exists in trees, and a period of 1–4 years is usual among the Pinaceae family (Anderegg et al., 2015). However, the lagging time in semi-arid ecosystems may be 16–19 months (Huang et al., 2016). In addition, the monthly NPP of grassland and farmland in semi-arid ecosystems is sharply reduced during droughts. Lei et al. (2015) reported that droughts could account for 51.75% of NPP loss in grasslands in Inner Mongolia of northern China. A total reduction of 154 gC/m2/yr of the NPP can occur due to droughts in grasslands in China (Xiao et al., 2009). About 53% of the areas of China are occupied by arid or semi-arid ecosystems, of which 22% are semi-arid ecosystems where agriculture and animal husbandry are developed. However, severe droughts in these areas occur frequently (Figure 4), causing substantial fluctuations in the annual NPP. A previous study reported that the farmlands in China obviously have been moved to the north and across the Yellow River, indicating that there is no doubt that the future Chinese NPP will be threatened profoundly by droughts (Liu et al., 2009).
Over the past 20 years, the increasing annual NPP in the northern hemisphere, including China, has been verified by many studies (Liu, 2001; Lee and Veizer, 2003; Piao et al., 2007; Zhao and Running, 2010; Kim et al., 2012). In China, significant increasing trends in annual NPP (Figure 8) are mainly located in the southwestern China, including Sichuan, Guizhou, Yunnan, Guangxi, Guangdong, Hainan provinces, and the eastern Tibet Plateau, where an increase of 26.64 gC/m2/yr of the annual NPP is identified during our study period (Figure 8). We also notice that the greening project led by the so-called “grain-for-green” policy in the Chinese Loess Plateau has resulted in a remarkable increase in vegetation activities. Our derived annual NPP has shown this significant increase, which has been confirmed by other studies (Peng et al., 2007; Persson et al., 2013; Jiang X. et al., 2019). However, in areas with strong human activities and/or an unreasonable combination of water and heat (e.g., urban zones and high mountains), the annual NPP tends to decrease in our study period. Our results have been supported by previous studies (Liu, 2007; Xu et al., 2017). The mean annual NPP decreasing rate of 42.82 gC/m2/yr is found in those areas. On the 3-month timescale, increased SPEI3 index (indicating wetter conditions) can significantly enhance the monthly NPP in northern China, but significant heavy rain at shorter timescales (e.g., 3-month) in southern China can reduce the monthly NPP. Considering the extent of influence from droughts, the 3-month timescale is appropriate to evaluate the relationships between water shortage and monthly variability of NPP in China, which is consistent with the result of Yang et al. (2018). In addition, at the 6-month timescale, droughts can only be used to assess the relationships between water shortage and the monthly variability of NPP in northern and western China. Our results suggest that the 3- to 6-month drought indices (e.g., SPEI3 and SPEI6) are appropriate for evaluating the relationships between droughts and monthly variability of NPP in China.
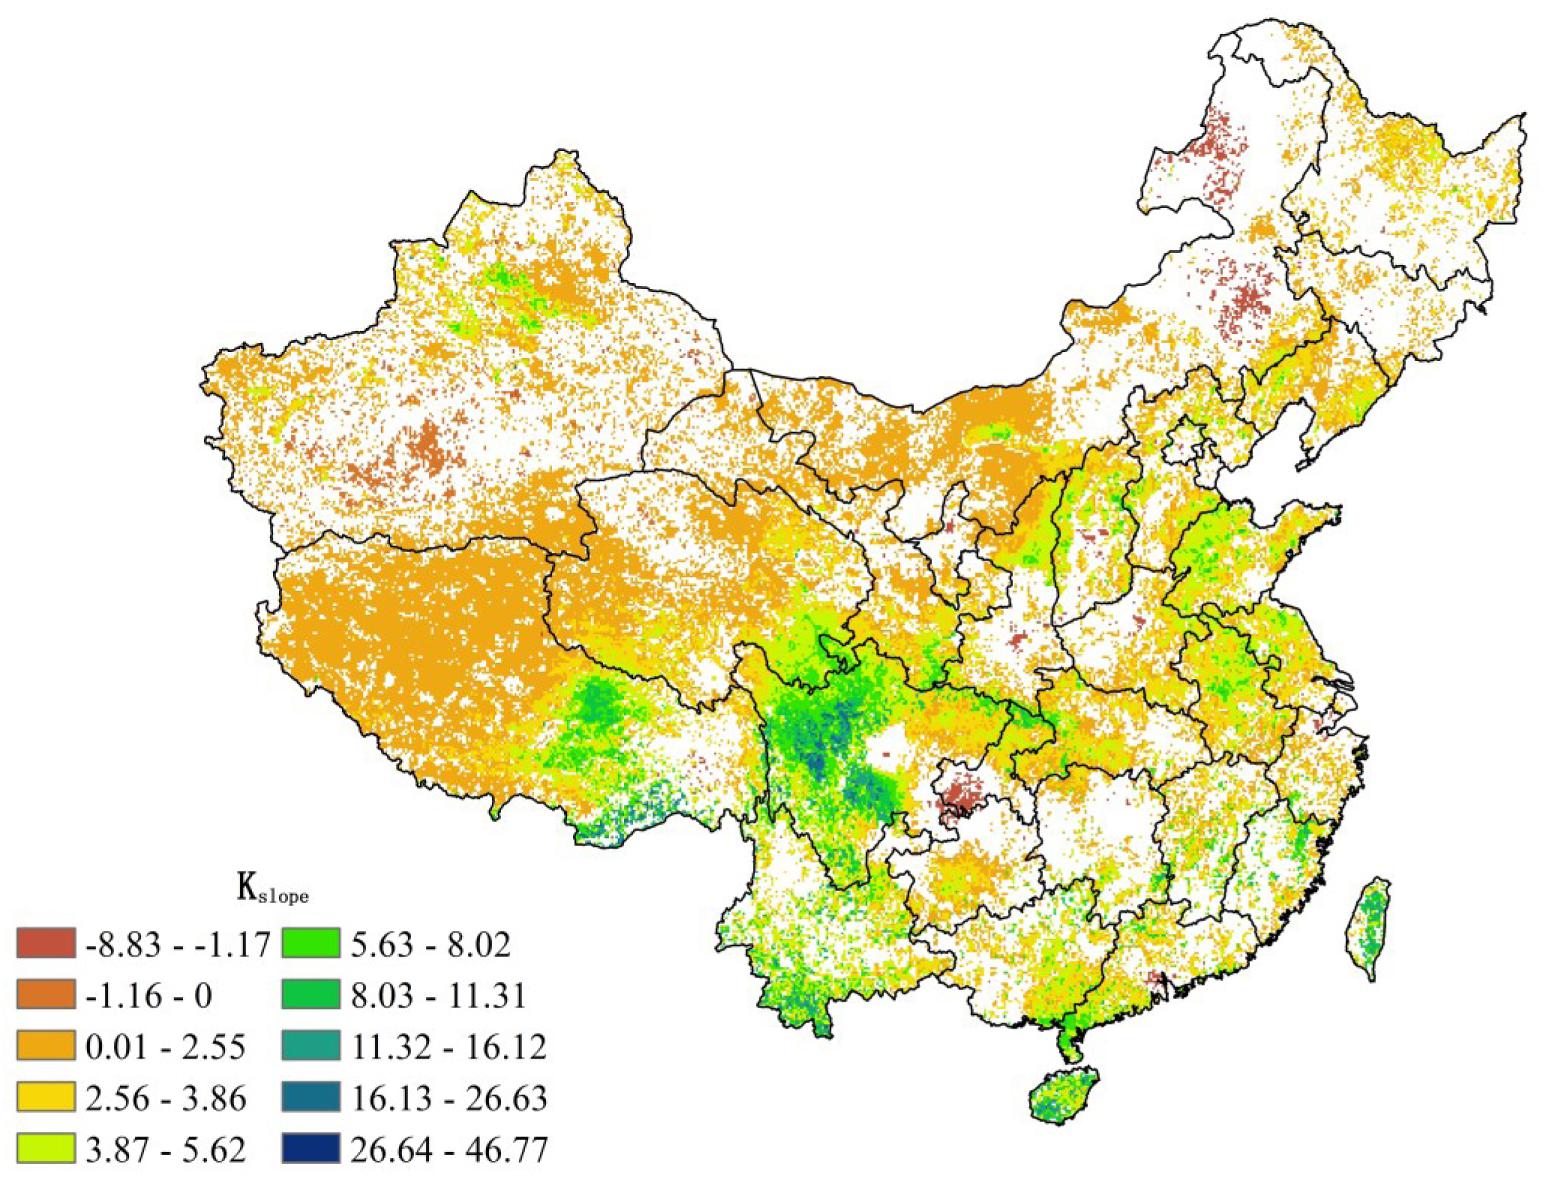
Figure 8. The long-term trends of annual NPP in China from 1982 to 2012 (P < 0.1 or 90% significance level).
According to Figure 7, the NPP in China is mostly sensitive to droughts in the March–October season, among which the period of May–July is the most important months. Here, our result agrees with Ji and Peters (2003). During May–July, the average contribution from droughts on monthly NPP is >22% (Figure 7). The greatest contributions of droughts to monthly NPP have been found in the Tibet Plateau and northwestern China, including the middle of the Tibet Plateau, the Yarlun-Tzanpo River Valley, and the Tianshan Mountains of western China, especially the variation of alpine meadow (Figure 7). More importantly, according to our results (Figure 7), the greatest impacting month of droughts on the NPP in southern China occurs in May, but in northern China, it occurs in June.
Previous studies have reported that longer and severe droughts, as represented by the PDSI and SEDI, can remarkably reduce the NPP in China over the past 30 years (e.g., Li et al., 2016, 2019a). Although soil moisture content and soil water loss have been considered in the PDSI, which is beneficial to reflecting the actual status of droughts, lagged response from vegetation to soil water deficit can result in some unreliable results for quantitatively determining the relationship between PDSI and NPP. In this study, an outstanding 3–6-month lagging period of vegetation to droughts has been found; therefore, a multi-timescale drought index (e.g., 3–6-month drought index) can provide a reliable investigation about the lagged relationship between droughts and NPP changes. In previous studies, the effect of individual drought events on NPP has been focused broadly (e.g., Lai et al., 2018; Li et al., 2019a). However, compared with individual drought events, the evolution trend of droughts generally have greater impacts on vegetation activities at longer timescales (Piao et al., 2019). Thus, exploring the relationship between drought trends over longer timescales and their impacts on NPP changes has played a key role in revealing the mechanism of future TEP evolution within the context of extreme climate events.
More importantly, NPP variations are generally controlled by many inter-playing factors, including from both natural and anthropogenic sources. First, different tillage practices and grazing policies can all have profound impacts on farmland and grassland NPP changes, respectively. In general, ever-advancing tillage practices (fertilization, pesticides, plastic mulch, and irrigation) have significant and positive impacts on increasing NPP in farmlands. For instance, higher maize NPP (yield) can be achieved by improving tillage practices at a planting date ranging from late April to early May and an N-fertilizer input rate of 180–210 kgN ha–1 with two timing splits in northeastern China (Jiang R. et al., 2019). Furthermore, severe grazing can remarkably reduce the NPP in grass ecosystem and further result in desertification that has been verified in a case study of Xilingol Grassland, northern China (Chi et al., 2018). The study revealed that 94.6% of the area of Xilingol grassland showed a negative correlation between NPP residuals and grazing pressure (Chi et al., 2018). Second, at shorter timescales, human activities play some important roles in driving NPP variations. In the developing world, the rapid urbanization has an obviously negative impact on regional NPP changes (Li et al., 2019b). Under the processes of urbanization, large amounts of farmlands, wetlands, and forests are overall replaced with poorly permeable surfaces of cement and asphalt that result in the NPP reduction. Liu et al. (2019) have reported that the rapid urban expansion in the period of 2000–2010 has in turn reduced global terrestrial NPP, with a net loss of 22.4 Tg carbon per year (Tg C yr–1), which can overall offset 30% of the climate-driven NPP increase (73.6 Tg C yr–1) over the same period. Li et al. (2018) has shown that 63.02% of total NPP losses in China could be explained by the conversion from farmland to suburban land. Furthermore, different feedbacks and interactions between vegetation growth and human activities have been identified. For example, Piao’s group has demonstrated that an increasing vegetation greenness (likely higher NPP) caused by human activities (land-use practice, CO2 fertilization, and nitrogen deposition) has significantly changed regional water cycle and evapotranspiration, especially in dry regions. Data have revealed that the global leaf area index (LAI) has enhanced 8% between the early 1980s and 2010s, which will cause a global increase of 12.0 ± 2.4 mm yr–1 in evapotranspiration and 12.1 ± 2.7 mm yr–1 in precipitation representing about 55 ± 25 and 28 ± 6% of the observed increases in land evapotranspiration and precipitation, respectively (Zeng et al., 2018; Piao et al., 2020). Chen et al. (2019) has demonstrated that human land use practice has contributed a larger proportion to Earth greening (over 33%). However, in our study, the anthropogenic factors mentioned above were not considered mainly due to factor of the large-scale nature of our study, and the lack of localized observations to match with policy-driven and LULC impacts on the NPP. Therefore, in the future, a process-based model (e.g., CLM4.5, ISAM, LPJGUESS, LPJ, and LPX) involving many interplaying factors can be used to accurately explore the relationships between the NPP and natural/anthropogenic factors (Ding et al., 2018).
Conclusion
The total annual NPP in China has increased from 1982 to 2012 with a mean rate of 433.04 gC/m2/yr. In our study period, a total NPP increase of 16.97 TgC/yr is found mainly located in southern and southwestern China. Droughts in China continue to be severe, and the frequency of moderate drought is >20% in northern China. The frequency of severe drought is >10% across farming-pastoral ecotones. The strongest relationships between drought and monthly NPP in China are located in the farming-pastoral ecotones of semi-arid ecosystems. On the 3-month timescale, a negative contribution of droughts on the monthly NPP in southern China has been found, in which a mean NPP reduction of 2.54 gC/m2 can be found with per-unit increases in the drought index (wetter conditions). However, the interannual NPP in the same areas has continued to increase due to the global warming, nitrogen deposition, and advances in agriculture that can compensate for the monthly NPP losses caused by flooding (higher SPEI index). On the 6-month timescale, the strongest correlations between drought and monthly NPP are located in farming-pastoral ecotones of arid and semi-arid ecosystems covering grassland and corn fields.
The SPEI is more effective in defining the relationships between droughts and monthly NPP in China. The response period (e.g., the lagging time) of monthly NPP to droughts in southern China is about 3 months. The lagging time in arid and semi-arid ecosystems of northern China is nearly 6 months. The drought accounts for >15% of monthly NPP variation in China each month. Over the whole China, the lowest impact season of droughts on monthly NPP has been found during the December–February period, but the greatest impact period has been determined in the months of May–July. Regionally, the greatest impact season for the middle of the Tibet Plateau, Yarlun-Tzanpo River valley, and the Tianshan Mountains of western China is the July–September period. While in northern China, the greatest impact month of droughts on monthly NPP is in June; this becomes May in southern China.
Data Availability Statement
The datasets analyzed in this article are not publicly available. Requests to access the datasets should be directed tobGlqaWFuZ3VvNTMxQDEyNi5jb20=.
Author Contributions
JL worked on the implementation and modeling. YW and LL worked on the data processing and language polishing.
Funding
This work was supported by the National Science Foundation of China (No. 41701371), the Ministry of Education of Humanities and Social Science project (No. 17YJCZH085), the University Science Research Project of Jiangsu Province (No. 17KJB170006), and the Priority Academic Program Development of Jiangsu Higher Education Institutions to JL. This study was supported partially by the Sussex International Development Fund and School of Global Studies’ Publication Grant awarded to YW.
Conflict of Interest
The authors declare that the research was conducted in the absence of any commercial or financial relationships that could be construed as a potential conflict of interest.
Supplementary Material
The Supplementary Material for this article can be found online at: https://www.frontiersin.org/articles/10.3389/feart.2020.00059/full#supplementary-material
Footnotes
References
Anderegg, W. R., Anderegg, L. D., and Huang, C. Y. (2019). Testing early warning metrics for drought−induced tree physiological stress and mortality. Glob. Chang. Biol. 25, 2459–2469. doi: 10.1111/gcb.14655
Anderegg, W. R., Schwalm, C., Biondi, F., Camarero, J. J., Koch, G., Litvak, M., et al. (2015). Pervasive drought legacies in forest ecosystems and their implications for carbon cycle models. Science 349, 528–532. doi: 10.1126/science.aab1833
Asrar, G., Myneni, R. B., and Choudhury, B. J. (1992). Spatial heterogeneity in vegetation canopies and remote sensing of absorbed photosynthetically active radiation: a modeling study. Remote Sens. Environ. 41, 85–103. doi: 10.1016/0034-4257(92)90070-Z
Bartier, P. M., and Keller, C. P. (1996). Multivariate interpolation to incorporate thematic surface data using inverse distance weighting (IDW). Comput. Geosci. 22, 795–799. doi: 10.1016/0098-3004(96)00021-0
Chen, C., Park, T., Wang, X., Piao, S., Xu, B., Chaturvedi, R. K., et al. (2019). China and India lead in greening of the world through land-use management. Nat. Sustain. 2, 122–129. doi: 10.1038/s41893-019-0220-7
Chen, T., Werf, G. R. V. D., Jeu, R. A. M. D., and Wang, G. (2013). A global analysis of the impact of drought on net primary productivity. Hydrol. Earth Syst. Sci. 17, 3885–3894. doi: 10.5194/hess-17-3885-2013
Chen, Z. Q., Shao, Q. Q., Liu, J. Y., and Wang, J. B. (2012). Analysis of net primary productivity of terrestrial vegetation on the Qinghai-Tibet Plateau, based on MODIS remote sensing data. Sci. China Earth Sci. 55, 1306–1312.
Chi, D., Wang, H., Li, X., Liu, H., and Li, X. (2018). Assessing the effects of grazing on variations of vegetation NPP in the Xilingol Grassland, China, using a grazing pressure index. Ecol. Indic. 88, 372–383. doi: 10.1016/j.ecolind.2018.01.051
Ding, J., Yang, T., Zhao, Y., Liu, D., Wang, X., Yao, Y., et al. (2018). Increasingly important role of atmospheric aridity on Tibetan alpine grasslands. Geophys. Res. Lett. 45, 2852–2859. doi: 10.1002/2017GL076803
Doughty, C. E., Metcalfe, D. B., Girardin, C. A., Cabrera, D. G., Huasco, W. H., Silvaespejo, J. E., et al. (2015). Drought impact on forest carbon dynamics and fluxes in Amazonia. Nature 519, 78–82. doi: 10.1038/nature14213
Eamus, D., Boulain, N., Cleverly, J., and Breshears, D. D. (2013). Global change−type drought−induced tree mortality: vapor pressure deficit is more important than temperature per se in causing decline in tree health. Ecol. Evol. 3, 2711–2729. doi: 10.1002/ece3.664
Fei, X., Song, Q., Zhang, Y., Liu, Y., Sha, L., Yu, G., et al. (2018). Carbon exchanges and their responses to temperature and precipitation in forest ecosystems in Yunnan. Sci. Total Environ. 616–617, 824–840. doi: 10.1016/j.scitotenv.2017.10.239
Gherardi, L. A., and Sala, O. E. (2019). Effect of interannual precipitation variability on dryland productivity: a global synthesis. Glob. Chang. Biol. 25, 269–276. doi: 10.1111/gcb.14480
Heyer, J. P., Power, M. J., Field, R. D., and Van Marle, M. J. (2018). The impacts of recent drought on fire, forest loss, and regional smoke emissions in lowland Bolivia. Biogeosciences 15, 4317–4331. doi: 10.5194/bg-15-4317-2018
Hou, X., Ji, L., and Wang, Z. (2014). Responses of NPP and carbon accumulation in desert steppe and typical grassland to different rainfall and land use patterns. Acta Ecol. Since 34, 6256–6264.
Huang, K., and Xia, J. (2019). High ecosystem stability of evergreen broadleaf forests under severe droughts. Glob. Chang. Biol. 25, 3494–3503. doi: 10.1111/gcb.14748
Huang, L., He, B., Chen, A., Wang, H., Liu, J., Lû, A., et al. (2016). Drought dominates the interannual variability in global terrestrial net primary production by controlling semi-arid ecosystems. Sci. Rep. 6:24639. doi: 10.1038/srep24639
Ji, L., and Peters, A. J. (2003). Assessing vegetation response to drought in the northern Great Plains using vegetation and drought indices. Remote Sens. Environ. 87, 85–98. doi: 10.1016/S0034-4257(03)00174-3
Jiang, R., He, W., Zhou, W., Hou, Y., Yang, J. Y., and He, P. (2019). Exploring management strategies to improve maize yield and nitrogen use efficiency in northeast China using the DNDC and DSSAT models. Comput. Electron. Agric. 166:104988. doi: 10.1016/j.compag.2019.104988
Jiang, X., Shen, W., and Bai, X. (2019). Response of net primary productivity to vegetation restoration in Chinese Loess Plateau during 1986-2015. PLoS One 14:e02192. doi: 10.1371/journal.pone.0219270
Kannenberg, S. A., Novick, K. A., Alexander, M. R., Maxwell, J. T., Moore, D. J., Phillips, R. P., et al. (2019). Linking drought legacy effects across scales: from leaves to tree rings to ecosystems. Glob. Chang. Biol. 25, 2978–2992. doi: 10.1111/gcb.14710
Kim, Y., Kimball, J. S., Zhang, K., and Mcdonald, K. C. (2012). Satellite detection of increasing Northern Hemisphere non-frozen seasons from 1979 to 2008: implications for regional vegetation growth. Remote Sens. Environ. 121, 472–487. doi: 10.1016/j.rse.2012.02.014
Knapp, S., and van der Heijden, M. G. (2018). A global meta-analysis of yield stability in organic and conservation agriculture. Nat. Commun.9:3632. doi: 10.1038/s41467-018-05956-1
Lai, C., Li, J., Wang, Z., Wu, X., Zeng, Z., Chen, X., et al. (2018). Drought-induced reduction in net primary productivity across mainland China from 1982 to 2015. Remote Sens. 10:1433. doi: 10.3390/rs10091433
Lee, D., and Veizer, J. (2003). Water and carbon cycles in the Mississippi River basin: potential implications for the Northern Hemisphere residual terrestrial sink. Global Biogeochem. Cycles 17, 109–124. doi: 10.1029/2002GB001984
Lei, T., Wu, J., Li, X., Geng, G., Shao, C., Zhou, H., et al. (2015). A new framework for evaluating the impacts of drought on net primary productivity of grassland. Sci. Total Environ. 536, 161–172. doi: 10.1016/j.scitotenv.2015.06.138
Lesk, C., Rowhani, P., and Ramankutty, N. (2016). Influence of extreme weather disasters on global crop production. Nature 529, 84–87. doi: 10.1038/nature16467
Li, J., Wang, Z., and Lai, C. (2019a). Severe drought events inducing large decrease of net primary productivity in mainland China during 1982–2015. Sci. Total Environ. 703:135541. doi: 10.1016/j.scitotenv.2019.135541
Li, J., Wang, Z., Lai, C., Wu, X., Zeng, Z., Chen, X., et al. (2018). Response of net primary production to land use and land cover change in mainland China since the late 1980s. Sci. Total Environ. 639, 237–247. doi: 10.1016/j.scitotenv.2018.05.155
Li, J., Zou, C., Li, Q., Xu, X., Zhao, Y., Yang, W., et al. (2019b). Effects of urbanization on productivity of terrestrial ecological systems based on linear fitting: a case study in Jiangsu, eastern China. Sci. Rep. 9:17140. doi: 10.1038/s41598-019-53789-9
Li, Z., Chen, Y., Wang, Y., and Fang, G. (2016). Dynamic changes in terrestrial net primary production and their effects on evapotranspiration. Hydrol. Earth Syst. Sci. 20, 2169–2178. doi: 10.5194/hess-20-2169-2016
Liu, M. (2001). Study on Carbon Storage and Vegetation Productivity in Chinese Terrestrial Ecosystem. Ph.D. thesis, University of Chinese Academy of Sciences, Beijing.
Liu, W. (2007). Study on Spatial and Temporal Variations of Net Primary Productivity and Carbon of Terrestrial Ecosystems in Xinjiang. Ph.D. thesis, Xinjiang University, Ürümqi.
Liu, X., and Wang, Y. (2011). Contrasting impacts of spring thermal conditions over Tibetan Plateau on late-spring to early-summer precipitation in southeast China. AtScL 12, 309–315. doi: 10.1002/asl.343
Liu, X., Pei, F., Wen, Y., Li, X., Wang, S., Wu, C., et al. (2019). Global urban expansion offsets climate-driven increases in terrestrial net primary productivity. Nat. Commun. 10:5558. doi: 10.1038/s41467-019-13462-1
Liu, Y., Ju, W., He, H., Wang, S., Sun, R., and Zhang, Y. (2013). Changes of net primary productivity in China during recent 11 years detected using an ecological model driven by MODIS data. Front. Earth Sci. 7:112–127. doi: 10.1007/s11707-012-0348-5
Liu, Y., Wang, J., and Guo, L. (2009). Temporal and spatial dynamics of grain production and cultivated land change in China. Sci. Agric. Sin. 42, 4269–4274. doi: 10.3864/j.issn.0578-1752.2009.12.018
Luo, X., Croft, H., Chen, J. M., He, L., and Keenan, T. F. (2019). Improved estimates of global terrestrial photosynthesis using information on leaf chlorophyll content. Glob. Chang. Biol. 25, 2499–2514. doi: 10.1111/gcb.14624
Mk, V. D. M., Dolman, A. J., Ciais, P., Eglin, T., Gobron, N., Law, B. E., et al. (2011). Drought and ecosystem carbon cycling. Agric. For. Meteorol. 151, 765–773. doi: 10.1016/j.agrformet.2011.01.018
Pei, F., Li, X., Liu, X., and Lao, C. (2013). Assessing the impacts of droughts on net primary productivity in China. J. Environ. Manage. 114, 362–371. doi: 10.1016/j.jenvman.2012.10.031
Peng, D., Wu, C., Zhang, B., Huete, A., Zhang, X., Sun, R., et al. (2016). The influences of drought and land-cover conversion on inter-annual variation of NPP in the Three-North Shelterbelt Program zone of China based on MODIS data. PLoS One 11:e0158173. doi: 10.1371/journal.pone.0158173
Peng, H., Cheng, G., Xu, Z., Yin, Y., and Xu, W. (2007). Social, economic, and ecological impacts of the “Grain for Green” project in China: a preliminary case in Zhangye. J. Environ. Manage. 85, 774–784. doi: 10.1016/j.jenvman.2006.09.015
Persson, M., Moberg, J., Ostwald, M., and Xu, J. (2013). Chinese Grain for Green programme: assessing the carbon sequestered via land reform. J. Environ. Manage. 126, 142–146. doi: 10.1016/j.jenvman.2013.02.045
Piao, S., Fang, J., Zhou, L., Zhu, B., Tan, K., and Tao, S. (2005). Changes in vegetation net primary productivity from 1982 to 1999 in China. Glob. Biogeochem. Cycles 19, 1605–1622. doi: 10.1029/2004GB002274
Piao, S., Friedlingstein, P., Ciais, P., Viovy, N., and Demarty, J. (2007). Growing season extension and its impact on terrestrial carbon cycle in the Northern Hemisphere over the past 2 decades. Glob. Biogeochem. Cycles 21, 1148–1154. doi: 10.1029/2006GB002888
Piao, S., Liu, Q., Chen, A., Janssens, I. A., Fu, Y., Dai, J., et al. (2019). Plant phenology and global climate change: current progresses and challenges. Glob. Chang. Biol. 25, 1922–1940. doi: 10.1111/gcb.14619
Piao, S., Wang, X., Park, T., Chen, C., Lian, X., He, Y., et al. (2020). Characteristics, drivers and feedbacks of global greening. Nat. Rev. Earth Environ. 1, 14–27. doi: 10.1038/s43017-019-0001-x
Ruimy, A., Saugier, B., and Dedieu, G. (1994). Methodology for the estimation of terrestrial net primary production from remotely sensed data. J. Geophys. Res. Atmos. 99, 5263–5283. doi: 10.1029/93JD03221
Shang, E., Xu, E., Zhang, H., and Liu, F. (2018). Analysis of spatiotemporal dynamics of the Chinese vegetation net primary productivity from the 1960s to the 2000s. Remote Sens. 10:860. doi: 10.3390/rs10060860
Su, B., Huang, J., Fischer, T., Wang, Y., Kundzewicz, Z. W., and Zhai, J., et al., (2018). Drought losses in China might double between the 1.5 °C and 2.0 °C warming. PNAS 115, 10600–10605. doi: 10.1073/pnas.1802129115
Tan, S., Zhu, M., Zhang, K., Dang, H., and Zhang, Q. (2009). Response and adaptation of plants to submergence stress. Chin. J. Ecol. 28, 1871–1877.
Tao, B., Li, K., Shao, X., and Cao, M. (2003). The spatio-temporal characteristics of the net primary productivity based on the simulation in china. Acta Geogr. Sin. 58, 372–380.
Tucker, C., Pinzon, J., and Brown, M. (2004). Global Inventory Modeling and Mapping Studies. College Park, MD: Global Land Cover Facility.
Vicenteserrano, S. M., Gouveia, C., Camarero, J. J., Beguería, S., Trigo, R., Lópezmoreno, J. I., et al. (2013). Response of vegetation to drought time-scales across global land biomes. Proc. Natl. Acad. Sci. U.S.A. 110, 52–57. doi: 10.1073/pnas.1207068110
Vicente−Serrano, S. M., Camarero, J. J., and Azorin−Molina, C. (2015). Diverse responses of forest growth to drought time−scales in the Northern Hemisphere. Glob. Ecol. Biogeogr. 23, 1019–1030. doi: 10.1111/geb.1218
Wu, D., Zhao, X., Liang, S., Zhou, T., Huang, K., Tang, B., et al. (2015). Time−lag effects of global vegetation responses to climate change. Glob. Chang. Biol. 21, 3520–3531. doi: 10.1111/gcb.12945
Xiao, J., Zhuang, Q., Liang, E., Mcguire, A. D., Moody, A., Kicklighter, D. W., et al. (2009). Twentieth-Century droughts and their impacts on terrestrial carbon cycling in China. Earth Interact. 13, 1–31. doi: 10.1175/2009EI275.1
Xu, B., Arain, M. A., Black, T. A., Law, B. E., Pastorello, G. Z., and Chu, H. (2019). Seasonal variability of forest sensitivity to heat and drought stresses: a synthesis based on carbon fluxes from North American forest ecosystems. Glob. Chang. Biol. 26, 901–918. doi: 10.1111/gcb.14843
Xu, X., Yang, G., Tan, Y., Tang, X., Jiang, H., Sun, X., et al. (2017). Impacts of land use changes on net ecosystem production in the Taihu Lake Basin of China from 1985 to 2010. J. Geophys. Res. Biogeosci. 122, 690–707. doi: 10.1002/2016JG003444
Yang, S., Meng, D., Li, X., and Wu, X. (2018). Multi-timescale responses of vegetation to SPEI in north China from 2001 to 2014. Acta Ecol. Sin. 38, 1028–1039.
Yu, D., Zhu, W., and Pan, Y. (2007). The role of atmospheric circulation system playing in coupling relationship between spring NPP and precipitation in East Asia area. Environ. Monit. Assess. 145, 135–143. doi: 10.1007/s10661-007-0023-6
Yuan, Q., Wu, S., Zhao, D., Dai, E., Li, C., and Lei, Z. (2014). Modeling net primary productivity of the terrestrial ecosystem in China from 1961 to 2005. J. Geogr. Sci. 24, 3–17. doi: 10.1007/s11442-014-1069-3
Zarei, A. R., and Eslamian, S. (2017). Trend assessment of precipitation and drought index (SPI) using parametric and non-parametric trend analysis methods (case study: Arid regions of southern Iran). Int. J. Hydrol. Sci. Technol. 7, 12–38. doi: 10.1504/IJHST.2017.080957
Zeng, Z., Piao, S., Li, L. Z., Wang, T., Ciais, P., Lian, X., et al. (2018). Impact of Earth greening on the terrestrial water cycle. J. Clim. 31, 2633–2650. doi: 10.1175/JCLI-D-17-0236.1
Zhang, C., and Yang, C. (2007). Comparison of growth dynamics of several different plants in typical steppe of Inner Mongolia of China. Chin. J. Ecol. 26, 1712–1718.
Zhao, M., and Running, S. W. (2010). Drought-induced reduction in global terrestrial net primary production from 2000 through 2009. Science 329, 940–943. doi: 10.1126/science.1192666
Zhu, W., Pan, Y., He, H., Yu, D., and Hu, H. (2006). Simulation of maximum light use efficiency for some typical vegetation types in China. Chin. Sci. Bull. 51, 457–463. doi: 10.1007/s11434-006-0457-1
Keywords: terrestrial ecosystem productivity, the Chinese NPP trends, SPI/SPEI drought indices, the lagging responses of Chinese NPP to droughts, ecological effect
Citation: Li J, Wang Y and Liu L (2020) Responses of the Terrestrial Ecosystem Productivity to Droughts in China. Front. Earth Sci. 8:59. doi: 10.3389/feart.2020.00059
Received: 29 November 2019; Accepted: 19 February 2020;
Published: 17 March 2020.
Edited by:
Flavio Cannavò, National Institute of Geophysics and Volcanology, ItalyReviewed by:
Chengguang Lai, South China University of Technology, ChinaMei Huang, Institute of Geographic Sciences and Natural Resources Research (CAS), China
Copyright © 2020 Li, Wang and Liu. This is an open-access article distributed under the terms of the Creative Commons Attribution License (CC BY). The use, distribution or reproduction in other forums is permitted, provided the original author(s) and the copyright owner(s) are credited and that the original publication in this journal is cited, in accordance with accepted academic practice. No use, distribution or reproduction is permitted which does not comply with these terms.
*Correspondence: Jianguo Li, bGlqaWFuZ3VvQGpzbnUuZWR1LmNu; bGlqaWFuZ3VvNTMxQDEyNi5jb20=; Yi Wang, WWkuV2FuZ0BzdXNzZXguYWMudWs=
†These authors have contributed equally to this work