 Tiequan Zhang
 Yutao Wang
 Chin S. Tan
- Harrow Research and Development Center, Agriculture and Agri-Food Canada, Harrow, ON, Canada
Legacy phosphorus (P) in agricultural soils has become a predominate source contributing to P loadings to Lake Erie since the mid-90s. The use of legacy P in soils can be an ultimate and effective way to mitigate the risk of agricultural P loss and to circumvent potential P rock reserve shortage, while sustaining crop production. A field experiment was conducted to assess the impacts of P draw-down (PDD) (i.e., use of legacy P in soils) on crop yields, P uptake and removal, and soil test P (Olsen P, an agronomic P calibration and environmental soil P risk indicator in the region) under a corn–soybean rotation in a clay loam soil of the Lake Erie Basin, southwestern Ontario, Canada, from 2008 to 2018. Corn and soybean grain yields with PDD were identical to those with continuous P addition (CPA), averaged at 7.7 Mg ha–1 for corn and 3.7 Mg ha–1 for soybean, over 11 years. Similarly, no significant differences in crop P uptake and removal were found between PDD and CPA. Compared to CPA, PDD increased net farming income by Canadian dollar (CAD) 104–125 ha–1 year–1 (i.e., USD 78.5–94.4 ha–1 year–1), with savings on P fertilizer materials and associated application costs. Soil P loss risks with PDD reduced, as indicated by soil test P that, in the top layer (0–15 cm), decreased linearly with crop production year at 3.27 mg P kg–1 year–1 or 16.2 mg P kg–1 per 100 kg crop P removal per hectare, while in the lower soil layers, 15–90 cm, it remained unchanged. In comparison, CPA of 50 kg P ha–1 sustained soil test P in the entire soil profile, 0–90 cm, over the 11-year period. PDD can be a beneficial management practice utilizing legacy P in soils to achieve both agronomic and economic goals in an environmentally sustainable manner.
Introduction
Chemical fertilizer phosphorus (P) application often exceeds plant requirements, resulting in P accumulation in soils where it shows a strong affinity for the solid phase (Menezes-Blackburn et al., 2018). Manure application, commonly based on the N requirements for crop growth, also frequently results in the over-application of P due to the discrepancy in the N/P ratio between manure and field crop biomass. Across the world, long-term continuous applications of P have led to an agronomic surplus of 11.5 Tg P year–1, most of which accumulates in agricultural soils as legacy P, leading to high soil test P (STP) and contributing to accelerated P losses and the eutrophication of surface water (MacDonald et al., 2011; Sharpley et al., 2013). Such a large amount of legacy P has become one of the major reasons causing the failure of conservation measures to deliver improvements in water quality in the last few decades (Sharpley et al., 2013). To address soil legacy P, one simple practice is to draw-down soil P concentration by halting P application until the potential for P loss decreases to an environmentally acceptable level (Dodd et al., 2012). However, two questions remain to be answered before adopting the P draw-down (PDD) approach to manage high-P soils. One is whether halting P applications impairs crop yield and farmers’ profitability. The other is whether an environmentally acceptable soil test P level will be achieved in a reasonable or desired time frame (Dodd et al., 2012).
Applied P in soils, if not used by crops, is predominately in labile forms physically absorbing to soil particles and/or in moderately labile forms chemically absorbing to Fe and Al oxides, which are reversible through desorption and can be bioavailable to crops (Zhang and Mackenzie, 1997a, b; Zhang et al., 2004). For high-STP soils, legacy P can generally support adequate crop yields without further P application on certain soils for periods of 10 years or more (Rowe et al., 2016). For example, legacy P from a 28-year buildup was sufficient for 15 years of wheat cultivation without a significant decline in crop yield (Liu et al., 2015). Syers et al. (2008) further pointed out that up to 90% of P applied as fertilizer and manure can eventually be accessed by crops as stable forms of P break down into labile forms. These findings would confirm the agronomic feasibility of using legacy P to support crop growth in a way of reducing or ceasing P fertilization.
The risk of soil P loss is positively related to STP concentration (Wang et al., 2010). Under Ontario conditions, for example, soils with Olsen P < 30 mg kg–1 had an insignificant risk of soluble soil P loss in runoff water, while the P loss risk potential of those soils having Olsen P > 30 mg kg–1 increased quickly with increasing Olsen P concentrations (Wang et al., 2012, 2015). Halting P application often results in a decline in STP due to the removal of P by crops and through loss by runoff or erosion (Zhang et al., 2004; McDowell et al., 2016; Cade-Menun et al., 2017; Fiorellino et al., 2017). However, this decline is often slow, and it may be on the order of decades before environmentally acceptable STP levels are reached (Sharpley et al., 2013). McCollum (1991) found that without P application, it took 16–18 years to decrease STP (Mehlich-1 P) from 99 to 20 mg kg–1 under corn and soybean production. In North Central Iowa, Webb et al. (1992) reported that corn and soybean P removal decreased STP (Bray-1 P) from 75 to 10–15 mg P kg–1 after 15 years of zero P application. Zhang et al. (2004) noted that, for a field with an initial STP (Mehlich-3) of 55 mg P kg–1, no significant reduction in STP occurred in the 4 years after halting P application; however, for a soil with an initial STP of up to 130 mg kg–1, corn removal decreased the STP concentration at the rate of 3.9 mg P kg–1 year–1. Generally, the rate of STP decline is related to farming P output, soil mineralogy, and the initial STP concentration (Dodd et al., 2012).
Elevated legacy P in surface soils contributes to the recently increased dissolved P loss and harmful algal blooms observed in Lake Eire (Daloğlu et al., 2012; King et al., 2017). In Ontario, calculated based on IPNI (2015), over 60% of agricultural soils have Olsen P > 30 mg kg–1, where soil P loss may pose an environmental concern (Wang et al., 2012; Reid et al., 2019). Unfortunately, PDD is rarely studied in the Lake Erie drainage basin, and thus, its potential as a beneficial management practice (BMP) for managing high-P soils is unknown. The objectives of this study were to investigate the effects of long-term PDD on (1) crop yields and farmers’ production profitability and (2) the risk potential of soil P loss in runoff water, indicated by the STP concentration, in comparison with continuous inorganic fertilizer P application (CPA).
Materials and Methods
Experimental Site and Design
The experiment was conducted at the Honorable Eugene F. Whelan Experimental Farm, Woodslee, Ontario, Canada (42°13′ N, 82°44′ W), from 2008 to 2018. The soil at the site is a Brookston clay loam, classified as a fine-loamy, mixed, mesic, Typic Argiaquoll (Soil Survey Staff, 1999) or as Orthic Humic Gleysol (Soil Classification Working Group, 1998). The soil contained 280 g kg–1 sand, 350 g kg–1 silt, and 370 g kg–1 clay in the Ap horizon. The climate is humid and temperate, with a mean annual precipitation of 838 mm (Zhang et al., 2015). In the study, two tested treatments included a continuous P application (CPA) and a P draw-down (PDD), which were arranged in a randomized complete block design with two replicates. Each plot was 15 m wide by 67 m long, 0.1005 ha.
Treatment Implementation and Agronomic Management
The cropping system at the field site was a corn–soybean rotation, with fertilizer application occurring only in the corn years (i.e., 2008, 2010, 2012, 2014, 2016, and 2018). At the beginning of the study, soil Olsen P (i.e., an agronomic P calibration and environmental soil P risk indicator in the region) was greater in the soil of the PDD plots than that in the CPA plots (Figure 4). For the CPA treatment, triple super phosphate was applied at 50 kg P ha–1, while fertilizer N as NH4NO3 and K as KCl were applied to both CPA and PDD treatments at 200 kg N ha–1 and 100 kg K ha–1, respectively. Pesticides and herbicides were applied in consequence of the season’s prevalent pests at rates which were determined based on local recommendations. Where applicable, the nutrients (i.e., N, K, and/or P) were pre-planting broadcast to the corn phase of the rotation in the spring and incorporated immediately or once weather conditions were permissible by disking, triple-K, and packing. Shortly after harvest in the fall, the plots were harrowed to about 15-cm depth with a chisel plow. The dates for performing fertilizer application, seed planting, and crop harvesting are presented in Table 1. Corn and soybean were seeded at the local recommended rates of 76,800 and 486,700 seeds ha–1, respectively.
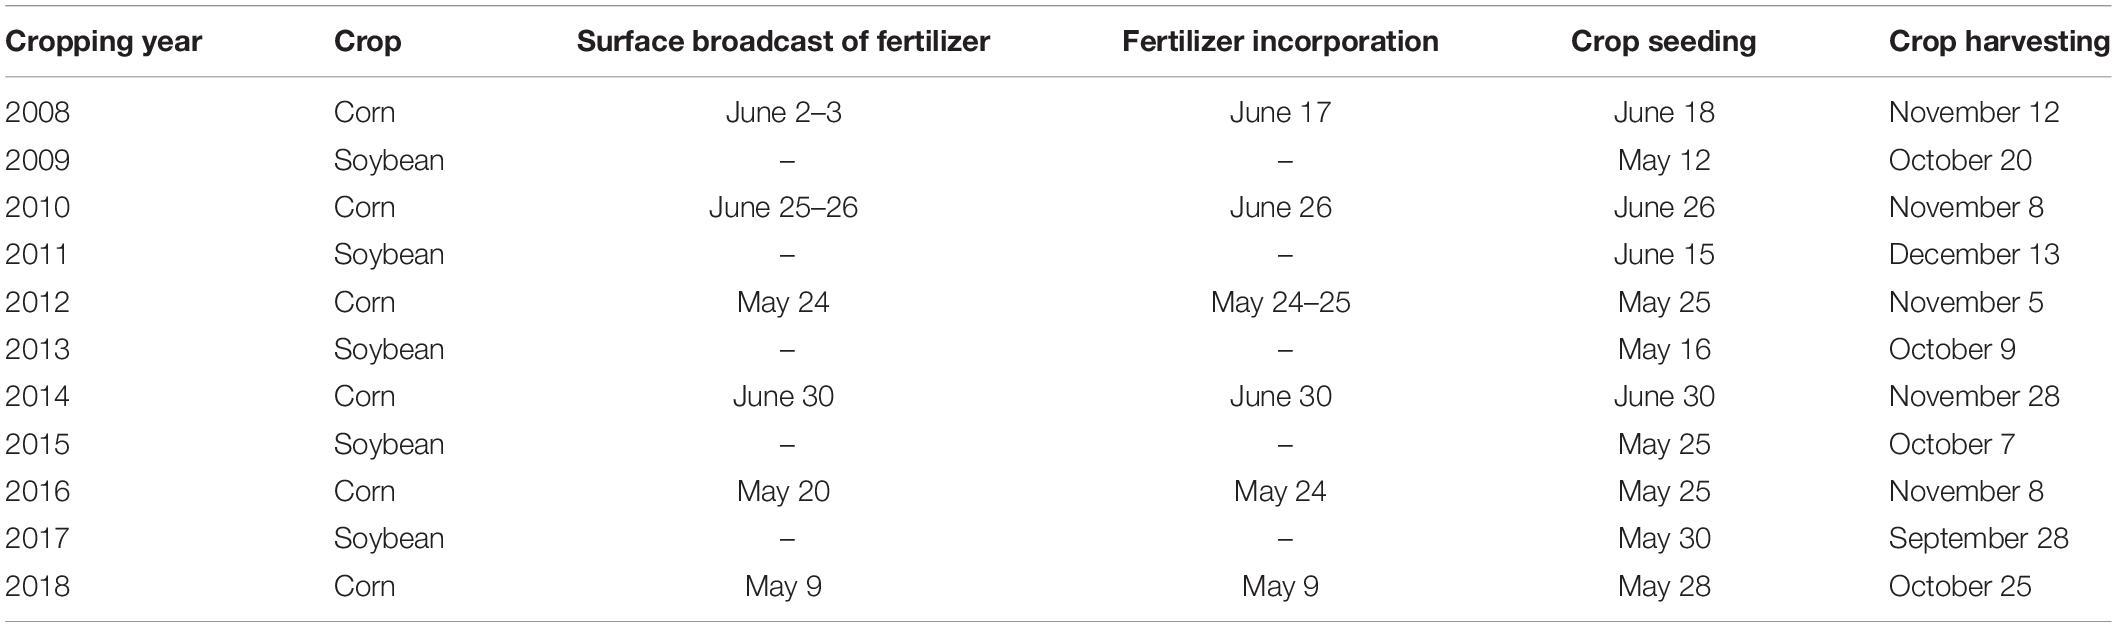
Table 1. Agronomic practices of the study site, 2008–2018.
Sample Collection and Analysis
The grain yields of corn and soybean were determined by harvesting the central 12 and 36 rows, respectively, from a total of 20 and 40 rows in each plot. The grain moisture content was determined using a Grain Analyzer (GAC2100, Dickey-John, Crop., Cornwall, ON, Canada). Stover biomass yields of corn were determined by randomly harvesting the aboveground portion of 16 plants in each plot, while soybean biomass yields were determined by randomly harvesting the aboveground portion of soybean plants of six 35-cm-long sections of row in each plot. The grain and stover samples were dried at 55°C, and then ground to pass through a 1-mm sieve. The ground plant samples were digested using the H2SO4–H2O2 procedure (Thomas et al., 1967), with the P concentrations determined using a flow injection autoanalyzer (QuikChem FIA + 8000 series, Lachat Instruments, Loveland, CO, United States) with the ammonium molybdate ascorbic acid reduction method of Murphy and Riley (1962). Grain P removal was calculated by multiplying the grain yield with the P concentration. Crop total P uptake was the P contained in all aboveground biomass and grains.
Composite soil samples were collected at 0- to 15-cm soil depth shortly after harvest each year from 2008 to 2018 to determine the temporal patterns of soil test P. In order to evaluate the treatment effects on the downward movement of P in the soil profile over the study period, soils were also sampled at depths of 0–15, 15–30, 3–50, 50–70, and 70–90 cm in 2009 and 2016, respectively. All soil samples were air-dried and passed through a 2-mm sieve for chemical analysis. Soil test P was determined using the Olsen method, which has been the test regionally recommended for both agronomic calibration and environmental soil P loss risk indication (OMAFRA, 2017). Soil Olsen P concentration was measured by shaking 2.5 g soil in 50 ml of 0.5M NaHCO3 (pH 8.5) solution for 30 min (Schoenau and O’Halloran, 2008). The determinations for P were conducted using a Flow Injection Auto-Analyzer (QuikChemFIA + 8000 series, Lachat Instruments, Loveland, CO, United States) with the ammonium molybdate ascorbic acid reduction method of Murphy and Riley (1962).
Economic Analysis
In the study, corn and soybean grain yields were largely identical between PDD and CPA, as discussed in Section “Results.” Compared to CPA, therefore, the economic benefit of PDD was gained by saving on fertilizer P and the associated application costs. The annual economic benefit (Y) of PDD was calculated as follows:
where i represents corn crop year (i.e., 2008, 2010, 2012, 2014, 2016, and 2018), when fertilizer applications occurred in the current study. Because no fertilizer was applied in the soybean year of the rotation, the annual economic benefit of PDD was calculated by dividing the summed P fertilizer and associated application costs saved for the PDD treatment in each corn year by 2. In the CPA plots, fertilizer P was applied at the rate of 50 kg ha–1 in the corn year. The prices for inorganic P fertilizer (i.e., triple superphosphate in the current study) were CAD 1,072, 670, 849, 758, 811, and 833 in 2008, 2010, 2012, 2014, 2016, and 2018, respectively, which were collected by Ridgetown Campus (2008–2018), University of Guelph, in the survey conducted for “Ontario Farm Input Monitoring Project.” Based on the Survey for the Ontario Custom Farmwork Rates charged in 2015 and 2018 (OMAFRA, 2016, 2019b) and 2019 Field Crop Budgets (OMAFRA, 2019a), the associated fertilizer application costs were CAD 8, 9, 10, and 11 per acre in 2012, 2015, 2018, and 2019, respectively. According to the temporal trend of fertilizer application costs, we assumed that the fertilizer application costs were CAD 7.0, 7.5, 8.0, 9.0, 9.5, and 10.0 in 2008, 2010, 2012, 2014, 2016, and 2018, respectively. In Ontario, some farmers may apply fertilizer in a band beside and below the seed in the case of row crops or with the seed of cereals. Banding requires fertilizer boxes and metering systems on the planter or drill and an extra opener on planters to place the fertilizer into the soil. In this case, we assume that there is no extra cost for fertilizer application in addition to the planting cost. In the study, therefore, we calculated the economic benefit of PDD under two scenarios. One is that the economic benefit is gained by saving on both the P fertilizer and associated fertilizer application costs when fertilizer application and planting are performed separately. The other is that the economic benefit is gained by saving on P fertilizer only when the fertilizer is applied together with planting.
Data Analyses
Under PDD conditions, P uptake by crops not only comes from the plant-available P pool, which is Olsen solution extractable, in the soil but also may come from the biogeochemical conversion of soil P originally not plant available to plant-available P (Fiorellino et al., 2017). In the current study, the percentage (Y) of crop P removal deriving from the conversion of soil P originally not plant available extracted by the Olsen P extractant to the total crop P removal will be calculated as follows:
where total P removal is the amount of P removed out of the field by the harvested crop grain between 2008 and 2018 under PDD; Olsen P decline is the difference in the soil Olsen P concentration between 2008 (i.e., the start of PDD) and 2018 (i.e., the end of PDD) under PDD; 0–15 cm soil weight is the total soil mass in the depth in a 1-ha area, where the soil bulk density was 1.2 g cm–3.
All statistical analyses were performed using SAS (SAS Institute, 2009). Significances of the differences in crop yield and P removal and uptake between PDD and CPA were tested with analysis of variance using the general linear model (GLM) procedure. Linear regression analysis between the soil Olsen P concentration and the cropping year was performed using the REG procedure.
Results
Crop Yield and P Uptake and Removal
Corn grain yields with PDD were largely identical to those with CPA over the 11-year period from 2008 to 2018, with an average yield of 7.7 Mg ha–1 (Figure 1). Similarly, soybean grain yields were also similar between PDD and CPA, with the exception of 2009 and 2011, in which PDD treatment had a slightly lower (i.e., 6% in 2009 and 8% in 2011) grain yield compared to CPA. From 2008 through 2018, the average soybean grain yield was 3.7 Mg ha–1 across both CPA and PDD treatments (Figure 1). Regarding crop stover yields, they were similar between PDD and CPA treatments from 2008 through 2018 (Table 2).
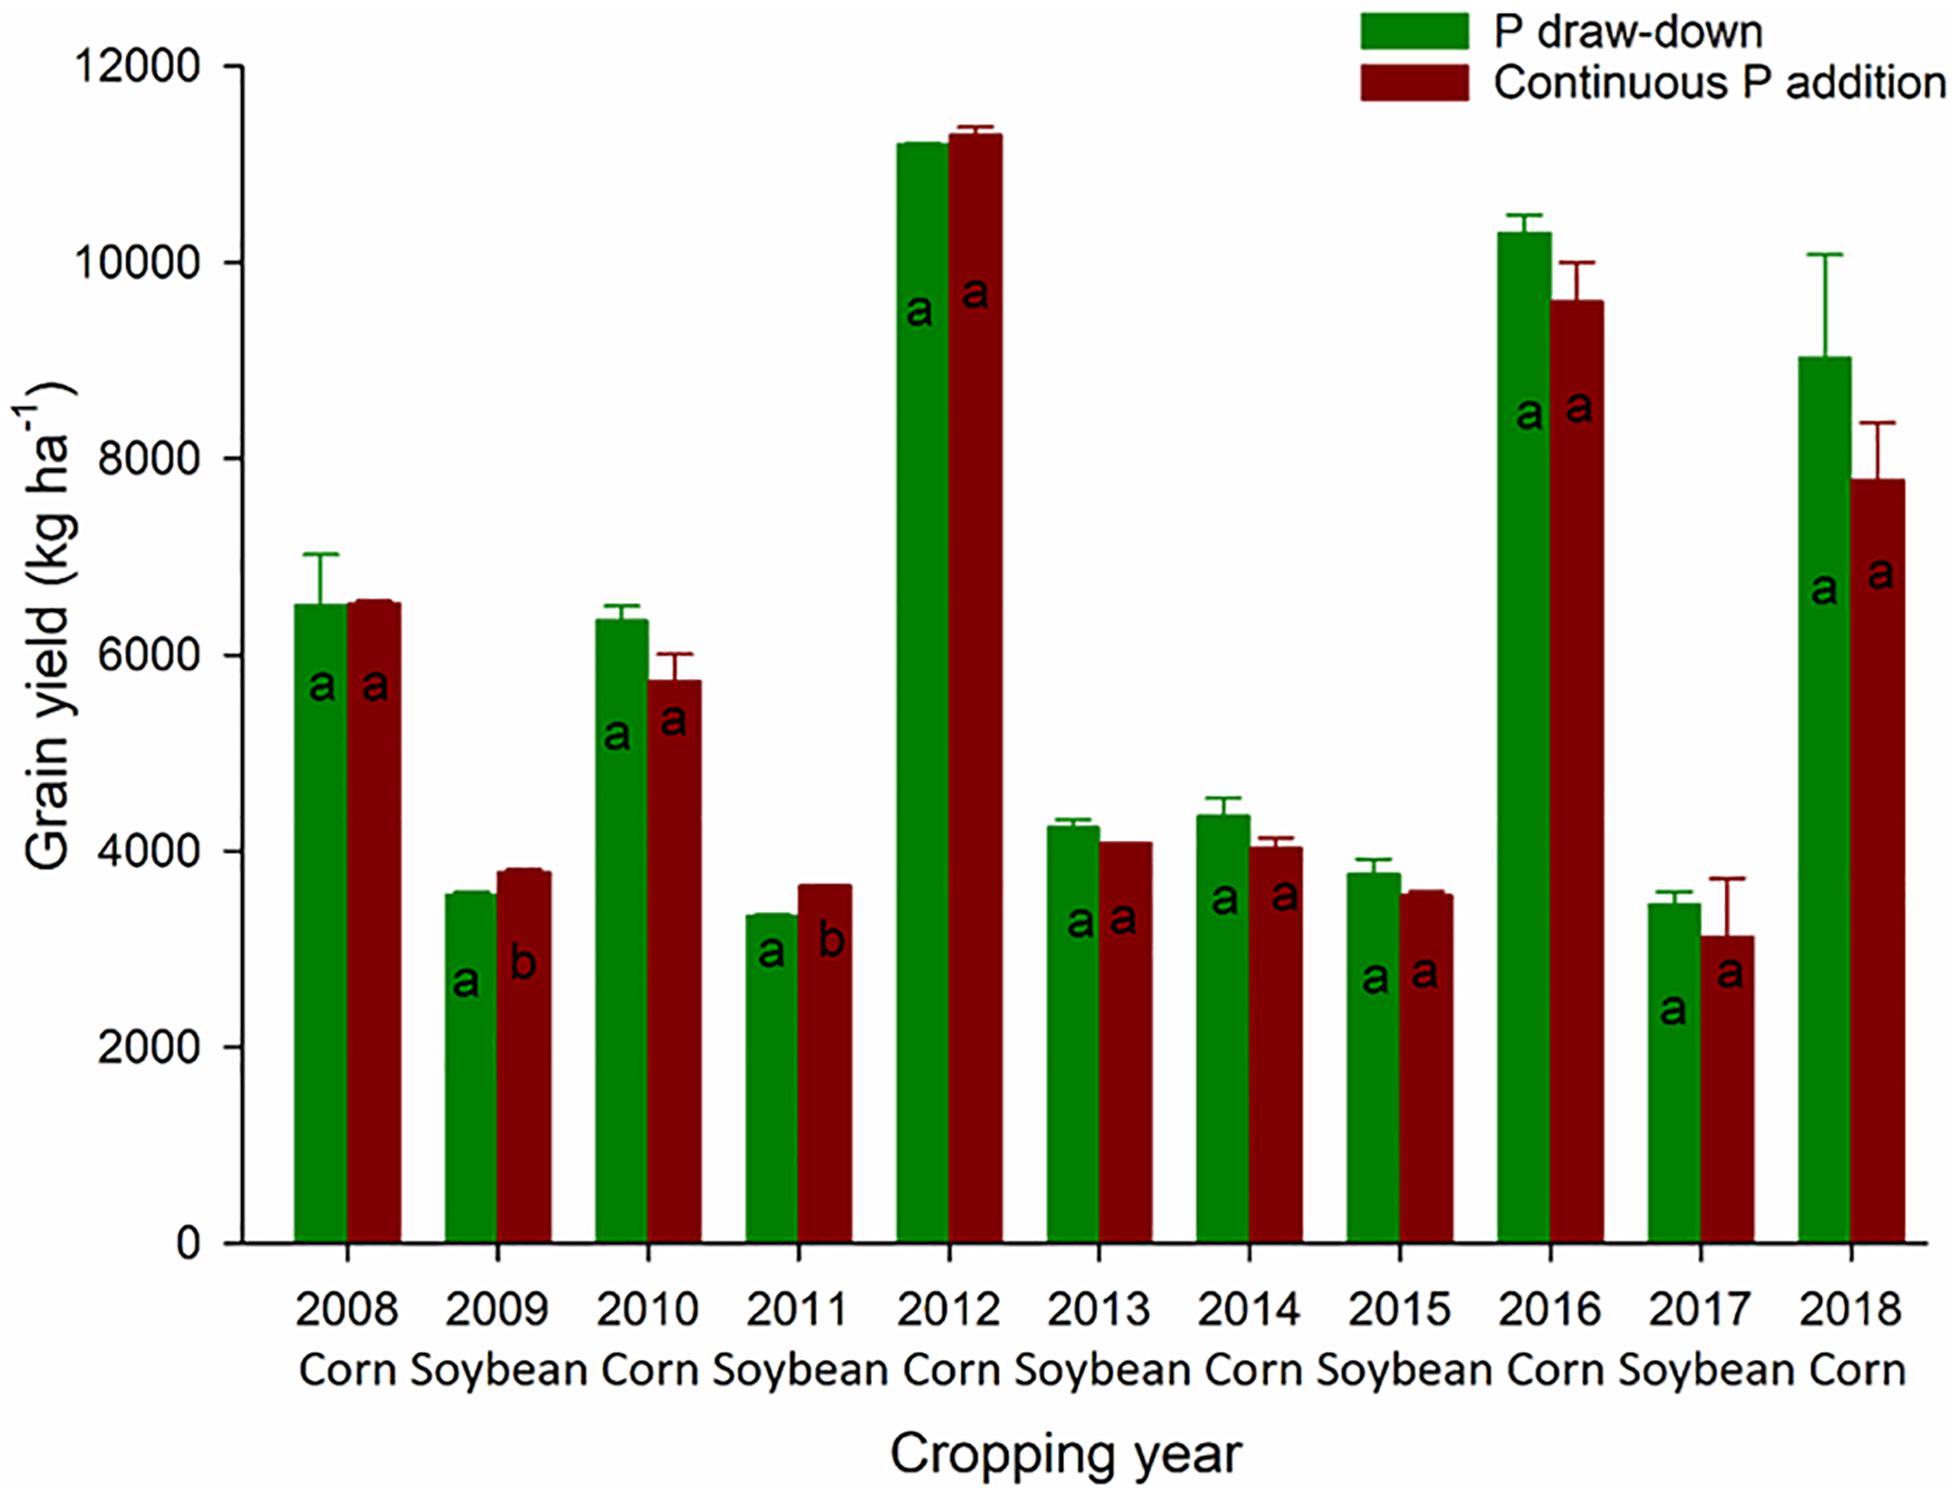
Figure 1. Corn (2008, 2010, 2012, 2014, 2016, and 2018) and soybean (2009, 2011, 2013, 2015, and 2017) grain yields with continuous fertilizer P addition and soil P draw-down. Bars (means) labeled with the same lowercase letter above each year are not significantly different at P ≤ 0.05 levels. The vertical T-bars are standard errors (n = 2).
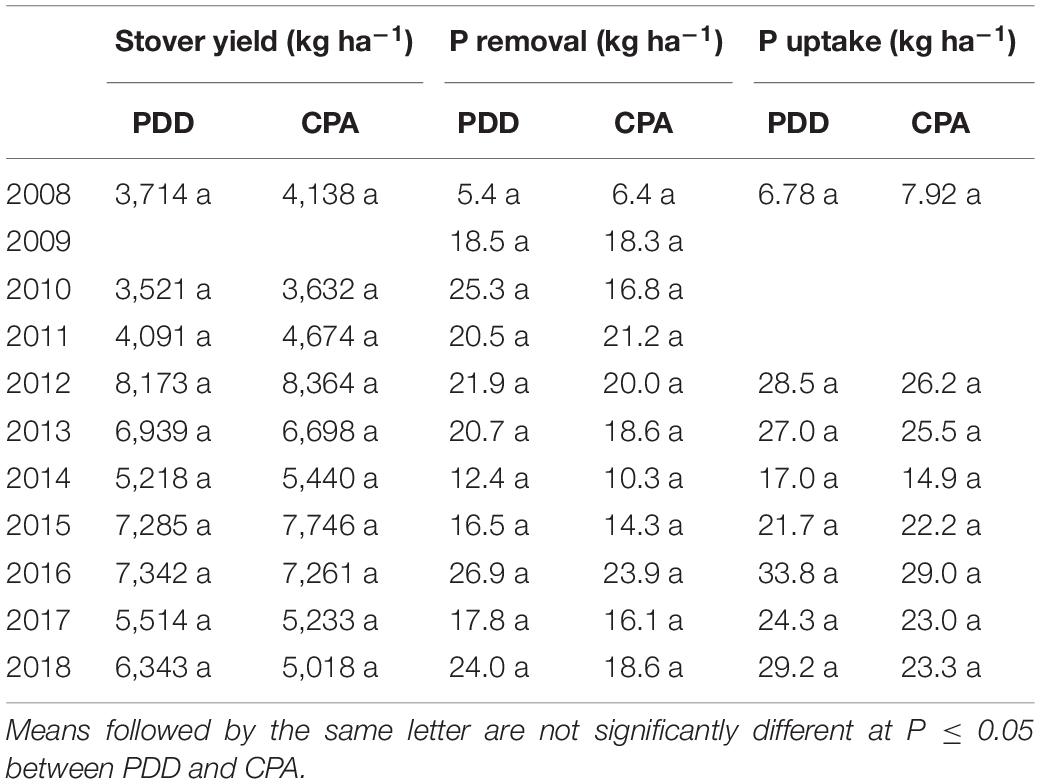
Table 2. Corn (2008, 2010, 2012, 2014, 2016, and 2018) and soybean (2009, 2011, 2013, 2015, and 2017) stover yields, P removal (i.e., P contained in grain), and uptake (i.e., P contained in all aboveground biomass and grains) with continuous fertilizer P addition (CPA) and soil P draw-down (PDD).
Crop P uptake and removal were also similar between the CPA and PDD treatments in the study (Table 2). From 2008 through 2018, the average P uptakes of corn and soybean were 21.7 and 23.9 kg ha–1, respectively, with average P removals of 17.6 and 18.3 kg ha–1, respectively.
Economical Benefit of PDD
Because corn and soybean grain yields were largely similar between PDD and CPA, PDD practice obviously generated more economic benefits than did CPA by saving on fertilizer P and the associated application costs. Compared to CPA, PDD increased the net farming income by CAD 104 (i.e., USD 78.5) per hectare per year by saving on fertilizer P only, or up to CAD 125 (i.e., USD 94.4) per hectare per year by saving on both fertilizer P and the associated application costs from 2008 through 2018 (Figure 2).
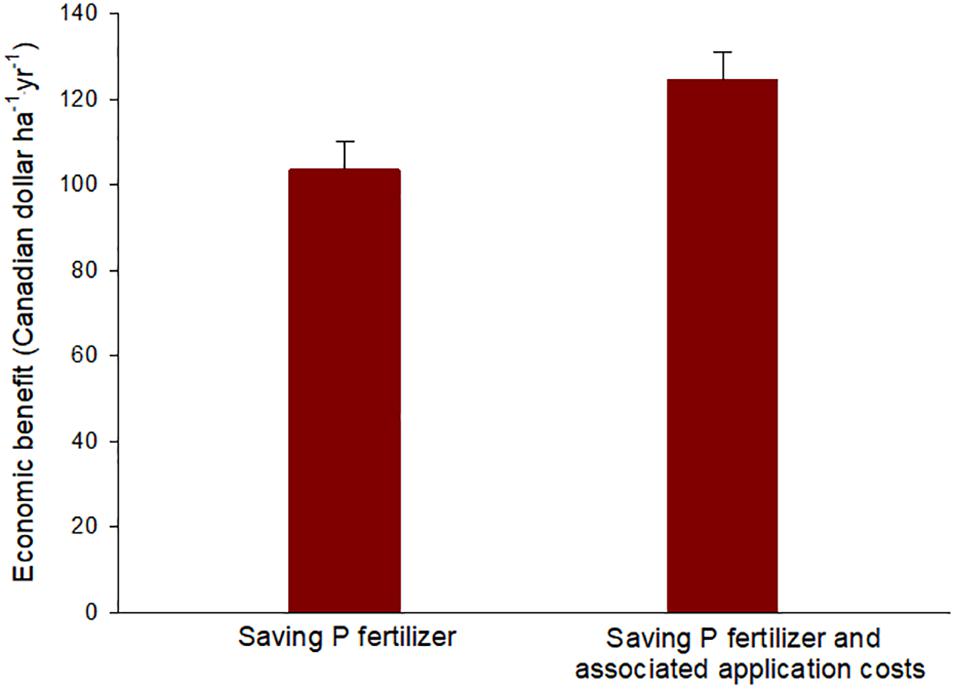
Figure 2. Estimated annual economic benefit with continuous P draw-down under two scenarios: (1) economic benefit was gained by saving on P fertilizer only when the fertilizer was applied together with planting, and (2) economic benefit was gained by saving on both P fertilizer and associated fertilizer application costs when the fertilizer application and planting were separately performed. The vertical T-bars are standard errors (n = 6).
Soil Profile Distribution of Soil Test P
For both treatments of PDD and CPA, the soil Olsen P concentrations decreased with depth up to 50 cm below the ground and remained very low below 50 cm (Figure 3). The differences between PDD and CPA were obvious: at 0- to 15-cm soil, Olsen P concentrations were significantly lower in 2016 than those in 2009 under PDD, while under CPA, no significant differences in Olsen P concentrations were observed between 2009 and 2016. For the soil depths below 15 cm, Olsen P concentrations were similar between 2009 and 2016 for both tested treatments.
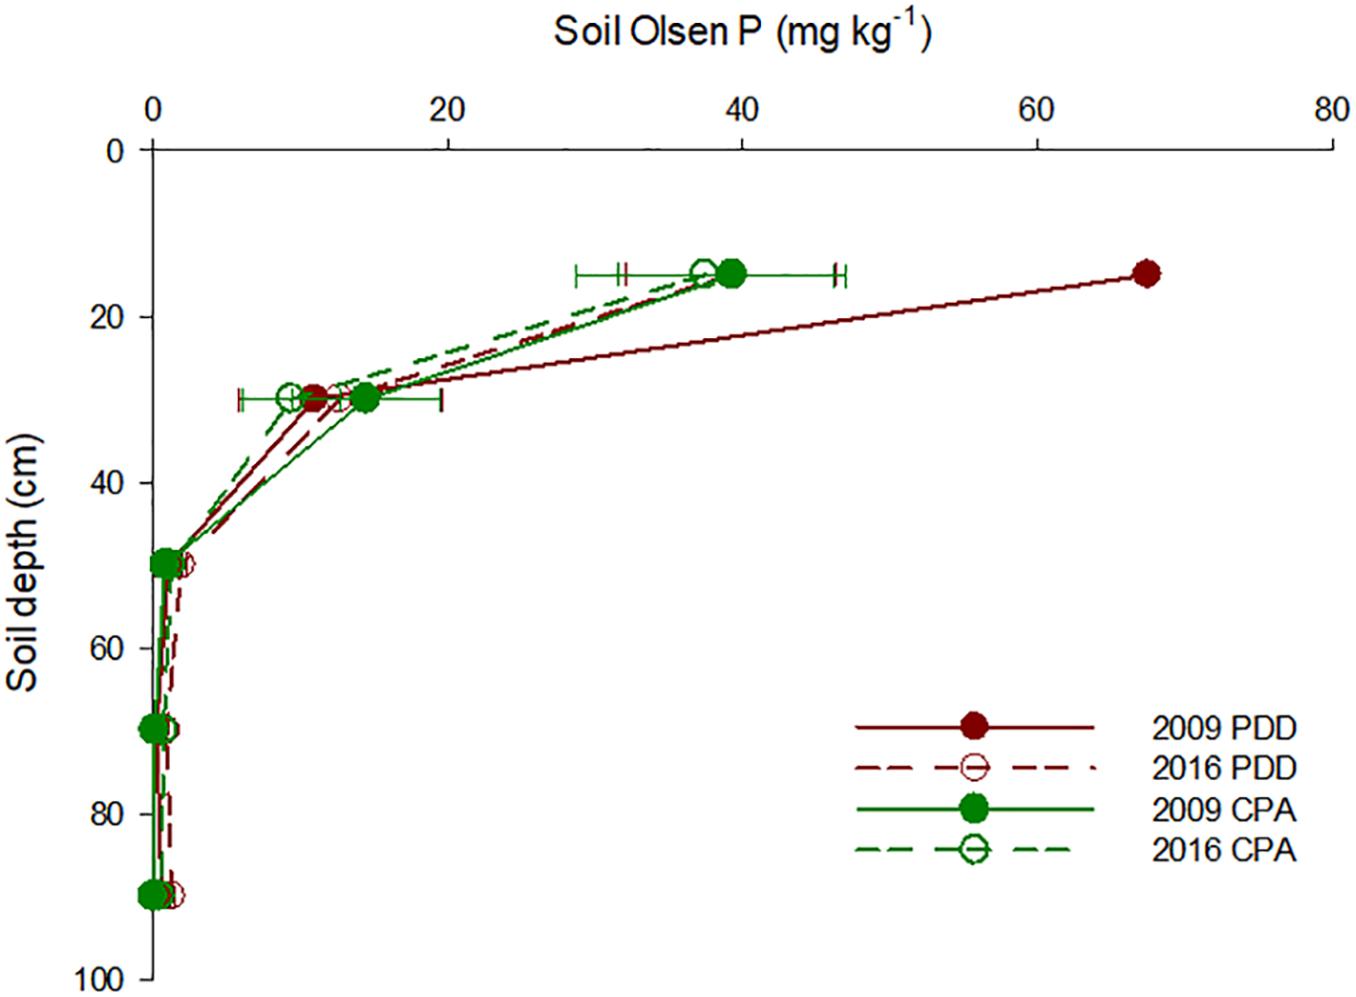
Figure 3. Soil Olsen P concentrations in the profile of the soil managed under continuous fertilizer P additions (CPA) and soil P draw-down (PDD) between 2009 and 2016. The horizontal T-bars are standard errors (n = 2).
Temporal Change of Soil Test P
In order to quantify temporal changes in soil test P under PDD and CPA, regression analyses were conducted for Olsen P in the surface 0- to 15-cm soil layer against the cropping years (Figure 4A). Between 2008 and 2018, the soil Olsen P concentration with PDD decreased linearly with crop production year at a rate of 3.27 mg kg–1 year–1. Overall, soil PDD caused a soil Olsen P decline of 32.7 mg kg–1 between 2008 and 2018 in the current study. Meanwhile, the soil Olsen P concentration of the 0- to 15-cm soil was also linearly related to cumulative crop P removal, with 6.2 kg P removal per hectare required to decrease soil Olsen P by 1 mg kg–1 (Figure 4B). In the current study, 50 kg P ha–1 application maintained soil Olsen P over the 11-year period (Figure 4A).
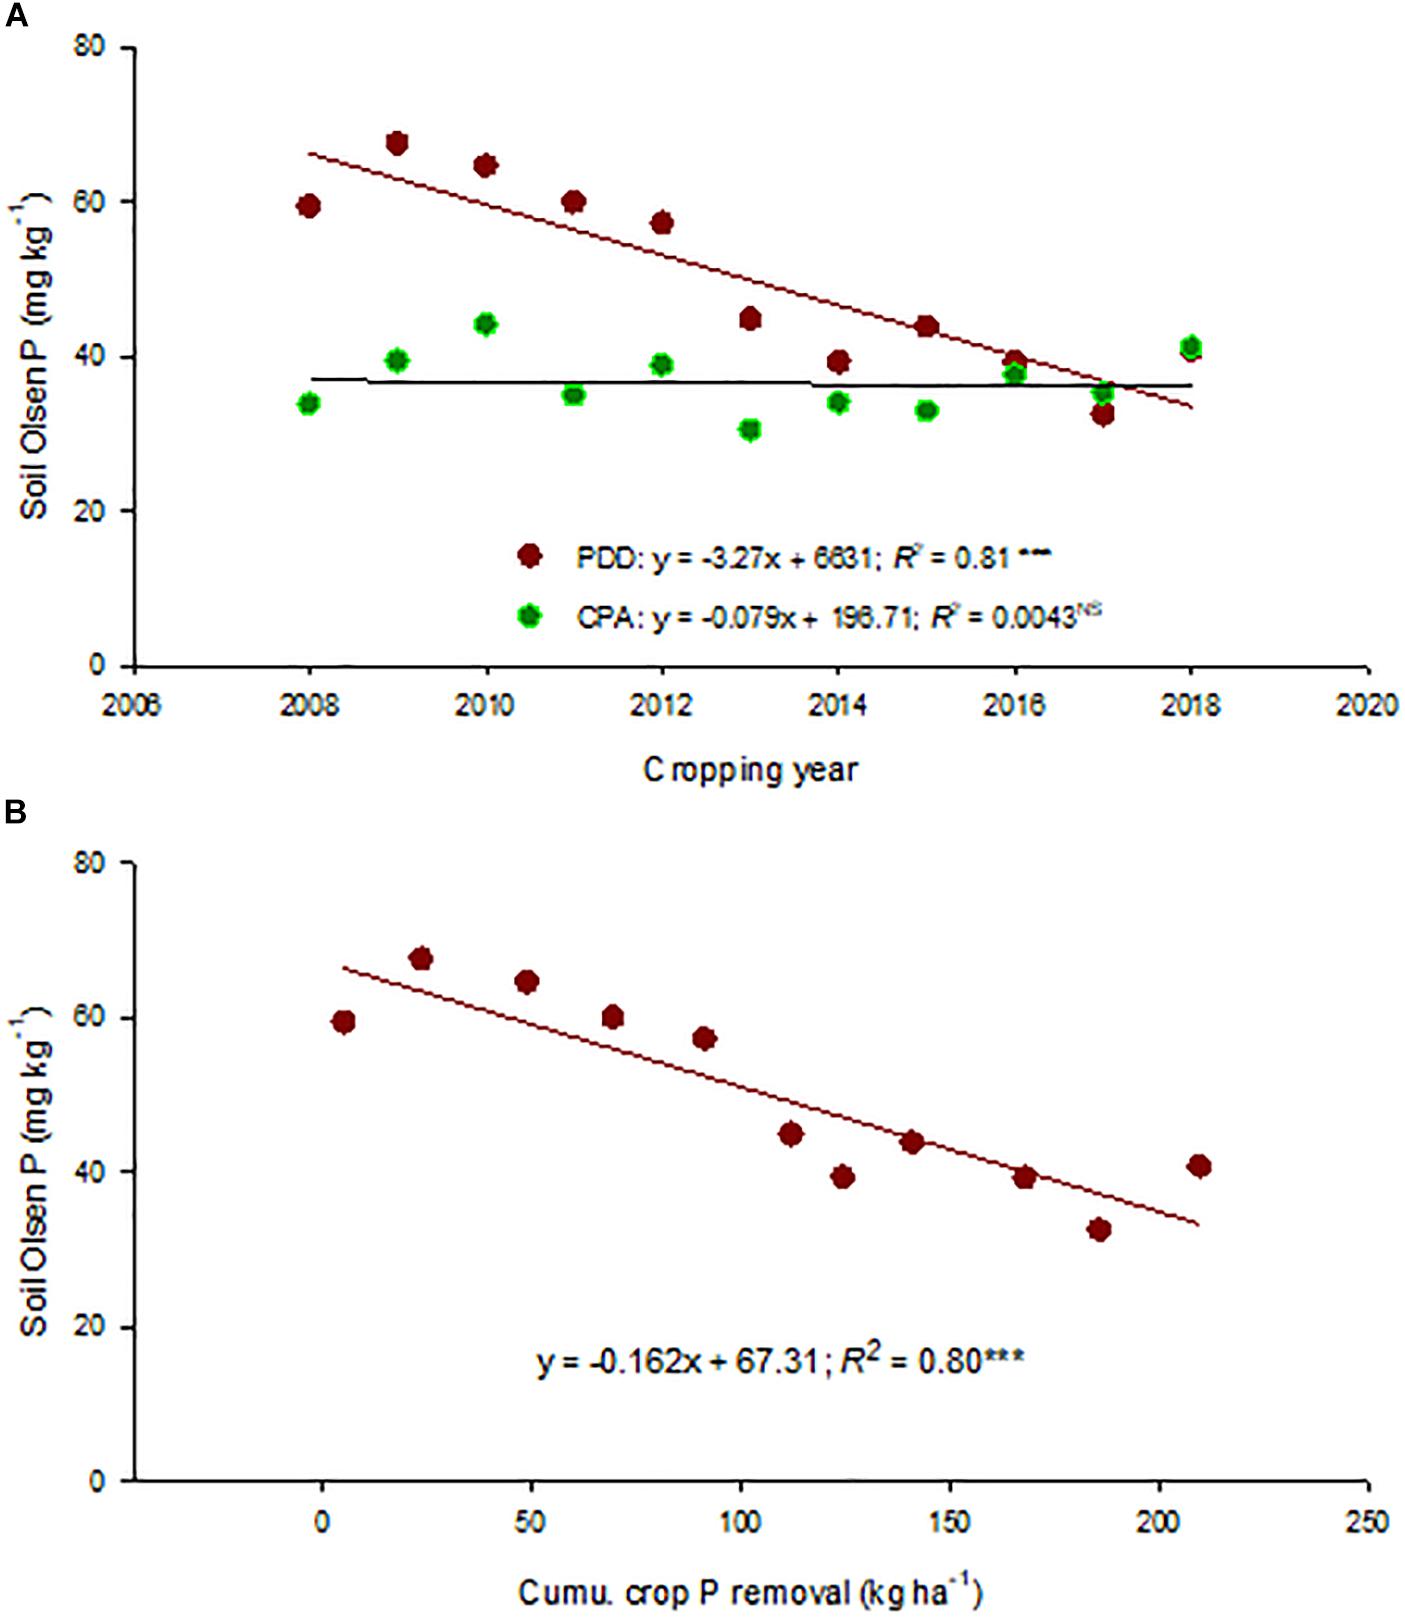
Figure 4. (A) Temporal changes of the soil Olsen P concentration in the 0- to 15-cm soil layer with continuous fertilizer P addition (CPA) and soil P draw-down (PDD). (B) Relationship between cumulative crop P removal and soil Olsen P concentration (0–15 cm) under PDD. ***Significant at the P ≤ 0.01 level. NS, not significant at the P ≤ 0.05 level.
Discussion
Legacy P on Agronomic and Economic Benefits
In Ontario, fertilizer P is not recommended for corn and soybean if the Olsen P is above 30 and 15 mg kg–1, respectively (OMAFRA, 2017). In the current study, therefore, P application at 50 kg ha–1 was able to provide sufficient available P to ensure optimum crop production in the CPA plots, where the soil Olsen P remained consistently around 36 mg kg–1. Obviously, similar yield values between the PDD and CPA treatments are overall consistent with previous reports that soil legacy P were potentially plant available and could support adequate crop yields without further P application for up to 10 years or more (Liu et al., 2015; Rowe et al., 2016). The soil Olsen P concentrations were around 60 mg kg–1 in 2009 and 2011 in the PDD-treated plots. Thus, the decreased soybean yields of PDD in 2009 and 2011 may indicate that, under some conditions, soybeans with small and shallow rooting systems may need a booster of P to compromise the temporal shortage of soil-available P, especially in early spring. This needs to be further tested under field conditions. In Ontario, there is approximately 2.0 million hectares of crop land having soil Olsen P > 30 mg kg–1, above which fertilizer P is not recommended for corn and soybean grain, and meanwhile runoff-soluble P losses may become an environmental concern (Wang et al., 2012, 2015; OMAFRA, 2017; Reid et al., 2019). Assuming that our PDD results apply to all these high-P soils and PDD can be properly adopted, Ontario farmers would receive a total net income of CAD 208–250 million (i.e., USD 157–189 million) each year based on our economic benefit analysis (Figure 2).
Legacy P on Soil Test P and P Availability to Crop Uptake and Runoff Loss
Our results indicated that the impact of PDD on soil Olsen P was restricted to 0- to 15-cm soil. Liu et al. (2015) had a similar finding that P fertilization and cessation did not impact the soil P of subsurface soils. Regarding the soil Olsen P declining rate of PDD, our result (i.e., 3.27 mg kg–1 year–1) agreed with previous reports that soil test P decreased at rates of 3.3–3.9 mg kg–1 year–1 after halting P application (Randall et al., 1997; Zhang et al., 2004). Kamprath (1999) and Zhang et al. (2004) reported that 4.2–7.9 kg P removal per hectare in harvested corn and soybean was required to decrease Mehlich-3 P by 1 mg kg–1, which was comparable to our finding that 6.2 kg P removal per hectare was required to decrease the soil Olsen P by 1 mg kg–1.
In the current study, PDD reduced the soil Olsen P concentration by 32.7 mg kg–1 between 2008 and 2018, which was equivalent to a reduction of 58.9 kg P ha–1 in soil Olsen P stored in the 0- to 15-cm soil depth (soil bulk density = 1.2 g cm–3). In comparison, the harvested corn and soybean removed a total of 210 kg P ha–1 from the PDD-treated soil between 2008 and 2018 (Table 2). As mentioned above, soil PDD operations only impacted the P concentrations of 0- to 15-cm soil, indicating that the P removed by the crops did not come from the soil depths below 15 cm. Therefore, soil plant-available P measured by the Olsen P extractant only contributed 58.9 kg P ha–1 to the amount of P removed by the crops, leaving the rest of 151 kg P ha–1 unaccounted for. Regarding the sources of such a large amount of unaccounted P removal, Kamprath (1999) and Rowe et al. (2016) suggested that soil moderately labile P (e.g., NaOH-extractable P) and/or non-labile stable P could become plant available through a biogeochemical conversion when the available P was depleted due to crop uptake. Meanwhile, Zhang et al. (2004) pointed out that soil residual P and 0.1M NaOH-extractable organic P, both of which are not directly available to plants, could provide available P for crop uptake by mineralization when the soil-available P levels were low. Liu et al. (2015) reported that when P fertilization was discontinued, Ca–P species [i.e., hydroxyapatite and Ca3(PO4)2] can be chemically converted to plant-available P for crop uptake. Based on Equation 2, we calculated that up to 72% of the P removed by the harvested grain was derived from the conversion of soil P originally not plant available to plant-available P in the PDD-treated plots.
In order to understand the non-changes of soil Olsen P over time in the CPA plots, a P budget was calculated by subtracting crop P removal from the amount of P applied. A total of 300 kg P ha–1 was added in the study period from 2008 to 2018, during which an amount of 185 kg P ha–1 was removed by the crops (Table 2). This resulted in an amount of 115 kg P ha–1 appearing as legacy P in soil over the 11-year period. In reality, the actual amount of legacy P accumulated in the soil would have been less than the 115 kg P ha–1 due to the occurrence of soil P losses in surface runoff and tile drainage water. Zhang et al. (2015) reported that P losses were up to 1.1 kg ha–1 year–1 in tile drainage water from the field adjacent to the current experimental site. Based on long-term field experiments ranging from 3 to 32 years, it was indicated that a positive P budget of 100 kg ha–1 increased the Olsen P concentration by 2.0–5.8 mg kg–1 (Messiga et al., 2010). However, the cumulative P budget values cited by Messiga et al. (2010) fell within a wider range of values than those in the current study. For example, the cumulative P budget ranged from −369 to 1,058 kg ha–1 in the study of Gallet et al. (2003). Consequently, it would be reasonable to believe that the insignificant changes in soil Olsen P with CPA might have been due to the increase in soil Olsen P that was too small to be detectable in the current study. In addition, soil-extractable P is often convertible to non-extractable forms over time after P additions, particularly when the soil P levels are high (Kamprath, 1999; Dodd and Mallarino, 2005). Phosphorus application greater than crop removal is often required to maintain the initial values of the soil test P in soils with higher levels of P. Zhang et al. (2004) observed that increasing the P application rates favored the soil P transformation from NaHCO3–Pi (i.e., Olsen P) to NaOH–Pi, which is not extractable with the Olsen P procedure.
Implications on Legacy P Management
Biogeochemical conversion of soil P less solubility to plant-available P makes it scientifically sound to adopt the soil PDD approach in order to manage high-P soils for agricultural production. It not only increases the farmers’ net income by saving on fertilizer and the associated application and transport costs but also helps to circumvent potential P rock reserve shortage by recycling the legacy P stock in soils (Gilbert, 2009). Meanwhile, biogeochemical transformation of soil P less solubility to available P would encourage our efforts to reduce agricultural P loss and improve surface water quality. Growing evidence indicates that the chronic release of soil legacy P is one of the major factors causing the failure of many agricultural conservation and nutrient management programs to reduce soil P loss and achieve improved water quality within timescales predicted originally (Sharpley et al., 2013). Soil P loss risk potentials are positively related to the soil P levels (Wang et al., 2010). Vadas et al. (2018) reported that reducing high soil P levels in all agricultural soils across the state of Maryland, United States, to optimum agronomic levels could reduce P loss to Chesapeake Bay by 40%. In our current study, it took 11 years to reduce the soil Olsen P concentration to 32 mg kg–1 from 65 mg kg–1. For high-P soils, it can be on the order of decades before reaching environmentally acceptable P loss levels (Sharpley et al., 2013).
In Ontario, fertilizer P is not recommended for corn and soybean if the Olsen P is above 30 and 15 mg kg–1, respectively (OMAFRA, 2017). Wang et al. (2012, 2015) suggested that soil test P greater than 30 mg Olsen P kg–1 may cause a significantly increased runoff-soluble P loss. In the current study, the overall Olsen P concentration was reduced to 32 mg kg–1 after 11 years of PDD operation. It is expected to see some reductions in crop yields and soil P losses without further P additions in the next few years. Subsequently an excellent opportunity would likely appear to determine a critical soil Olsen P concentration for P re-application that ensures maximum crop economic yields, with minimized P loss.
Conclusion
Legacy P in soils was at least partially plant available and could support adequate crop yields without further P application for up to 11 years. This led to an increased net farming income of CAD 104–125 (i.e., USD 78.5–94.4) per hectare per year and a decreased soil test P in the top layer of 0–15 cm at a declining rate of 3.27 mg kg–1 year–1. The latter would indicate a reduced soil P loss from high-P agricultural lands to water resources, such as the Lake Erie, as it is closely related to soil P losses in both surface runoff and tile drainage water. Considering its significant agronomic and economic benefits, as well as the potentials for alleviating the adverse effects of agricultural production on water quality and for circumventing P rock reserve shortage, the utilization of legacy P in soils appears a promising BMP, although its efficacy on soil P loss needs to be confirmed with quantification in future studies.
Data Availability Statement
All datasets generated for this study are included in the article/supplementary material.
Author Contributions
TZ proposed, designed, and facilitated the studies. All authors contributed to the conduction of field trials. YW and TZ contributed to the preparation of the manuscript.
Funding
Funding for this study was provided by the Agriculture and Agri-Food Canada A-base Research Program and the Ontario Ministry of Agriculture, Food and Rural Affairs New Direction Research Program.
Conflict of Interest
The authors declare that the research was conducted in the absence of any commercial or financial relationships that could be construed as a potential conflict of interest.
Acknowledgments
We are most grateful to B. Hohner, M. Soutani, M. R. Reeb, K. Rinas, G. Stasko, D. Polman, and D. Lawrence for their expert technical assistance.
References
Cade-Menun, B. J., Doody, D. G., Liu, C. W., and Watson, C. J. (2017). Long-term changes in Grassland soil phosphorus with fertilizer application and withdrawal. J. Environ. Qual. 46, 537–545. doi: 10.2134/jeq2016.09.0373
Daloğlu, I., Cho, K. H., and Scavia, D. (2012). Evaluating causes of trends in long-term dissolved reactive phosphorus loads to lake Erie. Environ. Sci. Technol. 46, 10660–10666. doi: 10.1021/es302315d
Dodd, J. R., and Mallarino, A. P. (2005). Soil-test phosphorus and crop grain yield responses to long-term phosphorus fertilization for corn–soybean rotations. Soil Sci. Soc. Am. J. 69, 1118–1128. doi: 10.2136/sssaj2004.0279
Dodd, R. J., McDowell, R. W., and Condron, L. M. (2012). Predicting the changes in environmentally and agronomically significant phosphorus forms following the cessation of phosphorus fertilizer applications to grassland. Soil Use Manage. 28, 135–147. doi: 10.1111/j.1475-2743.2012.00390.x
Fiorellino, R., Kratochvil, N., and Coale, F. (2017). Long-term agronomic drawdown of soil phosphorus in Mid-Atlantic Coastal Plain soils. Agron. J. 109, 455–461. doi: 10.2134/agronj2016.07.0409
Gallet, A., Flisch, R., Ryser, J. P., Frossard, E., and Sinaj, S. (2003). Effects of phosphates fertilization on crop yield and soil phosphorus status. J. Plant Nutr. Soil Sci. 166, 568–578. doi: 10.1002/jpln.200321081
IPNI (2015). Soil Test Levels in North America 2015. Georgia: International Plant Nutrition Institute.
Kamprath, E. J. (1999). Changes in phosphate availability of Ultisols with long-term cropping. Commun. Soil Sci. Plant Anal. 30, 909–919. doi: 10.1080/00103629909370256
King, K. W., Williams, M. R., Johnson, L. T., Smith, D. R., LaBarge, G. A., and Fausey, N. R. (2017). Phosphorus availability in Western Lake Erie Basin drainage waters: Legacy evidence across spatial scales. J. Environ. Qual. 46, 466–469. doi: 10.2134/jeq2016.11.0434
Liu, J., Hu, Y., Yang, J., Abdi, D., and Cade-Menun, B. J. (2015). Investigation of soil legacy phosphorus transformation in long-term agricultural fields using sequential fractionation, P K-edge XANES and solution P NMR Spectroscopy. Environ. Sci. Technol. 49, 168–176. doi: 10.1021/es504420n
MacDonald, G. K., Bennett, E. M., Potter, P. A., and Ramankutty, N. (2011). Agronomic phosphorus imbalances across the world’s croplands. Proc. Natl. Acad. Sci. U.S.A. 108, 3086–3091. doi: 10.1073/pnas.1010808108
McCollum, R. E. (1991). Buildup and decline in soil phosphorus: 30-year trends on a Typic Umprabuult. Agron. J. 83, 77–85. doi: 10.2134/agronj1991.00021962008300010019x
McDowell, R. W., Condron, L. M., and Stewart, I. (2016). Variation in environmentally- and agronomically-significant soil phosphorus concentrations with time since stopping the application of phosphorus fertilizers. Geoderma 280, 67–72. doi: 10.1016/j.geoderma.2016.06.022
Menezes-Blackburn, D., Giles, C., Darch, T., George, T. S., Blackwell, M., Stutter, M., et al. (2018). Opportunities for mobilizing recalcitrant phosphorus from agricultural soils: a review. Plant Soil 427, 5–16. doi: 10.1007/s11104-017-3362-2
Messiga, A. J., Ziadi, N., Plénet, D., Parent, L. E., and Morel, C. (2010). Long-term changes in soil phosphorus status related to P budgets under maize monoculture and mineral P fertilization. Soil Use Manag. 26, 354–364. doi: 10.1111/j.1475-2743.2010.00287.x
Murphy, J., and Riley, J. P. (1962). A modified single solution method for the determination of phosphate in natural waters. Anal. Chim. Acta. 27, 31–36. doi: 10.1016/s0003-2670(00)88444-5
Randall, G. W., Iragavarapu, T. K., and Evans, S. D. (1997). Long-term P and K applications. I. Effect on soil test incline and decline rates yields and critical soil test levels. J. Prod. Agric. 10, 565–571.
Reid, K., Schneider, K., and Joosse, P. (2019). Addressing imbalances in phosphorus accumulation in Canadian agricultural soils. J. Environ. Qual. 48, 1156–1166. doi: 10.2134/jeq2019.05.0205
Ridgetown Campus (2008–2018). The survey for “Ontario Farm Input Monitoring Project”. Ridgetown, ON: Ridgetown Campus.
Rowe, H., Withers, P. J. A., Baas, P., Chan, N. I., Doody, D., and Holiman, J. (2016). Integrating legacy soil phosphorus into sustainable management strategies for future food, bioenergy, and water security. Nutr. Cycl. Agroecosyst. 104, 393–412.
SAS Institute (2009). SAS software: Changes and enhancements through Release 9.12. Cary, NC: SAS Institute.
Schoenau, J. J., and O’Halloran, I. P. (2008). “Sodium bicarbonate-extractable phosphorus,” in Soil Sampling and Methods of Analysis, eds M. R. Carter and E. G. Gregorich (Boca Raton, FL: CRC Press), 89–94.
Sharpley, A., Jarvie, H. P., Buda, A., May, L., Spears, B., and Kleinman, P. (2013). Phosphorus legacy: overcoming the effects of past management practices to mitigate future water quality impairment. J. Environ. Qual. 42, 1308–1326. doi: 10.2134/jeq2013.03.0098
Soil Classification Working Group (1998). The Canadian System of Soil Classification, 3rd edition. Agriculture and Agri-Food Canada Publ. 1646. Ottawa: NRC Research Press,
Soil Survey Staff (1999). Soil Taxonomy: A Basic System of Classification for Making and Interpreting Soil Surveys, 2nd Edn. Washington, DC: USDA-NRCS.
Syers, J. K., Johnston, A. E., and Curtin, D. C. (2008). Efficiency of Soil and Fertilizer Phosphorus Use. Rome: FAO.
Thomas, R. L., Sheard, R. W., and Moyer, J. R. (1967). Comparison of conventional and automated procedures for nitrogen, phosphorus, and potassium analysis of plant material using a single digestion. Agron. J. 59, 240–243. doi: 10.2134/agronj1967.00021962005900030010x
Vadas, P. A., Fiorellino, N. M., Coale, F. J., Kratochvil, R., Mulkey, A. S., and McGrath, J. M. (2018). Estimating legacy soil phosphrous impacts on phosphorus loss in the Chesapeake Bay Watershed. J. Environ. Qual. 47, 480–486. doi: 10.2134/jeq2017.12.0481
Wang, Y. T., O’Halloran, I. P., Zhang, T. Q., Hu, Q. C., and Tan, C. S. (2015). Phosphorus sorption parameters of soils and their relationships with soil test phosphorus. Soil Sci. Soc. Am. J. 79, 672–680. doi: 10.2136/sssaj2014.07.0307
Wang, Y. T., Zhang, T. Q., Hu, Q. C., Tan, C. S., O’Halloran, I. P., Drury, C. F., et al. (2010). Estimating dissolved reactive phosphorus concentration in surface runoff water from major Ontario soils. J. Environ. Qual. 39, 1771–1781. doi: 10.2134/jeq2009.0504
Wang, Y. T., Zhang, T. Q., O’Halloran, I. P., Tan, C. S., Hu, Q. C., and Reid, D. K. (2012). Soil tests as risk indicators for leaching of dissolved phosphorus from agricultural soils in Ontario. Soil Sci. Soc. Am. J. 76, 220–229. doi: 10.2134/jeq2015.05.0211
Webb, J. R., Mallarino, A. P., and Blackmer, A. M. (1992). Effects of residual and annually applied phosphorus on soil test values and yields of corn and soybean. J. Prod. Agric. 5, 148–152.
Zhang, T. Q., and Mackenzie, A. F. (1997a). Changes of phosphorous fractions under continuous corn production in a temperate clay soil. Plant Soil. 192, 133–139.
Zhang, T. Q., and Mackenzie, A. F. (1997b). Changes in soil phosphorous fractions under long-term corn (Zea mays L.) monoculture. Soil Sci. Soc. Am. J. 61, 485–493.
Zhang, T. Q., Mackenzie, A. F., Liang, B. C., and Drury, C. F. (2004). Soil test phosphorus and phosphorus fractions with long-term phosphorus addition and depletion. Soil Sci. Soc. Am. J. 68, 519–528. doi: 10.2136/sssaj2004.5190
Keywords: soil test phosphorus, legacy phosphorus, crop yield, economic analysis, surface water quality, Lake Erie
Citation: Zhang T, Wang Y, Tan CS and Welacky T (2020) An 11-Year Agronomic, Economic, and Phosphorus Loss Potential Evaluation of Legacy Phosphorus Utilization in a Clay Loam Soil of the Lake Erie Basin. Front. Earth Sci. 8:115. doi: 10.3389/feart.2020.00115
Received: 11 January 2020; Accepted: 26 March 2020;
Published: 05 May 2020.
Edited by:
Paulo Sergio Pavinato, University of São Paulo, BrazilReviewed by:
Meihua Deng, ZheJiang Academy of Agricultural Sciences, ChinaRenkou Xu, Institute of Soil Science (CAS), China
Copyright © 2020 Zhang, Wang, Tan and Welacky. This is an open-access article distributed under the terms of the Creative Commons Attribution License (CC BY). The use, distribution or reproduction in other forums is permitted, provided the original author(s) and the copyright owner(s) are credited and that the original publication in this journal is cited, in accordance with accepted academic practice. No use, distribution or reproduction is permitted which does not comply with these terms.
*Correspondence: Tiequan Zhang, VGllcXVhbi5aaGFuZ0BjYW5hZGEuQ2E=