 Changyu Zhao
 Haishan Chen
 Shanlei Sun
- 1Key Laboratory of Meteorological Disaster, Ministry of Education, and International Joint Research Laboratory of Climate and Environment Change, and Collaborative Innovation Center on Forecast and Evaluation of Meteorological Disasters, Nanjing University of Information Science and Technology, Nanjing, China
- 2Ningbo Meteorological Observatory, Ningbo, China
- 3School of Atmospheric Science, Nanjing University of Information Science and Technology, Nanjing, China
Soil enthalpy represents the land surface thermal states by combining soil moisture (sum of soil ice and liquid water) and soil temperature into a single variable. This study applied soil moisture and soil temperature outputs from offline CLM4.0 model to calculate soil enthalpy from 1948 through 2010 and analyzed the contributions of the soil water and temperature to the trends of winter soil enthalpy in Eastern Northern Hemisphere. The results show that an increasing trend of winter soil enthalpy occurred during the period 1979–2010, especially in Eastern Europe (EE), Eastern Mongolia (EM), the India River Plain (IP), and Central Africa (CA). Overall, increases in soil enthalpy are primarily controlled by decreased soil ice over EE and EM and by increased soil temperature over IP, while the increased soil enthalpy over CA is mainly attributed to increases in soil liquid water and soil temperature, whose contributions are roughly equivalent. The roles of soil moisture and soil temperature in soil enthalpy changes exhibit evident regional differences and are generally latitude dependent, with soil ice and soil temperature as the dominant contributors at mid-high and mid-low latitudes, respectively. More importantly, when under the condition of soil water phase transition, soil enthalpy may be served as a better metric to monitor the long-term trend of land surface thermal states than by using soil moisture or soil temperature alone. Therefore, our findings have important implications for soil enthalpy in climate change research (e.g., the impacts of land thermal anomalies on regional and even global climate).
Introduction
Climate change occurs as a result of the Earth's system adjusting to changes in Earth's heat storage to keep radiative equilibrium (Stephens et al., 2012; von Schuckmann et al., 2016). It is reported that the continental heat storage accounted for ~2% of the Earth energy imbalance during 1972–2008 (Church et al., 2011). Although only a small proportion of the Earth energy imbalance is used to heat the land, the increasing trend of surface air temperature is much greater over the land than ocean (Sutton et al., 2007; IPCC, 2013). The assessment of the land surface heat storage and its changes need to be a focus of the international climate monitoring.
Commonly, temperature variations are used to describe changes in the heat storage of the climate system. However, temperature alone cannot fully represent heat storage, and assessments of units of heat (Joules) are required (Pielke, 2003; Pielke et al., 2004; Li et al., 2014). In recent years, enthalpy has been applied to monitor the thermal conditions of oceans, atmosphere, and continents in terms of energy (Tsonis, 2007; North and Erukhimova, 2009). McDougall (2003) stated that the ocean's potential enthalpy is more conservative than its potential temperature by two orders of magnitude and further noted that potential enthalpy can better describe the heat fluxes and heat content, which has been approved by other studies subsequently (e.g., Abraham et al., 2013; Palmer and McNeall, 2014). Compared with air temperature, moist enthalpy near the Earth's surface is more sensitive to surface vegetation properties (Davey et al., 2006; Rogers et al., 2007; Fall et al., 2010, 2014; Peterson et al., 2011). Additionally, enthalpy of snow cover is usually used to represent the energy of the snowpack, including not only the internal energy of liquid water/ice but also energy changes during water phase transition (Shrestha et al., 2015), which is always conserved in the snow layer combinations (Lawrence et al., 2011). Meanwhile, enthalpy has been used to replace temperature as a predictor in snow, lake, or frozen soil models in order to identify the phase change process more easily (Sun et al., 1999, 2008; Zhang et al., 2003; Li and Sun, 2006), as well as to establish a state equation of unsaturated soils for an efficient numerical scheme (Murray, 2002).
Nevertheless, few studies have used soil enthalpy to monitor the land surface thermal states and their changes. Tang et al. (1982) suggested that variations in soil enthalpy have comparable magnitude to those in atmospheric enthalpy at various time scales and can persist for 2–3 months in the top 20–50 cm of the soil column, which could also serve as a record of previous precipitation and air temperature anomalies (Hu and Feng, 2004). Zhao et al. (2018a,b) compared spatiotemporal characteristics of soil enthalpy anomaly persistence and found that soil enthalpy provides the most effective signals for rainfall prediction over East China than soil temperature and soil moisture. However, the capability of soil enthalpy in representing the land surface heat storage remains poorly understood. It is necessary to use soil enthalpy as a metric to explore the variation of the land surface thermal states from the perspective of energy and to identify the key areas with pronounced energy accumulation.
The long-term trend of land surface thermal states is closely related to both the thermodynamic and hydrological conditions. Much attention has been paid to the changes in soil temperature and soil moisture, while the former represents the soil energy status and heat transfer conditions (Xue et al., 2012), and the latter mainly controls the partitioning of net radiation into sensible and latent heat fluxes (Koster et al., 2004; Seneviratne et al., 2010; Dirmeyer, 2011; Zhang et al., 2011; Li and Zhang, 2014). Some common features of soil temperature change have been elucidated, especially a greater increase in winter soil temperature at high latitudes, followed by increased air temperature, indicating that the increasing trend of soil temperatures may be stronger than that of air temperature (Zhang et al., 2001). Drying (reducing soil moisture) is more severe over East Asia, where soil moisture is sensitive to this change due to the diverse land surface cover and fragile ecosystems (Li and Ma, 2012; Dai, 2013). Despite that, land surfaces constitute a complicated system that cannot be objectively described by only soil temperature or soil moisture. Notably, soil enthalpy is a distinct variable that accounts for variations in soil temperature and soil moisture (Chen and Kumar, 2004; Amenu et al., 2005). Thus, to investigate what magnitudes of soil moisture and soil temperature impacts on soil enthalpy can provide more critical reference information for a deep understanding of the land surface heating processes and its variations.
This study aims to analyze soil enthalpy as a proxy for changes in soil energy storage and consider the spatial patterns of winter (i.e., December–January–February) soil enthalpy trends and their direct causes. Analytical technique and statistical approach are both employed to determine the underlying relationships between soil moisture, soil temperature, and soil enthalpy, when qualitative analysis and quantitative assessment are used successively to calculate the individual effects of soil moisture and soil temperature on soil enthalpy trends. This paper is organized as follows: the data and methods used are described in the next section, major results are presented in Results, and Conclusion and Discussion provides a summary of the results and a discussion on our findings and future work.
Data and Methods
Data
The description of the dataset parallels that of Zhao et al. (2018b), and the following text is derived from there with minor modifications. Due to a lack of global comprehensive observations, soil moisture and soil temperature in this study were obtained from the offline simulation of the Community Land Model version 4.0 (CLM4.0; Oleson et al., 2010). CLM4.0 is the land component of the Community Earth System Model (CESM). Compared to earlier versions (e.g., CLM3.5), CLM4.0 has significant improvements in physical parameterization, including an extension of the carbon–nitrogen (CN) biogeochemical model, the addition of an urban canyon model, and the introduction of a transient land cover/land use change capability (Lawrence et al., 2011; Hua et al., 2013; Zhu et al., 2013). The number of ground layers is extended from 10 layers in CLM3.5 to 15 layers in CLM4.0, with the upper 10 layers hydrologically active (i.e., the “soil” layers) and the bottom 5 layers inactive. The global near-surface meteorological data used to force the land surface model were developed by the Land Surface Hydrology Research Group at Princeton University (Sheffield et al., 2006) from 1948 to 2010 with a temporal resolution of 3 h and a horizontal resolution of 1° × 1°, which includes seven elements, i.e., humidity, longwave radiation, precipitation, shortwave radiation, surface air temperature, surface pressure, and surface wind. It is 18 years that the model has been spun up, which make certain long-term equilibrium of variables inside. Finally, the output of CLM4.0 including solid ice, soil liquid water, and soil temperature participate in the calculation of soil enthalpy.
For a soil medium, the total enthalpy can be expressed as the summarized enthalpies of soil particles, soil water, and soil air (Murray, 2002; Chen and Kumar, 2004). Considering the difficulties in measuring soil air and its small mass, the impact on the soil enthalpy is neglected. Therefore, the equation used for calculating soil enthalpy per unit volume (h; J m−3) can be represented as follows:
where ci and cl are the volumetric heat capacities of soil ice (1.942 × 10⁶ J m−3 K−1) and soil liquid water (4.188 × 10⁶ J m−3 K−1), respectively; Tf indicates the freezing temperature (273.16 K); Lil is the latent heat of fusion (3.337 × 10⁵ J kg−1); ρi is the density of soil ice (917 kg m−3); θi and θl denote the volume percentages (m3 m−3) of soil ice and soil liquid water, respectively; and T represents soil temperature (K), which can be achieved from the CLM4.0 offline outputs. cd and θd are the volumetric heat capacity and the volume percent of soil solids, respectively, which can be calculated from the data of soil organic matter density, percent sand, and percent clay obtained from the 1° × 1° monthly global soil texture dataset supported by the International Geosphere-Biosphere Programme (IGBP; Bonan et al., 2002; Lawrence and Slater, 2008). Detailed information on these variables and algorithms can be found in the CLM4.0 Technical Descriptions (Oleson et al., 2010).
The global warming signal is particularly strong and steadily linear after 1979 (Foster and Rahmstorf, 2011), and the boreal winter warming is only significant starting from 1979 to 2010 (Cohen et al., 2012). Thus, studies on the long-term trend of boreal winter soil enthalpy from 1979 to 2010 will be of great interest. In addition, as the enthalpy variations in the shallow and deep soil zone are determined by soil moisture and soil temperature, respectively (Chen and Kumar, 2004), the fifth level (21.22 cm) is selected in this study to represent middle soil layers, where soil moisture and soil temperature play more comparable roles in soil enthalpy.
Methods
Equation (1) shows how soil enthalpy is directly calculated from soil moisture and soil temperature. To quantify the relative contributions of soil temperature and soil moisture in liquid and ice phases to soil enthalpy, a multiple linear regression (MLR) approach is employed for the present study period 1979–2010. Soil enthalpy can be represented as the linear function of soil ice, soil liquid water, and soil temperature as follows:
where θi, θl, and T are soil ice, soil liquid water, and soil temperature at location (x, y) and time t, respectively; c denotes the intercept; and ε is the residual error. Here, ai (al) is the partial regression coefficient of soil ice (soil liquid water) and b is that of soil temperature, e.g., b represents the impact of soil temperature on soil enthalpy with constant soil moisture. Since we are dealing with changes over time, it is also easy to linearize Equation (1) to obtain:
with the terms in parentheses providing analytical linearized expressions for the coefficients ai, al, and b in Equation (2). In this case, the signs for the coefficients are easily judged and explained with analytical techniques available.
In current study, our aim was to quantify impacts from soil moisture and soil temperature on the soil enthalpy trend. First, the soil enthalpy predictand [H(x, y, t) = ai(x, y)θi(x, y, t) + al(x, y)θl(x, y, t) + b(x, y)T(x, y, t) + c(x, y)] can be roughly regarded as the soil enthalpy component jointly caused by soil ice, soil liquid water, and soil temperature. This concept has been successfully employed to separate the effects of precipitation from temperature on soil moisture changes (Cheng et al., 2015) and to identify the external and internal sea surface temperature trends (Li et al., 2010). Here, the contribution of soil ice to the soil enthalpy trend (hereafter Cθi) can be estimated by:
where ΔH and Δθi are the differences in mean H and θi, respectively, between the first and last 10 years. Similarly, the contributions of soil liquid water (hereafter Cθl) and soil temperature (hereafter CT) can be expressed as follows:
Notably, the contributions are relative, and the sum equals 100%. At lower latitudes, this three-element linear regression equation (Equation 2) can be degenerated into a binary linear regression equation when there is no ice in the soil. Therefore, the linear function for the soil enthalpy can be represented by: H(x, y, t) = al(x, y)θl(x, y, t) + b(x, y)T(x, y, t) + c(x, y) + ε(x, y, t).
Results
Linear Trend of Land Surface Thermal States
The spatial distribution of the soil enthalpy trend in winter is given in Figure 1. During the period 1979–2010, soil enthalpy exhibited increasing trends in most eastern regions of the Northern Hemisphere with an area percentage of above 70%. The significant (p < 0.05) increases were mainly located in Eastern Europe (EE), Eastern Mongolia (EM), the India River Plain (IP), and Central Africa (CA). In particular, the energy accumulation over EE has exhibited the largest increase of more than 12 MJ m−3 over the past 32 years. Over North Asia, soil enthalpy generally exhibited different decreases, and significant (p < 0.05) negative trends were only detected in small parts of the eastern Siberia.
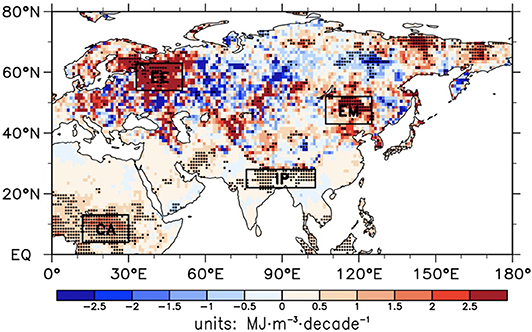
Figure 1. Spatial distribution of linear trend of winter soil enthalpy from 1979 to 2010, and dotted area is significant (p < 0.05).
To further explore the relationship of soil moisture and soil temperature with soil enthalpy, the grids with significant (p < 0.05) trends of soil enthalpy are selected and shown in Figure 2. Increased soil enthalpy corresponding to soil temperature increases was found over majority of the selected grids, possibly indicating that soil temperature increase was favorable for soil enthalpy increase. For the grids with negative soil enthalpy trends, most were accompanied by soil moisture increases, which implied that increases in soil moisture would likely decrease soil enthalpy. Notably, soil enthalpy with larger negative trends (< -3 MJ m−3 decade−1) all corresponded to increased soil moisture, which might suggest that a stronger negative relationship existed between these variables in winter. Whether soil ice or soil liquid water was most responsible for the negative relationship should be further analyzed. More interestingly, we found that soil enthalpy with larger trends (>6 MJ m−3 decade−1) was generally found in the regions with little change in both soil moisture and temperature. How did this phenomenon occur when the land heat content (soil enthalpy) has significantly (p < 0.05) and greatly increased for these grids? To address these issues, we come up with some clear explanations based on the analytical expressions for the coefficients in Equation (3) and the investigation of the corresponding spatial distributions of soil moisture and temperature trend and then quantify their relative contributions in the following sections.
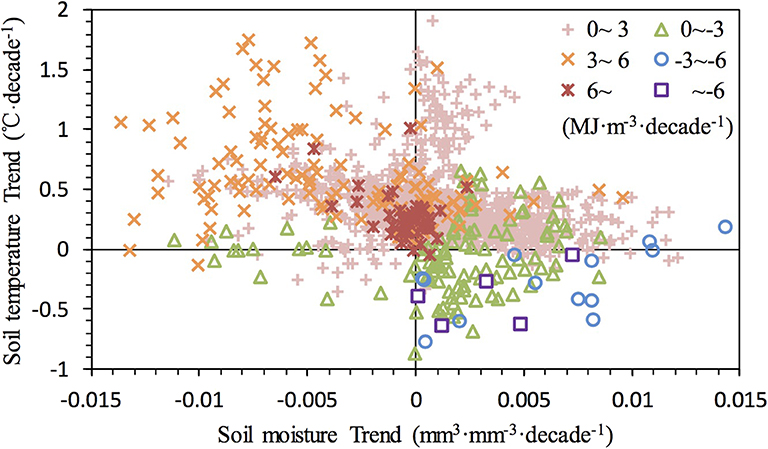
Figure 2. Trends of soil enthalpy vs. those of soil moisture and soil temperature, but for individual trends of soil enthalpy that are significant with p < 0.05.
Relationships of Soil Moisture and Soil Temperature With Soil Enthalpy
Close relationships could be detected between the spatial pattern of soil moisture (soil temperature) trends and that of soil enthalpy trends. As shown in Figure 3A, soil moisture generally demonstrated a significant (p < 0.05) increase at high and low latitudes but decreased at middle latitudes, especially for EM and North Africa. For soil temperature (Figure 3B), the strongest warming occurred over the northern Serbia, while the cooling areas were very limited and mainly located in the North Asia. The linear trends of soil temperature over EE and EM were positive but insignificant, while significant (p < 0.05) warming occurred over IP and CA.
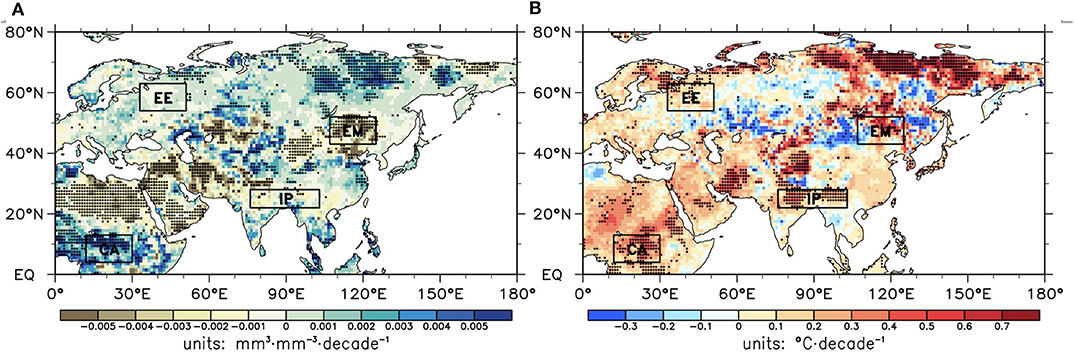
Figure 3. Same as Figure 1, but for (A) soil moisture and (B) soil temperature.
It is noted that, despite slight and insignificant increases in soil moisture and soil temperature over EE (Figure 3), soil enthalpy showed the largest increase among the four selected regions (Figure 1). This finding seemed to contrast with our knowledge that larger changes in soil moisture and soil temperature are associated with greater changes in soil enthalpy. Based on Equation (1), in addition to soil liquid water and soil temperature, soil enthalpy was also associated with soil ice. Therefore, we divided the soil moisture into two components (i.e., soil ice and soil liquid water) and then further analyzed their changes. A comparison of Figures 4A,B shows that soil ice over EE significantly (p < 0.05) decreased, followed by increased soil liquid water, leading to little change in the soil moisture. As a result, this phenomenon of the largest increases in soil enthalpy over EE could be roughly attributed to ice melting into liquid water during the previous summer and early fall, which absorbs much of the heat. As noted above (Introduction), enthalpy is a very useful measure for describing energy storage and transformation, especially for processes involving water phase transitions (North and Erukhimova, 2009). Comparing trends of soil moisture and soil temperature indicates that decreases in soil ice should be responsible for the downward trends of soil moisture over EM. At mid and low latitudes without soil ice due to higher temperatures throughout the year, changes in soil moisture were completely consistent with those in soil liquid water.
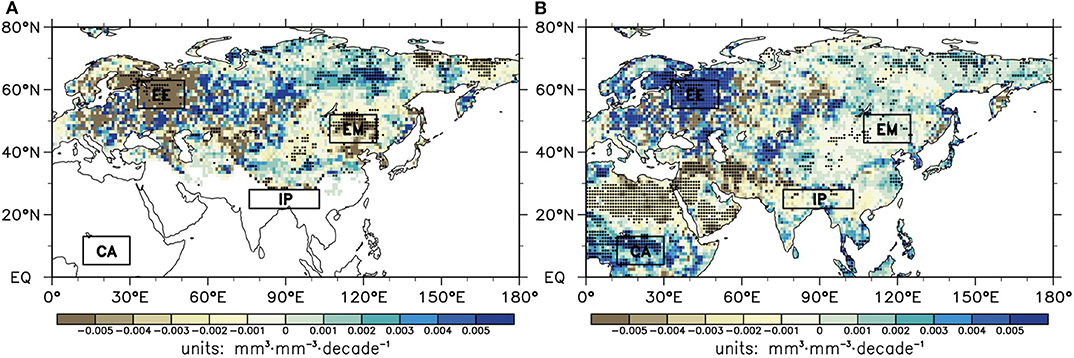
Figure 4. Same as Figure 1, but for (A) soil ice and (B) soil liquid water.
Based on the above analyses showing that soil moisture change was attributed to soil ice over EE and EM and to soil liquid water over IP and CA, we have drawn scatterplots of soil enthalpy trends vs. soil ice/liquid water (x-axis) and soil temperature (y-axis) for each selected area (Figure 5), which was helpful for more intuitively identifying the linkages between changes in soil enthalpy with those in soil ice/liquid water and soil temperature. For EE (Figure 5A), soil ice is the dominant contributor of the soil enthalpy trend, of which soil temperature performs as a driver over IP (Figure 5C). The relationship between soil enthalpy increasing and soil ice decreasing over EM (Figure 5B) was similar to that over EE, but soil temperature contributed slightly more. Over CA, increased soil enthalpy was positively associated with increases in both the soil liquid water and soil temperature (Figure 5D).
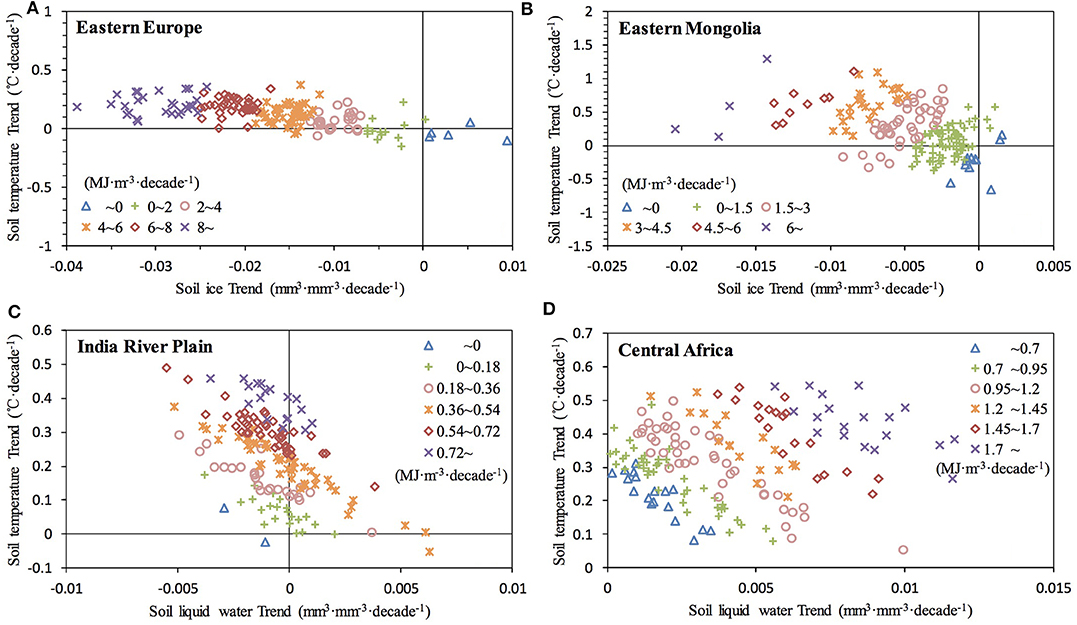
Figure 5. Trends of soil enthalpy vs. soil ice/liquid water and soil temperature trends over (A) Eastern Europe (EE), (B) Eastern Mongolia (EM), (C) India River Plain (IP), and (D) Central Africa (CA).
In summary, the qualitative analyses illustrated that there is a great advantage to employing soil enthalpy as a metric to describe land surface thermal conditions, especially under the context of soil water phase transitions. Moreover, to more accurately capture characteristics of the land surface thermal condition and its related changes, the effects of soil ice on changes in soil enthalpy should be given comparable attentions to those of soil liquid water and soil temperature. Therefore, the individual effects of soil ice/liquid water and soil temperature on the soil enthalpy trend will be determined quantitatively in the next section.
Quantitative Contributions of Soil Ice/Liquid Water and Soil Temperature to Soil Enthalpy Trends
To determine the magnitudes of the effects of soil moisture (including soil ice and liquid water) and soil temperature on soil enthalpy, we quantified their respective impacts using regression analyses and Equations (4–6).
As shown in Figure 6A, the partial regression coefficients of soil ice were negative throughout the study region. The magnitudes of the coefficients exhibited evident regional differences. Generally, the higher values (< -310) were located in the eastern part (east of 90°E), especially for EM and northern Siberia (< -330), but the lower values occurred in the western part. The partial regression coefficients of soil liquid water (Figure 6B) were negative over most of the study region (east of 70°E). Based on the coefficient magnitudes, there existed a similar spatial distribution of soil liquid water coefficients to that of soil ice coefficients, with higher values in EM and northern Siberia (< -40). In contrast, soil enthalpy positively responded to soil liquid water over Europe and a small part of West Asia. The opposite signs of coefficients were consistent with the spatial pattern of winter climatological soil temperature, which had negative values over most of the area east of 70°E and positive values in Europe due to the North Atlantic Drift. Over the whole study region, the partial regression coefficients of soil temperature were all positive (Figure 6C). However, the magnitudes of these coefficients showed evident regional differences, e.g., higher values (>2.2) over southern Europe and small parts of eastern Asia, lower values (<1.6) over the regions between north of 60°N and west of 110°E, and moderate values mainly in other regions. Through analytical techniques (i.e., Equation 3), the results are easily explained and predicted, as follows: Soil ice's coefficient is always negative, since soil ice is only present when T ≤ Tf, so decreasing soil ice corresponds to increasing soil enthalpy. Larger negative contributions of soil ice to soil enthalpy trends are associated with greater amounts of soil ice and lower temperatures. Soil liquid water's contribution to soil enthalpy trends depends on temperature: the enthalpy response to increasing soil liquid water is negative for temperatures below freezing and positive for temperature above freezing, with the size of the effect proportional to temperature. Soil temperature's contribution to soil enthalpy is always positive, proportional to the magnitude of temperature change, the volumetric mass, and the heat capacity of the soil/water.
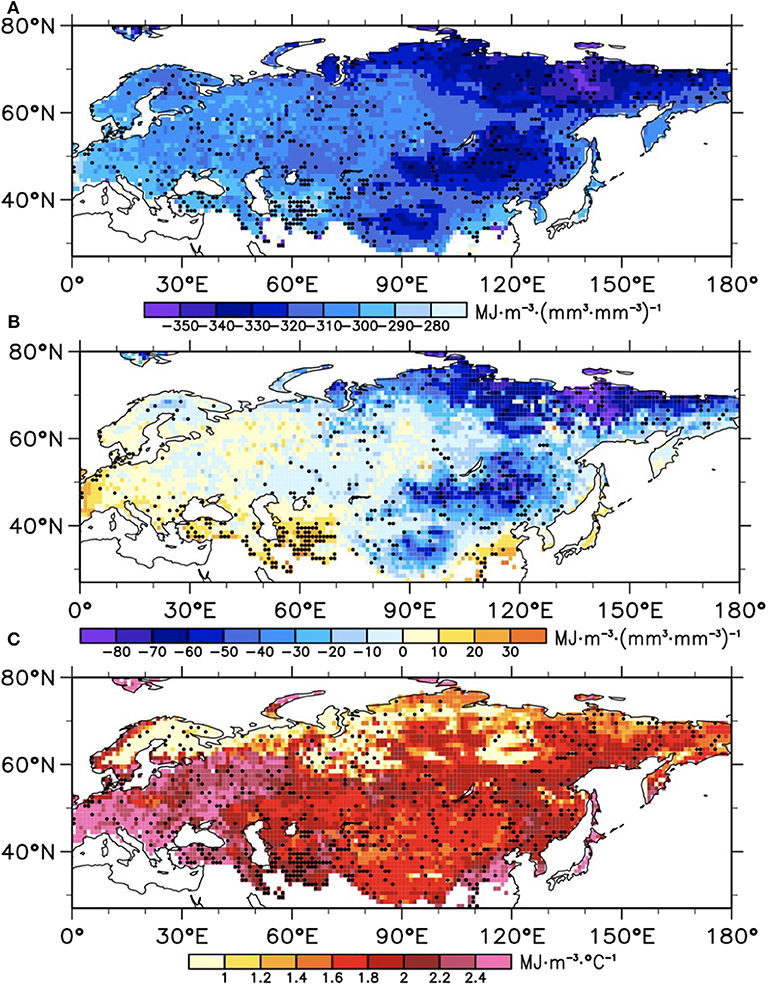
Figure 6. The MLR coefficients of soil enthalpy on (A) soil ice (ai), (B) soil liquid water (al), and (C) soil temperature (b) at mid-high latitudes. The regions with solid black dots represented the coefficients were statistically significant (p < 0.05) after prewhitening.
Consistent with Figures 5A,B, the relative contributions from soil ice to soil enthalpy trends over EE and EM exceeded 80 and 60% (Figure 7A), respectively, while the contribution from soil liquid water was relatively small due to its weaker regression coefficients (Figure 7B). The relative contribution from soil temperature to soil enthalpy trends over northern Siberia exceeded 100% (Figure 7A), as soil ice and soil liquid water contributed negatively. In general, the contributions to soil enthalpy trends were dominated by soil ice over Europe and most of Asia and by soil temperature over northern Siberia.
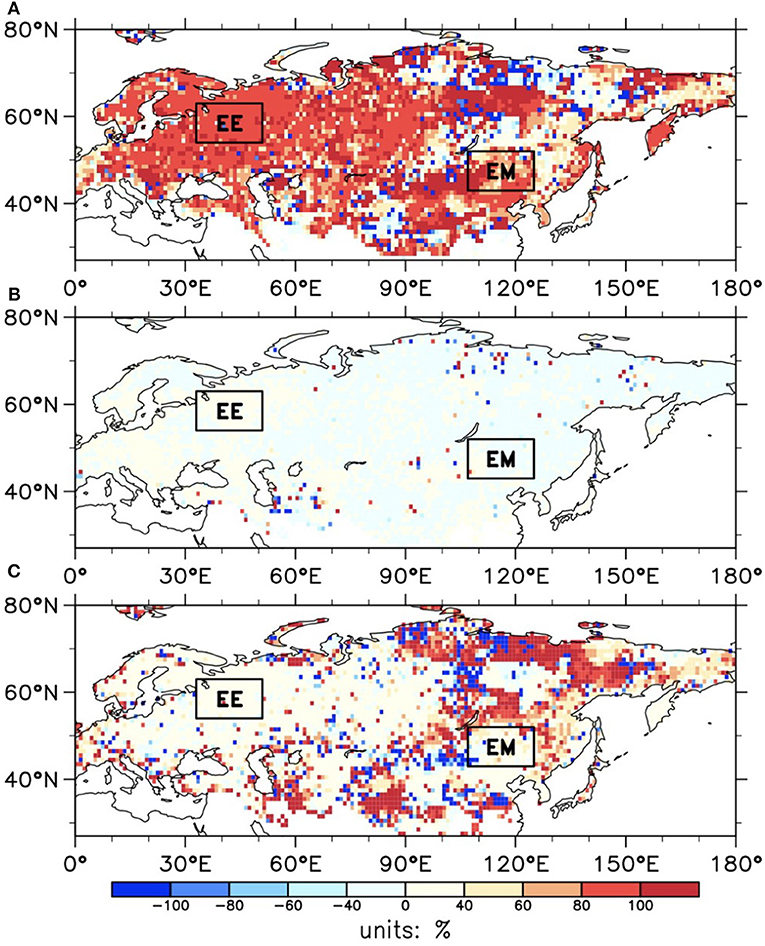
Figure 7. The relative contributions of (A) soil ice, (B) soil liquid water, and (C) soil temperature to soil enthalpy trends at mid-high latitudes.
Figure 8 shows the partial regression coefficients of soil liquid water and soil temperature at mid-low latitudes, where soil ice is not present. The partial regression coefficients of soil liquid water were all positive (Figure 8A). The magnitude of the coefficients was greater than those at mid-high latitudes (Figure 6B). The higher values (>110) were mainly located at ~10°N. Consistent with Figure 6C, the partial regression coefficients of soil temperature at mid-low latitudes (Figure 8B) were also positive. However, the magnitudes of these coefficients showed evident regional differences. Generally, the higher values (>2.3) were near the Equator and over South Asia, and the lower values (<1.9) were in the Sahel.
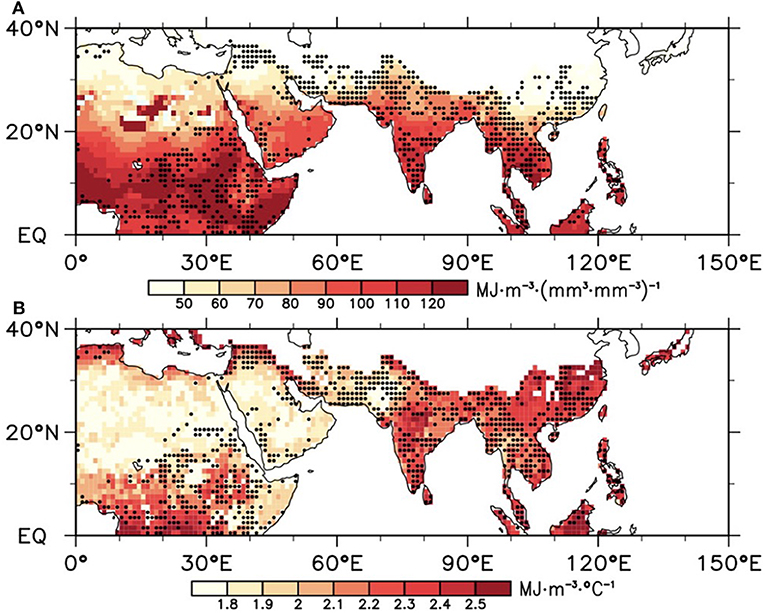
Figure 8. The multiple linear regression (MLR) coefficients of soil enthalpy on (A) soil liquid water (al) and (B) soil temperature (b) at mid-low latitudes. The coefficients in the regions with solid black dots are statistically significant (p < 0.05) after prewhitening.
Figure 9 depicts the relative contributions of soil liquid water and soil temperature to the soil enthalpy trend at mid-low latitudes, which was more spatially heterogeneous than that at mid-high latitudes (Figure 7). The contribution of soil temperature to the soil enthalpy trend exceeded 100% over parts of the Sahel, the Arabian Peninsula, and northern India, with the contribution from soil liquid water being negative. Consistent with Figures 5C,D, the increased soil enthalpy over the IP was mostly caused by increased soil temperature, and the contributions of soil liquid water and soil temperature over CA were ~50%.
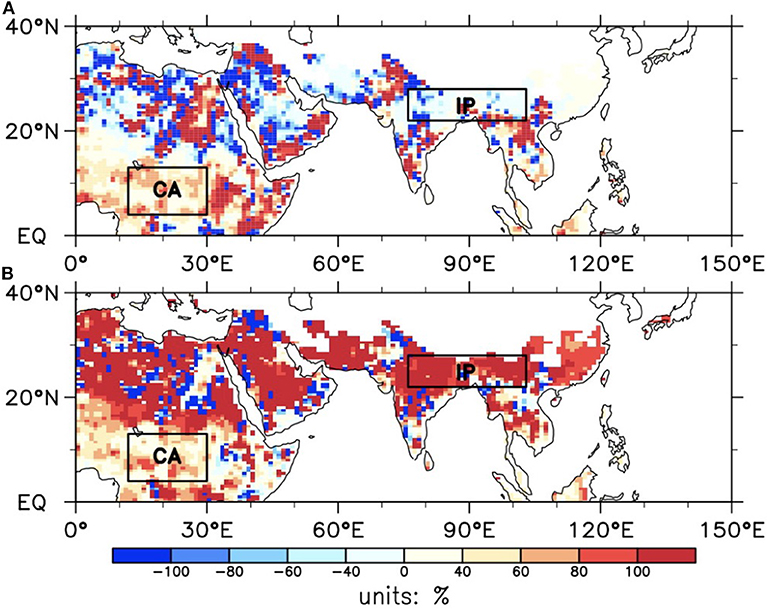
Figure 9. The relative contributions of (A) soil liquid water and (B) soil temperature to soil enthalpy trends at mid-low latitudes.
Conclusion and Discussion
As a single variable, soil enthalpy can be used to define the land surface thermal states through integrating effects from soil moisture (i.e., soil liquid water and soil ice) and soil temperature (intuitively seen from Equation 1). This study used the CLM4.0 outputs to investigate the spatiotemporal characteristics of soil enthalpy variability for the period of 1979–2010. Then, qualitative and quantitative analyses were successively employed for determining the individual impacts of soil liquid water, soil ice, and soil temperature on the trend in soil enthalpy. Results suggested that, despite of an obviously increasing trend of winter soil enthalpy in most (above 70%) of the eastern region of the Northern Hemisphere, the magnitudes were spatially heterogeneous with pronounced energy accumulating over EE, EM, IP, and CA. Furthermore, increases in soil enthalpy closely related to increased soil temperature, decreased soil ice, or increased/decreased soil liquid water for temperatures above/below freezing, while the magnitudes of each factor's impacts existed evidently regional differences, i.e., soil ice and soil temperature were the determinants of soil enthalpy trends at mid-high and mid-low latitudes, respectively. More importantly, a finding in this study was that during the soil water phase change process of melting over Eastern Europe, trends of land surface heat content could be better described by soil enthalpy but not by soil moisture or soil temperature alone.
This study formulated critical basis for subsequently conducting researches on climate effects and predictions using soil enthalpy as a metric of the land surface thermal condition. However, sources of uncertainty remain in our results. The soil is not a closed system, as water can percolate away or evaporate and the change in heat content associated with that evaporation is not properly captured by the soil enthalpy formulation. Due to a lack of soil ice from observations and various reanalysis products (e.g., the Global Land Data Assimilation System version 2.0; GLDAS2.0), computations of soil enthalpy are difficult to date. In this study, we performed an offline simulation for obtaining a suit of land surface parameters (i.e., soil ice, soil liquid water, and soil temperature) with the CLM4.0, and then estimated soil enthalpy over the eastern region of the Northern Hemisphere. Although CLM4.0 model has been applied widely and validated against various assimilation datasets, the potential uncertainties caused by different structures and initial values of the only selected model should be noted. It is in order to reduce potential uncertainties and promote accuracy of our results that cross-validation has been applied on soil liquid water, soil temperature, and estimated soil enthalpy from CLM4.0 and GLDAS2.0 over the unfrozen regions (i.e., south to 40N). Using the GLDAS2.0 products, we have performed the same analyses as those from the CLM4.0 outputs. A similar spatial pattern of soil enthalpy trends is detected between these two datasets, e.g., increased soil enthalpy over IP and CA (Figure 10). As shown in Figure 11, increased soil enthalpy was positively associated with increase in soil temperature over IP but with increases in both the soil liquid water and soil temperature over CA. Based on the Equation (2), the MLR coefficients of soil enthalpy on soil moisture and soil temperature are critical for estimating the relative contributions, and thus, we have shown them in Figure 12. The partial regression coefficients of soil liquid water were positive except for the Tibetan Plateau, with higher values (>100) mainly located at ~10°N, while the higher values (>2.3) for partial regression coefficients of soil temperature were near the Equator and in the southern Asia. Lastly, we recalculated these variables' relative contributions to soil enthalpy, which are demonstrated in Figure 13 that the increased soil enthalpy over the IP mostly was caused by increased soil temperature and the contributions of soil liquid water and soil temperature over CA are comparative.
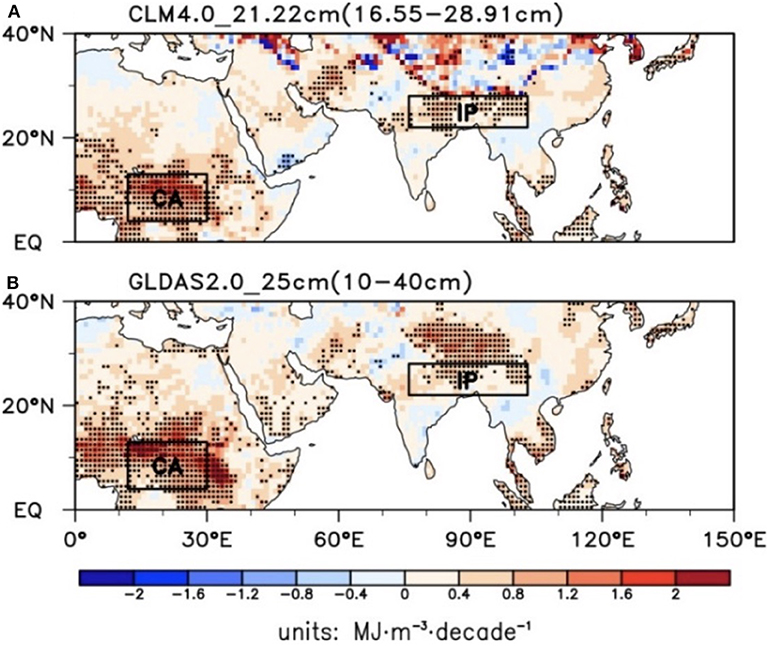
Figure 10. Spatial distribution of linear trend of winter soil enthalpy at mid-low latitudes from 1979 to 2010 (A CLM4.0, B GLDAS2.0), and dotted area is significant (p < 0.05).
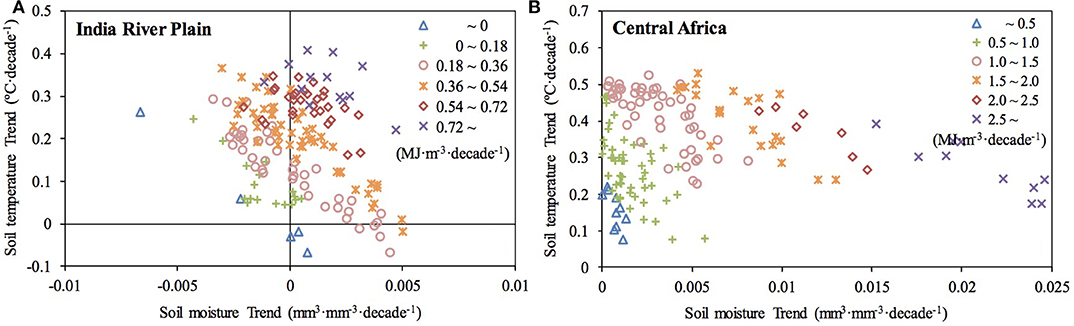
Figure 11. Trends of soil enthalpy vs. soil moisture and soil temperature trends over (A) IP and (B) CA using GLDAS2.0.
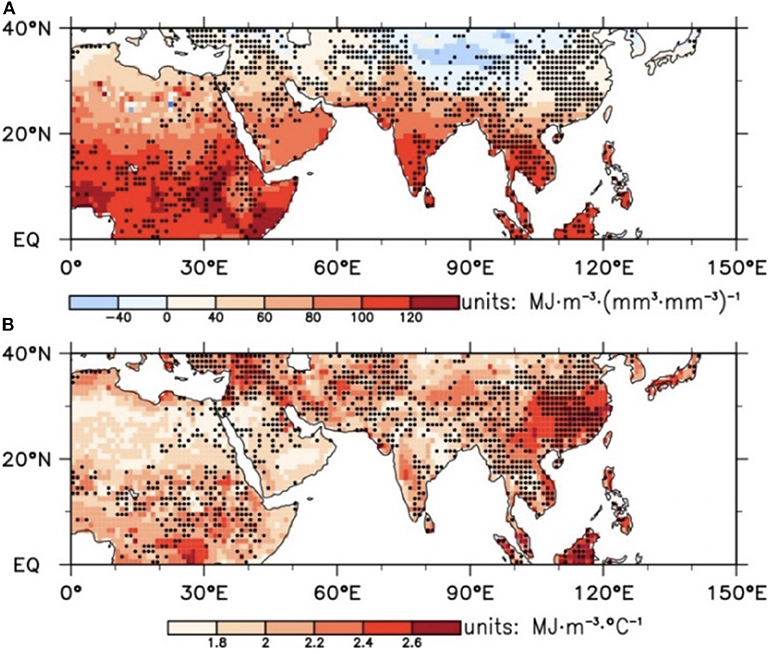
Figure 12. The multiple linear regression (MLR) coefficients of soil enthalpy on (A) soil moisture and (B) soil temperature at mid-low latitudes using GLDAS2.0. The coefficients in the regions with solid black dots are statistically significant (p < 0.05) after prewhitening.
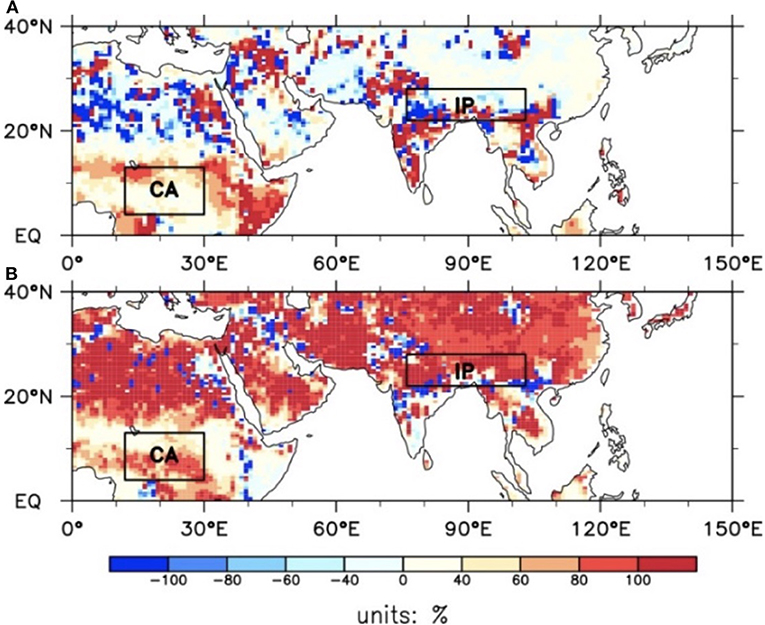
Figure 13. The relative contributions of (A) soil moisture and (B) soil temperature to soil enthalpy trends at mid-low latitudes using GLDAS2.0.
Overall, the validation results showed that there existed high similarities between the CLM4.0 and the GLDAS2.0 on different spatial scales (i.e., each grid of the unfrozen regions and the whole key areas of IP and CA), which indirectly supported our findings to be robust, i.e., to represent soil thermal conditions by soil enthalpy is more reasonable than by only soil moisture or soil temperature alone. It is not likely to ignore the uncertainty caused by only-one model in the present research so that further simulations with various models and original forcing for getting ensemble datasets (i.e., soil ice, soil liquid water, and soil temperature), as well as quantitative uncertainty analysis is most primary. Another aspect of uncertainty comes from the use of multiple linear regression methods on the complex and non-linear soil system. As the linearization shows, soil moisture and soil temperature actually can account for all of the temporal changes in soil enthalpy. Nevertheless, there is no doubt that increased soil temperature, decreased soil ice, or increased/decreased soil liquid water for temperatures above/below freezing generally lead to increased soil enthalpy.
Data Availability Statement
The raw data supporting the conclusions of this article will be made available by the authors, without undue reservation, to any qualified researcher.
Author Contributions
CZ wrote the draft of this manuscript and contributed to the image processing, data collection, and analysis. HC designed the research and guided the analysis process. SS made contribution in language revision and data validation.
Funding
This research was jointly supported by the National Natural Science Foundation of China (Grant No. 41625019), the Science and Technology Innovation 2025 Major Project of Ningbo (2019B10025), and the Natural Science Foundation of Ningbo (2019A610450).
Conflict of Interest
The authors declare that the research was conducted in the absence of any commercial or financial relationships that could be construed as a potential conflict of interest.
References
Abraham, J. P., Baringer, M., Bindoff, N. L., Boyer, T., Cheng, L. J., Church, J. A., et al. (2013). A review of global ocean temperature observations: implications for ocean heat content estimates and climate change. Rev. Geophys. 51, 450–483. doi: 10.1002/rog.20022
Amenu, G. G., Kumar, P., and Liang, X. Z. (2005). Interannual variability of deep-layer hydrologic memory and mechanisms of its influence on surface energy fluxes. J. Clim. 18, 5024–5045. doi: 10.1175/JCLI3590.1
Bonan, G. B., Levis, S., Kergoat, L., and Oleson, K. W. (2002). Landscapes as patches of plant functional types: an integrating concept for climate and ecosystem models. Global Biogeochem. Cycles 16, 5-1-5-23. doi: 10.1029/2000GB001360
Chen, J., and Kumar, P. (2004). A modeling study of the ENSO influence on the terrestrial energy profile in North America. J. Clim. 17, 1657–1670. doi: 10.1175/1520-0442(2004)017<1657:AMSOTE>2.0.CO;2
Cheng, S. J., Guan, X. D., Huang, J. P., Ji, F., and Guo, R. X. (2015). Long-term trend and variability of soil moisture over East Asia. J. Geophys. Res. Atmos. 120, 8658–8670. doi: 10.1002/2015JD023206
Church, J. A., White, N. J., Konikow, L. F., Domingues, C. M., Cogley, J. G., Rignot, E., et al. (2011). Revisiting the Earth's sea-level and energy budgets from 1961 to 2008. Geophys. Res. Lett. 38:L18601. doi: 10.1029/2011GL048794
Cohen, J. L., Furtado, J. C., Barlow, M., Alexeev, V. A., and Cherry, J. E. (2012). Asymmetric seasonal temperature trends. Geophys. Res. Lett. 39:L04705. doi: 10.1029/2011GL050582
Dai, A. (2013). Increasing drought under global warming in observations and models. Nat. Clim. Change 3, 52–58. doi: 10.1038/NCLIMATE1633
Davey, C. A., Pielke, R. A., and Gallo, K. P. (2006). Differences between near-surface equivalent temperature and temperature trends for the Eastern United States - equivalent temperature as an alternative measure of heat content. Global Planet. Change 54, 19–32. doi: 10.1016/j.gloplacha.2005.11.002
Dirmeyer, P. A. (2011). A history and review of the Global Soil Wetness Project (GSWP). J. Hydrometeorol. 12, 729–749. doi: 10.1175/JHM-D-10-05010.1
Fall, S., Diffenbaugh, N. S., Niyogi, D., Pielke, R. A., and Rochon, G. (2010). Temperature and equivalent temperature over the United States (1979-2005). Int. J. Climatol. 30, 2045–2054. doi: 10.1002/joc.2094
Fall, S., Pielke, R. A., Niyogi, D., and Rochon, G. L. (2014). “Climatology: moist enthalpy and long-term anomaly trends,” in Encyclopedia of Natural Resources: Air, ed Y. Wang (New York, NY: Taylor and Francis), 994–1000. doi: 10.1081/E-ENRA-120047641
Foster, G., and Rahmstorf, S. (2011). Global temperature evolution 1979–2010. Environ. Res. Lett. 6:044022. doi: 10.1088/1748-9326/6/4/044022
Hu, Q., and Feng, S. (2004). A role of the soil enthalpy in land memory. J. Clim. 17, 3633–3643. doi: 10.1175/1520-0442(2004)017<3633:AROTSE>2.0.CO;2
Hua, W. J., Chen, H. S., Zhu, S. G., Sun, S. L., Yu, M., and Zhou, L. M. (2013). Hotspots of the sensitivity of the land surface hydrological cycle to climate change. Chin. Sci. Bull. 58, 3682–3688. doi: 10.1007/s11434-013-5846-7
Koster, R. D., Dirmeyer, P. A., Guo, Z., Bonan, G., Chan, E., Cox, P., et al. (2004). Regions of strong coupling between soil moisture and precipitation. Science 305, 1138–1140. doi: 10.1126/science.1100217
Lawrence, D. M., Oleson, K. W., Flanner, M. G., Thornton, P. E., Swenson, S. C., Lawrence, P. J., et al. (2011). Parameterization improvements and functional and structural advances in version 4 of the community land model. J. Adv. Model. Earth Syst. 3:M03001. doi: 10.1029/2011MS00045
Lawrence, D. M., and Slater, A. G. (2008). Incorporating organic soil into a global climate model. Clim. Dyn. 30, 145–160. doi: 10.1007/s00382-007-0278-1
Li, G., Ren, B., Zheng, J., and Yang, C. (2010). Net air–sea surface heat flux during 1984–2004 over the North Pacific and North Atlantic oceans (10°N−50°N): annual mean climatology and trend. Theor. Appl. Climatol. 104, 387–401. doi: 10.1007/s00704-010-0351-2
Li, M., and Ma, Z. (2012). Soil moisture-based study of the variability of dry-wet climate and climate zones in China. Chin. Sci. Bull. 58, 531–544. doi: 10.1007/s11434-012-5428-0
Li, Q., and Sun, S. (2006). Development of frozen soil model. Adv. Earth Sci. 21, 1339–1349. (in Chinese). doi: 10.11867/j.issn.1001-8166.2006.12.1339
Li, X., and Zhang, H. (2014). Soil moisture effects on sand saltation and dust emission observed over the Horqin Sandy Land Area in China. J. Meteor. Res. 28, 444–452. doi: 10.1007/s13351-014-3053-3
Li, Y., Liu, S., Wang, S., Miao, Y., and Chen, B. (2014). Comparative study on methods for computing soil heat storage and energy balance in arid and semi-arid areas. J. Meteor. Res. 28, 308–322. doi: 10.1007/s13351-014-3043-5
McDougall, T. J. (2003). Potential enthalpy: a conservative oceanic variable for evaluating heat content and heat fluxes. J. Phys. Oceanogr. 33, 945–963. doi: 10.1175/1520-0485(2003)033<0945:PEACOV>2.0.CO;2
Murray, E. J. (2002). An equation of state for unsaturated soils. Can. Geotech. J. 39, 125–140. doi: 10.1139/t01-087
North, G. R., and Erukhimova, T. L. (2009). Atmospheric Thermodynamics. New York: Cambridge University Press.
Oleson, K. W., Lawrence, D. M., Bonan, G. B., Flanner, M. G., Kluzek, E., Lawrence, P. J., et al. (2010). Technical Description of Version4.0 of the Community Land Model (CLM). NCAR Technical Note-478+STR (Boulder, Co). doi: 10.5065/D6FB50WZ
Palmer, M. D., and McNeall, D. J. (2014). Internal variability of Earth's energy budget simulated by CMIP5 climate models. Environ. Res. Lett. 9:034016. doi: 10.1088/1748-9326/9/3/034016
Peterson, T. C., Willett, K. M., and Thorne, P. W. (2011). Observed changes in surface atmospheric energy over land. Geophys. Res. Lett. 38:L16707. doi: 10.1029/2011GL048442
Pielke, R. A. (2003). Heat storage within the Earth system. Bull. Amer. Meteor. Soc. 84, 331–335. doi: 10.1175/BAMS-84-3-331
Pielke, R. A., Davey, C., and Morgan, J. (2004). Assessing “global warming” with surface heat content. Eos, Trans. Amer. Geophys. Union 85, 210–211. doi: 10.1029/2004EO210004
Rogers, J. C., Wang, S. H., and Coleman, J. S. M. (2007). Evaluation of a long-term (1882-2005) equivalent temperature time series. J. Clim. 20, 4476–4485. doi: 10.1175/JCLI4265.1
Seneviratne, S. I., Corti, T., Davin, E. L., Hirschi, M., Jaeger, E. B., Lehner, I., et al. (2010). Investigating soil moisture–climate interactions in a changing climate: a review. Earth Sci. Rev. 99, 125–161. doi: 10.1016/j.earscirev.2010.02.004
Sheffield, J., Goteti, G., and Wood, E. F. (2006). Development of a 50-year high-resolution global dataset of meteorological forcings for land surface modeling. J. Clim. 19, 3088–3111. doi: 10.1175/JCLI3790.1
Shrestha, M., Koike, T., Hirabayashi, Y., Xue, Y. K., Wang, L., Rasul, G., et al. (2015). Integrated simulation of snow and glacier melt in water and energy balance-based, distributed hydrological modeling framework at Hunza River Basin of Pakistan Karakoram region. J. Geophys. Res. Atmos. 120, 4889–4919. doi: 10.1002/2014JD022666
Stephens, G. L., Li, J. L., Wild, M., Clayson, C. A., Loeb, N., Kato, S., et al. (2012). An update on Earth's energy balance in light of the latest global observations. Nat. Geosci. 5, 691–696. doi: 10.1038/ngeo1580
Sun, S., Jin, J., and Xue, Y. (1999). A simple snow-atmosphere-soil transfer model. J. Geophys. Res. Atmos. 104, 19587–19597. doi: 10.1029/1999JD900305
Sun, S. F., Yan, J. F., Xia, N., and Li, Q. (2008). The model study of water mass and energy exchange between the inland water body and atmosphere. Sci. China Ser. G Phys. Mech. Astron. 51, 1010–1021. doi: 10.1007/s11433-008-0121-7
Sutton, R. T., Dong, B., and Gregory, J. M. (2007). Land/sea warming ratio in response to climate change: IPCC AR4 model results and comparison with observations. Geophys. Res. Lett. 34:L02701. doi: 10.1029/2006GL028164
Tang, M., Sun, S., Zhong, Q., and Wu, S. (1982). The energy variation of the underlying surface and the changes of the weather and climate. Plateau Meteor. 1, 24–34. (in Chinese)
Tsonis, A. A. (2007). An Introduction to Atmospheric Thermodynamics. New York, NY: Cambridge University Press.
von Schuckmann, K., Palmer, M. D., Trenberth, K. E., Cazenave, A., Chambers, D., Champollion, N., et al. (2016). An imperative to monitor Earth's energy imbalance. Nat. Clim. Change 6, 138–144. doi: 10.1038/nclimate2876
Xue, Y. K., Vasic, R., Janjic, Z., Liu, Y. M., and Chu, P. C. (2012). The impact of spring subsurface soil temperature anomaly in the western U.S. on North American summer precipitation: a case study using regional climate model downscaling. J. Geophys. Res. Atmos. 117:D11103. doi: 10.1029/2012JD017692
Zhang, J. Y., Wu, L. Y., and Dong, W. J. (2011). Land-atmosphere coupling and summer climate variability over East Asia. J. Geophys. Res. Atmos. 116:D05117. doi: 10.1029/2010JD014714
Zhang, T., Barry, R. G., Gilichinsky, D., Bykhovets, S. S., Sorokovikov, V. A., and Ye, J. (2001). An amplified signal of climatic change in soil temperatures during the last century at Irkutsk, Russia. Clim. Change 49, 41–76. doi: 10.1023/A:1010790203146
Zhang, Z., Zhou, X., Li, W., and Sparrow, M. (2003). Calculation of the energy budget for heterogeneous land surfaces. Earth Interact. 7, 1–12. doi: 10.1175/1087-3562(2003)007<0001:COTEBF>2.0.CO;2
Zhao, C., Chen, H., and Sun, S. (2018a). Spatiotemporal characteristics of soil enthalpy anomaly persistence in Eurasia. J. Meteor. Sci. 38, 19–27 (in Chinese).
Zhao, C., Chen, H., and Sun, S. (2018b). Evaluating the capabilities of soil enthalpy, soil moisture, soil temperature in predicting seasonal precipitation. Adv. Atmos. Sci. 35, 445–456. doi: 10.1007/s00376-017-7006-5
Keywords: long-term trend, soil enthalpy, soil moisture, soil temperature, quantitative contributions
Citation: Zhao C, Chen H and Sun S (2020) Long-Term Trend of Land Surface Thermal States and Its Spatial Variability in the Eastern Region of the Northern Hemisphere. Front. Earth Sci. 8:126. doi: 10.3389/feart.2020.00126
Received: 20 February 2020; Accepted: 02 April 2020;
Published: 12 May 2020.
Edited by:
Wen Chen, Institute of Atmospheric Physics (CAS), ChinaCopyright © 2020 Zhao, Chen and Sun. This is an open-access article distributed under the terms of the Creative Commons Attribution License (CC BY). The use, distribution or reproduction in other forums is permitted, provided the original author(s) and the copyright owner(s) are credited and that the original publication in this journal is cited, in accordance with accepted academic practice. No use, distribution or reproduction is permitted which does not comply with these terms.
*Correspondence: Haishan Chen, aGFpc2hhbkBudWlzdC5lZHUuY24=