 Bin Chen1,2*
 Jie-Ming Hu1,2
- 1Hunan Provincial Key Laboratory of Geomechanics and Engineering Safety, Xiangtan University, Xiangtan, China
- 2College of Civil Engineering and Mechanics, Xiangtan University, Xiangtan, China
Granular materials undergo particle crushing under the long-term load, which changes the particle size distribution (PSD) of the material, and then affects its mechanical properties, so the problem of its long-term stability issues is outstanding. Previous research indicated that the crushing characteristics of coral sand particles have an effect on the creep under constant load. In order to reveal the response law of particle crushing over time during the creep process of coral sand, a series of one-dimensional confined compression tests under different stresses were carried out on coral sand taken from an area near an island and reef in the South China Sea. Creep behavior, particle fractal behavior, and particle crushing evolution during the creep process of coral sand were studied. The test results show that the creep of coral sand under different stress conditions exhibits significant non-linear decay creep characteristics. The power function can be used to mathematically describe the strain–time curve of coral sand. Coral sands with different initial distributions show more stringent self-similarity under the normal stress levels, and their fractal behavior was in the development stage. At higher stress levels, they show good self-similarity and significant fractal behavior. Under the same stress conditions, the crushing amount and fractal dimension of coral sand are larger than that of quartz sand. The process before the coral sand creep reaches stability was closely related to the amount of particle crushing. The particle crushing PSD development has a fractal trend and can be described by a gradually increasing fractal dimension and the relative particle crushing rate also shows a non-linear attenuation characteristic with time.
Introduction
Coral sand usually refers to a special geotechnical medium rich in calcium carbonate or other insoluble carbonates (debris of marine organisms that are deposited in situ or deposited near site), the mineral component is mainly calcium carbonate. It is often used as an ideal material for island reef reclamation and a natural foundation material in the construction of offshore infrastructure (Hassanlourad et al., 2008). Compared with general terrestrial and marine sediments, coral sand has special properties such as high porosity (rich in internal pores), irregular shape, low particle strength and easy to break, and easy cementation of particles, which makes its engineering mechanical characteristics have obvious differences (Zhang et al., 2005; Zhao et al., 2017a, 2019a). At present, a great deal of research work has been carried out on its macro and micro structural characteristics (Jang et al., 2017), static properties (Zhang et al., 2009), and mechanical behavior under explosion impact load (Xu et al., 2012; Zhao et al., 2017b), and fruitful research results have been obtained. During the actual construction of the island and reef project, under the long-term effect of the additional stress of the structure, the process of the foundation settlement deformation increasing with time was regarded as creep, which will bring serious problems to the use of the structure. Therefore, controlling the medium and long-term settlement and deformation of the foundation was one of the key issues to ensure the long-term stability and sustainable development of island and reef projects (Coop and Lee, 1993). In recent years, on the basis of fractures during the rheology of the rock (Zhao et al., 2016, 2017c, 2019b), more and more scholars have studied the creep of sand, which shows that the process of creep was often accompanied by particle crushing. Ye et al. (2019) carried out triaxial creep tests under different confining pressures on South China Sea coral sands with different dry densities, and found that the volume change trend during creep depends on whether the volume shrinkage was completed during the loading stage before creep occurs. Karimpour and Lade (2013) conducted triaxial creep tests on Virginia sand under different confining pressures. The results showed that the creep of sand under low confining pressure was mainly due to the reorganization and slip of the particles, while the creep of sand was difficult to stabilize under high confining pressure, and the sand particles were crushed during the creep process. Lv et al. (2017) pointed out that during the triaxial shear creep process, quartz sand exhibited dilatancy characteristics, while coral sand always exhibited shear shrinkage characteristics, and the main reason for the large creep deformation of coral sand was that the edges and corners of irregular particles were intertwined with each other, and the grinding and fracture in the particle crushing characteristics occur under continuous stress (fracture occurs under high stress). Lade et al. (2010) aimed at the time effect of broken coral sand deformation, and it was proposed that particle crushing can reshape the structure. The effects of particle crushing on the stress relaxation of coral sand rheological properties under different confining pressures, initial deviator stresses, and strain rates were studied. However, the development process of particle crushing state during creep and the influence of relative crushing rate on creep are not considered.
In view of the particle crushing characteristics of materials, classical soil mechanics theory believes that soil particles cannot be compressed and crushed, and its deformation is due to the discharge of gas and liquid from the soil pores and the movement and reorganization of particles (Zhang et al., 2003). In fact, during the medium- and long-term creep process of the soil, the particles will be partially or wholly crushed under the long-term stress. The granular crushing characteristics of different granular materials are significantly different. Previous data show that quartz sand usually crush under the stress of about 12.8 MPa, while coral sand will break up under the constant stress level (Wang et al., 1997). Particle size distribution (PSD) before and after particle crushing plays an important role in the study of quantitative particle crushing. Domestic and foreign scholars have studied the evolution of PSD during the crushing process and proposed different particle crushing indicators to measure the overall crushing degree of the sample (Lee and Farhoomand, 1967; Marsal, 1973; Hardin, 1985; Shen, 1985). Hardin (1985) assumes that particles do not continue to break after they had broken to 0.074 mm and that all particles had broken to 0.074 mm at the end of crushing. The value 0.074 was regarded as the limit particle size, and the relative particle crushing index Br was widely accepted. Wang et al. (2019) developed a triaxial drainage cycle shear tester for coral sand and found that the calcareous sand produced few particles during the consolidation process. However, significant particle crushing was generated under the subsequent cyclic shear and described by Hardin’s relative particle crushing index. Karimpour and Lade (2013) introduced the relative particle breakage index Br defined by Hardin to quantify the degree of particle crushing after calcareous sand creep and found that there was a linear positive correlation between the energy input and the relative particle crushing index, but no research has been done on the evolutionary law of particle crushing during creep and its effect on creep. At present, a large number of experiments showed that the granular material will tend to have fractal distribution after crushing, and reach the limit fractal distribution when the crushing rate was large enough (Sammis et al., 1987; Luzzanil and Coop, 2002; Coop et al., 2004). On this basis, Einav (2007) revised the final fractal distribution model of the PSD to a particle size fractal distribution model and redefined the relative particle crushing rate, which was more in line with the actual particle crushing situation. However, there were few studies on the dynamic evolution and fractal behavior of PSD during particle crushing. Zhang et al. (2015) studied the fractal behavior of quartz sand by confined compression test under high pressure stress and found that with the development of particle crushing, quartz sand with different initial distributions and particle sizes tended to have self-similar fractal distribution. Coop et al. (2004) performed a ring shear test on calcareous sand with a single particle size group, and the results showed that the gradation curve would tend to be stable at high strain levels.
In the course of continuous particle crushing of any initially uniformly distributed granular soil, there is a process that tends to the limit fractal distribution. The evolutionary law of particle fragmentation during the creep process is a concentrated reflection of the complexity of the particle fragmentation process. The study of the creep process of coral sand particles of a single particle size group is the basis for the study of the creep of multi-particle group coral sand (Tong et al., 2015). At present, domestic and foreign researches on particle crushing mainly focus on the factors that affect particle crushing. The development degree of particle crushing increases significantly with the increase in stress level, so most of the time, effects of particle crushing under low and medium stress are ignored. The study of particle fragmentation needs to consider the following three key issues as the following: how to use a simple and reasonable variable to represent the change in material gradation to describe the degree of particle fragmentation, and then introduce it into the strength criterion and the constitutive model; how to describe the evolution law of particle fragmentation; how to use the broken variables affecting the mechanical properties of materials. Therefore, in this manuscript, for one-dimensional creep and confined compression tests of coral sands of different single particle size groups at different end times, the evolution and fractal behavior of PSD distribution of coral sand particles at constant stress and different creep times were analyzed. The creep characteristics and fractal behavior of PSD under different stress levels had been analyzed, and it was found that fractal dimension was introduced to represent the change in coral sand gradation to describe the degree of particle fragmentation. The relative particle fragmentation rate after perfection of fractal theory was used to describe the particle fragmentation evolution law and to reveal the impact of particle fragmentation development on creep.
Materials and Test Methods
Basic Characteristics of the Sample
The test coral sand sample was taken from an island reef in the South China Sea. It was a loose, uncemented coral debris marine sediment, which was off-white in color with pink impurities. The composition of the sand sample was analyzed by D/MAX-2500/PC X-ray polycrystalline powder diffractometer made in Japan, and it was found that calcium carbonate content of the sample up to 96.51%. According to the requirements of sample size and particle size in the geotechnical test specification, particles with a particle size larger than 5 mm are excluded. After the initial screening, 500 g of sand samples were washed with water and desalted, and then dried in an oven at 105°C for 24 h. After cooling, they were sieved with a geotechnical standard sieve, and the mass of each particle size group was retained (shown in Figure 1). Affected by biological genesis, coral sand particles are mainly composed of biological fossils such as shells and coral debris, and have a variety of shapes, including lumps, flakes, branches, and cones are common. In many cases, their thickness is small compared with the other two dimensions, so it is necessary to consider the effect of the shape of the particles on the test results during the test. Therefore, when selecting samples, large-scale irregular coral sand larger than 2.0 mm was eliminated, and more regular particles were left as far as possible to facilitate standard sieve screening. The sand particles were controlled in a smaller particle size range to perform the test to reduce the effect of sample preparation errors. Before the test, the basic physical parameters of the coral sand samples were measured as shown in Table 1. D10, d30, and d60 are effective particle size, continuous particle size, and limited particle size, respectively. The maximum and minimum porosity ratios are 1.14 and 0.78, the specific gravity is 2.77, the curvature coefficient of the sample satisfies the condition Cc = 1–3, but does not meet the condition of the non-uniformity coefficient Cu > 5, so it is a poorly graded medium sand.
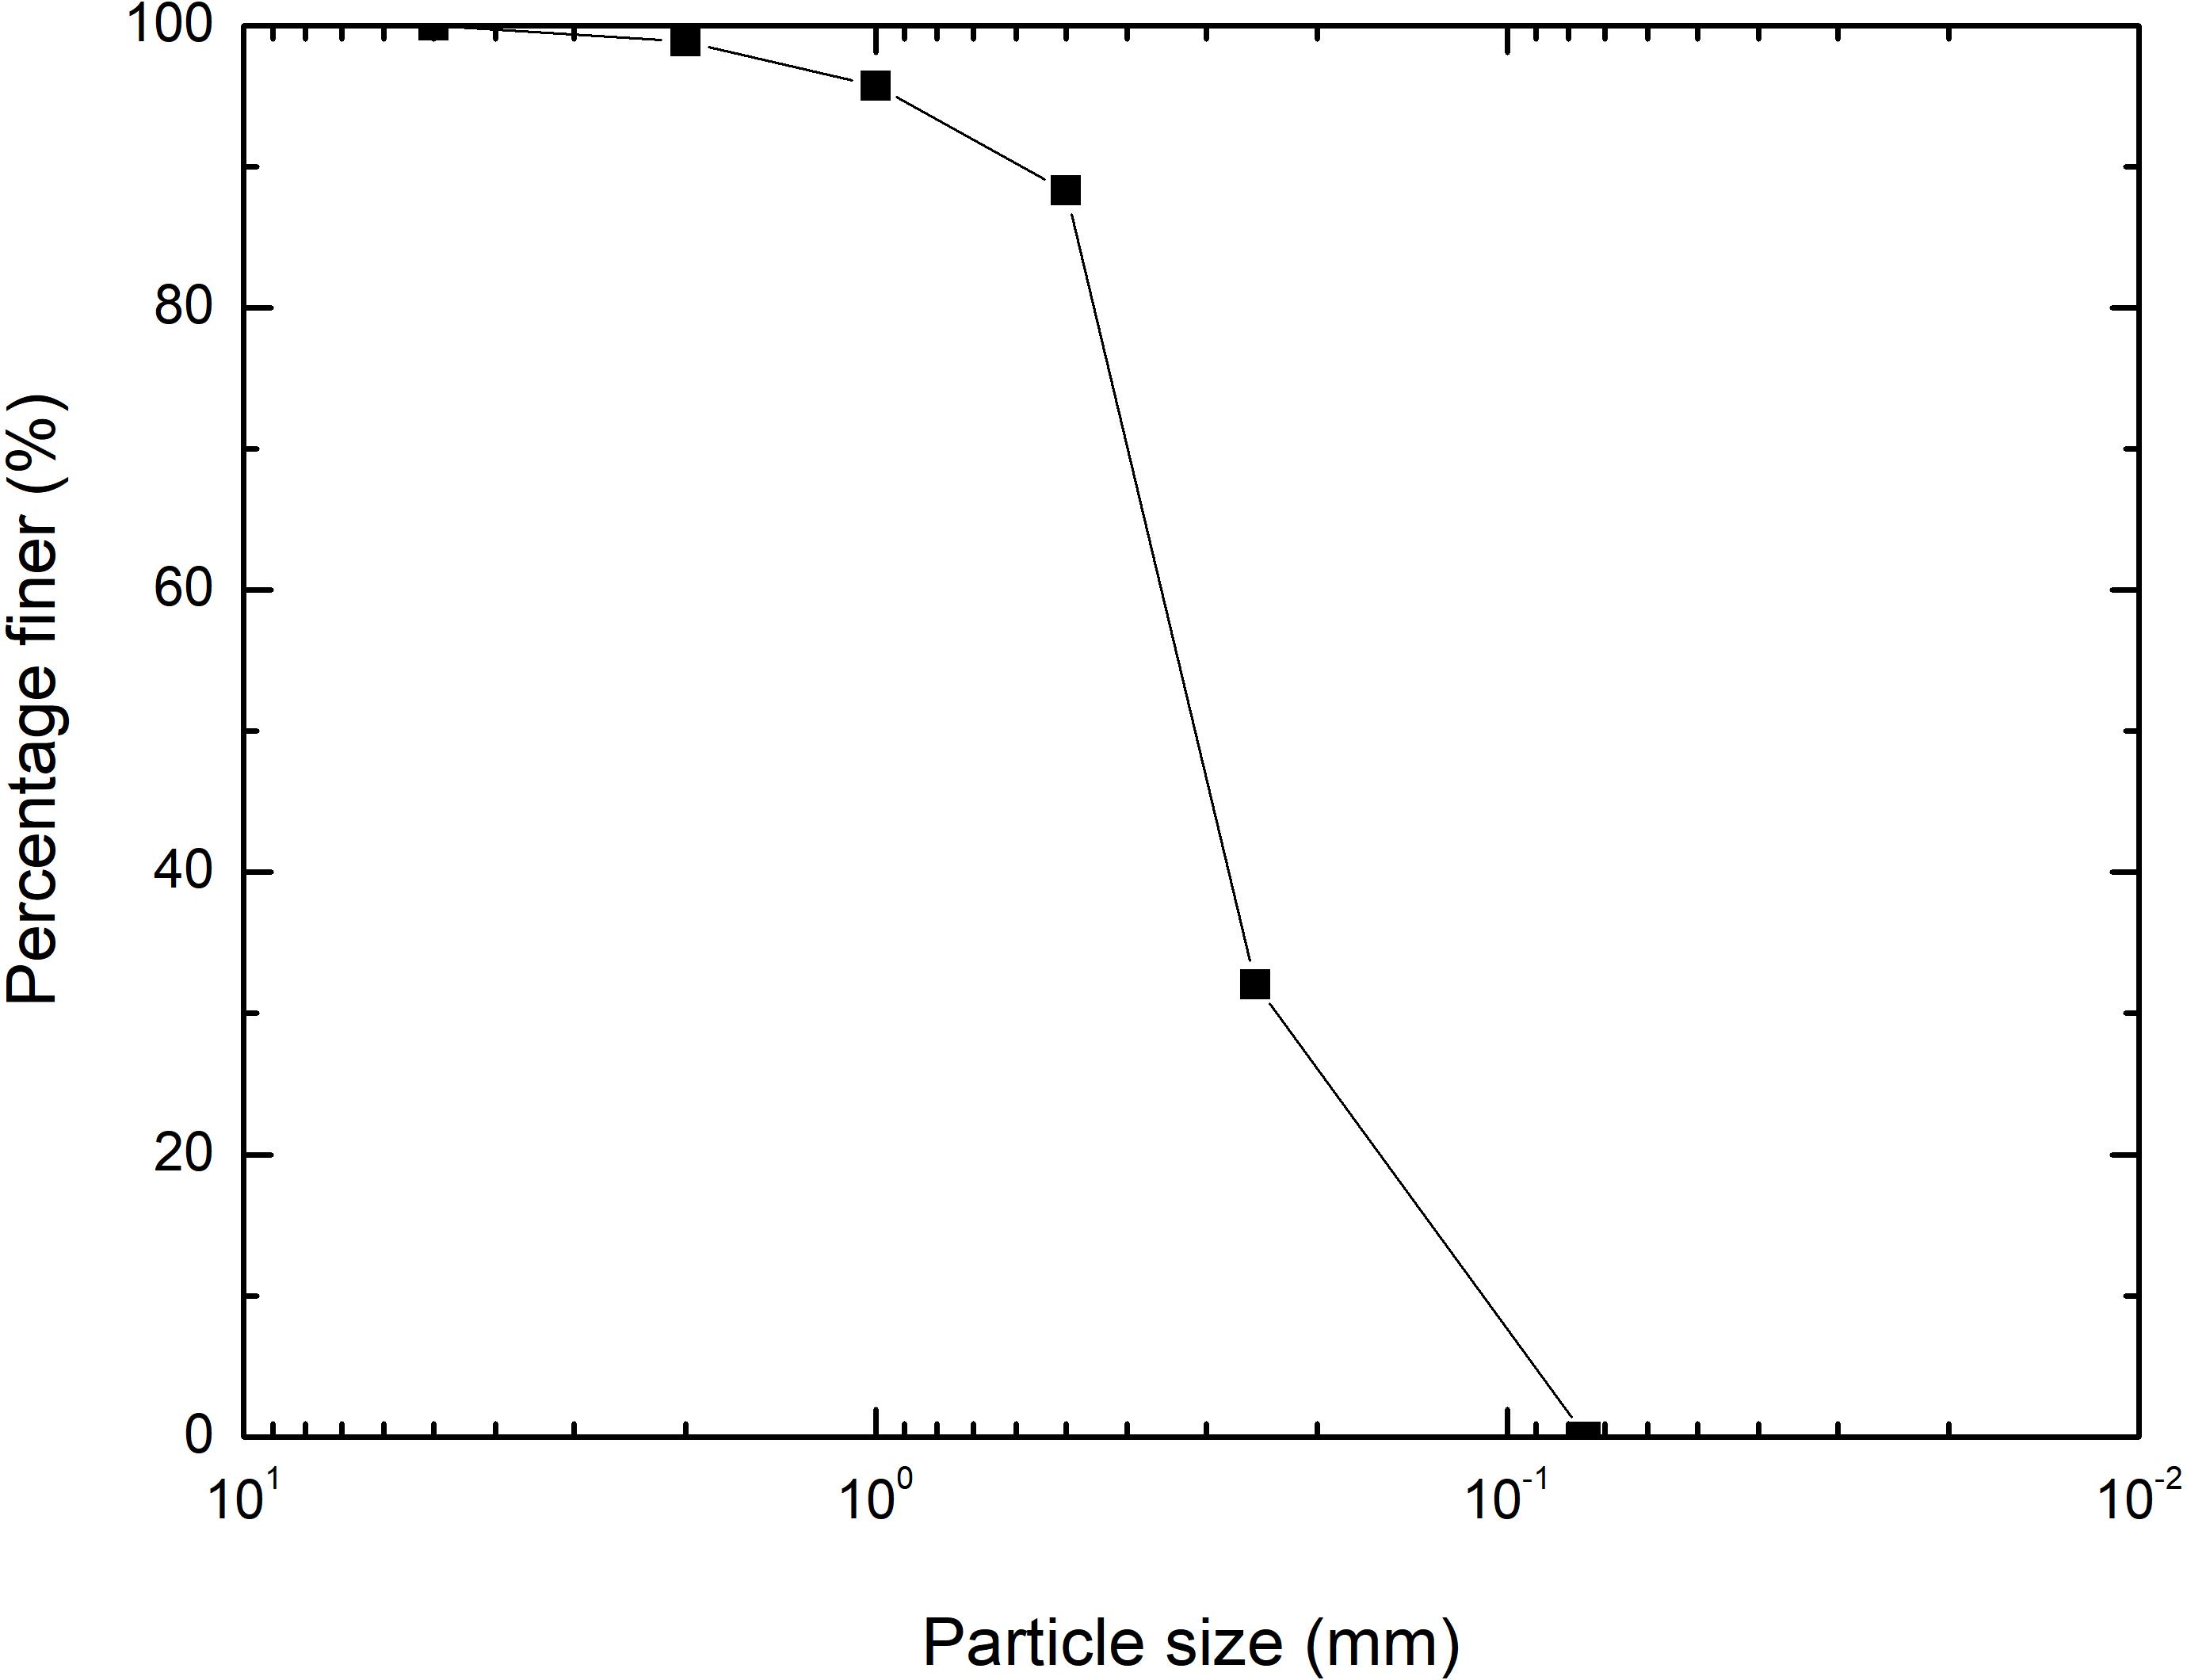
Figure 1. Particle size distribution of sample.
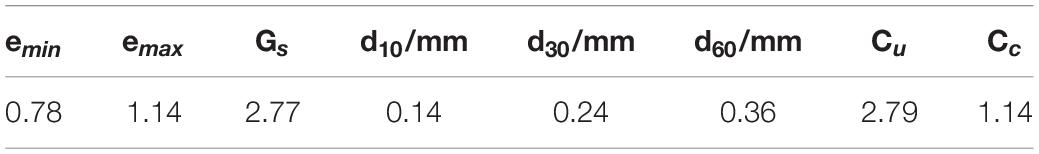
Table 1. Basic physical parameters of sample.
Test Methods
This experiment studies the dynamic development of particle crushing during the one-dimensional creep of coral sand and the effect of particle crushing on creep. There were four groups of single-grained coral sand with main particle sizes of 0.25–0.5 mm, 0.5–1.0 mm, 1.0–2.0 mm, and 2.0–5.0 mm. The first three groups of single-grained coral sand were subjected to confined compression test and one-dimensional compression creep test, and 2.0–5.0 mm of coral sand was subjected to confined compression test. At present, most of the existing studies on coral sands focus on the transient behavior of particles, and the research on the effect of particle fragmentation on long-term mechanical behavior of materials was relatively rare. In combination with previous research (Chen et al., 2019), it was found that the breakage of coral sand particles under a constant stress level has a certain timeliness, but the timeliness gradually weakens with increasing stress. Therefore, based on this, the time effect of particle breakage development and the effect of particle breakage on the long-term mechanical behavior of materials during the creep process under low stress level (less than 4 MPa) were studied. The Instrument of Soil tests were used in the production of a single-lever-type WG high-pressure consolidation triple meter, with a maximum axial stress of 4,000 kPa, using the weight loading, a sample size of 61.8 mm diameter, high 20 mm. During the sample preparation, coral sand of the same quality was weighed each time when making the sand specimen. The falling sand method was used to maintain a constant falling distance through the funnel: Inject the coral sand into the container of the consolidation instrument twice, and compact the coral sand to a predetermined height with a stick to ensure the uniformity and consistency of the soil sample. The 0.25–0.5 mm, 0.5–1.0 mm, and 1.0–2.0 mm coral sands were loaded separately. The single particle size sample was subjected to one-dimensional compression creep tests with creep times of 2, 7, 14, 28, and 56 days under the loads of 50, 100, 200, 400, and 800 kPa, respectively. In this study, two sets of tests were designed. Each set of five parallel samples was tested to ensure the consistency and repeatability of the samples through creep deformation. Two groups started to creep at the same time, and one group carefully took samples for particle analysis to obtain PSD curves after the end of each creep time node. Cao and Ye (2019) conducted triaxial creep tests on calcareous sand under different confining pressures and found that under constant stress less than its breaking strength, attenuated creep of saturated calcareous sand, the deformation increased with time. However, the deformation rate continues to decrease until the deformation is stable, conforming to the classic Mesri creep model and eventually converging. As for the creep stability standards, there is no specification for it. According to the test situation and combined with Ye et al. (2019) to carry out a triaxial creep test on calcareous sand. In this manuscript, the stability criterion is set to observe that the axial deformation of the sample is less than 0.005 mm for five consecutive days, and the creep deformation is considered to be stable. After stress loading, the axial deformation was recorded in the order of 6 s, 1 min, 5 min, 10 min, 15 min, 30 min, 1 h, 2 h, 4 h, 8 h, 12 h, and 24 h. After 24 h, it was changed to regular recording every day. Avoid fractal behavior that is too weak under normal stress. A confined compression test with a creep duration of 56 days under high stress was carried out on 2.0–5.0 mm coral sand. The most significant manifestation of particle crushing is the change in the PSD curve before and after the test. At present, there is no method to measure the PSD of the sample during the creep process, so after the confined compression test at different creep times of creep was completed in this study, the sample was carefully taken out for sieving for particle size analysis, and the PSD curve was drawn. In this study, a total of 160 specimens were tested for creep and standard sieved for particle size analysis, which took about 200 days. The specific test-loading scheme is shown in Table 2, and the coral sand samples of each group are shown in Figure 2.
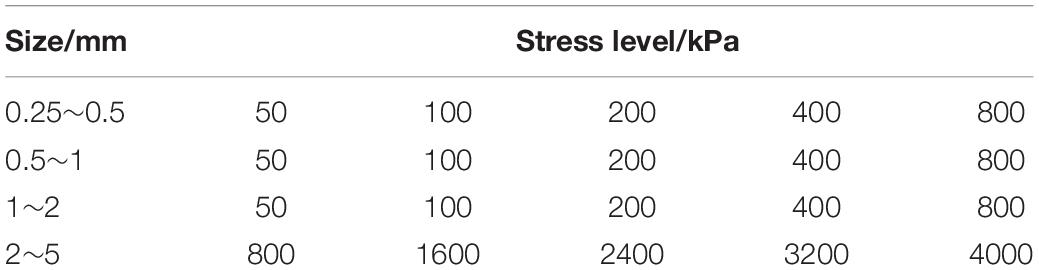
Table 2. Test plan for the coral sand.
Figure 2. (A–C) Selected more obvious SEM images of coral sand.
Particle Crushing Fractal Model
PSD Fractal Model
Under load, particles of granular materials will crush and change the PSD, which will affect its mechanical properties, including quartz sand, slag, and glass balls. Experimental evidence shows that with increasing particle crushing, any initially distributed particles will tend to have a self-similar fractal distribution (Hagerty et al., 1993). Mandelbrot (1982) believes that granular materials in nature will not continue to be destroyed indefinitely and will eventually reach the limit distribution and maintain the same scale. Turcotte’s (1986) research on the concept of meteorite particle discovery fractal provides a method to quantify the process of scale invariance. The PSD fractal relationship is defined by the relationship between the cumulative number of soil particles and particle size:
In the formula, r is a scale describing the particle size, and N (r > R) is the number of particles with a particle size larger than R; D is the fractal dimension describing the fractal behavior, and the range is 0–3; C∗ is a coefficient that takes into account the volume increase of the particles and is related to the fractal dimension D.
In the PSD analysis of most granular crushed materials, the formula cannot be directly applied because the number of particles with a specific particle size and the size of the particle size cannot be directly obtained through experiments (Tyler and Wheatcraft, 1992). At present, the PSD obtained after the granular rock and soil material is crushed is usually sieved. Within the range of particle sizes examined, the pore size is divided into sieving layers. When described, it is expressed as the mass of particles with different size intervals in a certain size range (Yang et al., 1993). If we ignore the differences in the relative density and shape of the soil grains between the grain sizes, after integrating and normalizing the particle size of an interval, Tyler and Wheatcraft (1992) proposed a PSD fractal model represented by the relationship between the cumulative mass of soil particles and particle size:
In the formula, r represents the size of the selected particle size, M (r < di) represents the cumulative mass of particles smaller than di (consistent with the commonly used PSD curve), MT is the total mass of the particles, and di is the sieve aperture of the i-th layer. Assume the minimum and maximum particle diameters of the soil particles to be dm and dM, α = 3−D, where D is the fractal dimension, and the value range is 0–3.
The fractal model represented by formula (2) has been widely used in PSD of rock and soil. Formally, the result of formula (2) is the same as that of formula (1), but analysis shows that formula (2) has strict self-similarity fractal behavior, and a particle density range is assumed in the formula, which is more reasonable for many uniformly distributed granular materials. In a given particle size range dm–dM, PSD curves at semi-logarithmic and double-logarithmic coordinates according to different fractal dimensions are drawn, as shown in Figure 3. It can be seen that the strictly self-similar PSD curve is a cluster of concave curves on the semi-logarithmic axis and a cluster of straight lines on the double-log axis. As the particle crushing intensifies, the D value continues to increase. In this study, formula (1) is used to describe the fractal behavior of PSD during the creep of coral sand, and the ultimate limit PSD curve of particle crushing is represented by a PSD fractal model considering the fractal dimension. When most granular materials are broken and stable, their fractal dimension is between 2.0 and 2.8, and the degree of particle crushing increases as the fractal dimension increases (Steacy and Sammis, 1991): The final fractal dimension of fault mud is 2.6 ± 0.15 (Marone and Scholz, 1989), the fractal dimension of quartz sand is 2.2–2.5 (Lu et al., 2003), and Zhang Jiru measured the fractal dimension of the Yangtze River gravel to be 2.4 (Zhang et al., 2015).
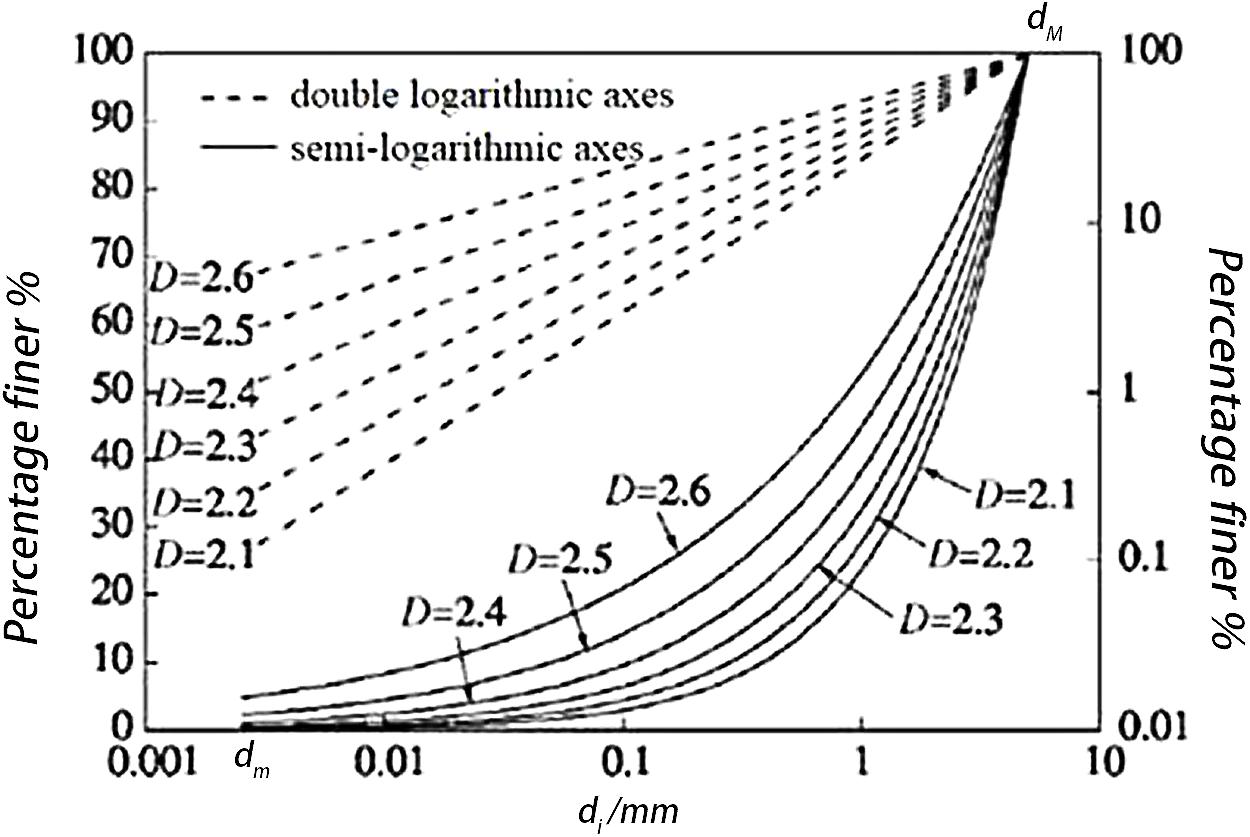
Figure 3. PSD fractal curve.
Relative Particle Crushing Ratio
The granular material changes the PSD of the initial particles under the load, and the gradation curve changes before and after crushing. In order to quantify the degree of particle crushing, scholars at home and abroad have carried out a lot of research and usually describe it quantitatively as the change of a characteristic particle size before and after crushing in PSD. Lee and Farhoomand (1967) defined B15 as the ratio of the characteristic particle diameter d15 before and after crushing. Lade et al. (1996) defined B10 as the difference between the ratio of 1 and the effective particle size d10 before and after the particle was crushed. The Chinese Academy of Water Resources and Hydropower Sciences (Shen, 1985) selected the difference between the characteristic particle size d60 before and after crushing to define B60. Marsal (1973) defined the sum of the absolute values of the differences in the content of each grain group before and after crushing as Bg. Although the above particle crushing metrics are simple and easy to calculate, B10, B15, and B60 only measure the overall crushing degree based on the changes before and after the crushing of a single characteristic particle size; metrics are discontinuous and poorly integrated. Although Bg includes the changes before and after the destruction of each grain group, the sum is not enough to reflect the actual changes of each grain group, so this kind of crushing index is not universal. Hardin (1985) assumes that the particles do not continue to break after they are broken to 0.074 mm and that all particles are broken to 0.074 mm at the end of the break. Considering 0.074 mm as the ultimate particle size of the particles after broken the crushing potential Bp and the total crushing amount are defined as Bt, which proposed the relative particle crushing rate Br to measure the degree of particle crushing. However, some experimental studies have shown that the actual particle crushing process does not continue to crush continuously, and fractal distribution often occurs, showing strict self-similarity (Sammis et al., 1987). Einav (2007) modified the limit distribution at the end of particle crushing based on the PSD fractal model proposed by Tyler and Wheatcraft (1992) into a fractal distribution Fu(d) = (d/dM)α, where α = 3−D, and D is the fractal dimension; The definition of broken potential was changed, and an improved form of Hardin’s indicator was proposed. The definition of the two indicators was compared as shown in Figure 4. In this paper, the Einav index, which is more in line with actual conditions, is used to describe the amount of particle crushing that affects creep deformation during the coral sand creep process, and the response of the two indexes to the fractal behavior and creep state of PSD over time is compared.
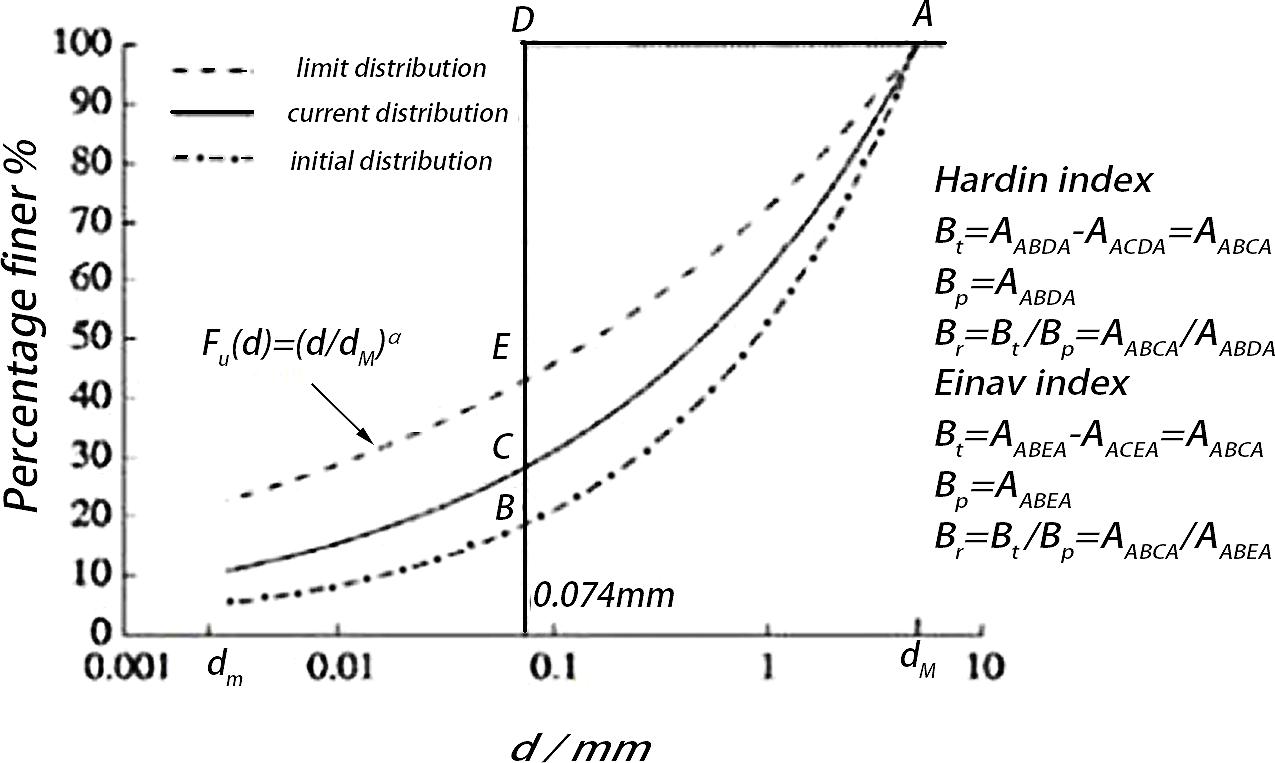
Figure 4. Definition of breakage factors.
Results and Discussion
Creep Characteristics
Figure 5 is an axial strain–time curve chart of three groups of single particle size coral sand of 0.25–0.5 mm, 0.5–1.0 mm, and 1.0–2.0 mm. Because this test uses separate loading, the moment when vertical stress is added can be regarded as instantaneous loading. When the test results are processed, the time of the first creep deformation data point is recorded as 0.1 s, and the axial strain is the total strain, including the initial strain and creep strain. Three types of sand samples of single particle size are prepared after drying and are filled to a predetermined height by the falling sand method to ensure that each sample is filled with a container. Because the larger particles of irregular shape, resulting in different sample mass in each group can be considered a different single dry density of samples with sand, particle sizes of 0.25–0.5 mm, respectively, set a dry density of 1.244 g/cm3, 0.5–1.0 mm. The dry density of the particle size group is 1.158 g/cm3, and the dry density of the particle size group of 1.0–2.0 mm is 1.145 g/cm3. It can be seen from Figure 5 that under different stresses, the coral sands with different gradations have undergone significant deformation with time, which is creep. The shape of the curve of the creep deformation over time under different stresses in each particle size group is basically similar, and it has obvious stages. Both have experienced a rapid deformation stage and a stable creep deformation stage.
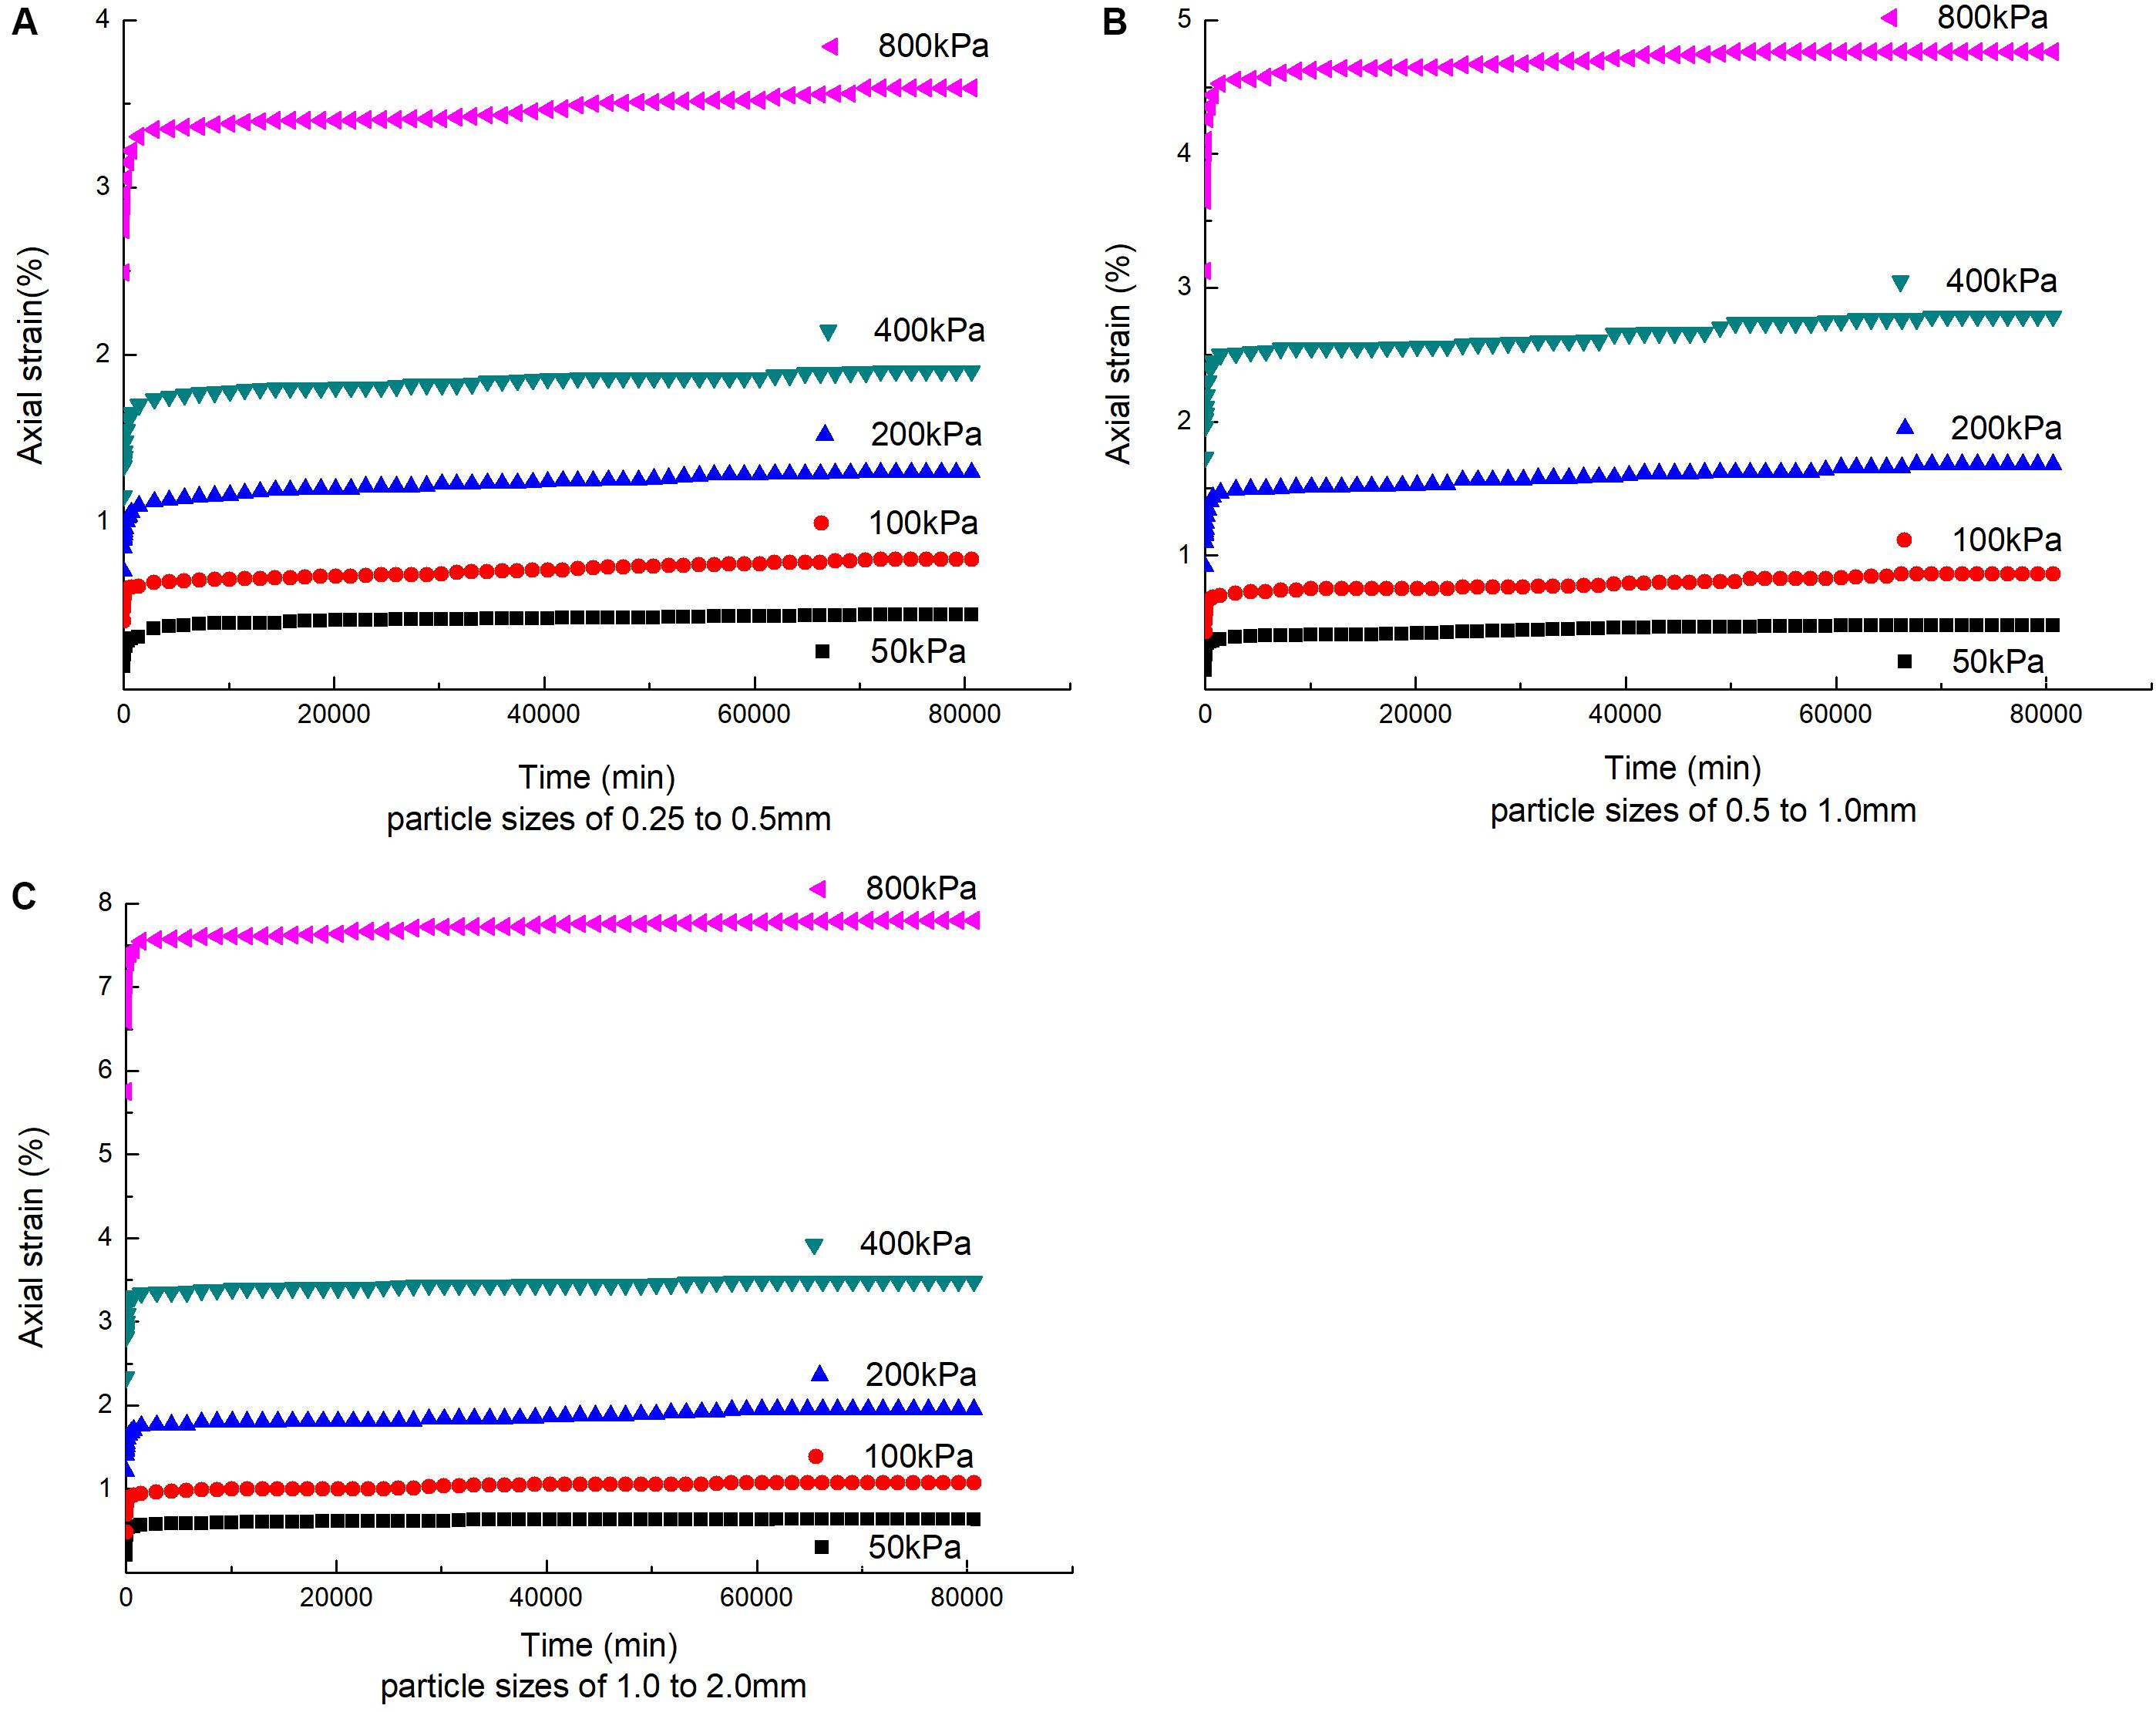
Figure 5. Axial strain-time relationship curves of coral sand with different particle sizes. (A) Particle sizes of 0.25–0.5 mm, (B) particle sizes of 0.5–1.0 mm, and (C) particle sizes of 1.0–2.0 mm.
The axial logarithmic strain–time curves of the coral sand creep of different single particle size groups are shown in Figure 6 after using the double logarithmic axis. Under different stress conditions, the strain–time curves of coral sand of each particle size group show good linearity, and as the stress increases, the linear correlation is higher, indicating that the strain–time curve of coral sand under higher stress is better described by a power function. On the other hand, with the increase in the particle size, the strain–time curves of the same particle size group under different stress conditions tend to be parallel, indicating that the coefficient (the slope of the straight line) affecting the description of the creep function has a weak correlation with the magnitude of the stress.
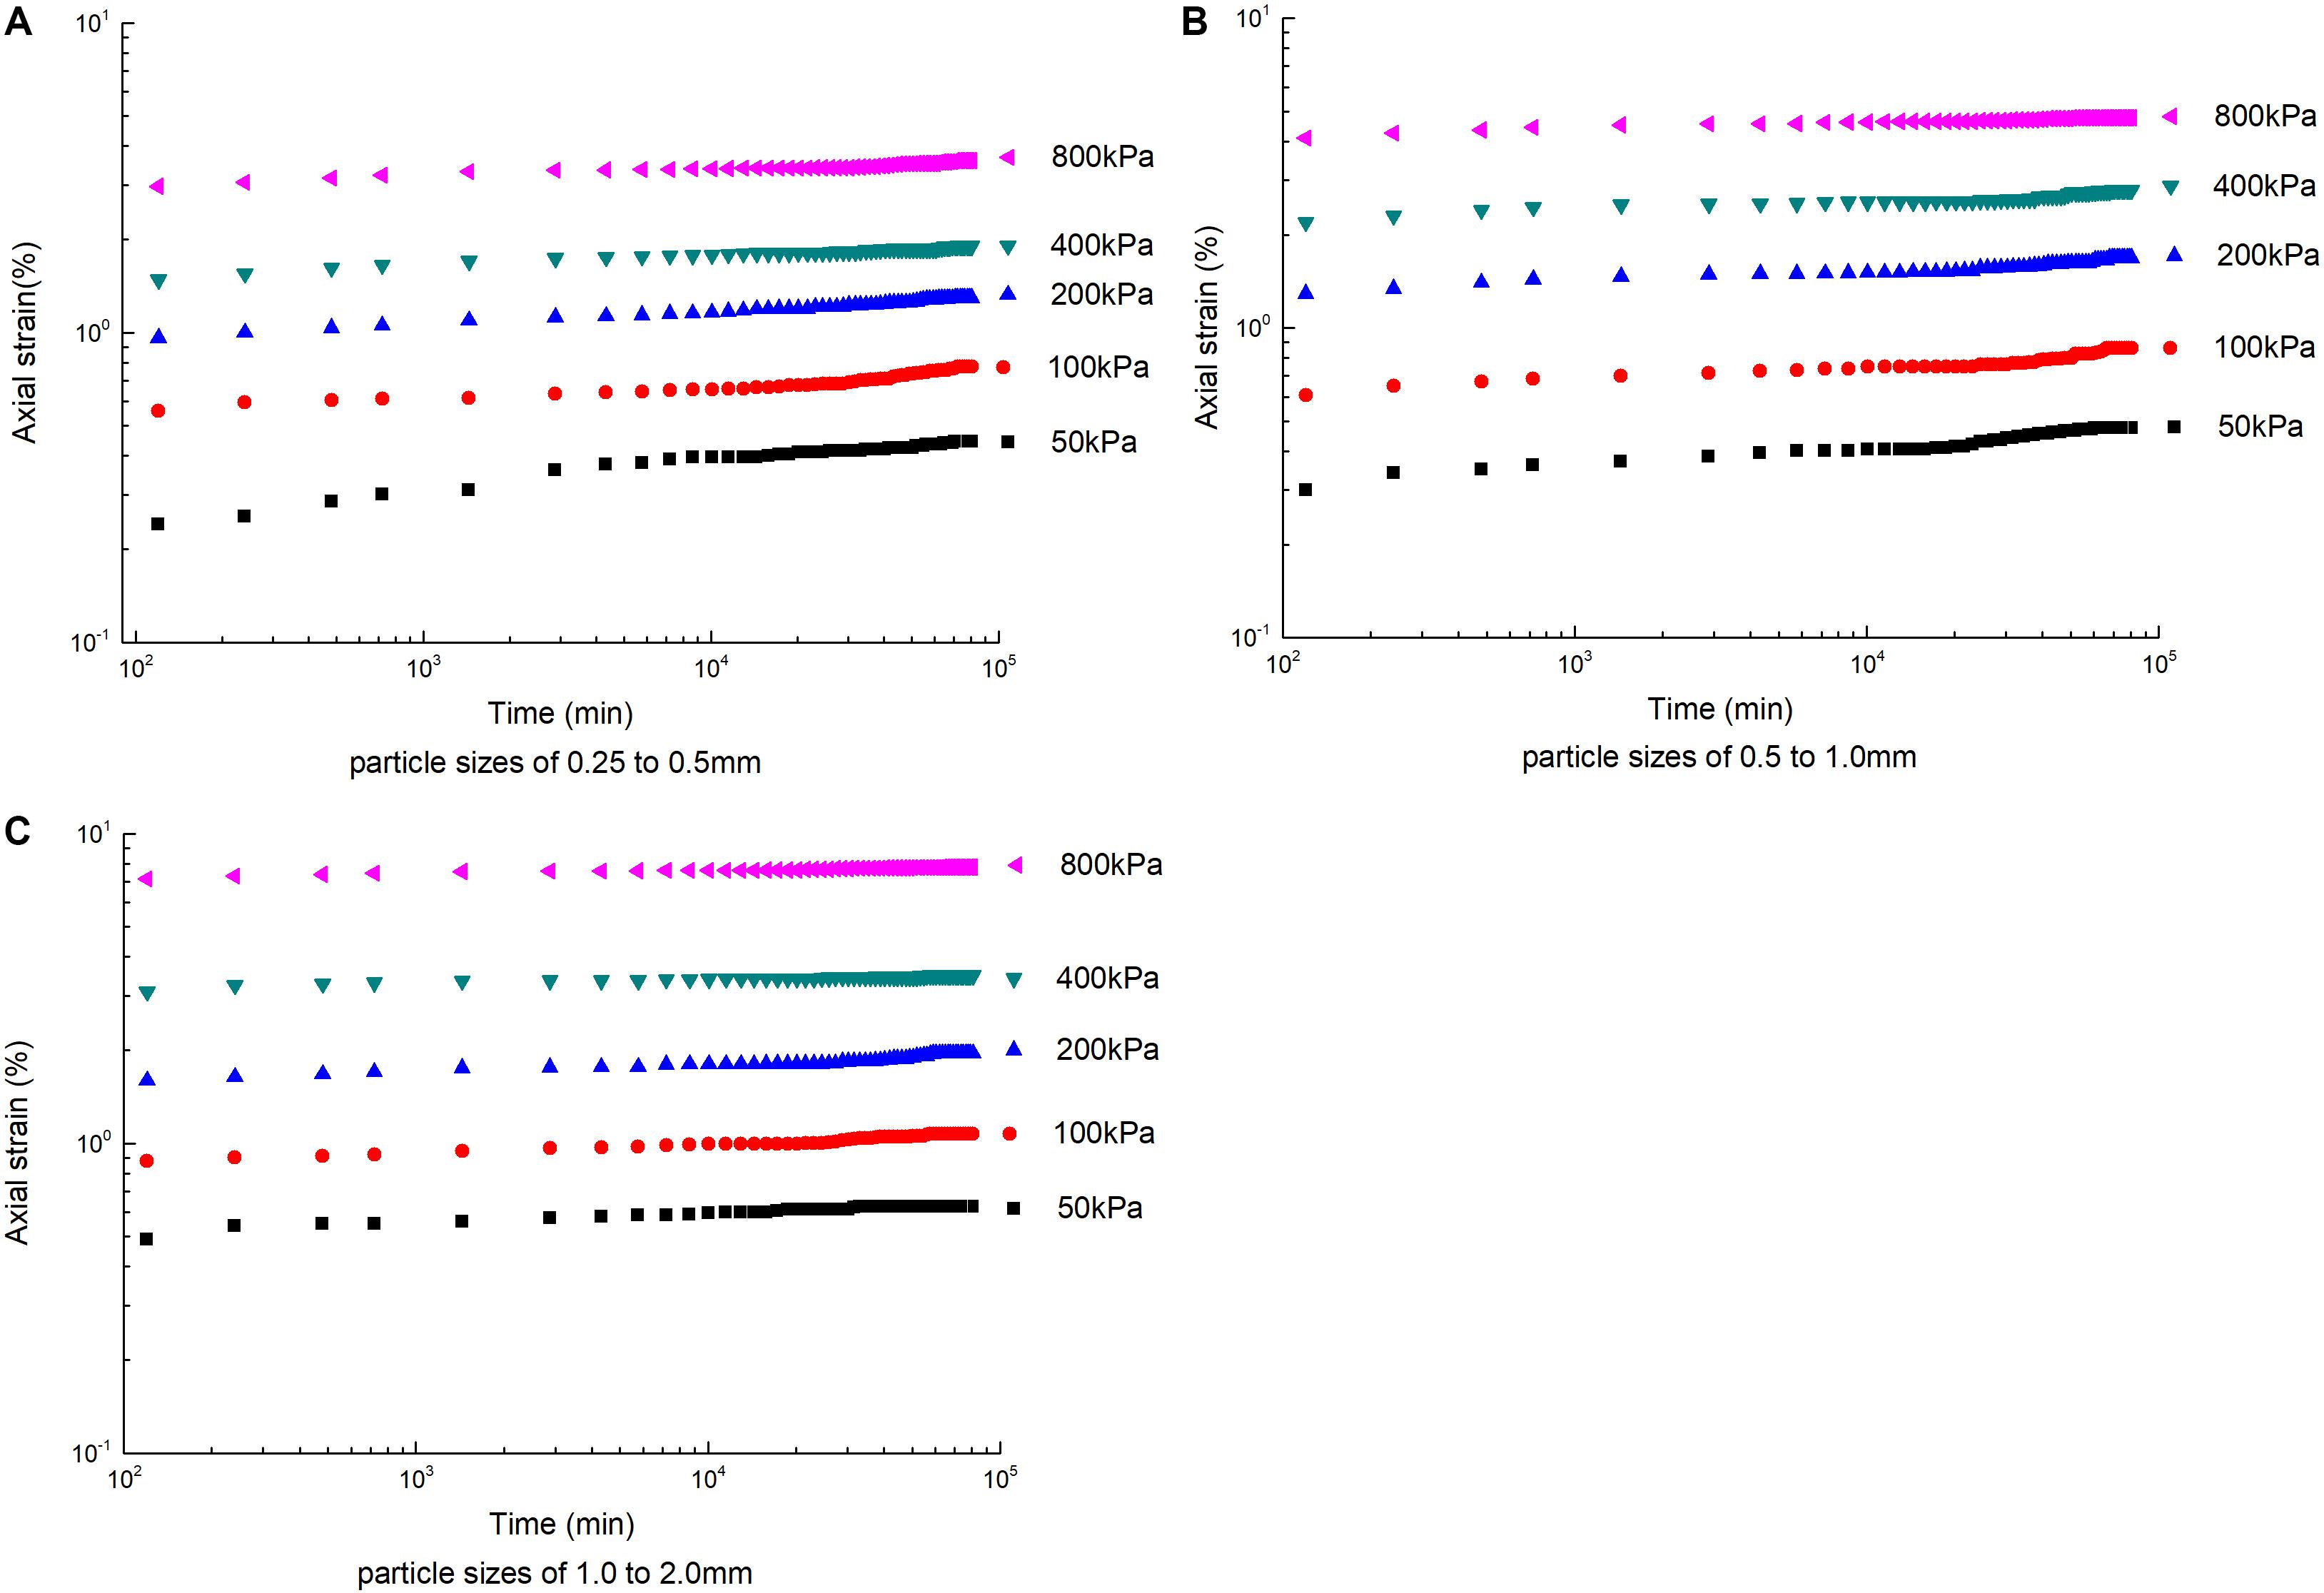
Figure 6. Creep curve in logarithmic coordinates. (A) Particle sizes of 0.25–0.5 mm, (B) particle sizes of 0.5–1.0 mm, and (C) particle sizes of 1.0–2.0 mm.
It can be seen from Figures 5, 6 that the strain time curves under different stress levels of each particle size group show significant non-linear decay creep characteristics. On the one hand, the time required for the creep of the coral sand single particle size sample to stabilize is related to the test stress. When the vertical stress is increased, the longer it takes to reach creep stability. On the other hand, there are differences between different particle size groups under the same stress. Taking the stress of 800 kPa as an example, it takes 35 days for the creep of the 0.25–0.5 mm particle size group to stabilize, 28 days for the 0.5–1.0 mm particle size group, and 26 days for the 1.0–2.0 mm particle size group. The creep stabilization time was different between different particle size groups. The creep stabilization time of the small particle size group under the same stress level was longer than that of the large particle size. The reason was that the space for small particles of sand samples to rotate and grind between the sand particles during the creep deformation stage becomes smaller, and the frictional resistance of the relative slip between the particles also becomes relatively larger. As a result, the rate of relative slip between particles was also small, so the sample takes longer to reach the steady state of creep.
PSD Fractal Behavior During Creep
Studies have shown that granular rock and soil materials undergo particle crushing under sustained stress. The PSD of the particles after crushing tends to be fractal, which is positively correlated with the increase in stress level. Taking a sample of 56 days in the creep test performed as an example, the PSD curves of each particle size group after being crushed under different vertical stress levels are plotted as shown in Figure 7. It can be found in Figure 7 that the coral sands with different initial particle sizes have a small amount of fine particles produced under continuous load under normal stress. On the one hand, as the stress level increases, the degree of particle crushing intensifies, and it gradually becomes fractal. On the other hand, under the combined effect of stress level and creep time, the particle size of each particle size group tends to have a self-similar fractal distribution. A large number of fine particles are generated by particle crushing, but in the end, some initial large particles were still not completely crushed. This phenomenon can be explained as during the crushing process, particles are continuously recombined, filled, and ground. The contact points between large particles and surrounding smaller particles increase, and the force is transmitted from one particle to another through the contact between particles. After visualization, it appears as a chain-like structure, which is intuitively called a force chain, so that large particles are buffered by force, and their ability to resist crushing is enhanced. Therefore, smaller particles are more likely to be broken first. Zhang et al. (2017) found that among the many meso-characteristic parameters, the force chain is a characteristic particle group, which is between the particles and the unit body on a scale, and it is also the main body for the load and force transmission of granular materials, showing the same changing characteristics as macroscopic stress and strain. Tsoungui et al. (1999) observed this buffering effect through experiments and numerical simulations, and found that while the large particles were buffered, the small particles adjacent to them were continuously crushed.
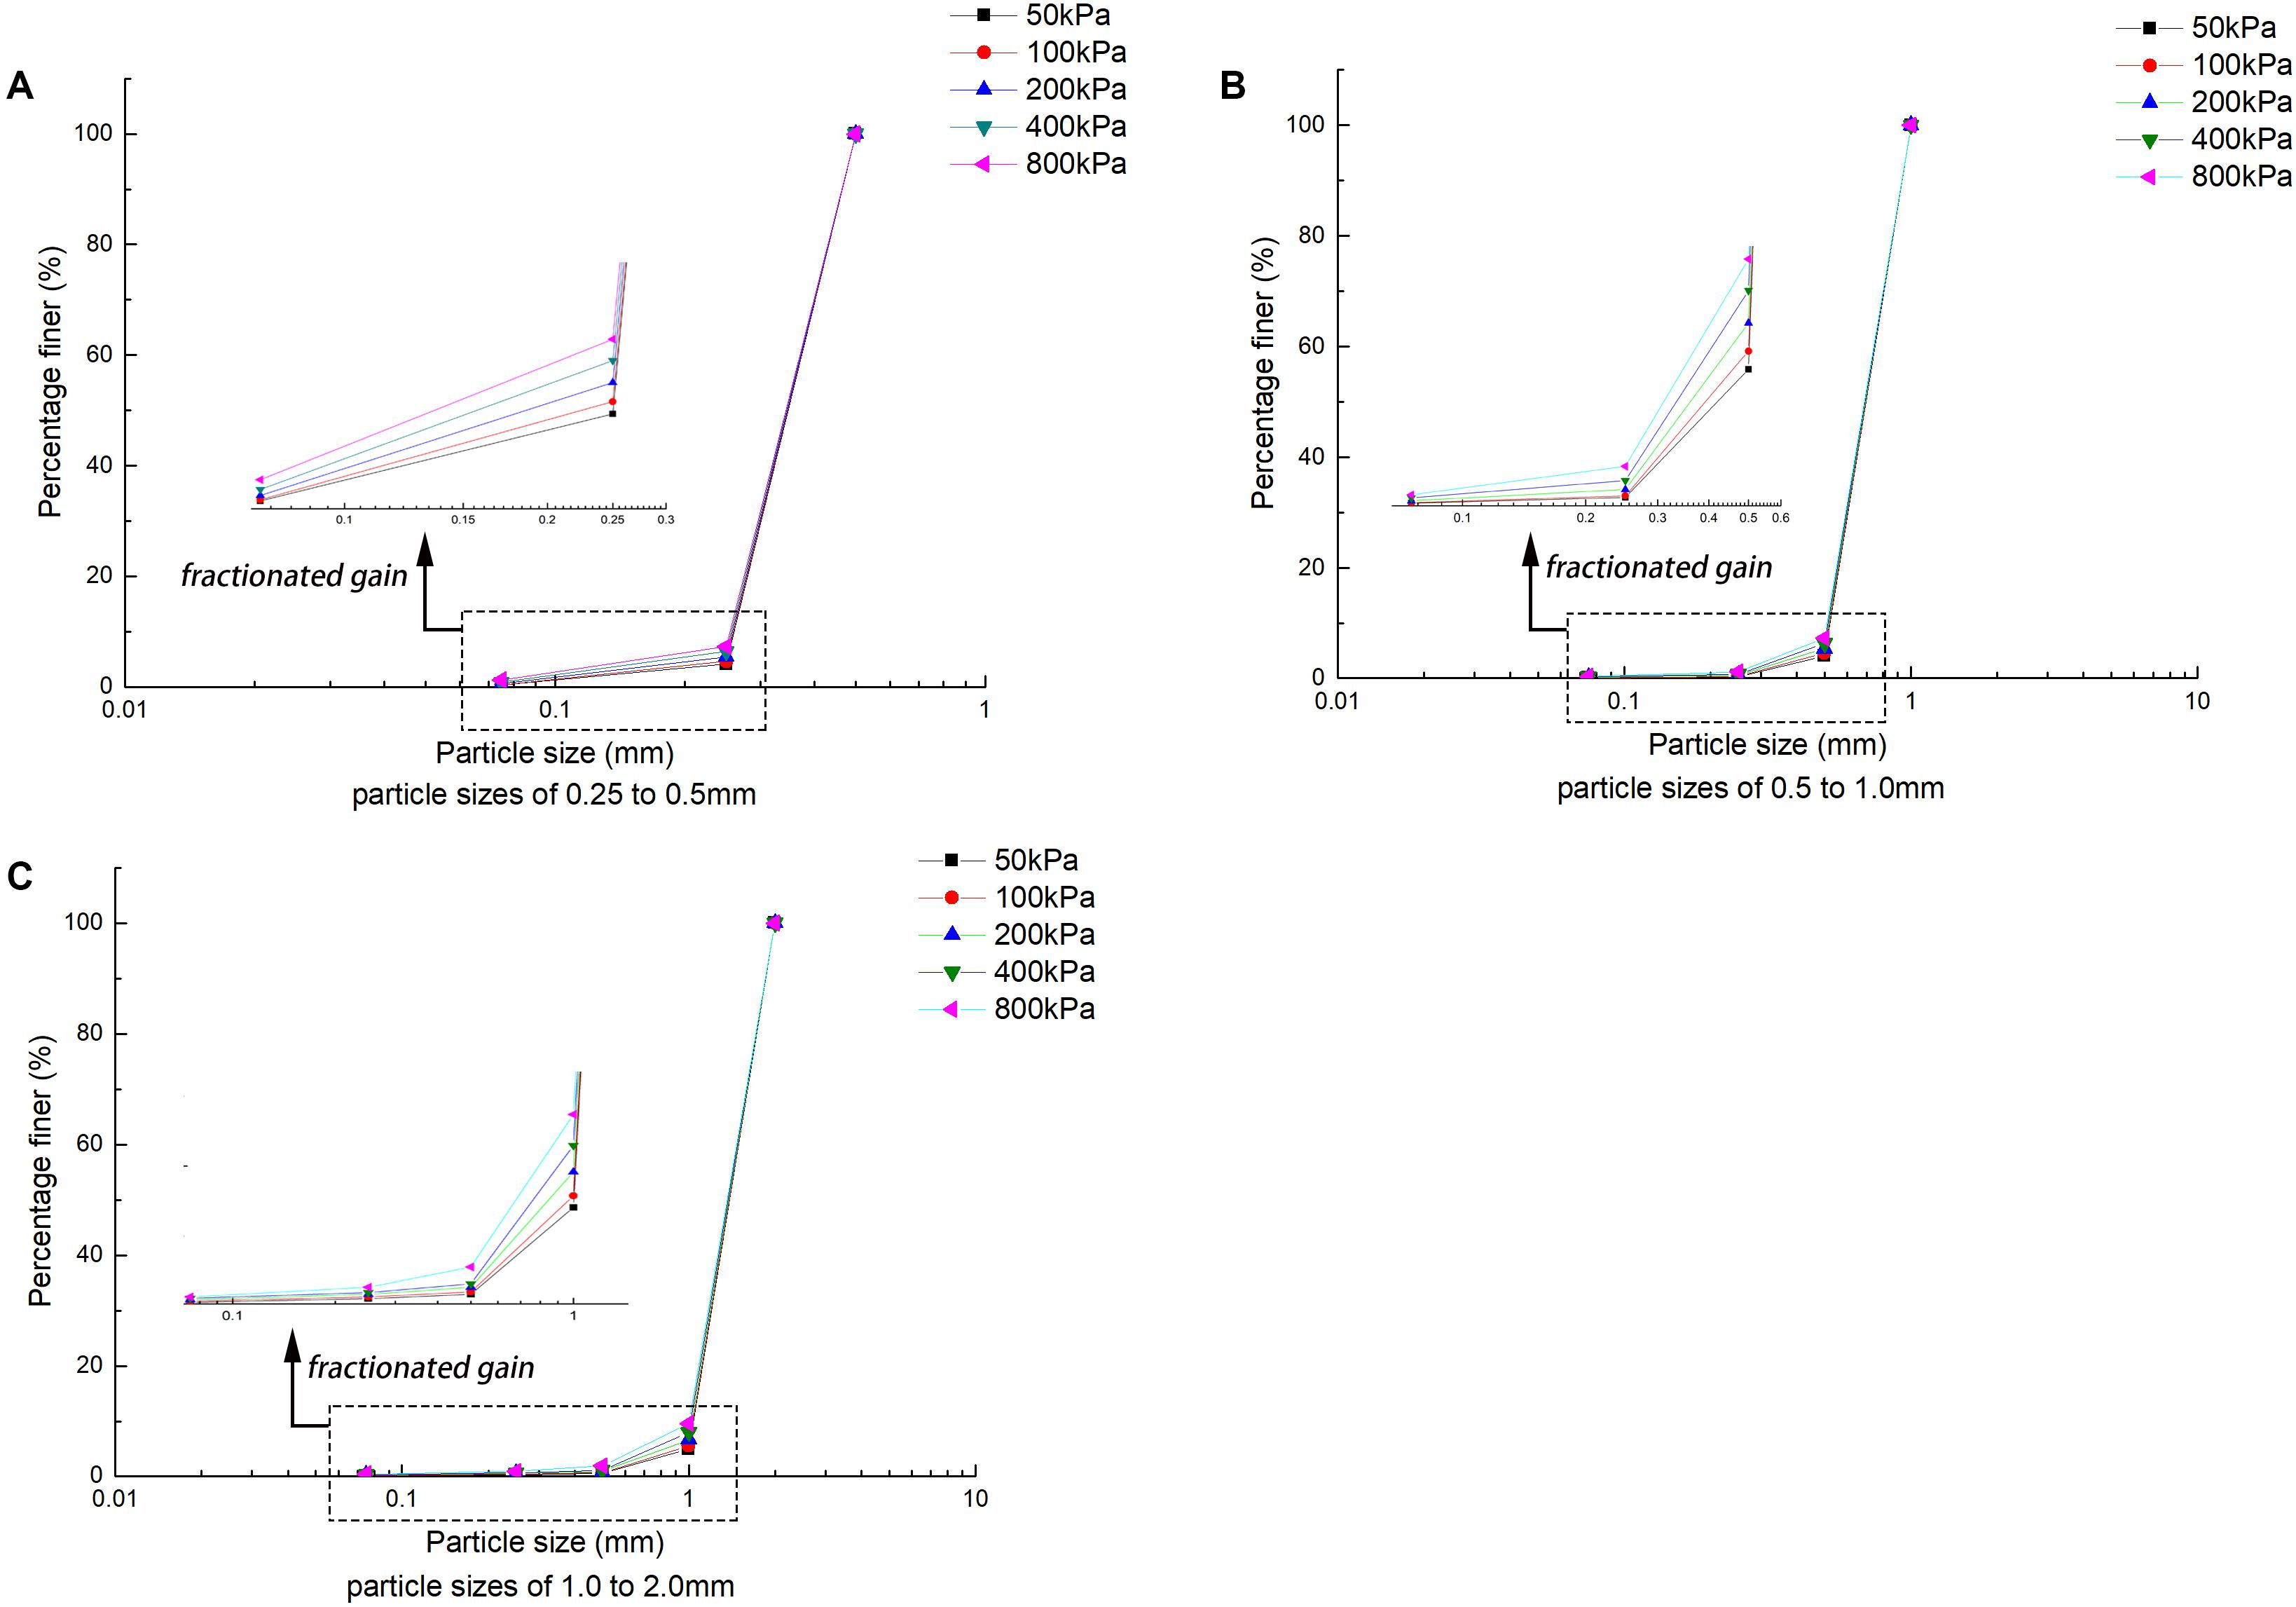
Figure 7. Evolution of coral sand PSD (semi-logarithmic axes). (A) Particle sizes of 0.25–0.5 mm, (B) particle sizes of 0.5–1.0 mm, and (C) particle sizes of 1.0–2.0 mm.
Figure 8 is the PSD curve represented by a double logarithmic coordinate axis, and the self-similarity of PSD evolution can be found more clearly. By observing Figure 8, it is found that between different particle size groups, as the range of PSD increases, the shape of the PSD distribution is similar to that shown in the semi-logarithmic axis, which is a cluster of concave curves. Increasing stress levels, intensified crushing, increased fine particles, and the concave curve tended to be gentle. It can be seen that, under the action of different stress levels, the fractal behavior of particle crushing is a gradual process. Only when it is close to the limit stress does it show a significant fractal behavior.
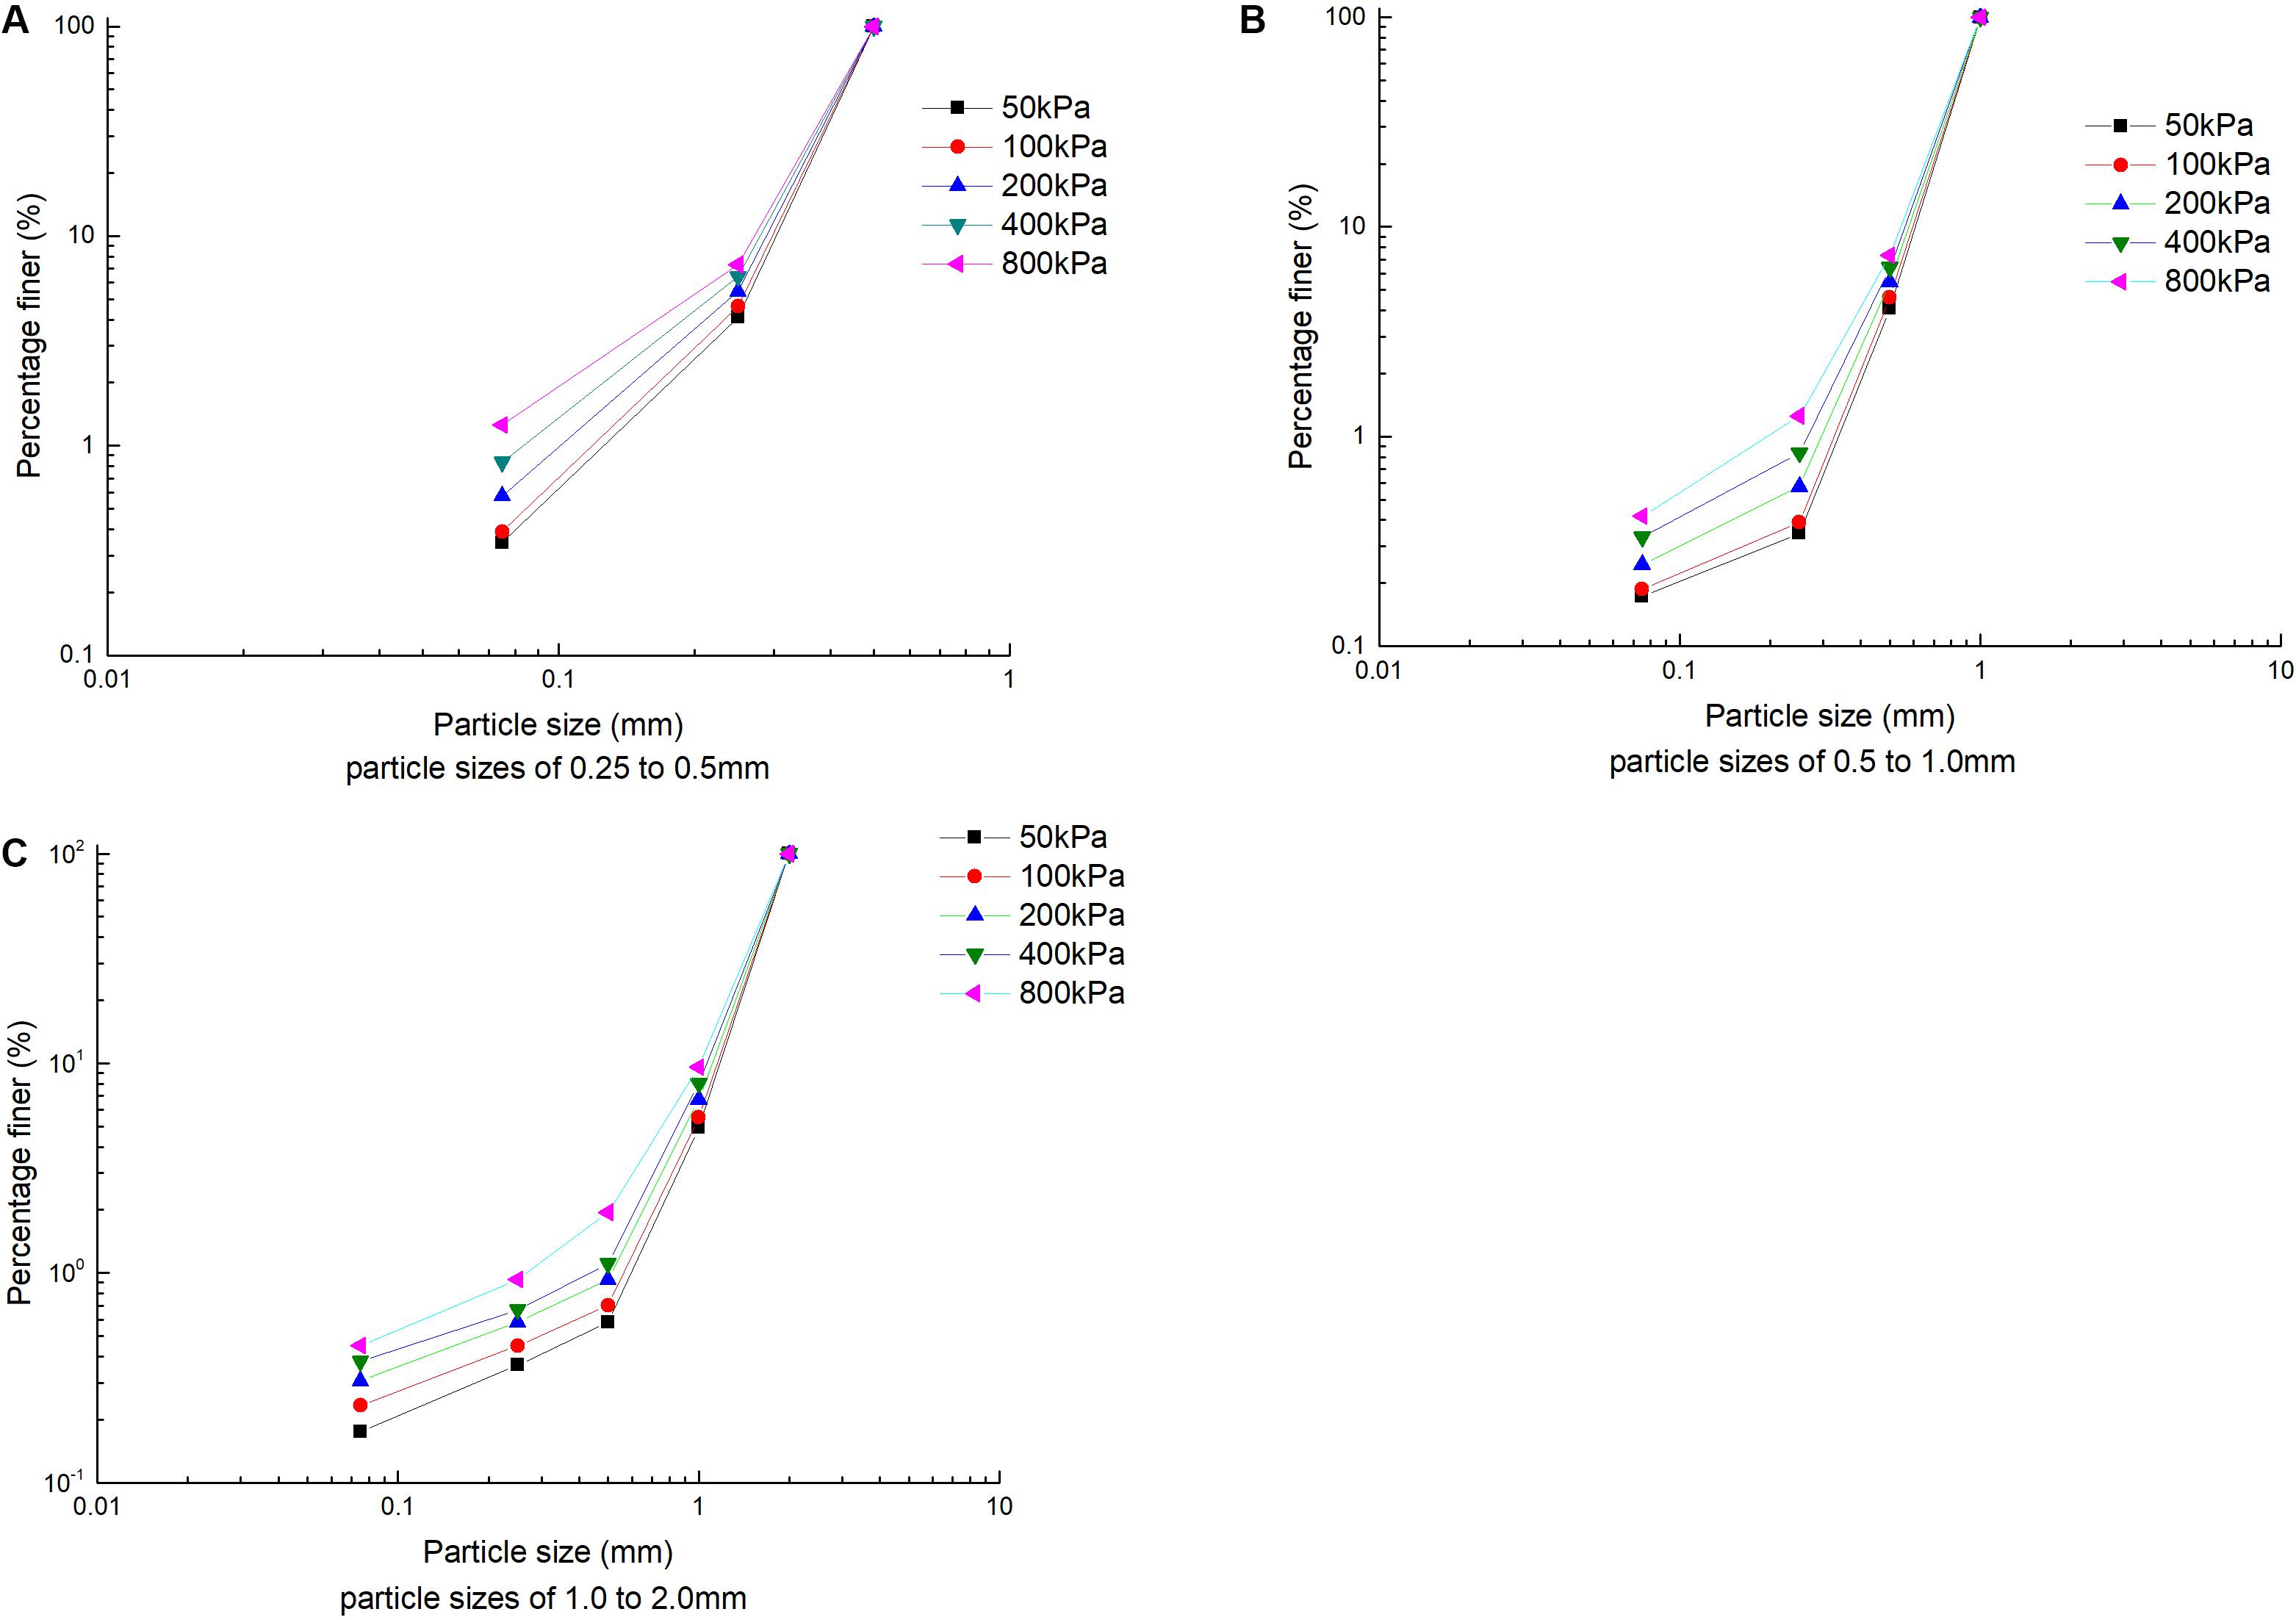
Figure 8. Evolution of coral sand PSDs (double logarithmic axes). (A) Particle sizes of 0.25–0.5 mm, (B) particle sizes of 0.5–1.0 mm, and (C) particle sizes of 1.0–2.0 mm.
In order to understand the fractal behavior of particle crushing during the coral sand creep process, a linear regression analysis was performed on the PSD data obtained by sieving and formula (2). The results are shown in Figure 9. The obtained fractal dimension D and the corresponding fitting correlation coefficient R2 are listed in Table 3. Comprehensive analysis found that coral sand would break up under normal stress, but the fractal characteristics were not obvious. The obtained fractal dimension was smaller and significantly increased with the increase in particle size and stress level, which is in the development stage of fractal distribution. Each sample data is linearly weak. The analysis has two reasons: on the one hand, while coral sand is easily broken, a non-negligible fragmentation occurs under conventional stress level. This characteristic just shows that the crushing limit that coral sand can reach is also larger, and it can produce a greater degree of crushing than other granular materials under higher stress levels. On the other hand, when drawing the PSD curve of the sieved particles, due to the limitation of the test conditions, there is failure to obtain the particle quality data of less than 0.074 mm, resulting in data inconsistency and affecting the description of the PSD curve. Although the fractal behavior is weak, we can still use the increasing fractal dimension to describe the development process of particle crushing. Because the coral sand is broken in the process of particles, large particles are broken to produce small particles, and the small particles are reorganized and dispersed in the gaps between the large particles and the interconnected spaces inside the particles. In addition, the fractal dimension is an indicator of the filling degree of fine particles.
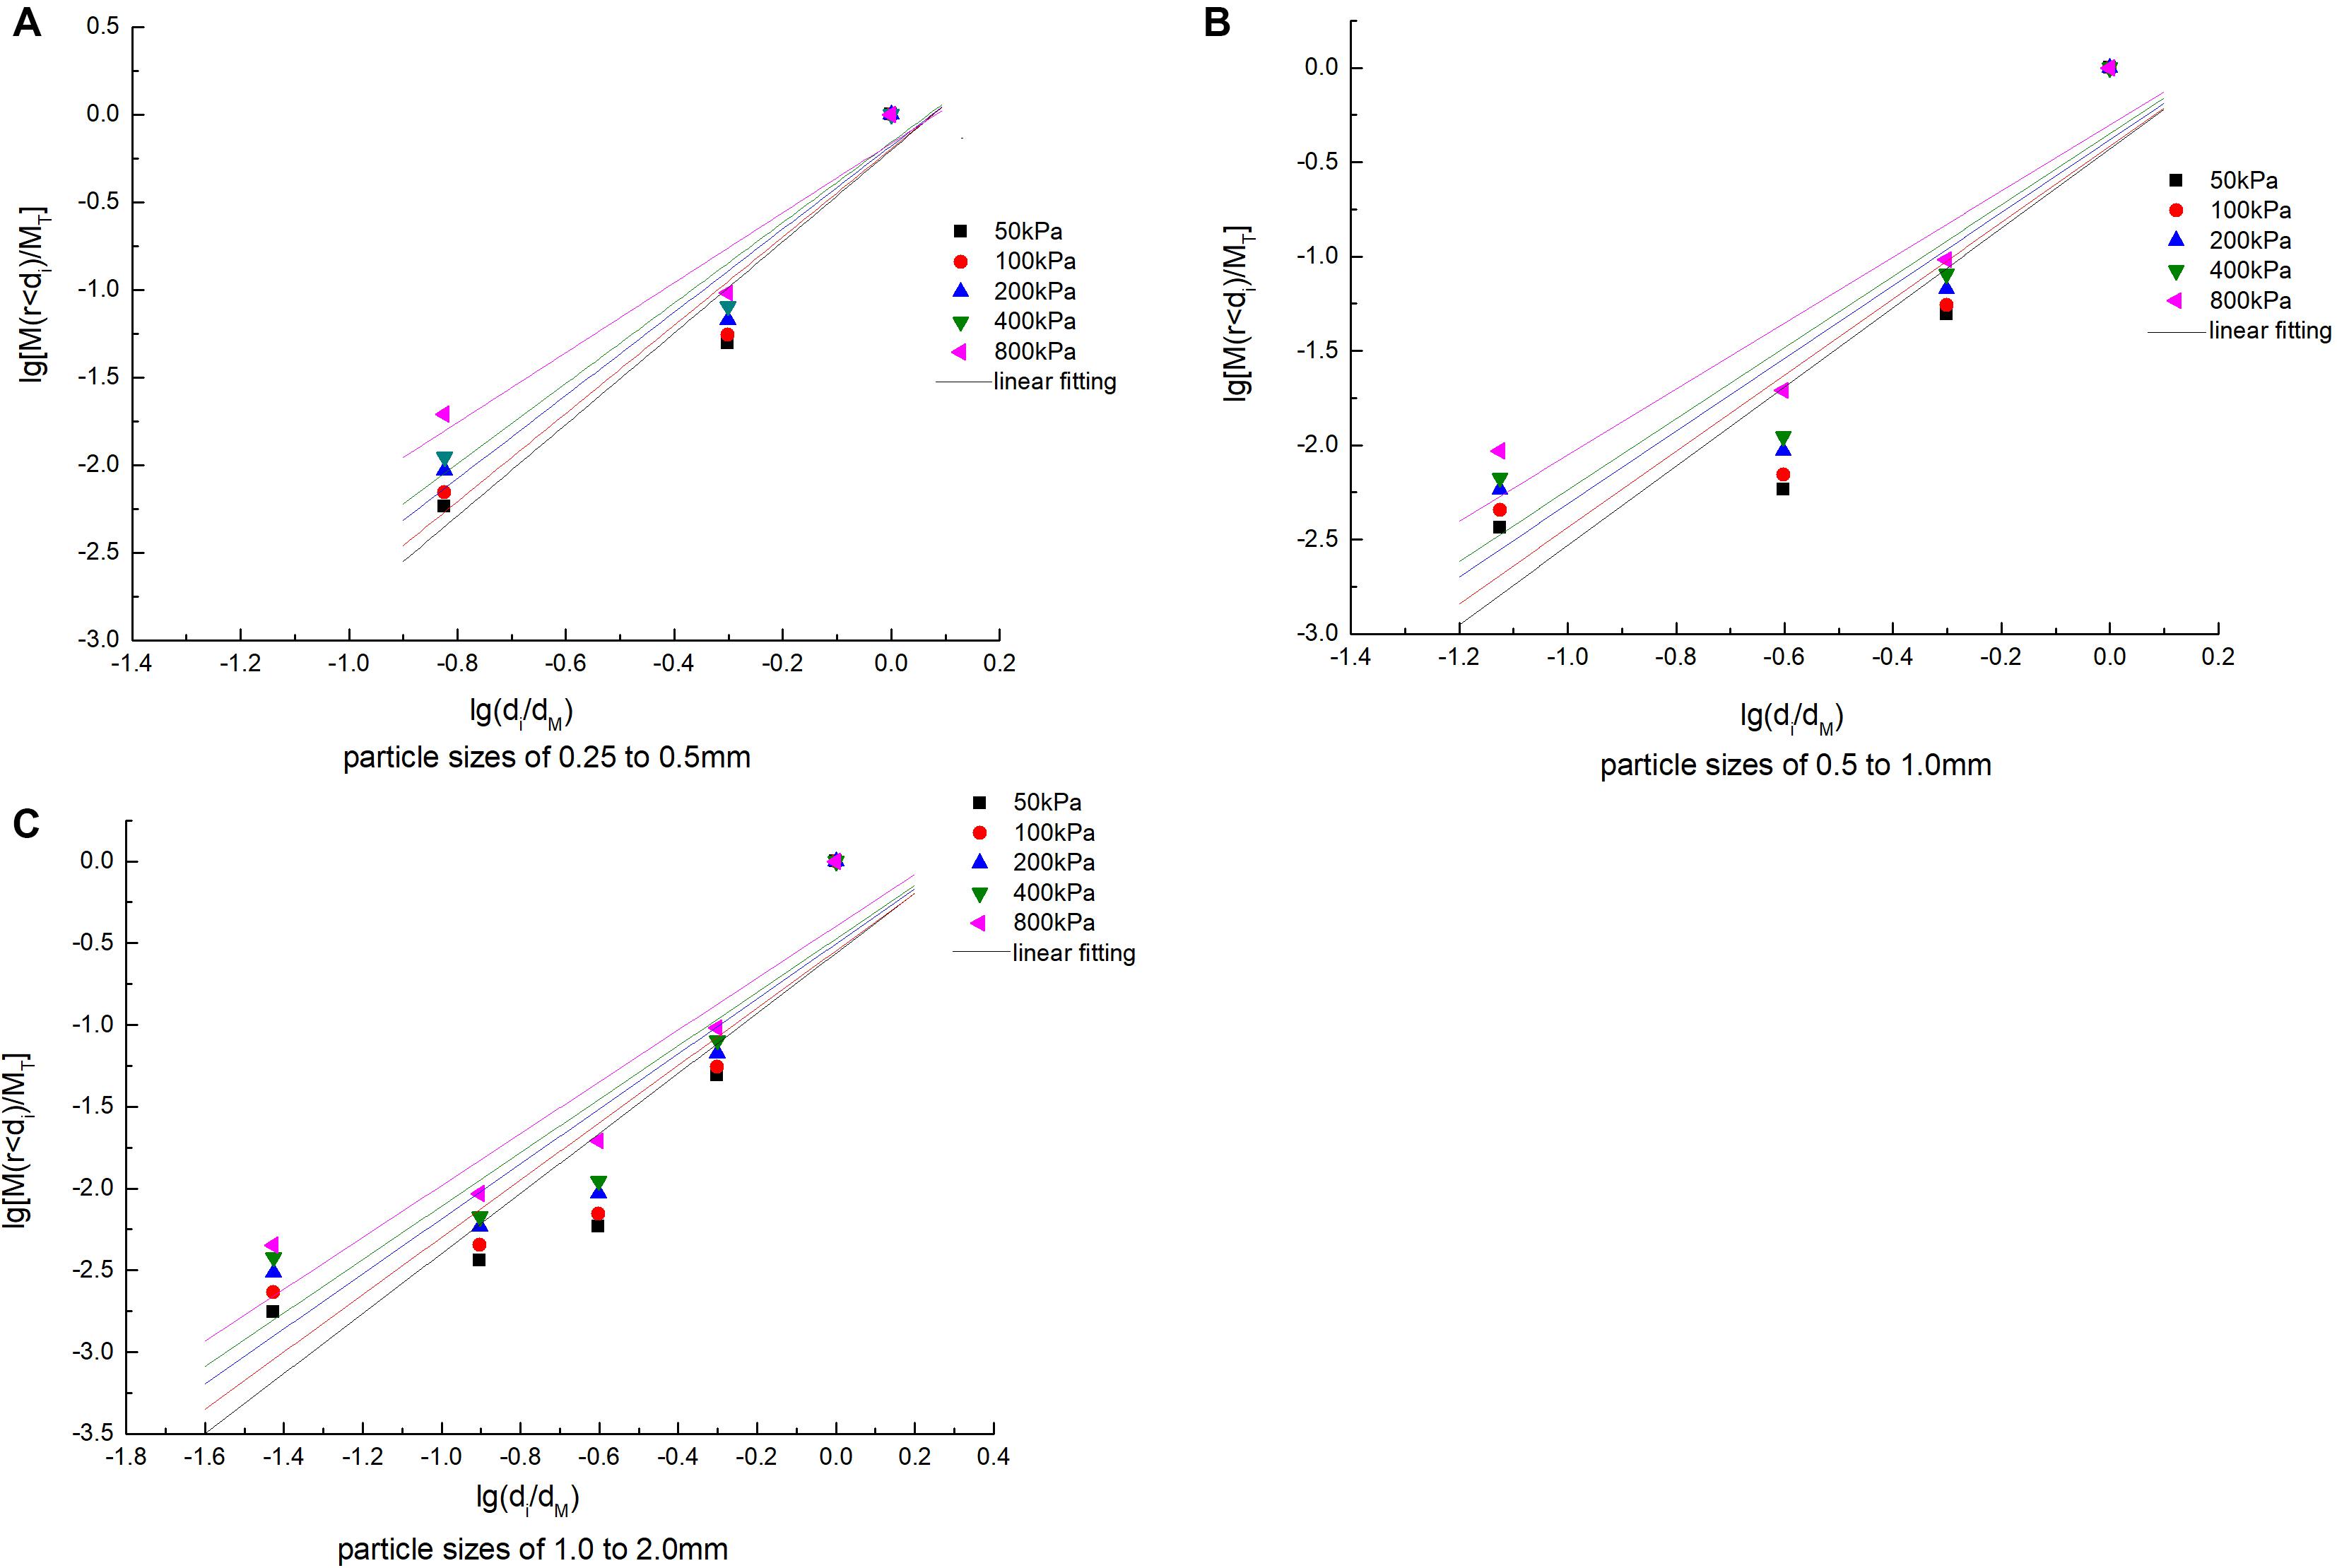
Figure 9. Linear fitting for lg[M(r < di)/MT] and lg(di/dM). (A) Particle sizes of 0.25–0.5 mm, (B) particle sizes of 0.5–1.0 mm, and (C) particle sizes of 1.0–2.0 mm.
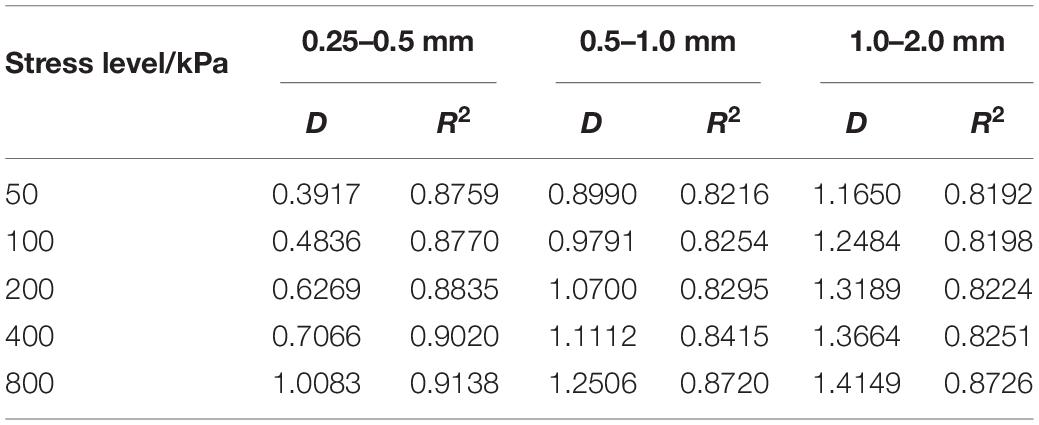
Table 3. Fractal dimension and regression coefficient for coral sand.
Because of the lower stress level, the fractal characteristics of coral sand particles are not obvious. So take the 2.0–5.0 mm coral sand under the higher stress levels of 0.8, 1.6, 2.4, 3.2, and 4.0 Mpa to carry out a 56-day confined compression test. The data will be processed as shown in Figure 10. Comparing Figure 10 with Figures 7–9, it is found that the fragile characteristics of coral sand have been further verified. The particle crushing has increased significantly, the PSD curve clusters have changed from bending to straight lines, and the fractal characteristics are obvious at higher stress levels. Linear correlation remarkably improved the fractal dimension value when more close to the limits of particle crushing fractal distribution. And compared with Zhang et al. (2015) on the data of quartz sand fractal behavior research as shown in Table 4, it was found that the PSD data of coral sand under normal stress has a higher linear correlation, and the fractal behavior is more significant than that of quartz sand. In addition, under the same stress condition, the particle size of coral sand is higher than that of quartz sand.
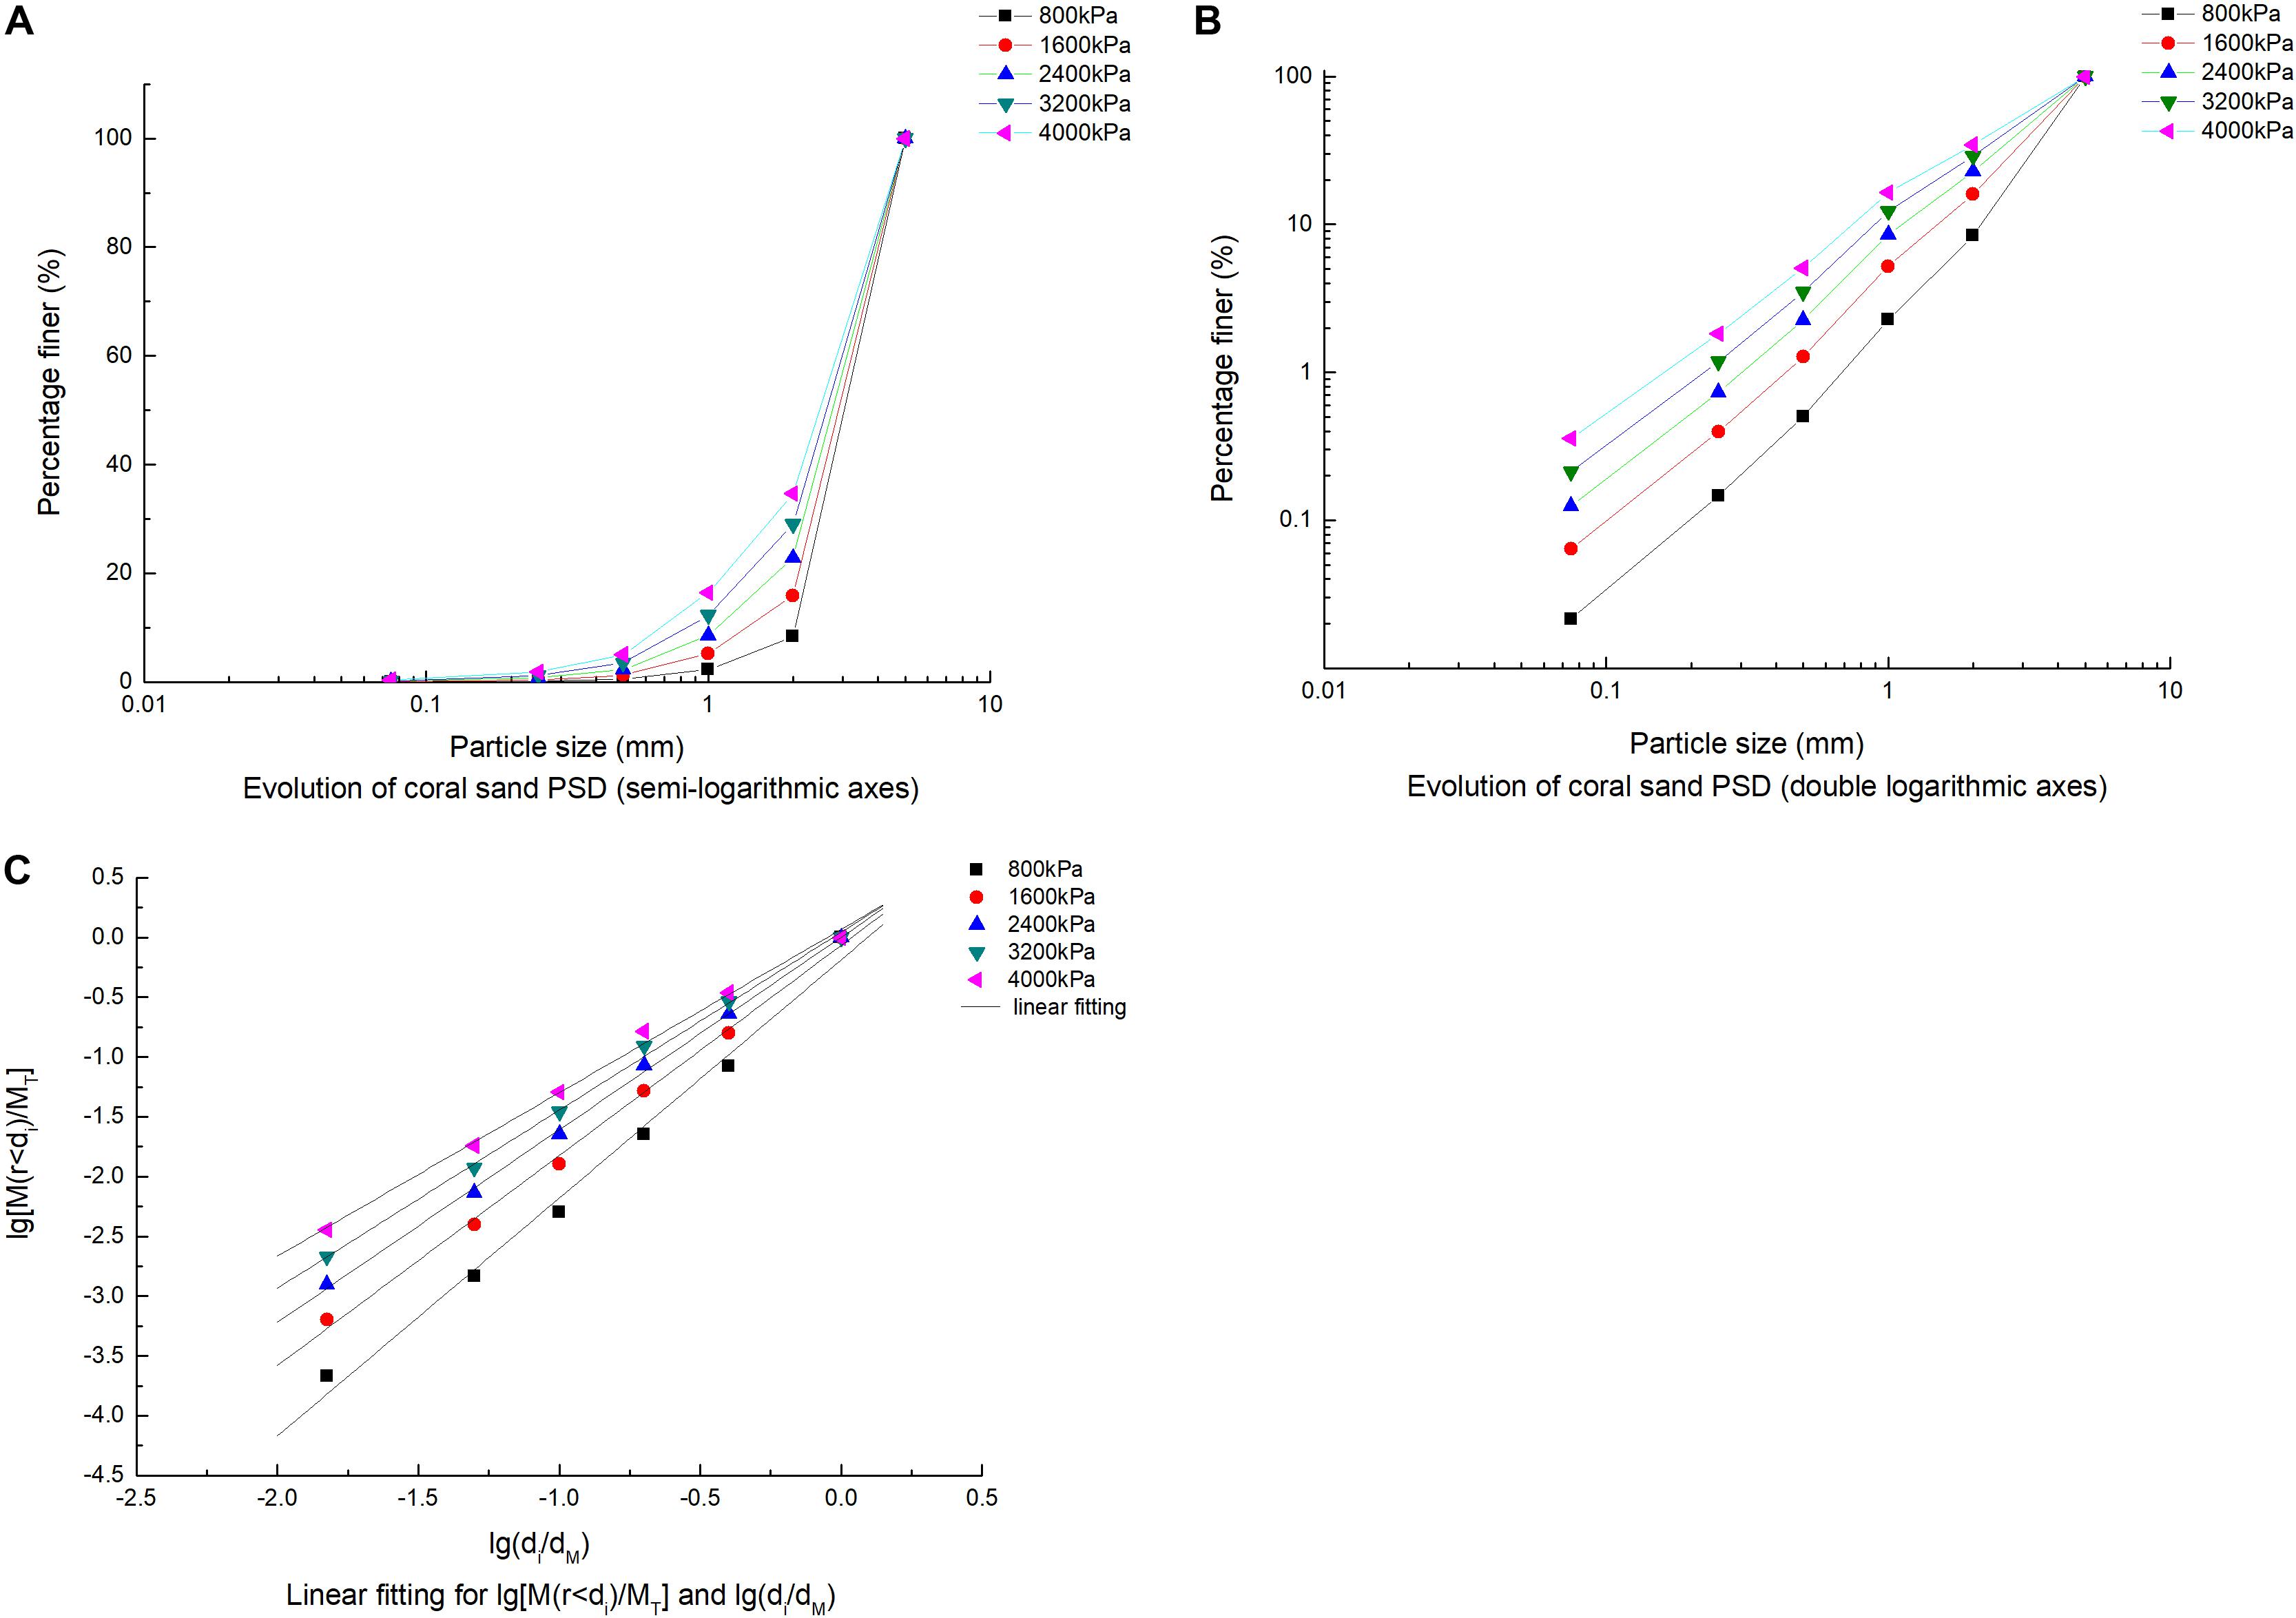
Figure 10. Evolution of particle size distribution in coral sand under higher stress (2–5 mm). (A) Evolution of coral sand PSD (semi-logarithmic axes), (B) Evolution of coral sand PSD (double logarithmic axes), and (C) Linear fitting for lg[M(r < di)/MT] and lg(di/dM).
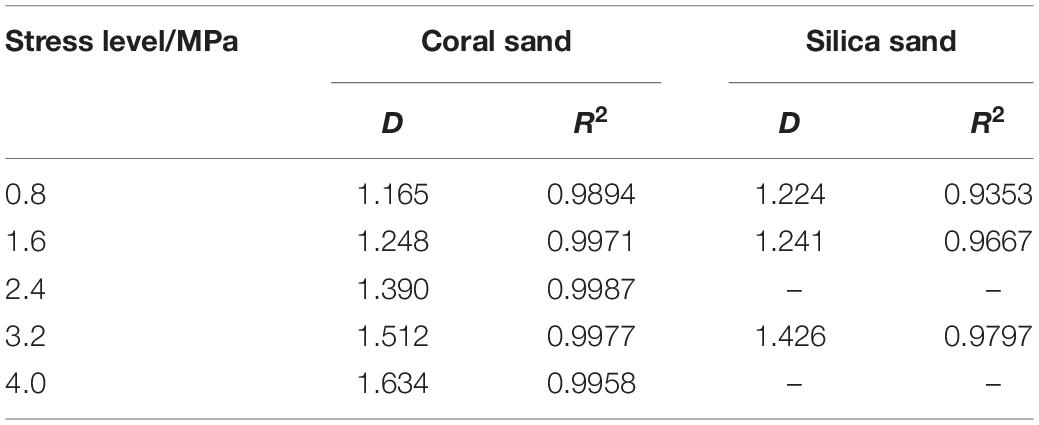
Table 4. Fractal dimension comparison between coral sand and silica sand (2–5 mm).
Particle Crushing Evolution During Creep
According to the above studies, coral sand has obvious fractal behavior when particles are broken at higher stress levels, but the fractal behavior is not obvious at low stress levels. Since the creep test carried out by this research adopts a separate loading method, the creep test under each stress level needs to be re-prepared and loaded. Even if the same tester operates, the sand samples of the same particle size group are strictly tested. The falling sand method cannot theoretically be completely the same between samples. This unavoidable factor may cause the test results to have a certain degree of dispersion, which in turn may lead to weak regularity of the test data. If the test data from different times has good regularity and self-similar characteristics, it means that the test results and conclusions of the multiple experiments conducted have good credibility. In addition, to investigate the particle crushing and PSD fractal behavior of coral sand creep at different time points, the measured isochronous curve between the relative particle breakage rate and the stress level of each particle group is shown in Figure 11, and the development law of the relative particle breakage rate of each particle size group with time under different stress levels is shown in Figure 12.
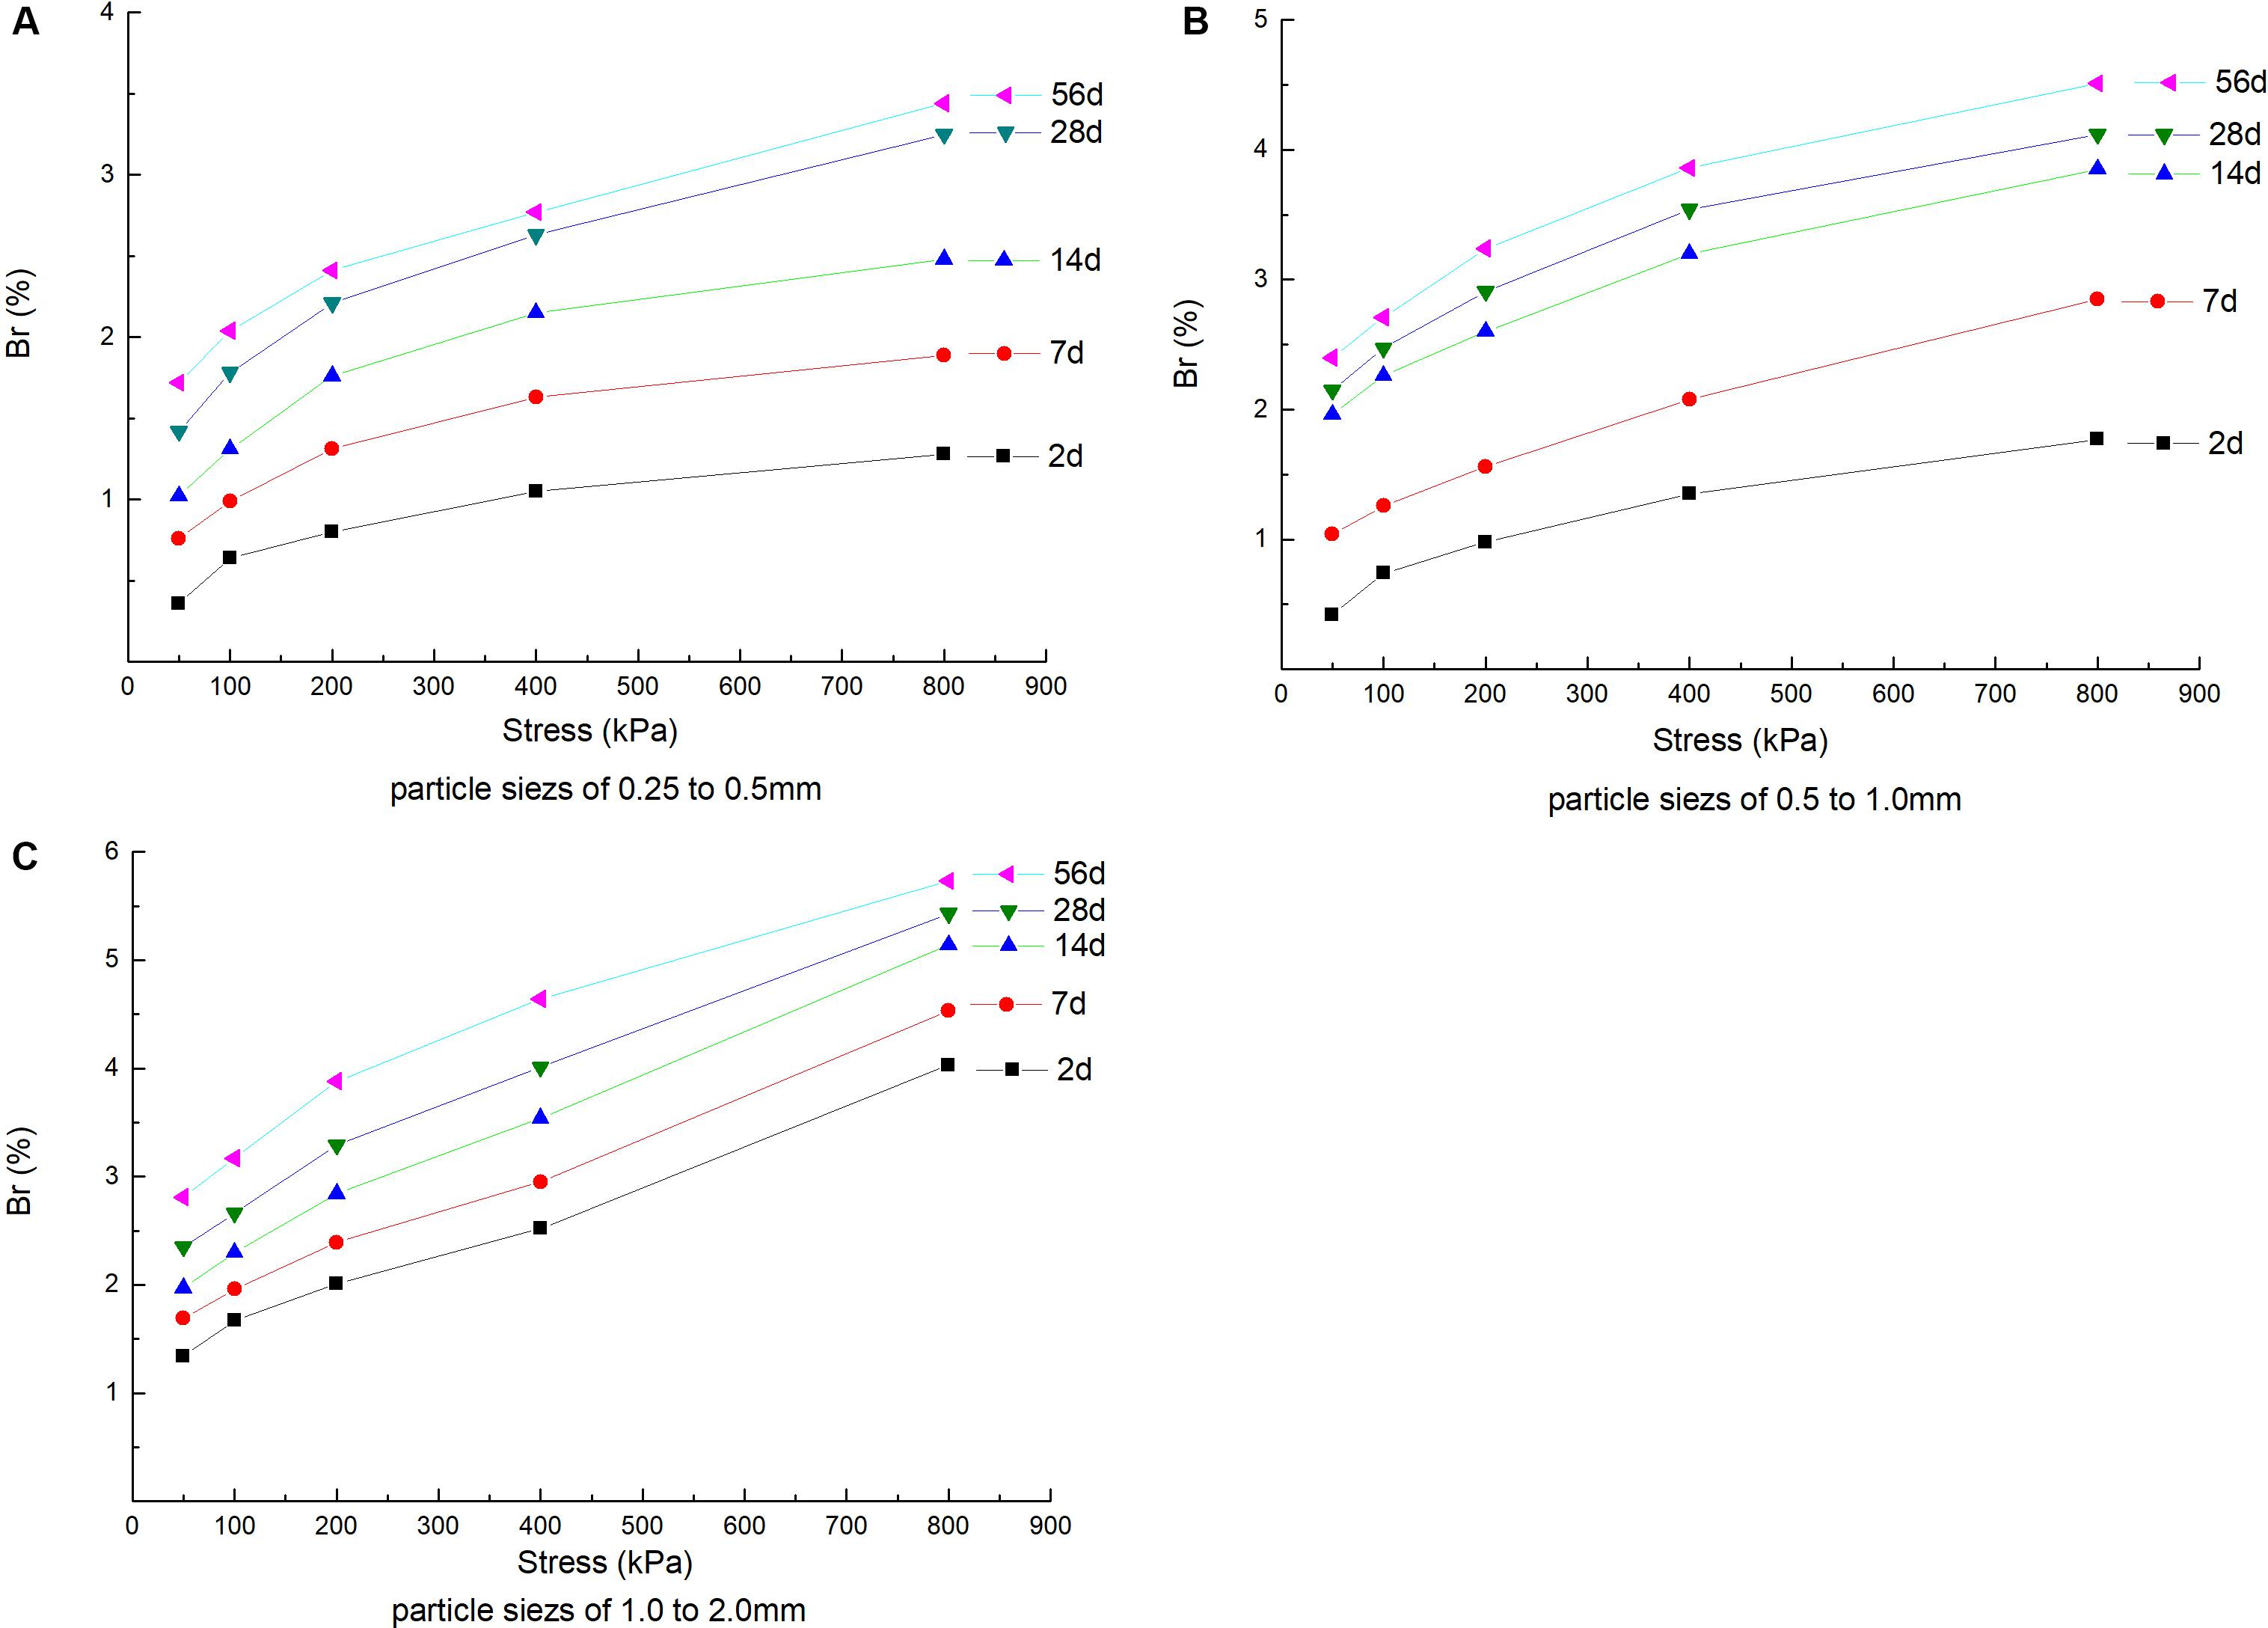
Figure 11. Relative particle breakage rate-stress isochrones. (A) Particle sizes of 0.25–0.5 mm, (B) particle sizes of 0.5–1.0 mm, and (C) particle sizes of 1.0–2.0 mm.
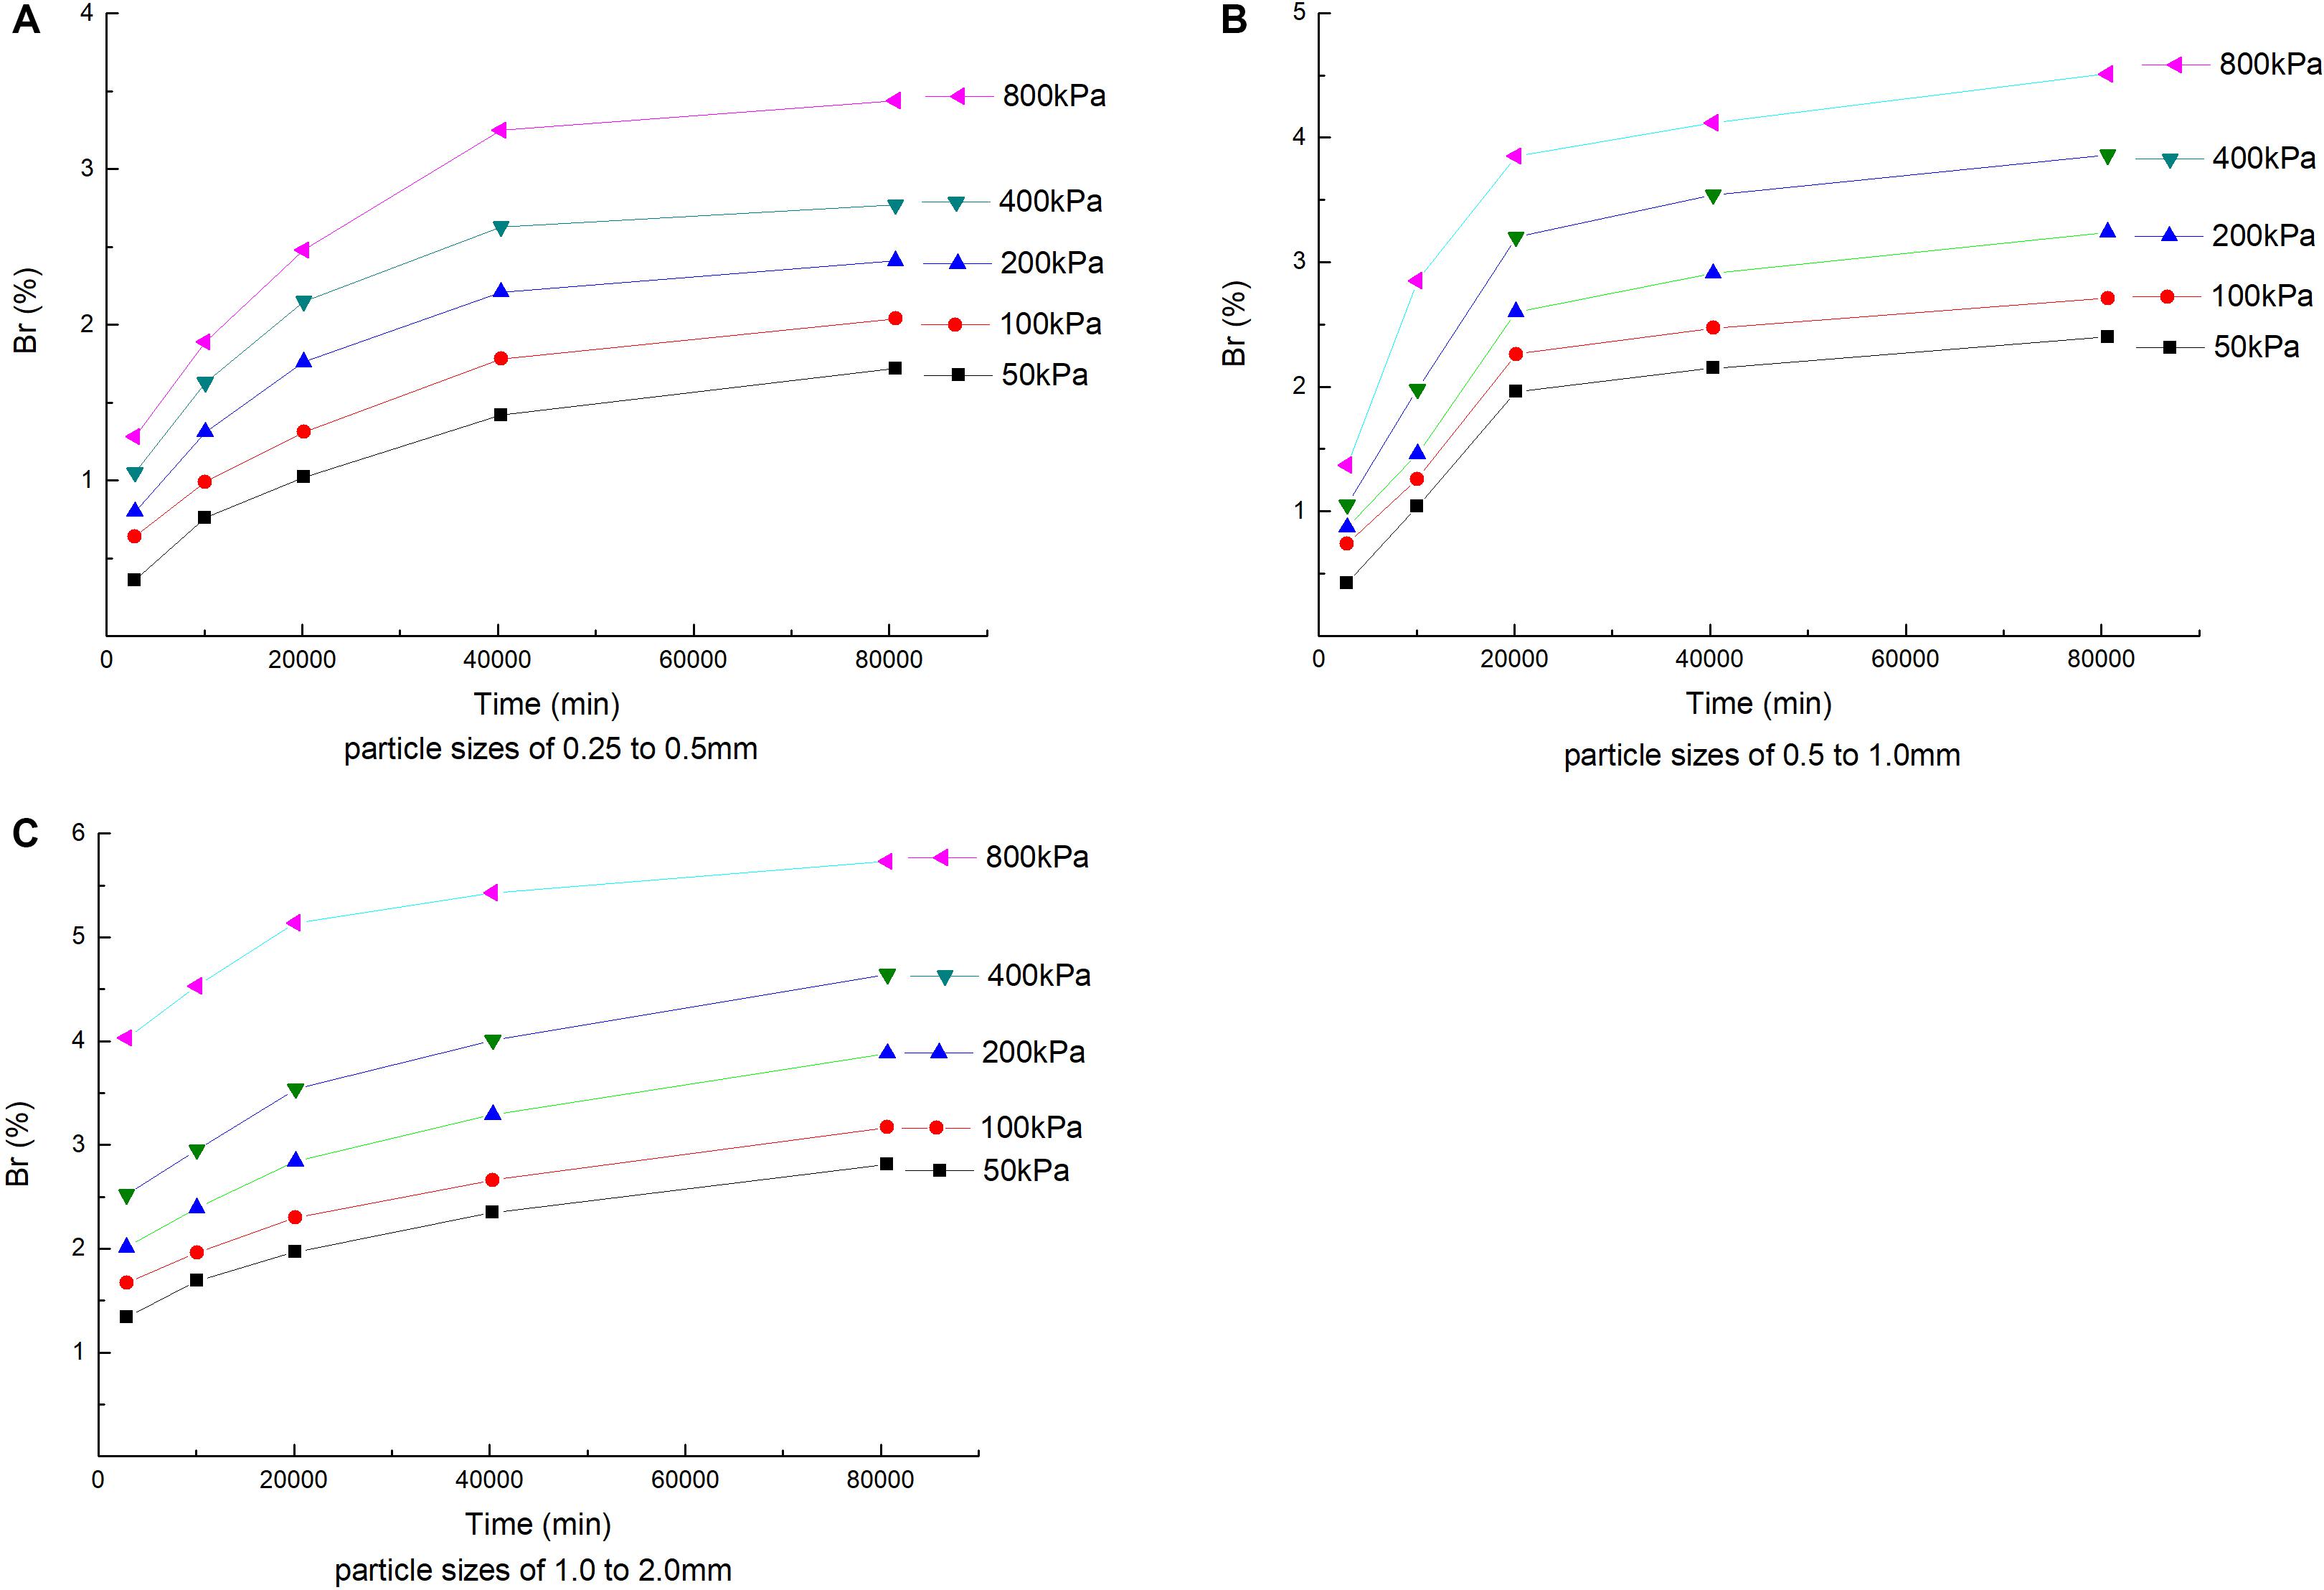
Figure 12. Effect of time on particle breakage. (A) Particle sizes of 0.25–0.5 mm, (B) particle sizes of 0.5–1.0 mm, and (C) particle sizes of 1.0–2.0 mm.
It can be seen in Figure 11 that, on the one hand, the isochronous curves of the relative particle breakage rate and stress level of each particle size group have good self-similar characteristics, which shows that the PSD data of coral sand after different creep times performed in this paper have good reliability. On the other hand, the degree of particle breakage in the sample creep of each particle size group at the same time is similar to the change law of stress. The particle breakage process gradually slows down, and the movement and reorganization of the particles to form a force chain to resist crushing is enhanced. Small particle size particle breakage mainly occurs and develops in the early stage of creep. The latter stage is stable and slow. The development of particle breakage is affected by time. However, the effect of the stress level on the development of particle breakage in the 56-day group of large particle size particles is consistent, which indicates that the large particle is in the accelerated particle crushing stage in the stress level section selected in the test, and has not yet been caused by slippage and friction, and crushing to produce more fine particles to help cushion the stress levels. Todisco et al. (2017) used pressure devices and high-speed cameras to study the crushing behavior of individual particles, and found that the material hardness was seen to be of key importance in the crushing mechanism. It may affect the particle strength through the deformation of the contacts, and an increase in the number of contacts also induced an increase in particle stress at failure. The small particle size group in this study was precisely because of its small particle size, which leads to an increase in the number of compression contacts and continuous changes, and the particle failure stress increases in a short period of time, so the late creep development was stable and slow.
It can be seen in Figure 12 that the relative particle breakage rate of each particle size group under different stress levels shows attenuation characteristics with time. The smaller the particle size, the more obvious it is, similar to the creep deformation characteristics of coral sand. The effect of change is approximately positively correlated. Coral sand’s creep deformation and the degree of particle fragmentation respond to time in a consistent manner and have a positive correlation with the stress level. In order to investigate the state of particle fragmentation during the creep process of coral sand samples after 2 days of consolidation, taking the 1.0–2.0 mm coral sand sample as an example, the relative particle breakage rate calculated under each stress level is shown in Table 5. It can be seen in Table 5 that under the constant stress level, the crushing of coral sand particles has a certain time validity. The relative value indicates that the development of particle crushing during the creep process after consolidation is completed. It can be seen that the particle breakage during the creep process cannot be ignored and occupies a large proportion in the entire deformation process, but as the stress continues to increase, the time validity of the breakage of the coral sand particles gradually decreases. For example, at a stress level of 50 kPa, the proportion of particle fragmentation during creep during the entire deformation process is as high as 52.31%, and when the stress level is increased to 800 kPa, the proportion of particle breakage during the creep process is reduced but still accounts for 28.42%. It can be seen that under the continuous action of lower stress, the particle position adjustment and time-dependent fatigue fracture of small-sized particles in the breakage state of the particles are more than the large-sized particles, so the creep time-validity effect of small particle samples is stronger than that of large particle samples.
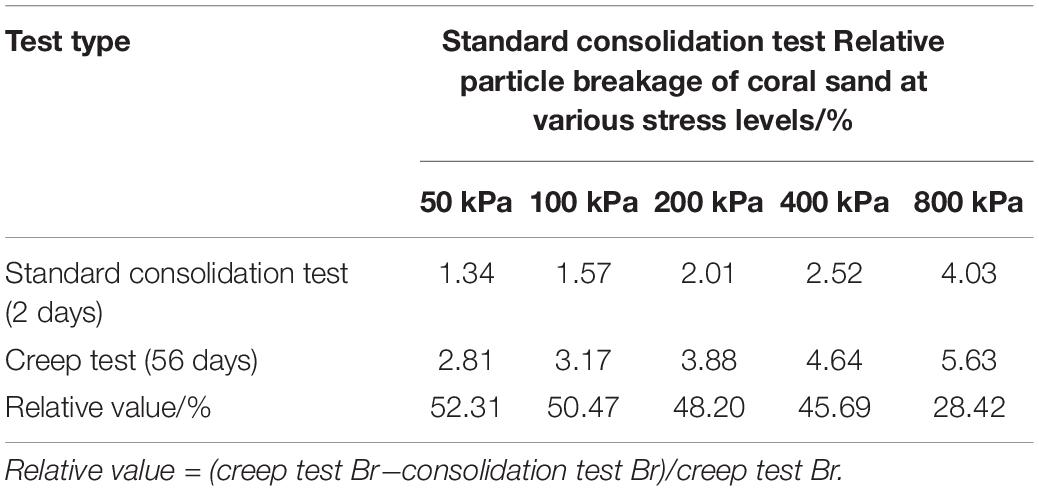
Table 5. Relative particle fragmentation rate in coral sand test (1–2 mm).
Taking the coral sand of each particle size group under the 800-kPa stress level as an example, the relative fragmentation rates and fractal dimensions obtained at different compression periods are shown in Table 6. It can be seen in Table 6 that during the creep process, the relative fragmentation rate continues to increase with time, the degree of particle fragmentation intensifies, and particle fragmentation tends to develop into a fractal distribution, but the fractal behavior is weak and has not yet reached the limit distribution state. Under the constant stress level, large particles have high edge angles, irregular shapes, and particles are more fragmented than small particles. Therefore, the relative fragmentation rate of the index, which describes the degree of fragmentation of the large-size coral sand particles, and the fractal dimension of the index, which describes the degree of fractal are larger than those values of the small-size coral sand.
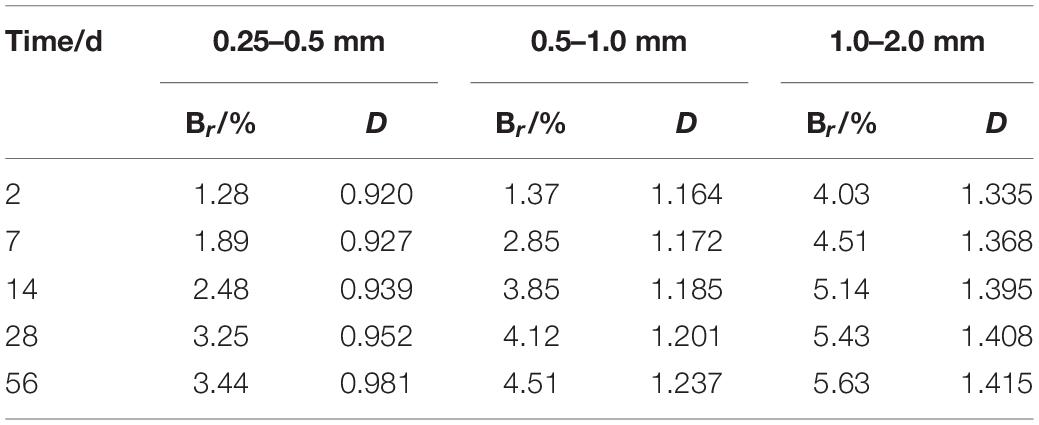
Table 6. Relative particle breakage rate and Fractal dimension at the stress level of 800 kpa.
Conclusion
Aiming at the fractal behavior of particle breakage during the mid-to-long-term settlement deformation of coral island foundations in marine islands and reefs, a series of different initial graded coral sand creep tests and confined compression tests at conventional stress levels were carried out to study PSD fractal behavior after particle crushing during creep and the effect of particle crushing on creep behavior. There are three main conclusions:
(1) Coral sand has obvious deformation aging under long-term load and exhibits significant non-linear decay creep characteristics. It has experienced rapid deformation and stable creep deformation. The strain–time curve can be described by a power function. With the increase in stress level, the creep of coral sand mainly develops from friction slip between particles to particle breakage.
(2) Coral sand of different grades tends to have self-similar fractal distribution under different stress levels. The development speed is related to the amount of broken particles, which can be described by gradually increasing fractal dimensions. Coral sand has a considerable amount of particle crushing under low stress levels, but the fractal characteristics are weak, but as long as the stress levels are high (relative to non-fragile materials), significant fractals can be observed The comparison of behavior with quartz sand further indicates that fragile coral sand has a remarkable fractal behavior under conventional stress.
(3) The isochronous curves of the relative particle breakage rate and stress level of different grades of coral sand have good self-similar characteristics. The particle breakage of the small particle size group mainly occurs and develops in the early stage of creep, and the development is stable and slow in the later stage. The effect of particle stress level of the large particle size group on the development of particle breakage is consistent. The change in relative particle breakage rate with time and the change in creep deformation with time show attenuation characteristics.
Data Availability Statement
The datasets generated for this study are included in the article/supplementary material.
Author Contributions
BC put forward the research points and contents. J-MH designed and practiced the experiment and wrote the manuscript. BC was in charge of the revised manuscript. All authors contributed to the discussion.
Funding
This work was supported by the National Natural Science Foundation of China (No. 51774131).
Conflict of Interest
The authors declare that the research was conducted in the absence of any commercial or financial relationships that could be construed as a potential conflict of interest.
References
Cao, M., and Ye, J. H. (2019). Creep-stress-time four parameters mathematical model of calcareous sand in South China Sea. Rock Soil Mech. 40, 1771–1777. doi: 10.16285/j.rsm.2018.1267
Chen, B., Chao, D. J., Wu, W. J., and Hu, J. M. (2019). Study on creep mechanism of calcareous sand based on particle breakage evolution law. J. Vibroengine. 21, 1201–1214. doi: 10.21595/jve.2019.20625
Coop, M. R., and Lee, I. K. (1993). “The behaviour of granular soils at elevated stresses,” in Predictive Soil Mechanics, Proceedings of the C. P. Wroth Memorial Symposium, eds B. G. S. Parry and R. H. G. Parry London: Thomas Telford, 186–198.
Coop, M. R., Sorensen, K. K., Freitas, B. T., and Georgoutsos, G. (2004). Particle breakage during shearing of a carbonate sand. Géotechnique 54, 157–163. doi: 10.1680/geot.2004.54.3.157
Einav, I. (2007). Breakage mechanics-Part: theory. J. Mec. Phys. Solids. 55, 1274–1297. doi: 10.1016/j.jmps.2006.11.003
Hagerty, M. M., Hite, D. R., Ullrich, C. R., and Hagerty, D. (1993). One-dimensional high-pressure compression of granular media. J. Geotech. Eng. 119, 1–18. doi: 10.1061/(ASCE)0733-94101993119:1(1)
Hardin, B. O. (1985). Crushing of soil particles. J. Geotech. Eng. 111, 1177–1192. doi: 10.1061/(ASCE)0733-94101985111:101177
Hassanlourad, M., Salehzadeh, H., and Shahnazari, H. (2008). Dilation and particle breakage effects on the shear strength of calcareous sands based on energy aspects. Int. J. Civ. Eng. 6, 108–119. doi: 10.1002/cyto.a.20969
Jang, M. J., Wu, D., and Cao, P. (2017). Connected inner pore analysis of calcareous sands using SEM. Chin. J. Geotech. Eng. 39, 1–5.
Karimpour, H., and Lade, P. V. (2013). Creep behavior in Viginia beach sand. Can. Geotech. J. 50, 1159–1178. doi: 10.1139/cgj-2012-0467
Lade, P. V., Nam, J., and Ligio, C. D. (2010). Effects of particle crushing in stress drop-relaxation experiments on crushed coral sand. J. Geotech. Geoenviron. Eng. 136, 500–509.
Lade, P. V., Yamamuro, J., and Bopp, P. (1996). Significance of particle crushing in granular materials. J. Geotech. Eng. 122, 309–316. doi: 10.1061/(ASCE)0733-94101996122:4(309)
Lee, K. L., and Farhoomand, I. (1967). Compressibility and crushing of granular soil in anisotropic triaxial compression. Can. Geotech. J. 4, 69–86. doi: 10.1139/t67-012
Lu, P., Jefferson, I. F., Rosenbaum, M. S., and Smalley, I. L. (2003). Fractal characteristics of loess formation: evidence from laboratory experiments. Eng. Geol. 69, 287–293. doi: 10.1016/S0013-7952(02)00287-9
Luzzanil, L., and Coop, M. R. (2002). On the relationship between particlebreakage and the critical state of sands. Soils Found. 42, 71–82. doi: 10.1093/heapol/14.3.243
Lv, Y., Feng, L., Liu, Y., Fan, P., and Wang, M. (2017). Comparative study of coral sand and silica sand in creep under general stress states. Can. Geotech. J. 54, 1601–1611. doi: 10.1139/cgj-2016-0295
Marone, C., and Scholz, C. H. (1989). Particle-size distribution and microstructures within simulated fault gouge. J. Struct. Geol. 11, 799–814. doi: 10.1016/0191-8141(89)90099-0
Marsal, R. J. (1973). Mechanical properties of rockfill:in embankment dam engineering (Casagrand Volume). N. Y. Wiley 1973, 109–200.
Sammis, C. G., King, G., and Biegel, R. (1987). The kinematics of gougedeformations. Pure Appl. Geophys. 125, 777–812. doi: 10.1007/bf00878033
Shen, X. H. (1985). “Study on the material characteristics of tiansheng bridge concrete face rockfill dam,” in Scientific Research Proceedings of Water Resources and Hydropower Research Institute, Beijing: Water resources and hydropower press, 65–73.
Steacy, S. J., and Sammis, C. G. (1991). An automaton for fractal patterns of fragmentation. Nature 353, 250–252. doi: 10.1038/353250a0
Todisco, M. C., Wang, W., Coop, M. R., and Senetakis, K. (2017). Multiple contact compression tests on sand particles. Soils Found. 57, 126–140. doi: 10.1016/j.sandf.2017.01.009
Tong, C. X., Zhang, S., Li, X., and Sheng, D.-C. (2015). Study on fragmentation law and fracture limit of granular materials with single particle group. Rock Soil Mech. 36, 260–264. doi: 10.16285/j.rsm.2015.s1.044
Tsoungui, O., Vallet, D., and Charmet, J.-C. (1999). Numericalmodel of crushing of grains inside two-dimensional granularmaterials. Powder Technol. 105, 190–198. doi: 10.1016/S0032-5910(99)00137-0
Turcotte, D. L. (1986). Fractals and fragmentation. J. Geotech. Eng. 91, 1921–1926. doi: 10.1029/jb091ib02p01921
Tyler, S. W., and Wheatcraft, S. W. (1992). Fractal scaling of soilparticle-size distributions: analysis and limitations. Soil Sci. Soc. Am. J. 56, 362–369. doi: 10.2136/sssaj1992.03615995005600020005x
Wang, G., Cha, J. J., and Wei, X. (2019). Evolution of particle crushing of carbonate sands under cyclic triaxial stress path. Chin. J. Rock Mech. Eng. 41, 755–760. doi: 10.11779/CJGE201904020
Wang, R., Song, C. J., and Zhao, H. T. (1997). Engineering geology of coral reef of nansha islands. Beijing Sci. Press 1997, 1–169.
Xu, X. Y., Wang, R., and Hu, M. J. (2012). Experimental study of dynamic characteristics of saturated calcareous soil explosion compaction. Rock Soil Mech. 33, 402–406.
Yang, P. L., Luo, Y. P., and Shi, Y. C. (1993). Soil fractal characteristics characterized by weight distribution of particle size. Chin. Sci. Bull. 38, 1896–1899.
Ye, J. H., Cao, M., and Li, G. (2019). Preliminary study on the creep characteristics of calcareous sand from reclaimed coral reef islands. Chin. J. Rock Mech. Eng. 38, 1242–1251.
Zhang, J. M., Jang, G. S., and Wang, R. (2009). Research on influences of particle breakage and dilatancy on shear strength of calcareous sands. Rock Soil Mech. 30, 2043–2048.
Zhang, J. M., Wang, R., and Shi, X. F. (2005). Compression and crushing behavior of calcareous sand under confined compression. Chin. J. Rock Mech. Eng. 24, 3327–3331. doi: 10.1007/s11769-005-0030-x
Zhang, J. M., Wang, R., Zhang, Y. M., and Chen, F. B. (2003). Advance in studies of soil grain crush. Rock Soil Mech. 2003, 661–665. doi: 10.16285/j.rsm.2003.s2.158
Zhang, J. R., Hu, Y., Zhang, B. W., and Liu, Y.-Z. (2015). Fractal behavior of particle-size distribution during particle crushing ofquartz sand and gravel. Chin. J. Geotechn. Eng. 37, 784–791. doi: 10.11779/CJGE201505003
Zhang, L., Nguyen, N. G. H., Lambert, S., Nicot, F., Prunier, F., Djeran-Maigre, I., et al. (2017). The role of force chains in granular materials: from statics to dynamics. Eur. J. Environ. Civ. Eng. 21, 874–895. doi: 10.1080/19648189.2016.1194332
Zhao, Y. L., Tang, J. Z., Chen, Y., Zhang, L. Y., Wang, W. J., Wan, W., et al. (2017a). Hydromechanical coupling tests for mechanical and permeability characteristics of fractured limestone in complete stress-strain process. Environ. Earth Sci. 76, 1–18.
Zhao, Y. L., Wang, Y. X., and Tang, L. M. (2019a). The compressive-shear fracture strength of rock containing water based on druker-prager failure criterion. Arab. J. Geosci. 12:452.
Zhao, Y. L., Wang, Y. X., Wang, W. J., Tang, L. M., and Liu, Q. (2019b). Modeling ofrheological fracture behavior of rock cracks subjected to hydraulicpressure and farfield stresses. Theor. Appl. Fract. Mech. 101, 59–66.
Zhao, Y. L., Wang, Y. X., Wang, W. J., Wan, W., and Tang, J. Z. (2017b). Modeling of non-linear rheological behavior of hard rock using triaxialrheological experimen. Int. J. Rock Mech. Min. Sci. 93, 66–75.
Zhao, Y. L., Zhang, L. Y., Wang, W. J., Tang, J. Z., Lin, H., and Wan, W. (2017c). Transient pulse test and morphological analysis of single rock fractures. Int. J. Rock Mech. Min. Sci. 91, 139–154.
Keywords: coral sand, creep, particle crushing, fractal behavior, evolution law
Citation: Chen B and Hu J-M (2020) Fractal Behavior of Coral Sand During Creep. Front. Earth Sci. 8:134. doi: 10.3389/feart.2020.00134
Received: 14 December 2019; Accepted: 08 April 2020;
Published: 24 June 2020.
Edited by:
Yanlin Zhao, Hunan University of Science and Technology, ChinaReviewed by:
Zhong-ming He, Changsha University of Science and Technology, ChinaYong He, Central South University, China
Kostas Senetakis, City University of Hong Kong, Hong Kong
Lingyun You, Michigan Technological University, United States
Copyright © 2020 Chen and Hu. This is an open-access article distributed under the terms of the Creative Commons Attribution License (CC BY). The use, distribution or reproduction in other forums is permitted, provided the original author(s) and the copyright owner(s) are credited and that the original publication in this journal is cited, in accordance with accepted academic practice. No use, distribution or reproduction is permitted which does not comply with these terms.
*Correspondence: Bin Chen, NDAzMDIxMjM1QHFxLmNvbQ==