 Outi Meinander
 Anna Kontu
 Rostislav Kouznetsov
 Mikhail Sofiev
- 1Atmospheric Composition Research Unit, Climate Research Programme, Finnish Meteorological Institute, Helsinki, Finland
- 2Earth Observation Research Unit, Space and Earth Observation Centre, Finnish Meteorological Institute, Sodankylä, Finland
- 3Obukhov Institute for Atmospheric Physics, Moscow, Russia
In the Arctic areas, the influence of global climate change is enhanced. Enabling a better understanding of the changes in the Arctic environment is of the utmost importance. The deposition of local and long-range transported air pollutants includes light-absorbing aerosols, such as black carbon (BC), which darken bright surfaces and induce snow melt. In 2009–2013, surface snow was sampled on a weekly basis during autumn, winter and spring at the Arctic Space Center of the Finnish Meteorological Institute in Sodankylä, which is located north of the Arctic Circle (67.37° N, 26.63° E). Snow samples were analyzed for BC with an Organic/Elemental Carbon Aerosol (OCEC) analyzer. These data were combined with SILAM modeling (System for Integrated modeLing of Atmospheric coMposition) to reveal the origin and temporal (weekly, monthly, and seasonal) variability of black carbon in seasonal snow. Quantitative footprint calculations for the BC observations were performed with the SILAM-model considering emission sources at all heights and including also the sensitivity to the local and near-surface sources. The median BC concentration in snow was 25 μg/kg (number of samples n = 107, skewness γ1 = 0.12, 75th percentile Q3 = 42 μg/kg), determined as [μg-EC/L-H2O]. During snow accumulation season, the median surface snow black carbon concentration was 21 μg/kg (n = 78, γ1 = 1.5, Q3 = 33 μg/kg), and during melt season, it was 57 μg/kg (n = 29, γ1 = 2.2, Q3 = 85 μg/kg). The melt period was identified using snow depth data from the Sodankylä station. The highest values in spring represented the enrichment of BC to the snow surface due to seasonal snow melt. The spring melt BC enrichment ratio was 2.7 (calculated as the ratio of median spring melt season concentration to median accumulation season snow concentration). The results showed that increased surface snow BC concentrations (>30 μg/kg) were due to air masses originating from the Murmansk region in Russia, where smelting and mining industries are located. The temporal variability of BC in snow was high and depended on atmospheric and cryospheric processes, mostly the origin of BC due to atmospheric transport and dry and wet deposition processes, as well as post-depositional snow processes.
Introduction
The influence of climate change is enhanced in the Arctic in comparison to other areas (Serreze and Barry, 2011). Enabling a better understanding of the changes in the Arctic climate and environment is of the utmost importance. In addition to temperature feedbacks, other feedbacks such as ice-albedo feedback contribute to Arctic amplification (Boy et al., 2019), i.e., greater warming in the region. Ice-albedo feedback is greatly influenced by the deposition of local pollution and pollution transported over long distances. This includes light-absorbing aerosols, such as black carbon (BC), which darken bright surfaces, induce snow melt, and enhance Arctic climate change (IPCC, 2019). Black carbon is a light-absorbing aerosol originating mainly from the incomplete combustion of carbonaceous materials like fossil fuels and biomass. Various cryospheric and climatic impacts of BC in snow and ice have been widely investigated (e.g., Forsström et al., 2009; Doherty et al., 2010; Meinander et al., 2014; Peltoniemi et al., 2015), and detailed scientific assessments have been presented in Bond et al. (2013), in the Arctic Monitoring Assessment Programme report (AMAP, 2015) and in the Intergovernmental Panel on Climate Change report (IPCC, 2019).
Long-range transported industrial and biofuel burning emissions, mostly outside the Arctic, i.e., from Europe, East Asia, the former Soviet Union, and North America, contribute to the black carbon observed in the Arctic region (Sharma et al., 2013; Jiao et al., 2014). Half of the BC originating from biomass in the Arctic is estimated to have come from Europe, North America, and Russia, each contributing 10–15% (Koch and Hansen, 2005). Also, Europe, Russia, and South Asia each contribute about 20–25% of BC to the low-altitude springtime “Arctic haze,” which consists primarily of anthropogenic particles with high sulfur concentrations and other components such as soot, with a contribution from BC released in the atmosphere via gas flaring (Stohl et al., 2013).
Black carbon is a short-lived climate forcer (SLCF) that undergoes regional and intercontinental transport from source regions during its short atmospheric lifetime. When emitted, BC is mostly hydrophobic (Laborde et al., 2013) but can become coated with water-soluble components through atmospheric aging processes in which it changes from hydrophobic to hydrophilic. The atmospheric removal of BC occurs within a few days to weeks via precipitation and contact with surfaces (Bond et al., 2013). The atmospheric lifetime of BC can be largely determined by factors that control local deposition rates, e.g., precipitation (Zhang et al., 2015), turbulence (Emerson et al., 2018), and breakdown of temperature inversions in spring (Stohl, 2006). Wet-scavenging processes (in-cloud and below-cloud scavenging) are a major source of uncertainty in predicting atmospheric BC concentrations over remote regions (Schwarz et al., 2010). Arctic climate response has been found to be sensitive to the vertical distribution and deposition efficiency of black carbon reaching the Arctic (Flanner, 2013). Normalized to the mass of emissions, BC emissions within the Arctic have been shown to induce warming about five times greater than emissions from middle latitudes because there is a higher fraction of within-Arctic emissions deposited in snow and sea ice than mid-latitude emissions (Sand et al., 2013). A significantly longer BC impact takes place through deposition and accumulation in the cryosphere, continuing until snow or ice has melted. The deposition of BC in snow or ice reduces surface albedo and contributes to earlier and more rapid snow and ice melt (Warren and Wiscombe, 1980; Hansen and Nazarenko, 2004; Flanner et al., 2007; Xu et al., 2009; Bond et al., 2013; Peltoniemi et al., 2015). The widest Arctic data set for BC snow content is presented in Doherty et al. (2010), with a pan-Arctic network of observations using one sampling and analysis protocol for all the sites. The origin of black carbon in snow has been studied, e.g., in Wang et al. (2011); Eckhardt et al. (2017) and Mori et al. (2019).
Simple backward trajectories can be used for a qualitative analysis of the origins of pollution in the air. The pollution origin in the current study has been computed using the adjoint dispersion formalism, which, unlike the often-used back-trajectory approach, accounts for the full list of relevant processes rather than a back-transport of the mean wind. In application to the BC snow samples, the crucial processes were scavenging with snow, dry deposition and sedimentation (for coarse aerosols). The outcome of the adjoint computations, the footprints, allow for quantitative analysis of the sources of pollution that affected the specific observation. The observations were performed in Sodankylä (67°36 N, 26°62 E), Finland, north of the Arctic Circle, with week-long sampling over inters 2009–2013 and subsequent sprint-time snow-melt seasons. The SILAM-model (System for Integrated modeLing of Atmospheric coMposition) was subsequently applied to each sample computing its footprint. The results were grouped and processed statistically thus revealing the sources affecting the monitoring site.
Materials and Methods
Site Description
Sodankylä is situated north of the Arctic Circle, in the boreal forest zone (Figure 1). The Arctic Space Center in Sodankylä is located at 67.37° N, 26.63° E, 7 km south of the Sodankylä town center. The station area consists of coniferous forests and open areas on mineral soil, as well as an open peat bog (Leppänen et al., 2016). Snow falls in Sodankylä in October, and snowpack reaches its maximum depth (79 cm on average) in late March and melts in mid-May (Pirinen et al., 2012). The monthly average air temperature is below 0°C from November to April, and the average annual precipitation is 527 mm. The snow conditions belong to the taiga class (Sturm and Holmgren, 1995). The station sites include regular manual and automatic snow measurements. Manual snow measurements cover snow depth and snow water equivalent (SWE), as well as snow macro- and microstructures at several sites for temperature, density, stratigraphy, grain size, specific surface area (SSA), and liquid water content (LWC), as detailed in Leppänen et al. (2016). Automatic observations include, for example, snow height, SWE, broadband albedo, and a snow temperature profile. More details about instrumentation (description, coordinates, sensor types, and data availability) can be found at http://litdb.fmi.fi. Snow-related Sodankylä measurements also include the automatic weather station (AWS) data, the micrometeorological mast (Kangas et al., 2016), the road weather station (Sukuvaara et al., 2016), the UV measurement field (Meinander et al., 2013; Mäkelä et al., 2016), the distributed soil moisture and frost stations (Ikonen et al., 2015), and the optical laboratory (Lakkala et al., 2016). The area is characterized with very low wind speeds, e.g., with a monthly wind speed average of 2.5–2.9 m s−1 above the treetops and a 2-year average during the snow season at 1.5 m height in a forest opening of 1.17 +/− 0.56 m/s−1 (Pirinen et al., 2012). The station is part of the World Meteorological Organization (WMO) Global Cryosphere Watch (GAW) network. Synoptic weather observations have been made in Sodankylä since 1908; the first measurements were taken in the town center, and since 1913, they have been taken at the current research station area (Tietäväinen et al., 2010). In this study, the daily snow depth measured at the Sodankylä Tähtelä station during 2009–2013 was used (FMI-ARC database, 2020). These data are available from http://litdb.fmi.fi, under the Creative Commons Attribution 4.0 International License (CC BY 4.0).
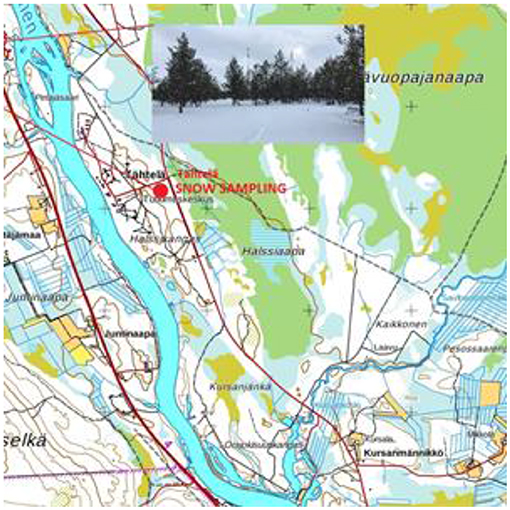
Figure 1. Map of the sampling location in Sodankylä, north-up map orientation. All the snow samples represented one location, shown in the photograph. The sampling site is inside the FMI Sodankylä Space and Earth Observation Center area, 67.37° N, 26.63° E. (National Land Survey open data Attribution CC 4.0 license).
Snow Sampling and OCEC Analysis
Between 21 January, 2009, and 3 May, 2013, during snow season, surface snow was sampled on a weekly basis at the Finnish Meteorological Institute's Arctic Space Center in Sodankylä (67.37° N, 26.63° E), 67 km north of the Arctic Circle (Table 1). A total of 107 weekly samples of BC in snow were collected from one location. These data were used to study the origin and temporal variability of black carbon in surface snow. The samples were collected at the end of the work week (Thursday–Friday) to avoid contamination from wood-stove saunas, the main local sources of BC in the air. First, two to three centimeters of surface snow was collected, always from the same sampling field (Figure 1) dedicated to weekly BC sampling, using the same sampling tool and plastic container each time. The field was located inside a fenced area in order to prohibit reindeer from destroying or contaminating the snow pack. Sampling started at the beginning of snow season in one spot in the sampling field, and each week, the sampling spot progressed along a line, one side after another, creating a path in the field. The site is in the vicinity of the Arctic Space Center sounding station, where the sample was taken immediately after sampling. The snow sample was then melted in a microwave oven, after which the meltwater was filtered through sterilized micro-quartz filters (Munktell, 55 mm diameter) using a hand pump attached to the filtering system to create a vacuum during filtering. Filters were dried and analyzed with a Thermal-Optical Carbon Aerosol Analyzer (OCEC) [Sunset Laboratory Inc. (2018) Forest Grove, USA] for their elemental carbon (EC), organic carbon (OC), and total carbon (TC) concentrations. The volume of meltwater was used for concentration conversions into μg/kg, which is equal to parts per billion by mass (ppb), and is determined as μg-EC/L-H2O in the OCEC method. The thermal-optical OCEC method is the current European standard for determining atmospheric BC (Brown et al., 2017; CEN-TC264, 2017). Here, the NIOSH 5040 protocol developed by Birch (2003) was used. The thermal-optical method was created by Birch and Cary (1996), in which a more detailed description of the method can be found.
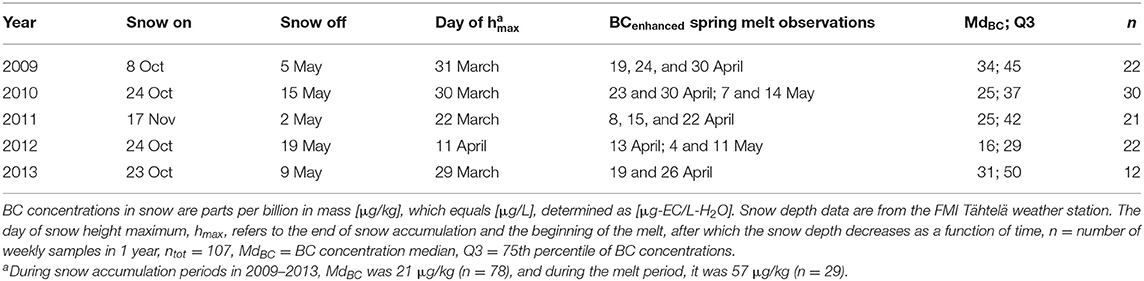
Table 1. Summary of snow and black carbon data for 2009–2013 around the Sodankylä Arctic Space Center area.
SILAM Modeling
Possible origins of the snow sample impurities were estimated through analyses of so-called footprints of the observations. This approach is based on solving the adjoint dispersion equation (Sofiev et al., 2015), which is done separately for each observation. The problem is solved backwards in time; it starts from the end of the observational interval so that the resulting field represents the sensitivity distribution of that particular observation to the emission sources located within the area covered by the footprint and emits at the corresponding time period. In particular, the observed values can be affected only by the emission fluxes from the area when and where the footprint is non-zero. This sensitivity field has certain analogies with the spatial-temporal density of a continuum of backward trajectories. It should be stressed, however, that the footprint is not a probability distribution for the possible source locations: a higher sensitivity to some area evidently does not imply a higher probability for the source to be located in this area.
The simulations were performed with the System for Integrated modeling of Atmospheric coMposition (SILAM, http://silam.fmi.fi, accessed 24.03.2020; Galperin, 2000; Sofiev, 2002; Sofiev et al., 2015), which is an offline global-to-meso-scale chemistry transport model. The operational evaluation of SILAM had been performed on a regular basis for many years within the scope of the Copernicus Atmospheric Monitoring Service (CAMS) and its predecessors (http://atmosphere.copernicus.eu, accessed 24.03.2020), as well as within several research projects all over the world (Huijnen et al., 2010; Brasseur et al., 2019; Petersen et al., 2019). In the current study, SILAM was used for the footprint calculations following the approach we developed and applied for source apportionment tasks (in, e.g., Saarikoski et al., 2007; Siljamo et al., 2008; Prank et al., 2010; Veriankaite et al., 2010).
Three-hourly meteorological fields from short-term operational forecasts of the European Center for Medium-Range Weather Forecasts (ECMWF) were used as a driver for SILAM. The adjoint simulations were performed with a resolution of 0.5 × 0.25 degrees on a domain of 10–60°E, 55–75°N with eight stacked layers of thickness (30, 70, 100, 200, 500, 1,000, 2,000, 2,000 m) covering a height range from the surface to 5.9 km. The simulations were separately run for each observation 5 days back in time, with an internal time step of 30 min and hourly output. Note, however, that the precision of the snowfall timing in the simulations is controlled by the time step of the driving meteorology.
To minimize the effect of dry deposition and to ensure consistency between observed and modeled snowfalls, only such cases were selected in which snowfall was reported by both the weather station at Sodankylä and the meteorological driver to be more than 1 mm snowfall within 24 h before sample collection and in which the amount of precipitation agreed within a factor of two between them (Figure 2). The uptake of the soot by snow was parameterized in a simple way: the in-snow BC content was used as a proxy for the in-air concentration within the scavenging height range. Two scenarios for scavenging were considered. The first was “below-cloud,” where the in-snow BC was assumed to be representative of the in-air concentration average within the height range from the ground to 0.8 hcloud, the second was “in-cloud,” 0.8–1.2 hcloud, where hcloud was the height of the center of mass of the condensed cloud water from the meteorological model. The temporal distribution of the sensitivity was weighted according to the snowfall intensity from the meteorological model so that the total sensitivity is unity.
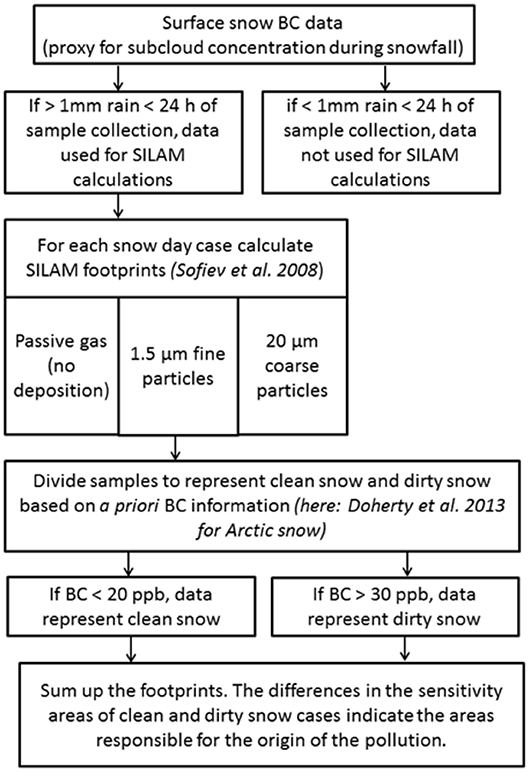
Figure 2. Illustration of the algorithm.
To reduce the impact of uncertainty in the vertical distribution of the sources of black carbon, the 3D adjoint-sensitivity distribution was processed into the 2D footprint by taking maximum of the vertical profile of the sensitivity in each grid cell at each time. With such processing, all emission sources emitting at all heights within the footprint were included and accounted for their (potential) contribution to the observations.
The volumetric content of black carbon was used as a tracer of anthropogenic pollution. With the above criteria, “clean” (<20 μg/kg of BC based on Doherty et al., 2010, 2013) and “dirty” (>30 μg/kg of BC) samples were selected, and the in-cloud and sub-cloud footprints for both classes were calculated. Since the size of airborne black carbon is unknown, the footprints were calculated for passive gas with no deposition for 1.5 μm (fine) particles and for 20 μm (coarse) particles. Since uncertainties in the input data and the parametrizations are very large, we limit our considerations to comparisons of average “clean” and “dirty” footprints, giving equal weight to the footprints in each class.
Results
Snow Concentrations
The distribution of black carbon values was found to be positively skewed (number of samples n = 107, skewness γ1 = 0.12). Therefore, the results are reported using median and 75th percentile, instead of average and standard deviation which are valid for normally distributed data. From 21 January, 2009, to 3 May, 2013, the median BC concentration (n = 107) in surface snow in Sodankylä was 25 μg/kg, and the 75th percentile was Q3 = 42 μg/kg (Table 1). In spring, increased BC concentrations (ranging from 53 to 293 μg/kg) in seasonal snow melt (Figure 3) were observed during each of the five consecutive springs (Figure 4). The highest values represented the enrichment of BC to the snow surface due to post-depositional snow processes. The spring BC enrichment ratio was 2.7, calculated as the ratio of 50th percentile (median) of spring melt season concentration to accumulation season snow concentration, ntot = 107. The melt period was identified using snow depth data from the FMI Tähtelä weather station and was defined as the period in spring starting from the day when snow depth begins to decrease as a function of time (Table 1, snow accumulation period = from “snow on” to “day of hmax;” snow melt period = from “day of hmax” to “snow off”). The differences (d) in concentrations between consecutive weeks (x) were calculated for each week as di=|xi-xi+1|. The maximum difference was 252 μg/kg in late spring and the minimum difference was 0 μg/kg, meaning that the same concentration of BC was observed during two consecutive weeks. The original black carbon concentration data are presented in (Table 2).
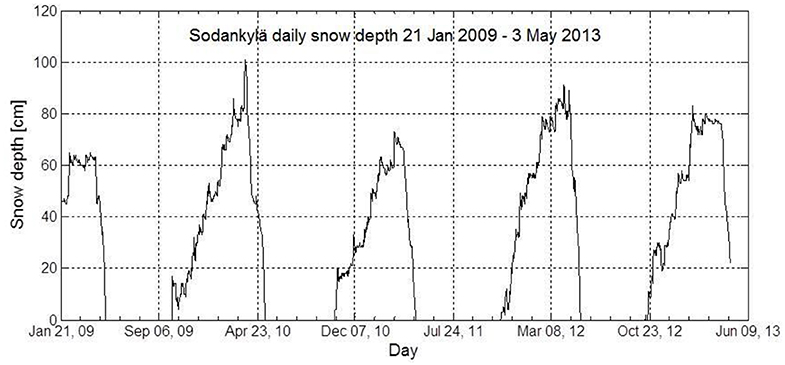
Figure 3. Daily snow depth at Sodankylä during 21 January, 2009–3 May, 2013.
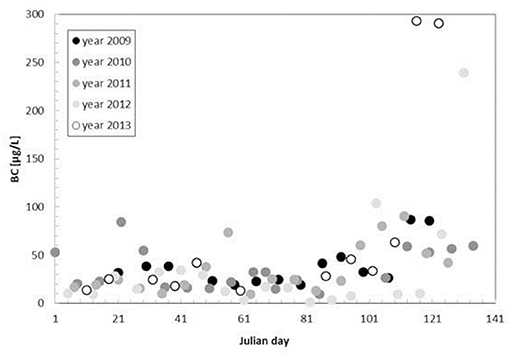
Figure 4. Black carbon in snow [μg/L] in Sodankylä during five snow melt seasons, taken each spring during 2009–2013, Julian day 1–141 (day of the year).
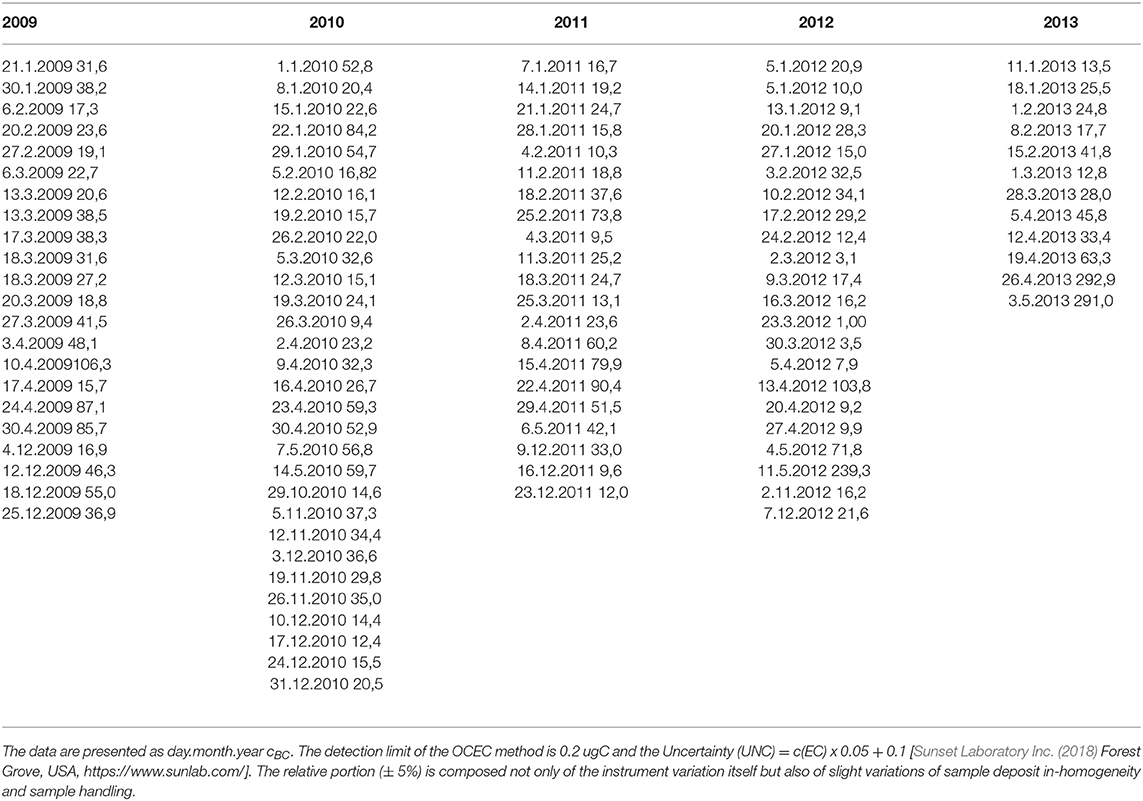
Table 2. Sodankylä observations in 2009–2013 on BC concentrations in snow [μg/kg], which equals [μg/L], determined as [μg-EC/L-H2O].
SILAM Model Results
Figure 5 shows average footprints for in-cloud and sub-cloud scavenging for “clean” and “dirty” snow for (i) passive gas, i.e., substance with no deposition, decay; (ii) fine aerosol that has little deposition; and (iii) coarse aerosol that is subject to intensive wet and dry deposition. The deposition rate controls the extent of a footprint for each species. The comparison of “clean” and “dirty” patterns clearly reveals a sensitivity area at the Kola Peninsula for “dirty” footprints that correspond to a gap in sensitivity for “clean samples.” The gap is most pronounced for fine aerosol particles (middle panels), which are likely to be responsible for the snow pollution.
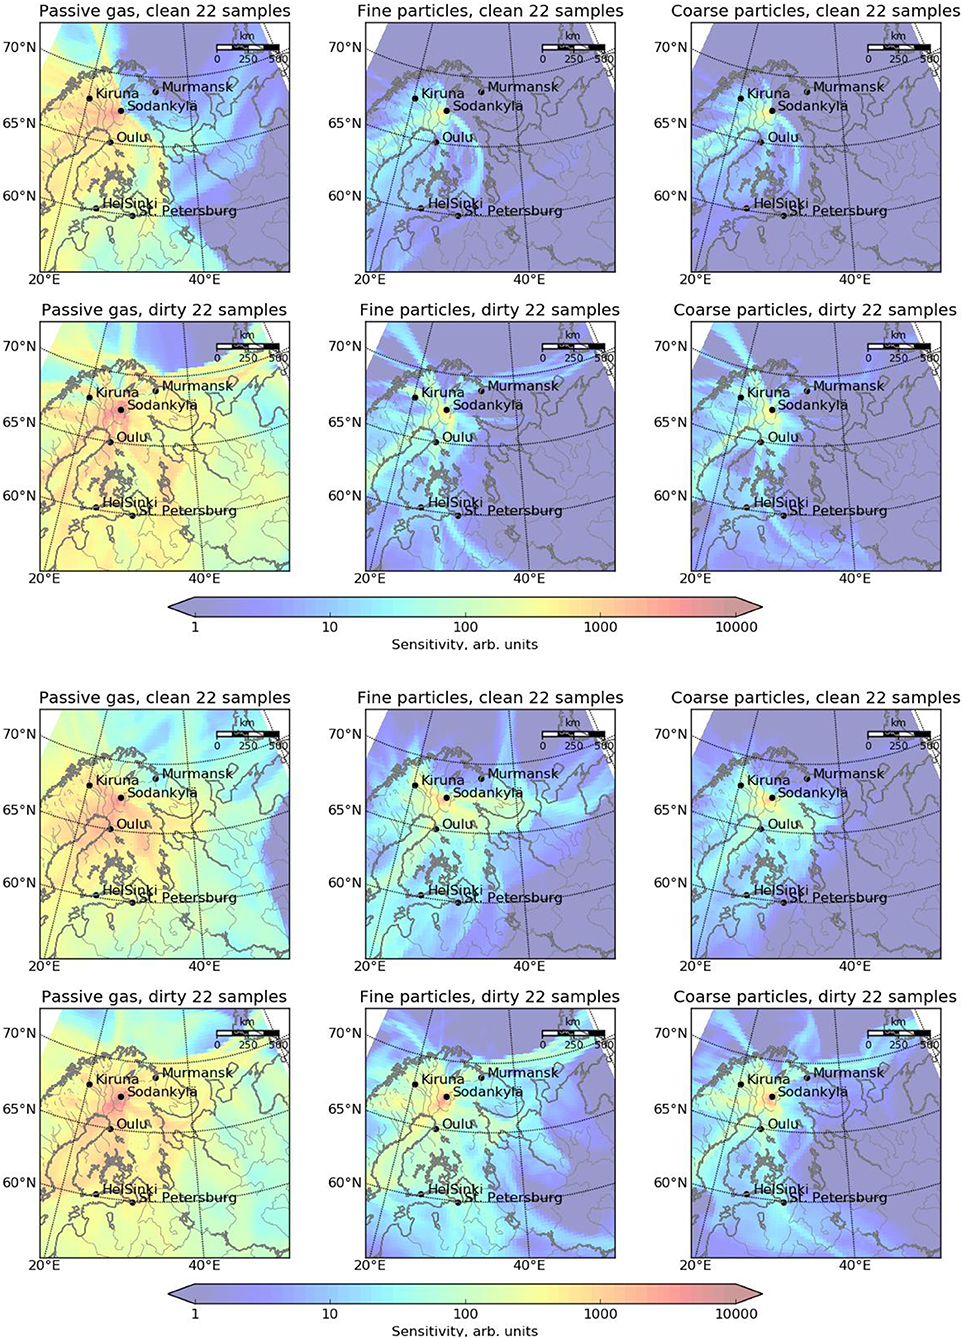
Figure 5. (A) In-cloud and (B) sub-cloud SILAM footprint calculations. The footprints where smelting and mining industries are located. The passive in-cloud and fin for “clean” (upper) and “dirty” snowfall (lower), on the basis of measured BC mixing ratio in surface-snow samples, for (i) passive gas (no deposition, decay, etc., left), (ii) fine aerosol (middle), and (iii) coarse aerosol (right). Arbitrary unit (arb.unit) refers to procedure defined unit (abbreviated p.d.u.) of sensitivity.
Hence, the modeling results showed that increased surface snow BC concentrations (>30 μg/kg) were due to air masses originating from the Murmansk region, Kola Peninsula, Russia, where smelting and mining industries are located (Figure 5). The passive in-cloud and fine-particle sub-cloud results also suggest that Helsinki (Finland), St. Petersburg (Russia), and Western Russia could also contribute to increased black carbon observed in snow in Sodankylä during 2009–2013. These areas, however, are covered by one or two individual dirty footprints, so no solid conclusion can be made for these locations.
Discussion and Conclusions
Light-absorbing impurities in snow darken the surface and enhance snow melt. The BC in Arctic snow can originate from local, regional, or long-range transported BC aerosols, which deposit as dry and wet deposition. Here, the aim was to investigate the origin and temporal variability of black carbon observed in surface snow in Sodankylä, north of the Arctic Circle. For this purpose, BC observations were coupled with a quantitative long-range transport modeling approach. The data consisted of 107 weekly observations at one location in 2009–2013 during the snow season, including five consecutive seasonal spring melt periods. BC in the snow samples was analyzed using the European Union standard for atmospheric black carbon analysis, the thermal-optical OCEC.
SILAM-model was the key used to explain where the detected black carbon can originate from. In this study, the model-observation coupled approach included the sensitivity to the local and near-surface sources for the first time. The modeling results showed that increased surface snow BC concentrations (>30 μg/kg) were due to air masses originating from the Murmansk region, Kola Peninsula, Russia, e-particle sub-cloud results suggested that Helsinki (Finland), St. Petersburg (Russia) and Western Russia could also contribute to increased BC observed in snow in Sodankylä during 2009–2013. The modeling result of the origin of increased BC concentrations in snow is valid for the period of time investigated here, i.e., 2009–2013. A new investigation is needed for any other period to detect a possible change in emission sources. Direct quantification of the footprint uncertainties is not possible because footprint is not a measured quantity. However, SILAM model itself is a very extensively evaluated tool, both in operational and research context. The following uncertainties and means of mitigation of their impact are identified here:
i) The observed snow black carbon concentrations may vary largely with snowfall intensity. In other words, higher BC concentrations do not necessarily mean higher contributions of BC sources. However, the intensity of the snowfall is explicitly treated by SILAM as a part of adjoint dispersion equation. The issue however remains because the intensity of individual snowfalls has comparatively low accuracy. This could influence the results and interpretation of the results. Therefore, the consideration was limited to qualitative comparison of the mean footprints.
ii) Due to uncertainties in the parametrizations. The primary contributor is the scavenging with snow, which is comparatively less accurate than that with rain. However, the operational evaluation of Copernicus Atmospheric Monitoring Service (http://atmosphere.copernicus.eu) shows that SILAM skills do not degrade in winter, confirms the balanced parameterizations.
iii) To additionally reduce the impact of uncertainties in the meteorology and scavenging processes, as well as of the limited number of samples, the observed samples were split to two groups—“clean” and “dirty.” Corresponding footprints were also grouped and considerations were then focused on these averaged footprints, giving equal weight to the footprints in each class, which allowed more robust statistical processing.
Earlier, with the focus on explaining the measured low snow albedo values, a shorter and smaller data set of black carbon in snow in Sodankylä was used to calculate the average footprints with SILAM (Meinander et al., 2013), not including modeling of local sources. Here, with two times more observational cases fulfilling the footprint calculation criteria, the longer and bigger data set allowed for separate calculations of in-cloud and sub-cloud footprints and including also the sensitivity to the local and near-surface sources. Hence, a more reliable analysis of the origin of black carbon in snow was gained. The pattern found using the footprint calculations agreed not only that the location of the main air pollution sources in the region (Prank et al., 2010) are smelting, mining and refining industries located on the Kola Peninsula, but also with our earlier average footprint results using a smaller data set (Meinander et al., 2013). These SILAM model results can be further compared with the annual total EC emission data of Figure 6 (CAMS-REG v3.1 for 2016, Granier et al., 2019). These emission results also confirm that the area around Murmansk is the major emitter in the region.
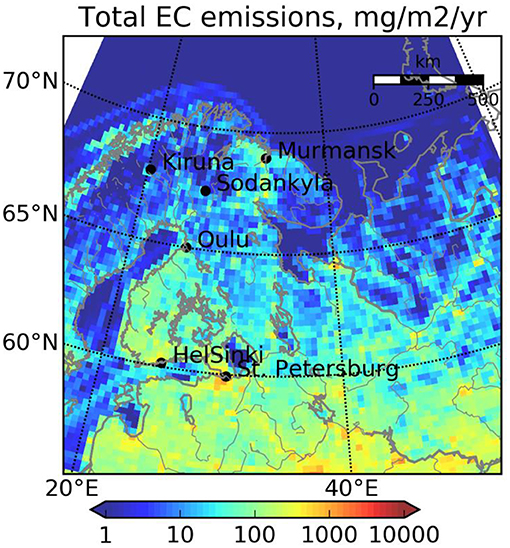
Figure 6. Annual total EC emissions according to the CAMS-REG v3.1 for 2016 (Granier et al., 2019).
The observed snow BC concentrations may vary largely with snowfall intensity. In other words, higher BC concentrations do not necessarily mean higher contributions of BC sources. To avoid the influence of this on the results and the interpretation of results, our consideration was limited to a qualitative comparison of the mean footprints. The idea of the method is to compare the footprints in areas where they differ. Large uncertainties in the meteorology and scavenging processes, as well as the limited number of samples, make quantitative analysis hardly possible. Yet, statistics were calculated using the current threshold values. Given that the total number of footprints is 22 for each class, the percentages would be more likely to represent the particular data set rather than the contribution of different areas to local pollution in general.
During snow accumulation, the median surface snow BC concentration was 21 μg/kg, and during melt, it was 57 μg/kg. The melt period was identified using snow depth data from Sodankylä station. The median BC in surface snow concentration in Sodankylä in 2009–2013 (n = 107) was 25 μg/kg. This is the same magnitude reported by Svensson et al. (2018) for Pallas in March–April 2015 (n = 10) and March 2016 (n = 2), with an average of 40 μg/kg, and with Doherty et al. (2010) who reported BC in European Arctic snow in Tromso, Norway, with an average of ~20 μg/kg and increasing to ~60 μg/kg during melt. Here, black carbon concentrations increased from 53 to 293 μg/kg during seasonal snow melt. The maximum concentrations were found in spring, influenced by the combination of long-range transported black carbon and spring melt. The highest concentrations were observed in 2013 (two data points, Figure 4) and 2012 (one data point, Figure 4). These highest values represent the largest enrichment of BC to the snow surface due to post-depositional snow processes. The multiannual data showed that black carbon concentrations in surface snow in one location can vary from 1 week to the next, from 0 μg/kg, i.e., concentration remaining the same for consecutive weeks, up to a maximum of 252 μg/kg, as detected in 2013 during intensive spring melt.
In this paper, it was also identified that these Sodankylä BC in snow concentration data did not follow the normal distribution. The distribution was skewed, and instead of using average and standard deviation values in reporting the data, median values were used together with 75th percentile values. The detection limit of the OCEC method is 0.2 ugC and the Uncertainty (UNC) = c(EC) × 0.05 + 0.1. The relative portion (± 5%) is composed not only of the instrument variation itself but also of slight variations of sample deposit in-homogeneity and sample handling (Sunset Laboratory Inc., 2018; Sunset Laboratory Inc., Forest Grove, USA, https://www.sunlab.com).
Our data showed that the temporal variability of black carbon in snow depends on atmospheric and cryospheric processes, such as the origin of BC due to atmospheric transport and dry and wet deposition processes, as identified in the footprint calculations. Black carbon concentrations are also dependent on snow melt, which is evident in the data as a repeating pattern of the spring enhancement of BC contents during each of the five springs. These processes, in turn, are affected by meteorological factors, such as rain, temperature, wind, cloudiness, solar irradiance conditions, and other environmental factors, such as topography and ground properties. The effects of meteorological factors on Sodankylä snow albedo were studied earlier in Meinander et al. (2008). Sodankylä is an ideal place for the approach presented here, as it is characterized with flat terrain and low wind speeds, where new falling snow easily remains on top of the existing seasonal snowpack during the accumulation period. In addition, when snow melt starts in Sodankylä, the snow height declines almost monotonically through the spring melt season, making it easy to sample new surface snow.
The quantitative observations modeling approach presented here can be similarly applied to any location or period without a priori knowledge of the pollution source. New surface snow samples (sampled within 24 h of snow fall) are the main requirement. Then, any unknown pollution sources can be identified, and any later changes in emissions or in long-range transport or deposition processes can be detected by applying the coupled observations modeling method presented here.
Data Availability Statement
The datasets generated for this study are available on request to the corresponding author.
Author Contributions
OM conceived the idea of the work and was the main author of the paper and the A4 research plan. AK was responsible for the Sodankylä snow sampling, provided the BC data and contributed to the writing of the paper. RK and MS were responsible for the SILAM modeling calculations and for developing the coupled observations model method, and they contributed significantly to the writing of the paper.
Funding
Funding for the original work came from the Academy of Finland's A4 Project (No. 254195). OM was also supported by the Academy of Finland's NABCEA project, the Novel Assessment of Black Carbon in the Eurasian Arctic (No. 296302); the Ministry for Foreign Affairs of Finland's IBA project, Black Carbon in the Eurasian Arctic and Significance Compared to Dust Sources (No. PC0TQ4BT-25); the EU-Interact-BLACK-project, Black Carbon in Snow and Water (H2020 Grant Agreement No. 730938); the Academy of Finland's Centers of Excellence program, The Center of Excellence in Atmospheric Science—From Molecular and Biological Processes to the Global Climate (No. 272041); and the Nordic Center of Excellence's CRAICC project, Cryosphere–Atmosphere Interactions in a Changing Arctic Climate. RK was partially supported by the Russian Foundation for Basic Research (project 19-05-01008). RK and MS were supported by the Nordic Ministry of Research's CarboNord project (KOL-1406), the Academy of Finland's A4 Project, and NordForsk under the Nordic Programme on Health and Welfare (#75007 NordicWelfAir project).
Conflict of Interest
The authors declare that the research was conducted in the absence of any commercial or financial relationships that could be construed as a potential conflict of interest.
Acknowledgments
Sodankylä personnel are acknowledged for snow sampling and filtering. OM's Ph.D. dissertation (Meinander, 2016), Effect of black carbon and Icelandic dust on snow albedo, melt and density, University of Helsinki, is acknowledged and cited accordingly. ECCAD is acknowledged for EC emission data.
References
AMAP (2015). Blasck Carbon and Ozone as Arcticclimate forcers, Arctic Monitoring and Assessment Programme Arctic Monitoring and Assessment Programme (AMAP) Oslo. p. 116. Available online at: www.amap.no.
Birch, M. E. (2003). Diesel Particulate Matter (as Elemental carbon)Method 5040, in NIOSH Manual of Analytical Methods, National Institute of Occupational Safety and Health. Cincinnati, Ohio.
Birch, M. E., and Cary, R. A. (1996). Elemental carbon-based method for monitoring occupational exposures to particulate diesel exhaust. Aerosol. Sci. Technol. 25, 221–241. doi: 10.1080/02786829608965393
Bond, T. C., Doherty, S. J., Fahey, D. W., Forster, P. M., Berntsen, T., DeAngelo, B. J., et al. (2013). Bounding the role of black carbon in the climate system: a scientific assessment. J. Geophys. Res. 118, 5380–5552. doi: 10.1002/jgrd.50171
Boy, M., Thomson, E. S., Acosta Navarro, J.-C., Arnalds, O., Batchvarova, E., Bäck, J., et al. (2019). Interactions between the atmosphere, cryosphere, and ecosystems at northern high latitudes. Atmos. Chem. Phys. 19, 2015–2061. doi: 10.5194/acp-19-2015-2019
Brasseur, G. P., Xie, Y., Petersen, A. K., Bouarar, I., Flemming, J., Gauss, M., et al. (2019). Ensemble forecasts of air quality in eastern China – part 1: model description and implementation of the marcopolo–panda prediction system, version 1. Geosci. Model Dev. 12, 33–67. doi: 10.5194/gmd-12-33-2019
Brown, R. J. C., Beccaceci, S., Butterfield, D. M., et al. (2017). Standardisation of a European measurement method for organic carbon and elemental carbon in ambient air: results of the field trial campaign and the determination of a measurement uncertainty and working range. Environ. Sci. Process Impacts 19, 1249–1259. doi: 10.1039/C7EM00261K
CEN-TC264 (2017). European Committee for Standardisation, EN 16909:2017, Ambient Air – Measurement of Elemental Carbon (EC) and Organic Carbon (OC) Collected on Filters. CEN, Brussels.
Doherty, S. J., Grenfell, T. C., Forsström, S., Hegg, D. L., Brandt, R. E., and Warren, S.G. (2013). Observed vertical redistribution of black carbon and other insoluble light-absorbing particles in melting snow. J. Geophys. Res. Atmos. 118. doi: 10.1002/jgrd.50235
Doherty, S. J., Warren, S. G., Grenfell, T. C., Clarke, A. D., and Brandt, R. E. (2010). Light-absorbing impurities in Arctic snow. Atmos. Chem. Phys. 10, 11647–11680. doi: 10.5194/acp-10-11647-2010
Eckhardt, S., Cassiani, M., Evangeliou, N., Sollum, E., Pisso, I., and Stohl, A. (2017). Source–receptor matrix calculation for deposited mass with the Lagrangian particle dispersion model FLEXPART v10.2 in backward mode. Geosci. Model Dev. 10, 4605–4618. doi: 10.5194/gmd-10-4605-2017
Emerson, E. W., Katich, J. M., Schwarz, J. P., McMeeking, G. R., and Farmer, D. K. (2018). Direct measurements of dry and wet deposition of black carbon over a grassland. J. Geophys. Res. Atmos. 123, 12277–12290. doi: 10.1029/2018JD028954
Flanner, M. G. (2013). Arctic climate sensitivity to local black carbon. J. Geophys. Res. 118, 1840–1851. doi: 10.1002/jgrd.50176
Flanner, M. G., Zender, C. S., Randerson, J. T., and Rasch, P. T. (2007). Present day climate forcing and response from black carbon in snow. J. Geophys. Res. 112:D11202. doi: 10.1029/2006JD008003
FMI-ARC database (2020). Available online at: http://litdb.fmi.fi./luo0015_data.php (accessed 27 March, 2020).
Forsström, S., Ström, J., Pedersen, C. A., Isaksson, E., and Gerland, S. (2009). Elemental carbon distribution in svalbard snow. J. Geophys. Res. 114:D19112. doi: 10.1029/2008JD011480
Galperin, M. V. (2000). “The approaches to correct computation of airborne pollution advection,” in Problems of Ecological Monitoring and Ecosystem Modelling. XVII (in Russian) (St.Petersburg: Gidrometeoizdat), 54–68.
Granier, C. S., Darras, H., Denier van der Gon, J., Doubalova, N., Elguindi, B., Galle, M., et al. (2019). The Copernicus Atmosphere Monitoring Service Global and Regional Emissions (April 2019 Version). Copernicus Atmosphere Monitoring Service (CAMS) Report. doi: 10.24380/d0bn-kx16
Hansen, J., and Nazarenko, L. (2004). Soot climate forcing via snow and ice albedos. Proc. Natl. Acad. Sci. U. S. A. 101, 423–428. doi: 10.1073/pnas.2237157100
Huijnen, V., Eskes, H. J., Poupkou, A., Elbern, H., Boersma, K. F., Foret, G., et al. (2010). Comparison of OMI NO2 tropospheric columns with an ensemble of global and European regional air quality models. Atmospheric Chem. Phys. 10, 3273–3296. doi: 10.5194/acp-10-3273-2010
Ikonen, J., Vehviläinen, J., Rautiainen, K., Smolander, T., Lemmetyinen, J., Bircher, S., et al. (2015). The sodankylä in situ soil moisture observation network: an example application to earth observation data product evaluation. Geosci. Instrum.Method Data Syst. Discuss. 5, 599–629. doi: 10.5194/gid-5-599-2015
IPCC (2019). IPCC special report on the ocean and cryosphere in a changing climate. Eds H.-O. Pörtner, D.C. Roberts, V. Masson-Delmotte, P. Zhai, M. Tignor, E. Poloczanska, K. Mintenbeck, A. Alegría, M. Nicolai, A. Okem, J. Petzold, B. Rama, N.M. Weyer. In press, Available online at: https://www.ipcc.ch/srocc/ (accessed May 13, 2020).
Jiao, C., Flanner, M. G., Balkanski, Y., Bauer, S. E, Bellouin, N, Berntsen, T. K., et al. (2014). An aerocom assessment of black carbon in Arctic snow and sea ice. Atmos. Chem. Phys. 14, 2399–2417. doi: 10.5194/acp-14-2399-2014
Kangas, M., Rontu, L., Fortelius, C., Aurela, M., and Poikonen, A. (2016). Weather model verification using Sodankylä mast measurements. Geosci. Instrum. Method. Data Syst. 5, 75–84. doi: 10.5194/gi-5-75-2016
Koch, D., and Hansen, J. (2005). Distant origins of arcticblack carbon, a goddard institute for space studies modeleexperiment. J. Geophys. Res. 110:D04204. doi: 10.1029/2004JD005296
Laborde, M., Crippa, M., Tritscher, T., Jurányi, Z., Decarlo, P. F., Temime-Roussel, B., et al. (2013). Black carbon physical properties and mixing state in the European megacity Paris. Atmos. Chem. Phys. 13, 5831–5856. doi: 10.5194/acp-13-5831-2013
Lakkala, K., Suokanerva, H., Karhu, J. M., Aarva, A., Poikonen, A., Karppinen, T., et al. (2016). Optical laboratory facilities at the Finnish Meteorological Institute—Arctic Research Centre. Geosci. Instrum. Method, Data Syst. 5, 315–320. doi: 10.5194/gi-5-315-2016
Leppänen, L., Kontu, A., Hannula, H.-R., Sjöblom, H., and Pulliainen, J. (2016). Sodankylä manual snow survey program. Geosci. Instrum. Method. Data Syst. 5, 163–179. doi: 10.5194/gi-5-163-2016
Mäkelä, J. S., Lakkala, K., Koskela, T., Karppinen, T., Karhu, J. M., Savastiouk, V., et al. (2016). Data flow of spectral UV measurements at Sodankylä and Jokioinen, Geosci. Instrum. Method. Data Syst. 5, 193–203. doi: 10.5194/gi-5-193-2016
Meinander, O. (2016). Effect of black carbon and Icelandic dust on snow albedo, melt and density. (Ph.D. dissertation thesis), Belongs to series: finnish meteorological Institute Contributions—URN:ISSN:0782-6117, University of Helsinki, Helsinki (Finland): Available online at: http://urn.fi/URN:ISBN:78-951-697-896-6 (accessed March 27, 2020).
Meinander, O., Kazadzis, S., Arola, A., Riihelä, A., Räisänen, P., Kivi, R., et al. (2013). Spectral albedo of seasonal snow during intensive melt period at Sodankylä, beyond the Arctic Circle. Atmos. Chem. Phys. 13, 3793–3810. doi: 10.5194/acp-13-3793-2013
Meinander, O., Kontu, A., Lakkala, K., Heikkilä, A., Ylianttila, L., and Toikka, M. (2008). Diurnal variations in the UV albedo of arctic snow. Atmos. Chem. Phys. 8, 6551–6563. doi: 10.5194/acp-8-6551-2008
Meinander, O., Kontu, A., Virkkula, A., Arola, A., Backman, L., DagssonWaldhauserová, P., et al. (2014). Brief communication: Light-absorbing impurities can reduce the density of melting snow. Cryosphere. 8, 991–995. doi: 10.5194/tc-8-991-2014
Mori, T., Goto-Azuma, K., Kondo, Y., Ogawa-Tsukagawa, Y., Miura, K., Hirabayashi, M., et al. (2019). Black carbon and inorganic aerosols in Arctic snowpack. J. Geophys. Res. Atmos. 124, 13325–13356. doi: 10.1029/2019JD030623
Peltoniemi, J. I., Gritsevich, M., Hakala, T., Dagsson-Waldhauserová, P., Arnalds, Ó., Anttila, K., et al. (2015). Soot on Snow experiment: bidirectional reflectance factor measurements of contaminated snow. Cryosphere 9, 2323–2337. doi: 10.5194/tc-9-2323-2015
Petersen, A. K., Brasseur, G. P., Bouarar, I., Flemming, J., Gauss, M., Jiang, F., et al. (2019). Ensemble forecasts of air quality in eastern China–Part 2: evaluation of the MarcoPolo–Panda prediction system, version 1. Geosci Model Dev 12, 1241–1266. doi: 10.5194/gmd-12-1241-2019
Pirinen, P., Simola, H., Aalto, J., Kaukoranta, J.-P., Karlsson, P., and Ruuhela, R. (2012). Climatological Statistics of Finland 1981–2010, Finnish Meteorological Institute Reports. 2012:96. Available online at: www.fmi.fi
Prank, M., Sofiev, M., Denier van der Gon, H. A. C., Kaasik, M., Ruuskanen, T. M., and Kukkonen, J. (2010). A refinement of the emission data for Kola Peninsula based on inverse dispersion modeling. Atmos. Chem. Phys. 10, 10849–10865. doi: 10.5194/acp-10-10849-2010
Saarikoski, S., Sillanpaa, M., Sofiev, M., Timonen, H., Saarnio, K., Teinela, K., et al. (2007). Chemical composition of aerosols during a major biomass burning episode over northern Europe in spring 2006: experimental and modelling assessments. Atmos. Environ. 41, 3577–3589. doi: 10.1016/j.atmosenv.2006.12.053
Sand, M., Berntsen, T., Kay, J. E., Lamarque, J. F., Seland, O., and Kirkevag, A. (2013). The Arctic response to remote and local forcing of black carbon. Atmos. Chem. Phys. 13, 211–224 doi: 10.5194/acp-13-211-2013
Schwarz, J. P., Spackman, J. R., Gao, R. S., Watts, L., Stier, P., Schulz, M., et al. (2010). Global-scale black carbon profiles observed in the remote atmosphere and compared to model. Geophys. Res. Lett. 37:L18812. doi: 10.1029/2010GL044372
Serreze, M. C., and Barry, R. G. (2011). Processes and impacts of arctic amplification: a research synthesis. Global Planet. Change 77, 85–96. doi: 10.1016/j.gloplacha.2011.03.004
Sharma, S., Ishizawa, M., Chan, D., Lavoué, D., Andrews, E., Eleftheriadis, K., et al. (2013). 16-years simulation of Arctic black carbon: transport, source contribution, and sensitivity analysis on deposition. J. Geophys. Res. 118, 1–22. doi: 10.1029/2012JD017774
Siljamo, P., Sofiev, M., Severova, E., Ranta, H., Kukkonen, J., Polevova, S., et al. (2008). Sources, impact and exchange of early-spring birch pollen in the Moscow region and Finland. Aerobiologia 24, 211–230. doi: 10.1007/s10453-008-9100-8
Sofiev, M. (2002). Extended resistance analogy for construction of the vertical diffusion scheme for dispersion models. J. Geophys. Res. Atmos. 107:4159. doi: 10.1029/2001JD001233
Sofiev, M., Vira, J., Kouznetsov, R., Prank, M., Soares, J., and Genikhovich, E. (2015). Construction of the SILAM Eulerian atmospheric dispersion model based on the advection algorithm of Michael Galperin. Geosci. Model Dev. 8, 3497–3522. doi: 10.5194/gmd-8-3497-2015
Stohl, A. (2006). Characteristics of atmospheric transport into the Arctic troposphere. J. Geophys. Res. 111:D11306. doi: 10.1029/2005JD006888
Stohl, A., Klimont, Z., Eckhardt, S., Kupiainen, K., Shevchenko, V. P., Kopeikin, V. M., et al. (2013). Black carbon in the Arctic:the underestimated role of gas flaring and residential combustion emissions. Atmos. Chem. Phys. 13, 8833–8855. doi: 10.5194/acp-13-8833-2013
Sturm, M., and Holmgren, J. (1995). A seasonal snow cover classification system for local to global applications. J. Climate 8, 1261–1283. doi: 10.1175/1520-0442(1995)008<1261:ASSCCS>2.0.CO;2
Sukuvaara, T., Mäenpää, K., and Ylitalo, R. (2016). Vehicular-networking- and road-weather-related research in Sodankylä. Geosci. Instrum. Method. Data Syst. 5, 513–520. doi: 10.5194/gi-5-513-2016
Sunset Laboratory Inc. (2018). Organic Carbon / Elemental Carbon (OCEC) Laboratory Instrument Manual. Sunset Laboratory Inc, Forest Grove. Available online at: www.sunlab.com (accessed April 8, 2020).
Svensson, J., Ström, J., Kivekäs, N., Dkhar, N. B., Tayal, S., et al. (2018). Light-absorption of dust and elemental carbon in snow in the Indian Himalayas and the Finnish Arctic. Atmos. Meas. Tech. 11, 1403–1416. doi: 10.5194/amt-11-1403-2018
Tietäväinen, H., Tuomenvirta, H., and Venäläinen, A. (2010). Annual and seasonal mean temperatures in Finland during the last 160 years based on gridded temperature data. Int. J. Climatol. 30, 2247–2256. doi: 10.1002/joc.2046
Veriankaite, L., Siljamo, P., Sofiev, M., Sauliene, I., and Kukkonen, J. (2010). Modelling analysis of source regions of long-range transported birch pollen that influences allergenic seasons in Lithuania. Aerobiologia 26, 47–62. doi: 10.1007/s10453-009-9142-6
Wang, Q., Jacob, D. J., Fisher, J. A., Mao, J., Leibensperger, E. M., Carouge, C. C., et al. (2011). Sources of carbonaceous aerosols and deposited black carbon in the Arctic in winter-spring: implications for radiative forcing. Atmos. Chem. Phys. 11, 12453–12473. doi: 10.5194/acp-11-12453-2011
Warren, S. G., and Wiscombe, W. J. (1980). A model for the spectral albedo of snow. II: snow containing atmospheric aerosols. J. Atmos. Sci. 37, 2734–2745. doi: 10.1175/1520-0469(1980)037<2734:AMFTSA>2.0.CO;2
Xu, B., Cao, J., Hansen, J., Yao, T., Joswia, D. R., Wang, N., et al. (2009). Black soot and the survival of Tibetan glaciers. Proc. Natl. Acad. Sci. U. S. A. 106, 22114–22118. doi: 10.1073/pnas.0910444106
Keywords: Arctic, BC, deposition, long-range transport, origin, seasonal, snow melt, thermal-optical OCEC analysis
Citation: Meinander O, Kontu A, Kouznetsov R and Sofiev M (2020) Snow Samples Combined With Long-Range Transport Modeling to Reveal the Origin and Temporal Variability of Black Carbon in Seasonal Snow in Sodankylä (67°N). Front. Earth Sci. 8:153. doi: 10.3389/feart.2020.00153
Received: 17 January 2020; Accepted: 22 April 2020;
Published: 12 June 2020.
Edited by:
Jing Ming, Independent Researcher, Melbourne, AustraliaReviewed by:
Maria Shahgedanova, University of Reading, United KingdomXiaobin Xu, Chinese Academy of Meteorological Sciences, China
Mark Flanner, University of Michigan, United States
Copyright © 2020 Meinander, Kontu, Kouznetsov and Sofiev. This is an open-access article distributed under the terms of the Creative Commons Attribution License (CC BY). The use, distribution or reproduction in other forums is permitted, provided the original author(s) and the copyright owner(s) are credited and that the original publication in this journal is cited, in accordance with accepted academic practice. No use, distribution or reproduction is permitted which does not comply with these terms.
*Correspondence: Outi Meinander, b3V0aS5tZWluYW5kZXJAZm1pLmZp