 Andreas Klügel1*Simon Day2Markus Schmid3Bruno Faria4
- 1Fachbereich Geowissenschaften, Universität Bremen, Bremen, Germany
- 2Institute for Risk and Disaster Reduction, University College London, London, United Kingdom
- 3Department für Geo- und Umweltwissenschaften, Ludwig-Maximilians-Universität München, Munich, Germany
- 4Instituto Nacional de Meteorología e Geofísica, Mindelo, Cape Verde
Phenocrysts in volcanic rocks are recorders of magmatic processes that have occurred at depth before and during a volcanic eruption. Our petrological investigations of stratigraphically controlled tephrite and phonotephrite samples from the latest eruption of Fogo (Cape Verde Islands) aimed to reconstructing magma storage and transport. The dates of sample emplacement have been determined using satellite instrument – derived high resolution thermal infrared maps. All samples are strongly phyric and commonly contain complexly zoned clinopyroxene crystals and cumulate fragments. Clinopyroxenes from all samples exhibit 10–50 μm wide rim zones, inferred to have grown in a few days to weeks during the ongoing eruption as a consequence of H2O loss from the melt. Clinopyroxene-melt thermobarometry using tephrite groundmass compositions suggests that the rims formed at upper mantle pressures of around 600 MPa (21 km depth). This level is interpreted to reflect temporary reduction in magma ascent velocity by near-isobaric movement through a complex storage system. Previously, the tephrite magma had accumulated at a deeper level, possibly between 700 and 900 MPa as indicated by clinopyroxene cores (Mata et al., 2017). The cause for H2O loss initiating rim growth could be degassing after rise of the magma from the deeper level, or CO2 flushing by a carbonic fluid phase released at depth. Corresponding data from phonotephrites indicate last equilibration at around 440 MPa (16 km); the phonotephrite magma is inferred to be a residuum from an earlier magmatic event that was entrained by advancing tephrite. Microthermometry of CO2-dominated fluid inclusions in tephrite clinopyroxenes results in pressures of around 330 MPa (12 km), indicating another short pause in magma ascent in the lowermost crust. Rim zonations of olivine phenocrysts indicate that after leaving this final stalling zone, the magma ascended to the surface in less than half a day. In strong contrast to these petrological equilibration depths, seismic events precursory to the eruption were located at < 5 km below sea level, with only two exceptions at 17 and 21 km depth consistent with our barometry. Our results enhance the understanding of this potentially dangerous volcano, which helps to interpret future pre-eruptive unrest.
Introduction
The eruptive behavior of a volcano is intrinsically related to the composition of its magmas and therefore to a variety of magmatic processes modifying them at depth. Whereas some processes produce detectable surface manifestations such as seismicity, deformation and degassing, others cannot be observed directly but can be reconstructed from their record in magmatic crystals and xenoliths. Information retrieved from minerals and their inclusions include depths and temperatures of magma storage, nature and rates of magmatic processes, degassing behavior, and rates of magma ascent (reviewed in Putirka and Tepley, 2008). During the last decades, our understanding of volcanoes and the underlying processes has improved through many detailed investigations of volcanic rock samples and application of modern microanalytical techniques (e.g., Davidson et al., 2007; Costa and Morgan, 2011; Cashman et al., 2017; Ubide et al., 2019). One major aim of petrological investigations is to reconstruct the depths of pre- and syn-eruptive igneous processes. A number of suitable and well-tested geobarometers exist, but obtaining accurate and precise data requires some analytical effort and careful consideration of equilibrium tests (Putirka, 2008, Putirka, 2016a; Mollo et al., 2013; Neave and Putirka, 2017; Neave et al., 2019; Ubide et al., 2019). For mineral-melt barometers, which are more precise than mineral-only barometers (Putirka, 2008), it is not always possible to obtain appropriate melt analyses if the matrix is not glassy. This problem can be circumvented by using whole-rock data for approximation (e.g., Mata et al., 2017) or phenocryst-corrected whole-rock data (Hildner et al., 2011), or by selecting a putative equilibrium melt composition from a data base (Barker et al., 2015; Neave and Putirka, 2017).
The petrological investigations only enable post hoc reconstructions of the magmatic processes that have affected any one sample before and during its eruption. It is therefore particularly rewarding if these reconstructions can be integrated with independent surveillance data (e.g., Kahl et al., 2011, 2013; Longpré et al., 2014). This requires that the timing of emplacement of the chosen samples, within the eruption, can be constrained by that surveillance data.
This study investigates a suite of chronologically-controlled samples from the 2014 to 2015 eruption of Fogo in the Cape Verde Islands. The samples were chosen on the basis of eyewitness accounts of the eruption, satellite monitoring data, and field observations of within-eruption stratigraphy that were made during sampling. They provide a sequence that covers most of the eruption and provide a base for detailed petrological investigation of its products. The focus of the study is on mineral-melt thermobarometry, fluid inclusion barometry, and investigation of mineral rim zonations. The aim of our study is to better understand the magma supply system to this eruption. As we show, the availability of a chronologically-controlled sample set can be very useful for the interpretation of petrological data.
Geological Setting
The Cape Verde Islands, located in the Northern Atlantic ∼500–800 km west of the African coast between 15° and 17° N, consist of nine inhabited islands and several islets, all of volcanic origin (Figure 1A) and with a broadly decreasing age progression from east to west (Holm et al., 2008). They are on the Cape Verde Rise, the largest geoid and bathymetric seafloor anomaly on earth and the surface expression of the Cape Verde hotspot (Crough, 1978, 1982). Magmatism is dominated by silica-undersaturated alkaline melts of basanitic through phonolitic composition; carbonatites also occur.
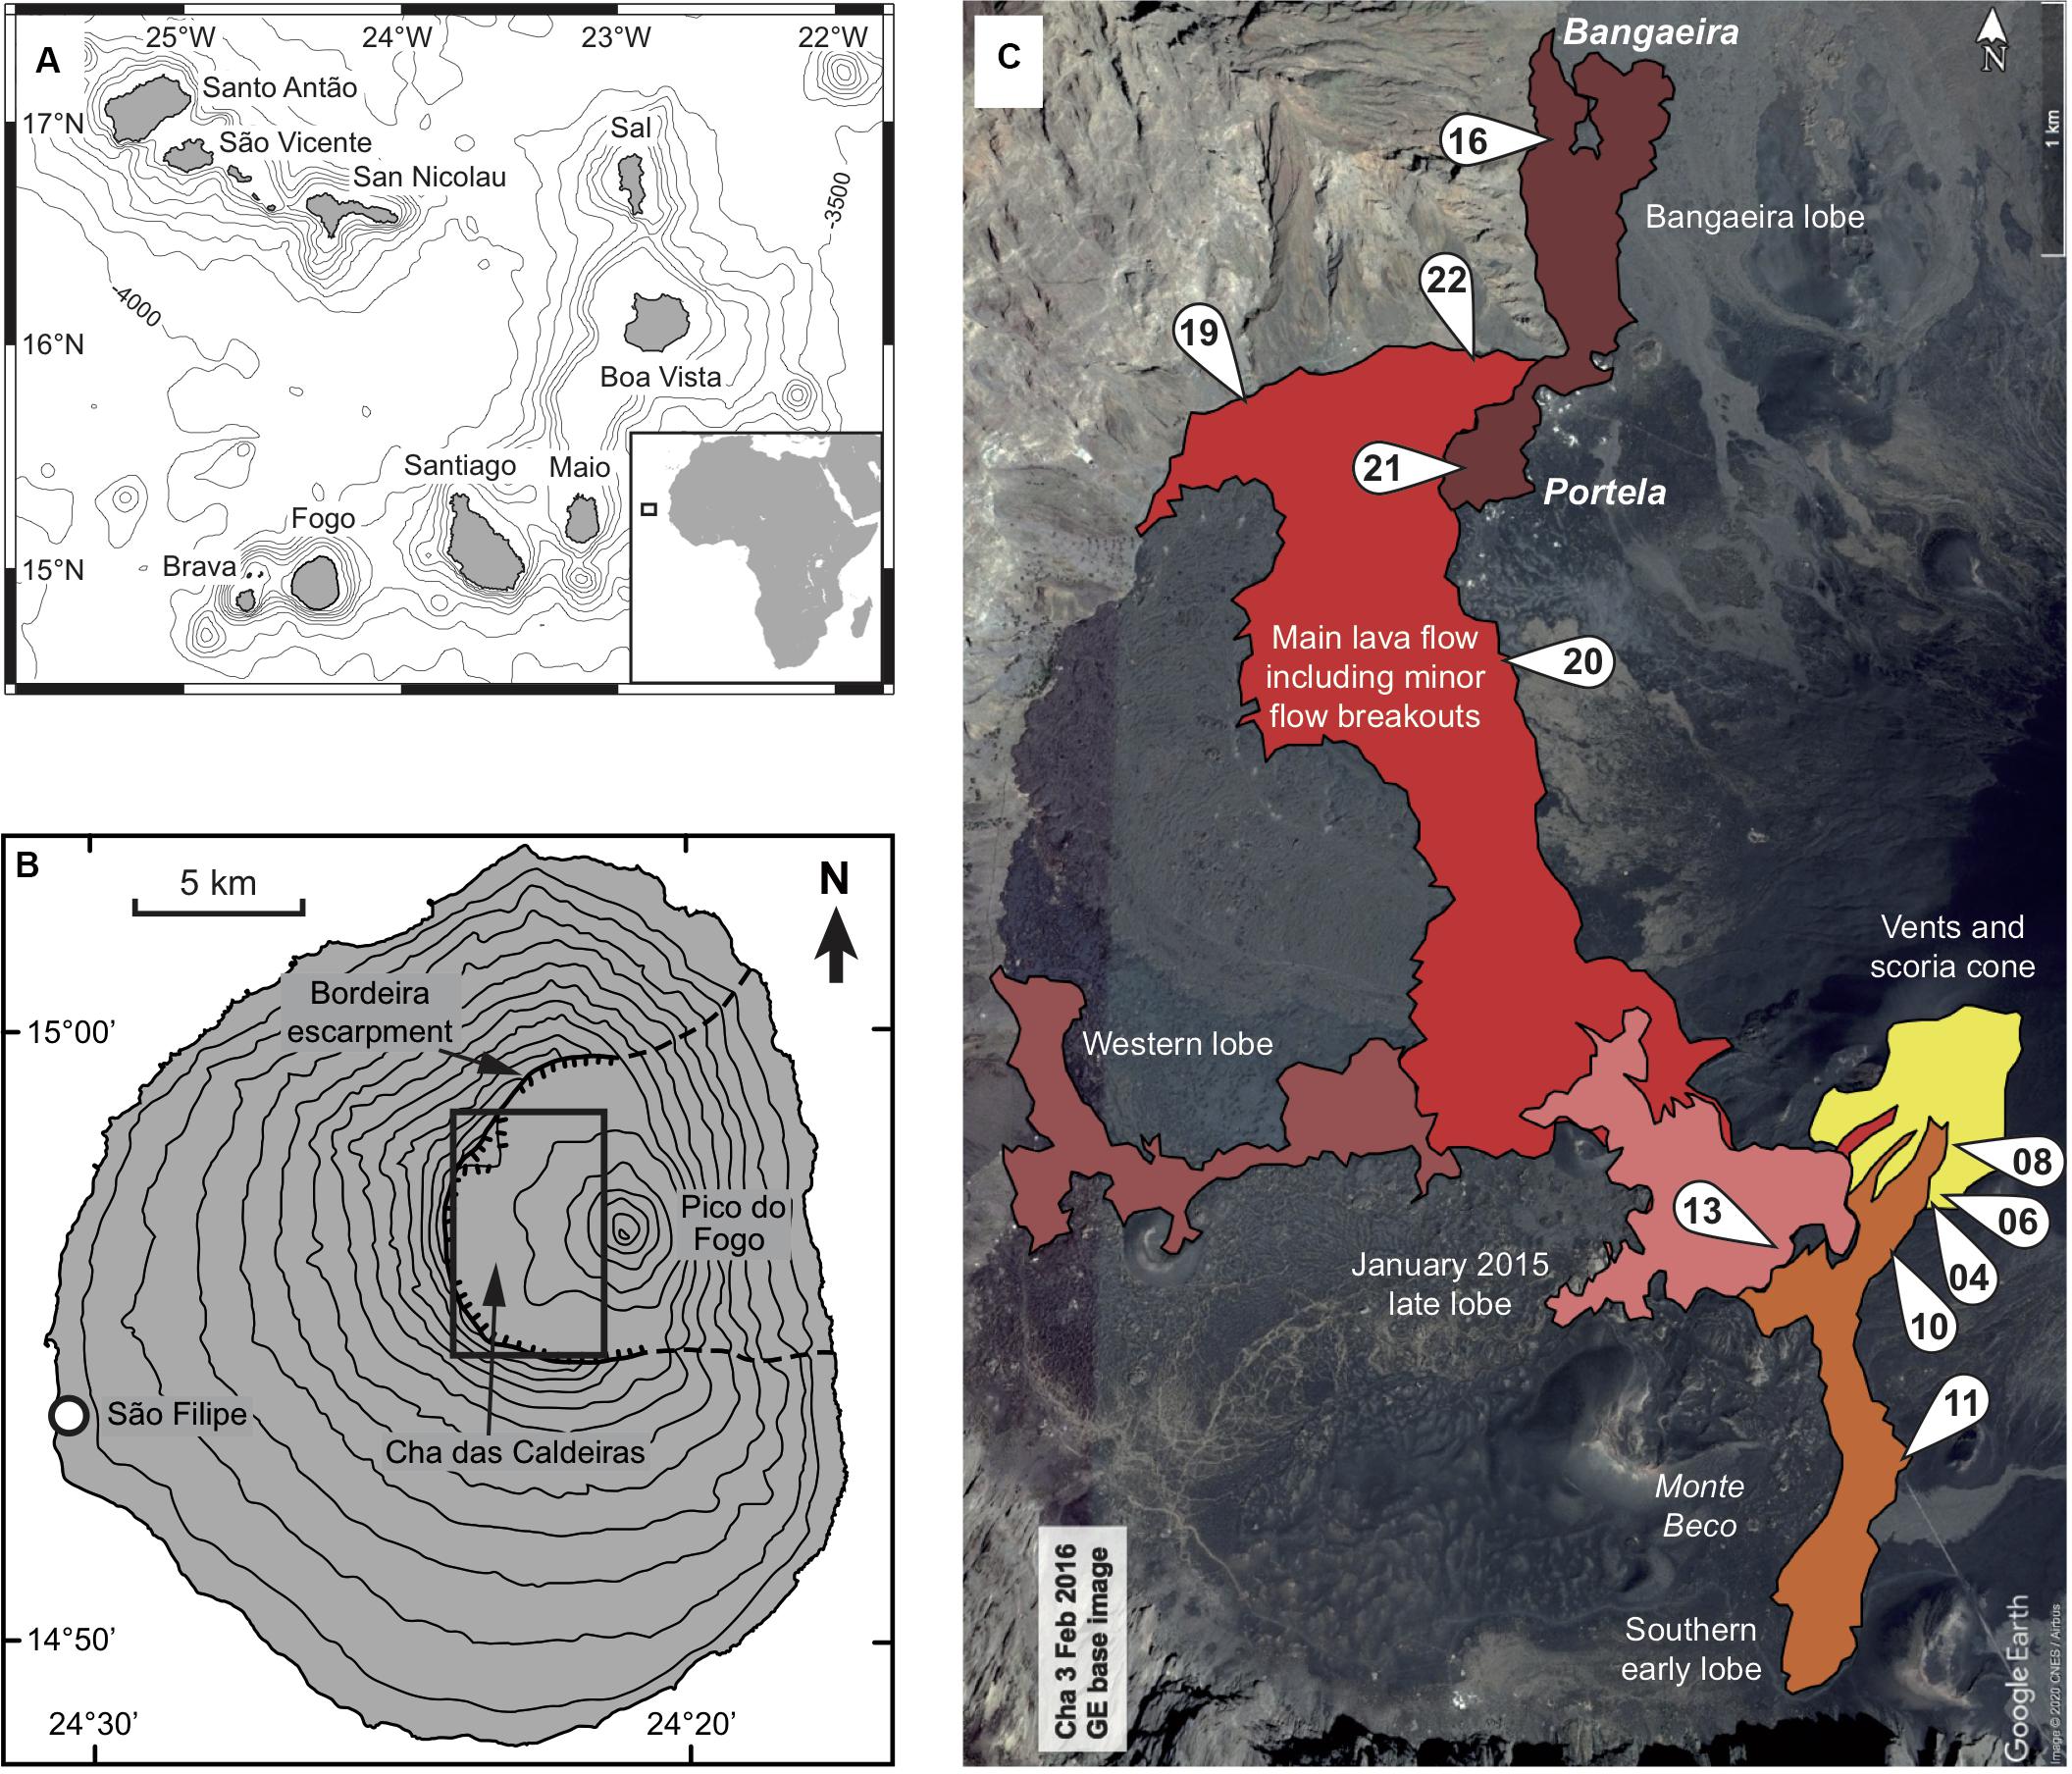
Figure 1. (A) Map of the Cape Verde Islands with 500 m isobaths, and (B) overview map of Fogo with 200 m contours. (C) Detail map of the area outlined in (B) showing the extent of the lava flows emplaced during the 2014–2015 eruption. Numbers indicate the sample localities (e.g., 04 refers to sample SD04). Base map by Google, using data from CNES/Airbus.
Geological Overview of Fogo
Fogo is at present the most active volcano of the Cape Verde Islands with 28 eruptions since 1500 AD (Ribeiro, 1954; Torres et al., 1997) and a number of large explosive eruptions in prehistoric times (Eisele et al., 2015). The island has a diameter of ∼25 km and features an up-to 1 km high horseshoe-shaped depression open to the east, interpreted as the product of one (Day et al., 1999; Masson et al., 2008) or more (Marques et al., 2019) flank collapses, or a combination of vertical caldera collapses and flank collapse (Torres et al., 1997; Madeira et al., 2008; Martínez-Moreno et al., 2018; Figure 1B). The geological evolution of Fogo can be subdivided into four distinct phases according to Day et al. (1999) and Foeken et al. (2009): (1) The uplifted seamount series (∼4.5 Ma) is composed of carbonatites and alkalic basalts. (2) The Monte Barro Group includes the first subaerial lavas that unconformably overlie the seamount series. So far there are no absolute age determinations for this group. (3) The Monte Amarelo Group unconformably overlies the Monte Barro Group and formed after a period of cliff incision. Its deposits reach a total thickness of 2–3 km and consist mainly of highly alkalic, basic to intermediate lavas and scoria cones, probably entirely of Quaternary age. This volcanic phase ended with the giant lateral Monte Amarelo flank collapse(s), the age estimates of which range between 43 and 123 ka (Foeken et al., 2009; Ramalho et al., 2015; Madeira et al., 2019; Marques et al., 2019). (4) The post-collapse Cha das Caldeiras Group is primarily represented by an up to 2 km thick sequence (Day et al., 1999) infilling the collapse scar (Cha das Caldeiras plain and the 2829 m high Pico do Fogo), and by lava sequences on the outer flanks of the island that are mainly of basanitic to tephritic composition.
Petrological studies of Fogo provided detailed data for the magma plumbing systems of the 1951, 1995, and 2014–2015 eruptions (Munhá et al., 1997; Hildner et al., 2011, 2012; Mata et al., 2017), thermobarometric data for earlier eruptions (Hildner et al., 2012), and analyses of some melt inclusions (Moussallam et al., 2019). These studies showed that the erupted magmas were stored before eruption within the uppermost mantle between 15 and 30 km depth, and stalled during ascent within the lower crust at 8–13 km depth. There is no evidence for a shallow crustal magma reservoir to have existed during the eruptions studied. It is not uncommon that an eruption of mostly tephritic to basanitic magma was accompanied by small volumes of more differentiated (phonotephritic) magma. So far, no study has addressed possible variations in magma storage depth and plumbing dynamics during the course of a single eruption, because the temporal succession of samples was not known. Seismic monitoring data exist for only the two most recent eruptions, those of 1995 (Heleno da Silva et al., 1999) and 2014–15 (INMG network operated by one of us (BF) and discussed in Faria and Fonseca (2014).
Summary of the 2014–2015 Eruption
The following account is based partly on data from González et al. (2015), Worsley (2015), Cappello et al. (2016), Richter et al. (2016), Jenkins et al. (2017), and Mata et al. (2017), and on seismic data from the INMG network. Remarkably, the 2014–2015 eruption was not preceded by significant island-wide surface deformation (González et al., 2015). Seismic activity precursory to the eruption began on 4 October 2014 with a single magnitude (M) 2.5 seismic event around 17 km depth below sea level (b.s.l.), after which the rate of very weak background seismicity increased. The main seismic precursor of the eruption was a swarm beneath Pico do Fogo from 17 to 23 November, which involved almost 300 small events (M < 2.5) mostly at < 4 km b.s.l., except for one event on 21 November at 21 km b.s.l. Local surface deformation near Pico was recorded during 7 h prior to the start of the eruption. A fissure array opened on the morning of 23 November on the southwest flank of Pico, just near the site of the 1995 eruption (Figures 1B,C), and produced vigorous eruptive activity.
During the first days, hawaiian and strombolian activity prevailed whilst effusion of lava focused on one major vent at the southwest end of the initial fissure. Lava flows were produced from the beginning of the eruption, in two major lobes to the northwest and to the south (Figure 1C). The southern lobe ceased to grow on 24 November as the effusive activity focused on the southwest end of the vent array, whilst the northwest lobe continued to grow into December. A’a lava dominated, with occasional breakouts of more fluid pa’hoe’hoe and a’a lava expanding the lava fields, especially to the north where new lobes destroyed large parts of the villages of Portela and Bangaeira. In mid-December activity temporarily decreased, but soon increased again and produced a new lava lobe to the west. In early January 2015, lava emission rates decreased and strombolian activity intensified, whilst in mid to late January vents at the southwest end of the vent array produced a new lava lobe that expanded to the southwest. In February explosive activity was at a low level, but intensified on 7 February for a short period, until cessation of volcanic tremor at 20h00 UTC marked the sudden end of the eruption.
Materials and Methods
Sampling
The samples were collected in March 2015 during the dry season. The aim was to collect a set of samples covering the whole period of the eruption, from lava outcrops and pyroclastic units whose dates of emplacement were known or could at least be bracketed. The principal method for determining the age of emplacement of lavas was to sample at sites that were last incandescent on known dates, on the basis of infrared emission maps produced by B. Hirn and F. Ferrucci, using short-wave infrared and near-infrared bands monitored at 30 m pixel resolution by the Landsat 8 Operational Land Imager (OLI) and Earth Observing-1 Advanced Land Imager (ALI) instruments. The date of last incandescence for a lava surface would be later than the date of eruption of a sample collected from that surface, because of the finite travel time of the lava from its eruption site to its emplacement site. The dates were cross-checked with eyewitness reports, and with field observations that allowed determination of stratigraphic relationships of our samples to units of known age. Tephras and fragments of juvenile spatter were also collected near the eruptive vents and from an observation point on Monte Beco, where recognizable stratigraphies were present.
A key limitation of this approach was that cloud cover disrupted the time series of incandescence data, particularly between 24 November and 6 December 2014 when the northwestern flow lobe forming the main lava field south of Portela village was largely emplaced. Our sampling of this main phase was thus limited. In contrast, the southern lava flow early in the eruption and the later breakout lava flows were emplaced in periods of clear weather, and so the OLI and ALI data were extremely useful in sampling these parts of the lava field. However, the end of acquisition of high-resolution OLI and ALI data on 1 January 2015 meant that the sampling of near-vent lavas and pyroclastic deposits formed in early 2015 had to be based upon detailed field observations and the few eyewitness observations from that period. Finally, examination of ∼0.5 m pixel post-eruption panchromatic imagery from Pleiades and WorldView satellites in conjunction with those field observations also allowed the determination of age relationships between different lava flow lobes, and thus cross-checking the relative ages of samples.
A total of 23 samples of 2014–15 lavas and pyroclasts were collected, of which 11 were selected for this study. Sample locations and age constraints for these samples are provided in Table 1, and the locations are shown in Figure 1C. Petrographic investigations of the samples were carried out on a petrological microscope. Mineral contents were determined by point counting or visual estimate, and are given on a vesicle-free basis.
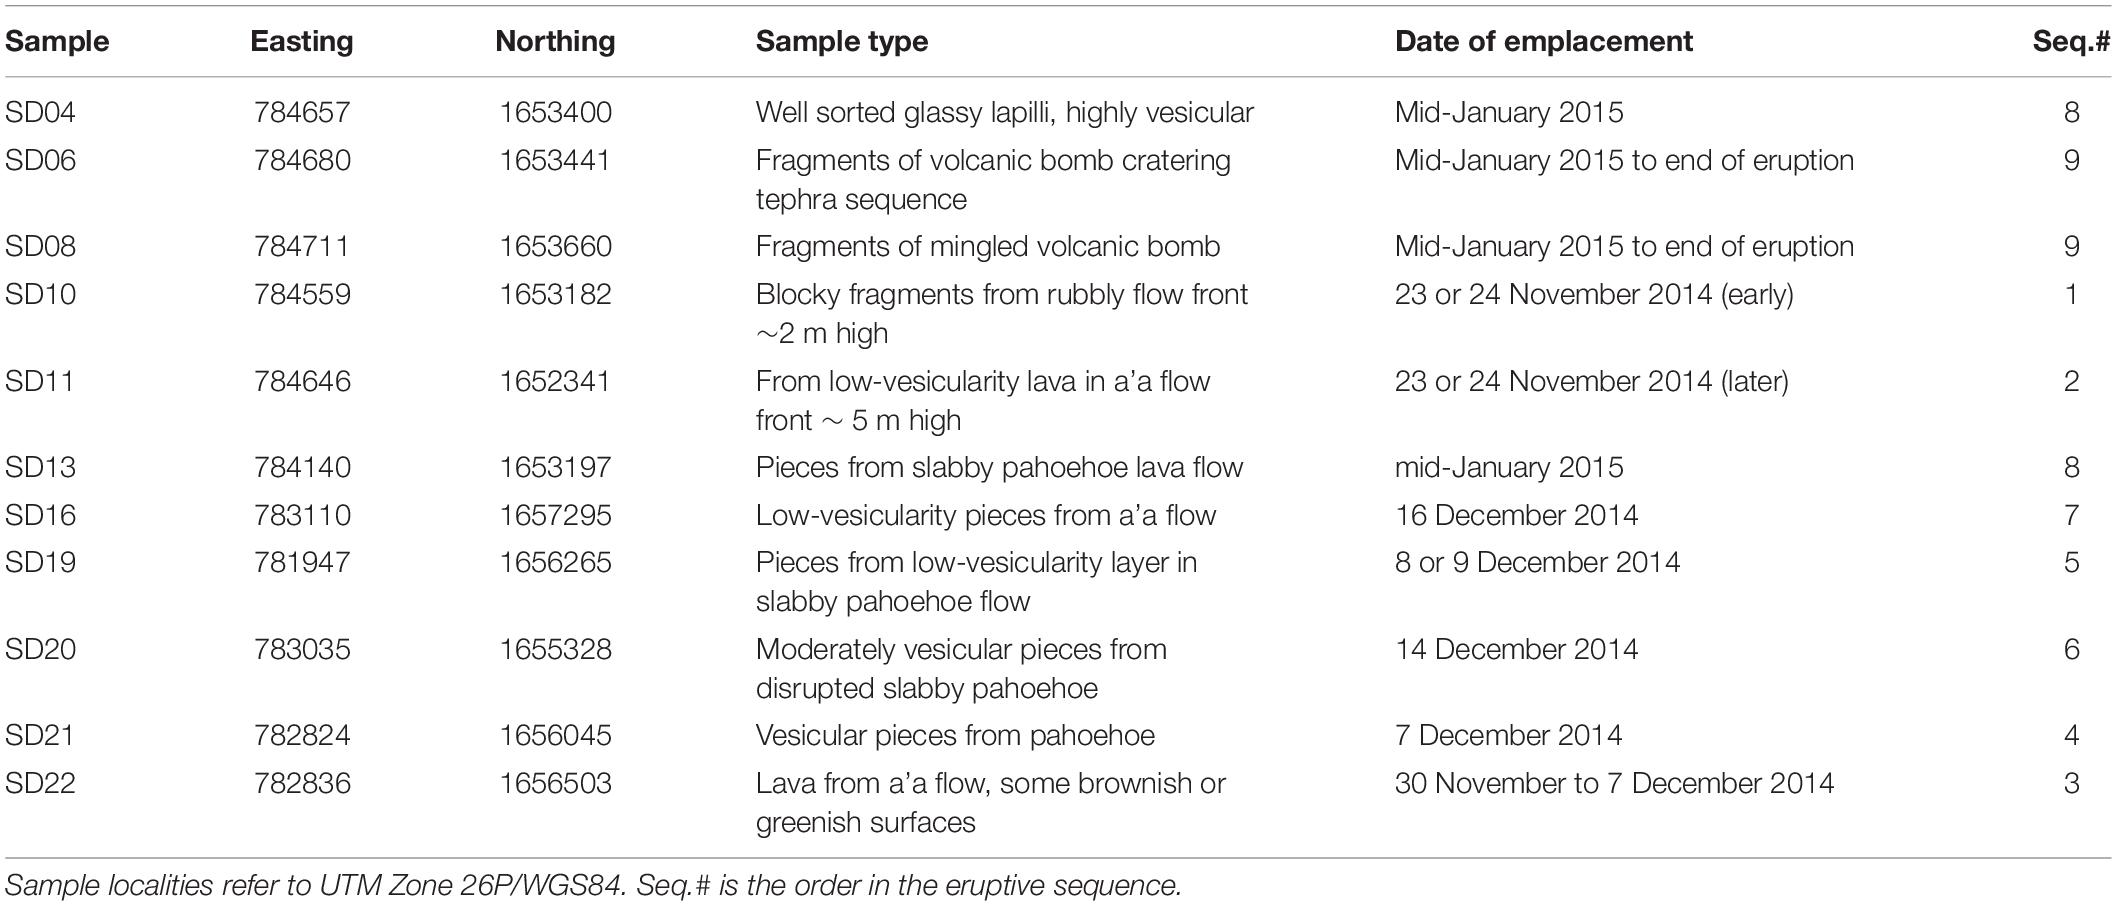
Table 1. List of investigated samples, their localities and their order in eruptive sequence.
Electron Microprobe Analyses
Electron microprobe (EMP) analyses of phenocrysts were carried out on a Cameca SX-100 at the Faculty of Geosciences, Bremen University. Quantitative analyses used a focussed beam with an acceleration voltage/beam current of 15 kV/15 nA for clinopyroxene, 15 kV/20 nA for Fe-Ti oxides, and 20 kV/30 nA for olivine; peak counting times were 20 or 30 s. Calibrations used reference standards from the Smithsonian Institution (Jarosewich et al., 1980, 1987), and the built-in PAP correction was applied for data reduction. Analytical precision and accuracy were controlled by regular analyses of reference standards from the Smithsonian Institution along with the samples (Supplementary Table S1). In addition, qualitative measurements of element intensities along traverses were carried out with a focussed beam of 50 nA and a dwell time of 200 ms per point.
Laser-Ablation Inductively Coupled Plasma Mass Spectrometry (LA-ICP-MS)
The major element composition of microcrystalline to glassy groundmass was determined on thin sections by LA-ICP-MS, using a NewWave UP193 solid-state laser coupled to a ThermoFinnigan Element2 at the Faculty of Geosciences, Bremen University. Helium (∼0.8 l/min) was used as sample gas and argon (∼0.8 l/min) was subsequently added as make-up gas; plasma power was 1200 W. For each sample six to ten line scans (0.6 mm length, 5 μm/s scan speed, 100 μm spot size, 5 Hz laser pulse rate, irradiance of ∼1 GW/cm2) were carried out. Positions of these scans were selected to cover representative areas of the groundmass. The isotopes 23Na, 24Mg, 27Al, 28Si, 31P, 39K, 44Ca, 48Ti, 55Mn, and 56Fe were analyzed at high resolution with a 150% mass window and a total dwell time of 0.15 s per isotope. Blanks were measured during 25 s prior to ablation. The basalt glass standard BCR2G was analyzed as external calibration standard using the values of Jochum et al. (2005). For data quantification the Cetac GeoProTM software was used with Ca as internal standard, and all concentrations were subsequently normalized to a volatile-free sum of 100 wt% oxides. Analytical precision and accuracy were monitored by regular analyses of basalt glasses BHVO2G and BIR and are mostly better than 3% for concentration > 1 wt%, which is comparable to EMP analyses (Supplementary Table S2).
Microthermometry
Fluid inclusions used for barometry were examined in 100 μm thick doubly polished sections. Microthermometric measurements were carried out on small chips using a Linkam THMSG 600 heating-cooling stage at the Faculty of Geosciences, Bremen University. The stage was calibrated with SYNFLINCTM synthetic CO2 and H2O fluid inclusion standards at −56.6, 0.0, and 374.1°C. Accuracy of CO2 triple-point measurements, and reproducibility of melting and homogenization temperatures, were within ± 0.2°C. Densities of CO2-dominated inclusions were calculated from measured homogenization temperatures using the auxiliary equations 3.14 and 3.15 of Span and Wagner (1996), and isochores were computed with the Sterner and Pitzer (1994) equation of state for the CO2-H2O system; see also Hansteen and Klügel (2008).
Results
Petrography and Rock Compositions
The 2014–2015 eruption produced lavas and tephra of dominantly tephritic and subordinate phonotephritic composition (cf. Mata et al., 2017). The vesicularity of the tephrites is highly variable and ranges up to 90 vol% for some pyroclastic lapilli. The investigated samples are strongly porphyritic with euhedral to subhedral phenocrysts of clinopyroxene (8–18 vol%, up to 5 mm in size), olivine (0–2 vol%), titanomagnetite (1–3 vol%), and few plagioclase microphenocrysts. Some early erupted tephrites also contain apatite microphenocrysts, and/or rare amphibole that is either rounded or partly to completely opacitized (cf. Mata et al., 2017). Clinopyroxene commonly contains titanomagnetite and melt inclusions, and rarely sulfide blebs along the rims. The crystals are variably zoned including simple core-rim, multiple concentric, patchy, and/or sector zonations (Figures 2A–D), indicating complex growth histories. Most clinopyroxene phenocrysts exhibit a rim zone that is typically 10–50 μm wide and sharply bounded against the core region. Cumulus microxenoliths of clinopyroxene ± titanomagnetite ± olivine are common, and some phenocrysts appear to resemble aggregates from crystal mush zones (Figures 2C,D). The microcrystalline groundmass consists of plagioclase + titanomagnetite + clinopyroxene ± olivine ± glass.
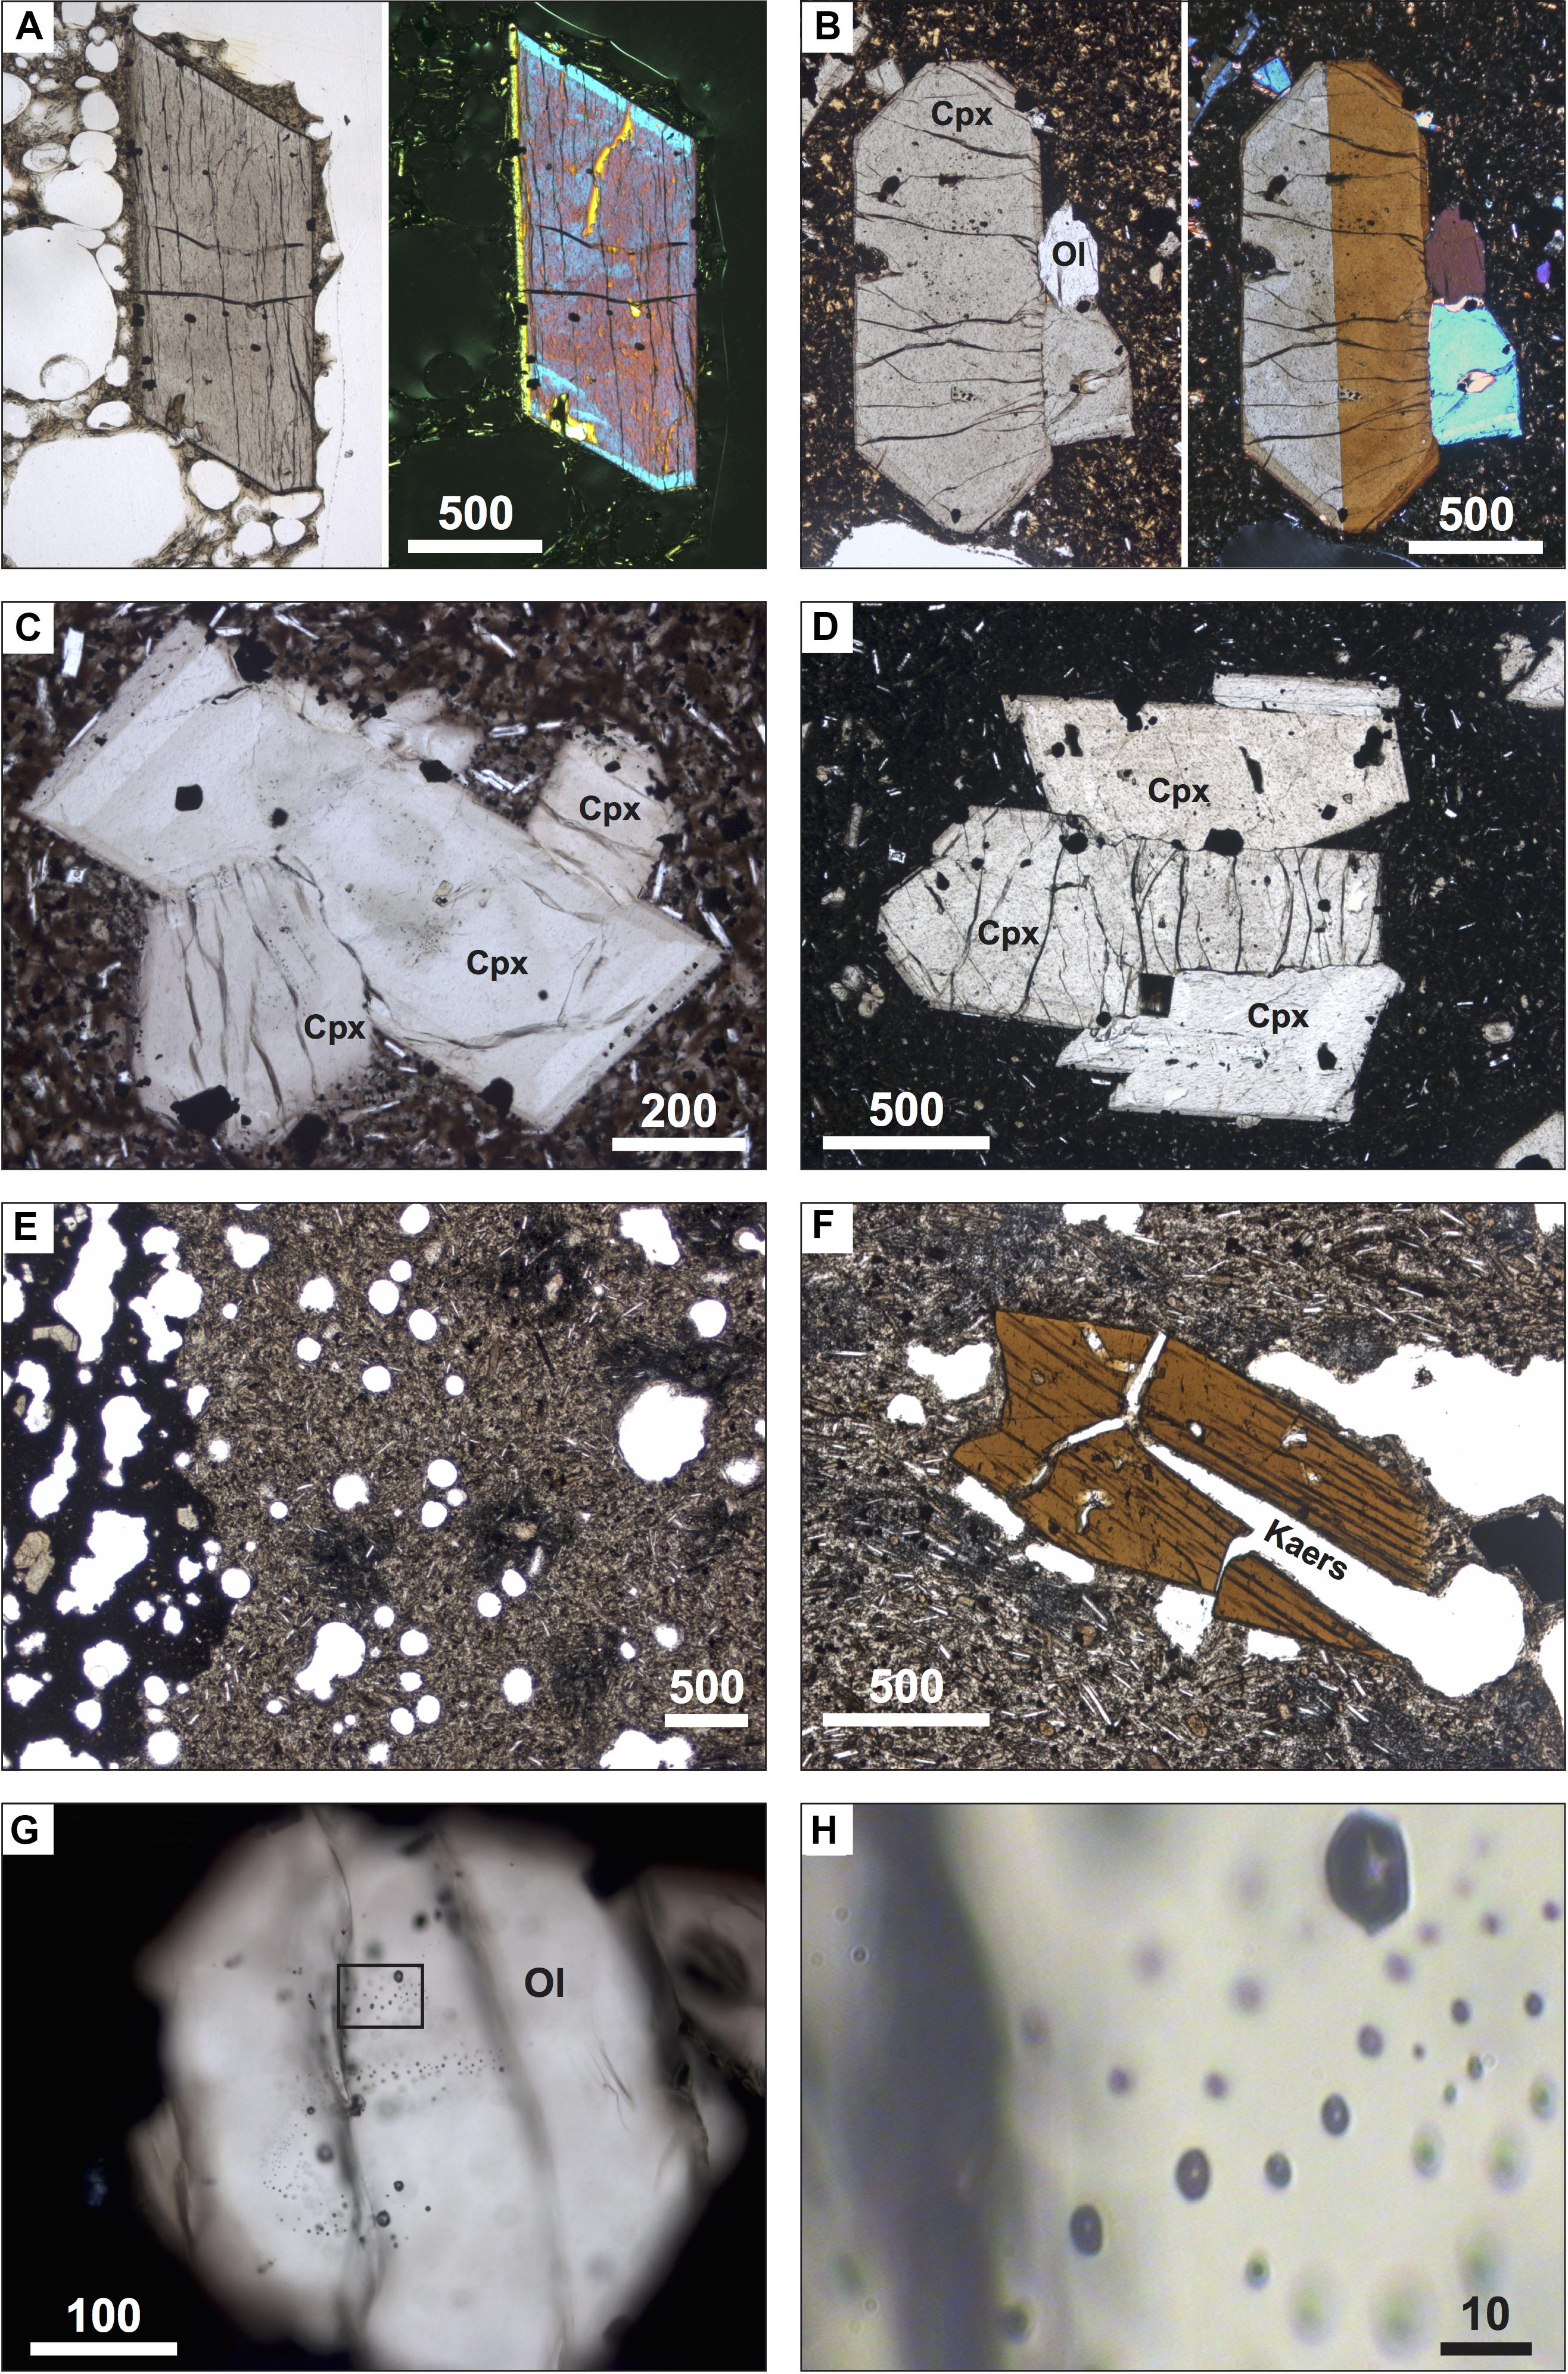
Figure 2. Microphotographs from selected samples taken at plane polarized light [right parts of panels (A,B)] with crossed polarizers). Scale bars are in micrometers. (A) Euhedral clinopyroxene phenocryst with patchy core zonation and distinct rim zone (sample SD04 Cpx6). (B) Crystal aggregate with euhedral clinopyroxene and olivine (sample SD19 Cpx9). (C) Crystal aggregate of intergrown euhedral clinopyroxenes with complex zonations, interpreted as fragment from crystal mush (sample SD16 Cpx15). (D) Clinopyroxene aggregate interpreted as fragment from crystal mush (sample SD16). (E) Vesicular phonotephrite with basanite rind (left) and dark patches of “K-rich foidite” (sample SD08). (F) Kaersutite phenocryst with thin opacite rim in phonotephrite (sample SD08). (G) Trails of secondary CO2-dominated fluid inclusions in clinopyroxene (sample SD13). (H) Detail of area outlined in panel (G).
Phonotephritic lava and pyroclasts were erupted at the beginning as well as near the end of the eruption. Their vesicles have ragged shapes due to shearing, suggesting a comparatively high viscosity of the melt. Phonotephrites are far less porphyritic than tephrites and contain phenocrysts of clinopyroxene, amphibole and titanomagnetite (up to 2 vol% each). In contrast to the samples investigated by Mata et al. (2017), amphiboles in our phonotephrites show little opacitization. One particular sample (SD08) is a phonotephrite bomb with a sharply bounded rim of tephrite, and abundant dark patches and streaks in the groundmass (Figure 2E).
Whole-rock compositions of 2014–2015 eruptive products are presented by Mata et al. (2017); they are similar to those from the 1995 eruption (Figure 3). However, because our samples are highly porphyritic and the rims form only a small fraction of the crystals, we consider that for the purposes of mineral-melt equilibrium studies our groundmass analyses provide a close approximation to pre-eruptive melt compositions at depth. Groundmass of tephrite samples has compositions more evolved than whole-rock, with 43.1–45.6 wt% SiO2, 4.6–5.2 wt% Na2O, 2.8–3.6 wt% K2O, 4.2–5.2 wt% MgO, 3.0–3.9 wt% TiO2, and a Mg# of 43.2–48.1 (Mg# = molar XMgO/(XMgO+XFeO,tot)∗100) (Table 2, details in Supplementary Table S3). The data indicate some variability in tephrite melt composition during the eruption, but no gradual or systematic changes. Sample SD04 is lower in SiO2 and alkalies, and higher in MgO, FeO, and TiO2, than all other samples. One tephrite from the late phase of the eruption (sample SD06) is transitional having a melt composition between tephrites and phonotephrites (Figure 3), possibly due to mixing of melts. Groundmass of phonotephrites is chemically similar to phonotephrite whole-rock from earlier eruptions. The dark patches and streaks in the groundmass of sample SD08 are chemically distinct. Their composition deviates from the liquid line of descent of Fogo magmas in being highly enriched in K2O (>10 wt%), and depleted in Na2O and Al2O3 (Table 2). The origin of these “potassic foidite” domains is unknown, but textures (Figure 2E) and composition suggest mingling of the phonotephrite with an exotic evolved melt or assimilation of a K-rich mineral phase. However, the analyzed compositions cannot be produced by simple binary mixing between known Fogo melts and any known mineral phase.
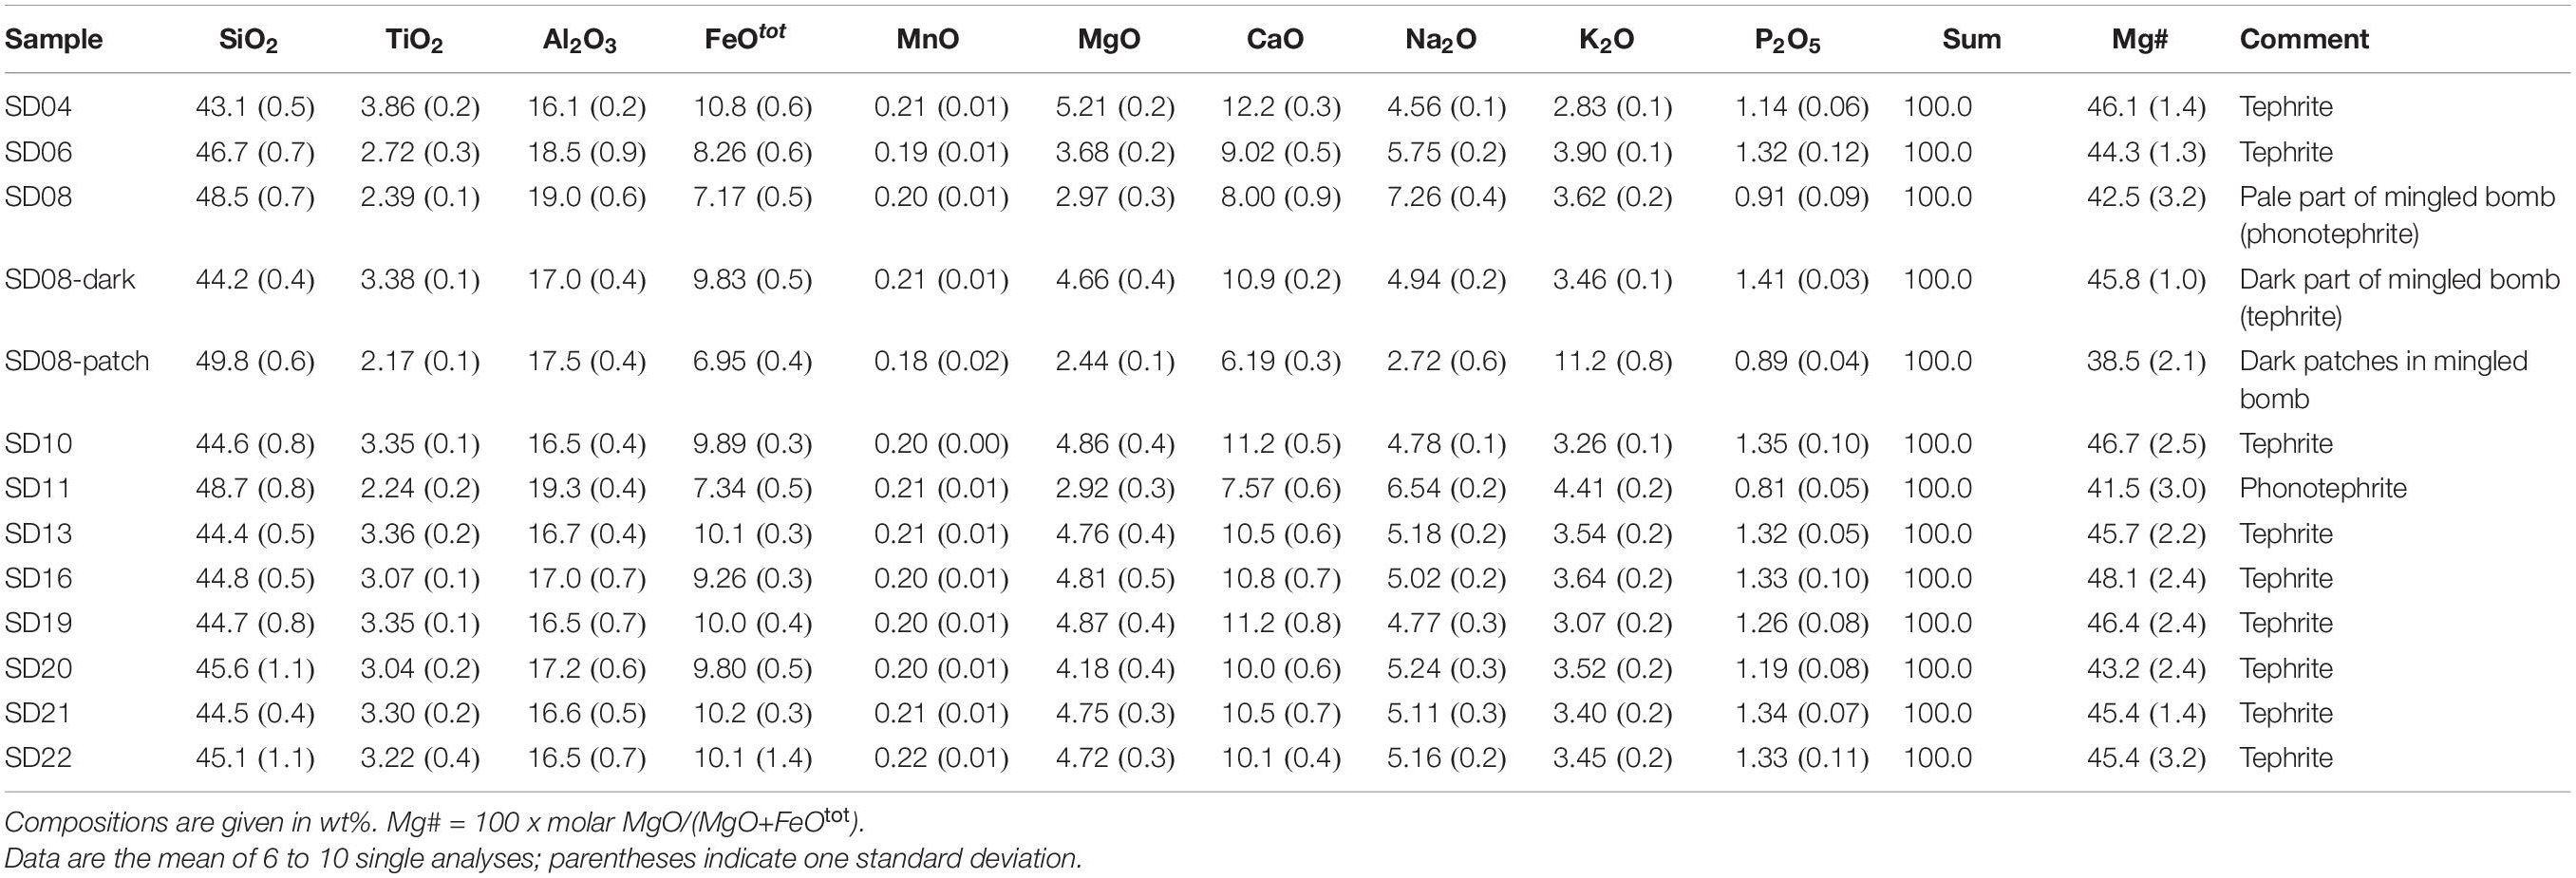
Table 2. Groundmass composition of the investigated samples as analyzed by LA-ICP-MS.
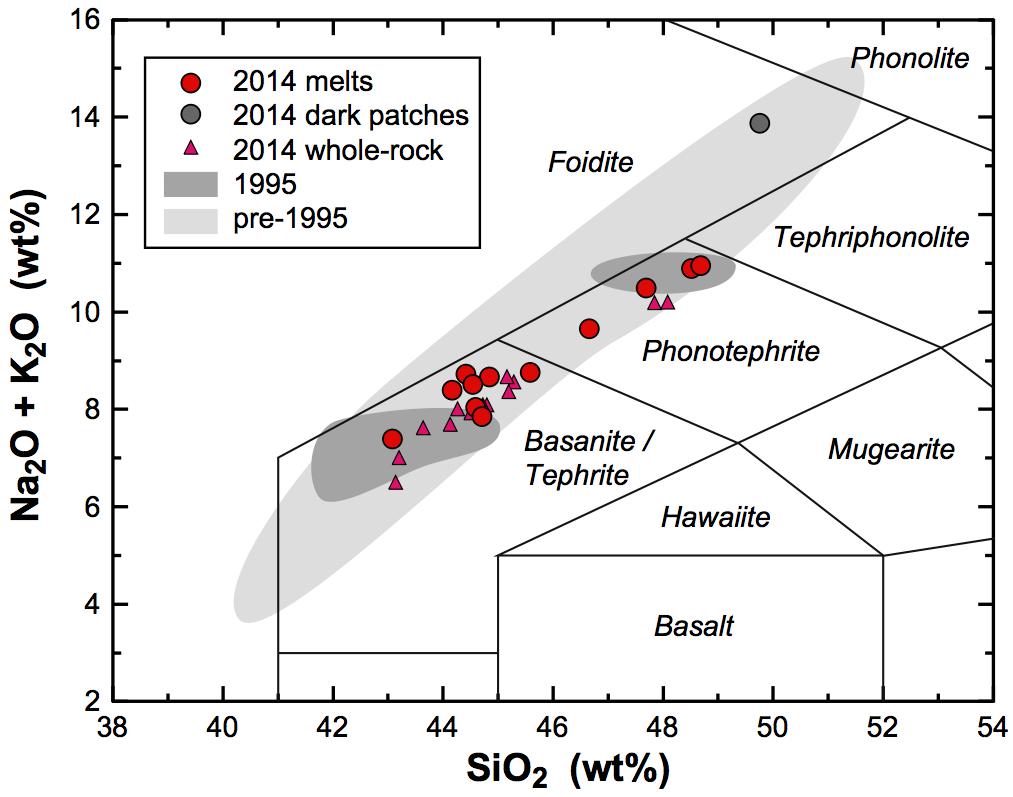
Figure 3. Total alkalis versus silica (TAS) diagram with boundaries after LeMaitre et al. (1989), showing the groundmass compositions of the investigated samples. Whole-rock compositions from the 2014–2015 eruption are from Mata et al. (2017). The fields for whole-rock compositions from previous eruptions are based on data from Munhá et al. (1997), Kokfelt (1998), Doucelance et al. (2003), Escrig et al. (2005), and Hildner et al. (2011, 2012). All data are normalized to 100 wt.% volatile-free.
Mineral Compositions
All mineral compositions are provided in Supplementary Tables S4–S7. Clinopyroxene phenocrysts in tephrites and phonotephrites are Ti-rich aluminian diopsides showing a wide compositional range (2.1–6.6 wt% TiO2, 3.7–13.0 wt% Al2O3, 0.3–1.1 wt% Na2O, up to 0.09 wt% Cr2O3). The Mg# ranges from 64 to 81 for tephrites and from 56 to 80 for phonotephrites. With decreasing Mg# or Mg content, Si decreases, and Na, Ti, and Al increase; Ca shows little variation (Figure 4A). Compositions of the outermost crystal rims overlap with those of the core regions but extend to lower Mg# and Si, and higher Ti, Al, and Na. Overall, the rims are compositionally more variable than the cores. Also, rim compositions of phonotephrite-hosted clinopyroxenes define a distinct trend that is distinguished from tephrite-hosted ones by higher Si, and lower Ti and Altotal, at given Mg# (Figure 4A). Core compositions, in contrast, are very similar for phonotephrite- and tephrite-hosted clinopyroxenes. Most core analyses are within the upper part of the Mg# and Cr2O3 range.
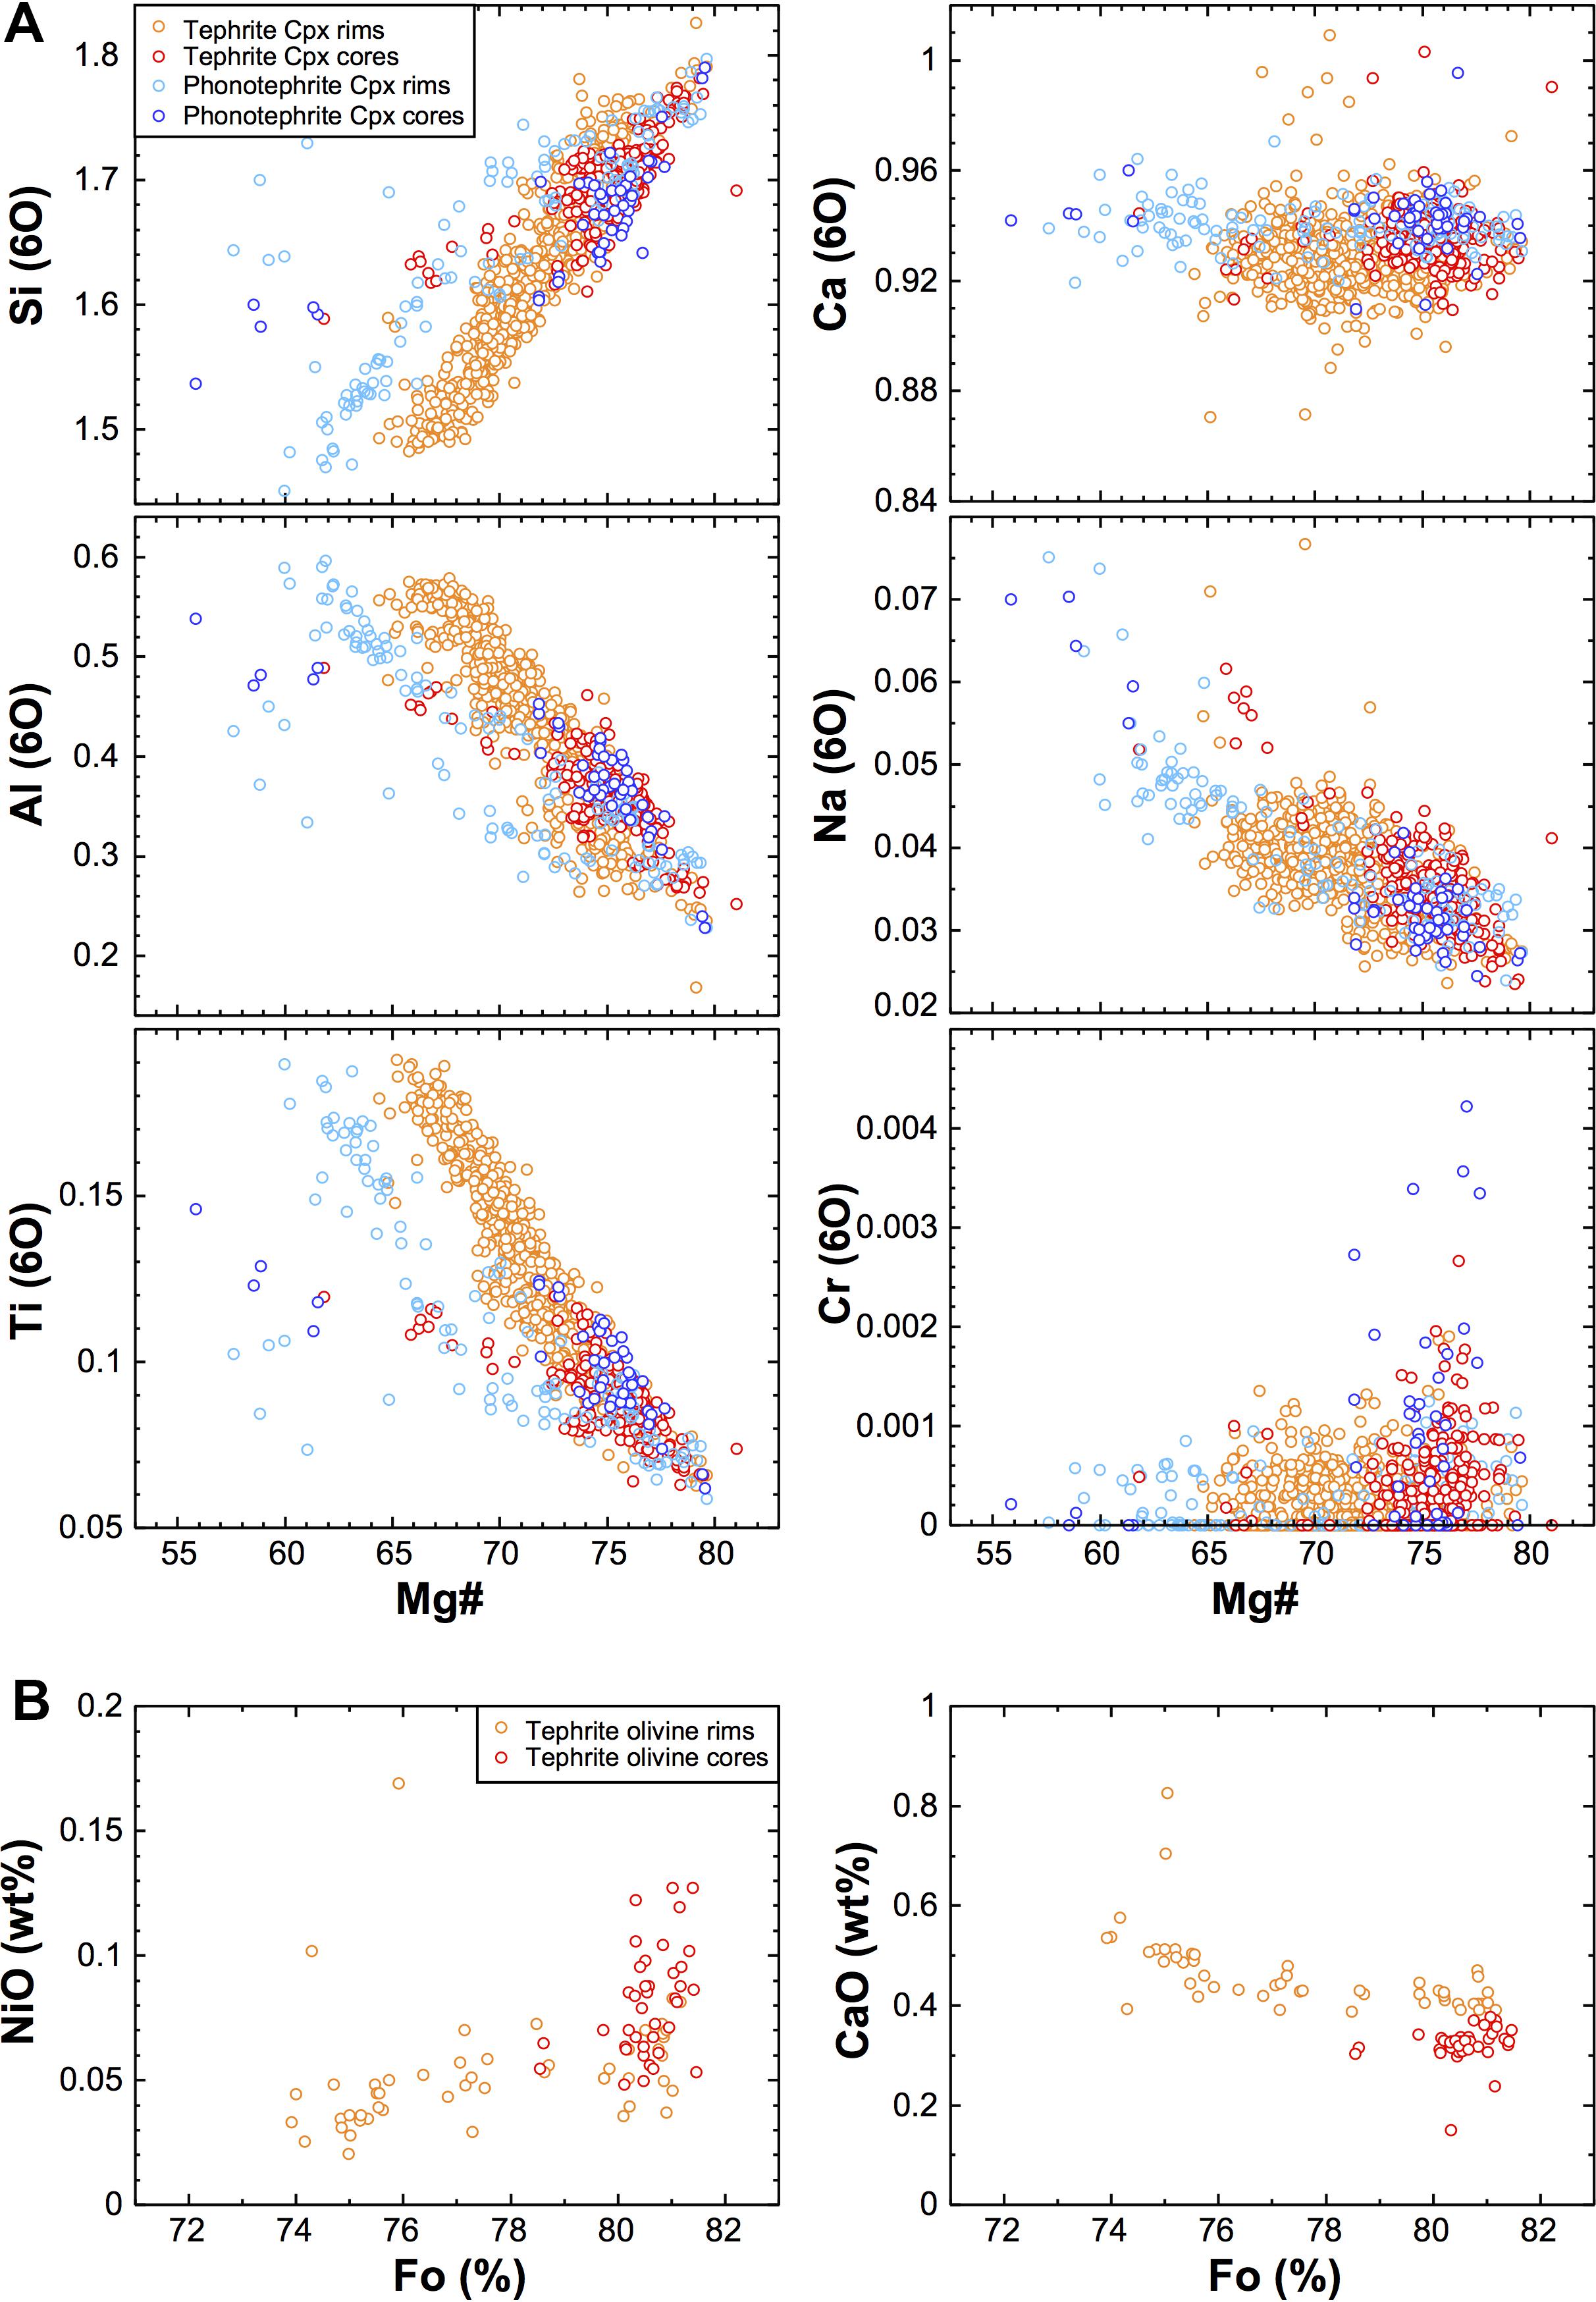
Figure 4. (A) Compositional variations of clinopyroxene phenocrysts in tephrites and phonotephrites, plotted as Mg# versus cation fractions normalized to six oxygens. Rim compositions were analyzed at 3–8 μm distance to planar crystal faces, all other analyses are denoted as cores. Note the different trends of phonotephrite- and tephrite-hosted clinopyroxene rims in the diagrams of Mg# versus Si, Ti and Al. (B) Compositional variations of olivine phenocrysts in tephrites. Note the small range of rim compositions (Fo74–81) as compared to clinopyroxene rims (Mg# of 64–79).
Olivine phenocrysts show little compositional variation. Most cores have nearly constant composition of Fo80.0–81.5 with 0.05–0.13 wt% NiO and 0.30–0.38 wt% CaO (Figure 4B). All investigated crystals exhibit a steep normal zonation with rim compositions of Fo74–81, 0.03–0.07 wt% NiO and 0.40–0.60 wt% CaO. Notably, the zoning profiles are shorter in lava flow samples collected near the vents (SD10, SD13: ∼4–14 μm) than in those collected far from the vents (SD16, SD21: ∼9–30 μm); in quenched glassy lapilli from sample SD04 the zonations are hardly detectable by electron microprobe and show only mildly decreasing forsterite content (Supplementary Figure S1 and Supplementary Table S8).
Amphibole phenocrysts in phonotephrites are kaersutites showing little zonation and little compositional variation with 5.7–6.1 wt% TiO2, 12.3–12.7 wt% CaO, 2.0–2.4 wt% Na2O, 1.6–1.8 wt% K2O, and Mg# between 64 and 71. Spinel phenocrysts in tephrites and phonotephrites are titaniferous magnetites with 12.6–19.8 wt% TiO2, 5.7–10.1 wt% MgO, 6.2–9.2 wt% Al2O3, and 0.42–0.69 wt% MnO. The proportion of the ulvöspinel component is comparatively high, ranging between 0.32 and 0.52. The compositional ranges for rims and cores overlap strongly, but rims tend to higher TiO2 and lower FeOtot.
Clinopyroxene-Melt Thermobarometry
Rationale
In this study we focused on thermobarometers based on clinopyroxene-melt equilibria. For hydrous samples Putirka (2008) recommends combination of models A and B of Putirka et al. (2003) if melt H2O content is unknown, or the combination of his Equations (30) and (33) if H2O is known. The standard errors of estimate (SEE) for test data are 500 MPa/60°C for models A and B, and 360 MPa/42°C for Equations (30) and (33), respectively; SEE for the calibration data are significantly lower. Errors can be significantly reduced by averaging estimates for a number of phenocrysts to perhaps < 150 MPa (Putirka et al., 2003). Here we consistently apply the Putirka et al. (2003) models in which P2O5 is not used for the calculation of molar proportions in the melt, similar to earlier thermobarometric data from Fogo (Hildner et al., 2011, 2012). In contrast, the supplementary spreadsheet of Putirka (2008) includes P2O5 in the calculations, which for our data set would increase calculated pressures by 30–50 MPa.
In order to constrain pre-eruptive pressures and temperatures, we applied the thermobarometer to compositions of clinopyroxene phenocryst rims and the sample groundmass. This has the advantage that mineral-melt pairs have a well-defined petrographic relationship and are near equilibrium texturally, albeit not necessarily chemically due to e.g., sector zonations (Neave et al., 2019). Clinopyroxene rim compositions were determined by analyzing a number of points along the periphery of euhedral phenocrysts close to their surfaces, similar to prior studies of Fogo lavas (Hildner et al., 2011, 2012). The distance to crystal faces was around 5 μm to avoid excitation of adjacent groundmass phases by the electron beam. Every single analysis was then tested for equilibrium with the respective host groundmass composition by applying and comparing three different filters:
Filter 1: the Fe-Mg partition coefficient KD(Fe-Mg)cpx–liq between clinopyroxene and melt has to be within the mean equilibrium value of 0.28 ± 0.08 for global experimental data, where Fetot is used for Fe (Putirka, 2008). In addition, the measured clinopyroxene components Jd, DiHd, EnFs and CaTs (Putirka et al., 2003) have to agree with those predicted from the groundmass composition within 2 SEE of the prediction equations (Putirka, 1999). This is our main filter used, consistent with earlier barometric studies of Fogo lavas (Hildner et al., 2011, 2012).
Filter 2: the difference between the predicted DiHd component after Equation (7) of Mollo et al. (2013) and the observed value for DiHd, denoted ΔDiHd, has to be within 1 SEE of the prediction equation (±0.06). This criterion was specifically chosen to be stricter than the DiHd criterion in filter 1. The value of ΔDiHd is a particularly sensitive indicator for disequilibrium conditions during crystal growth (Mollo et al., 2013; Mollo and Masotta, 2014) and is independent of Fe-Mg partitioning.
Filter 3: both the KD(Fe-Mg)cpx–liq criterion of filter 1 and the ΔDiHd criterion have to be satisfied.
Thermobarometry of Clinopyroxene Rims
Overall, we analyzed the rims of 100 phenocrysts in nine tephrite and 20 phenocrysts in two phonotephrite samples (Figures 5, 6 and Supplementary Table S4). A large number of crystal-melt pairs do not pass the chemical equilibrium tests despite textural equilibrium. Filter 1 removes around 40% of all analyzed points, which is almost entirely due to the KD(Fe-Mg)cpx–liq criterion, because the Mg# of many rim analyses is below the equilibrium range indicated by the host groundmass composition. Observed clinopyroxene components, in contrast, are within the predicted values for almost all analyses. We note that the values for the EnFs component predicted after Mollo et al. (2013) closely resemble those after Putirka (1999), and closely agree with observed values. Filter 2 discriminates far less whereas filter 3 is particularly strict, removing around 60% of all points in tephrites and 45% in phonotephrites (Table 3).
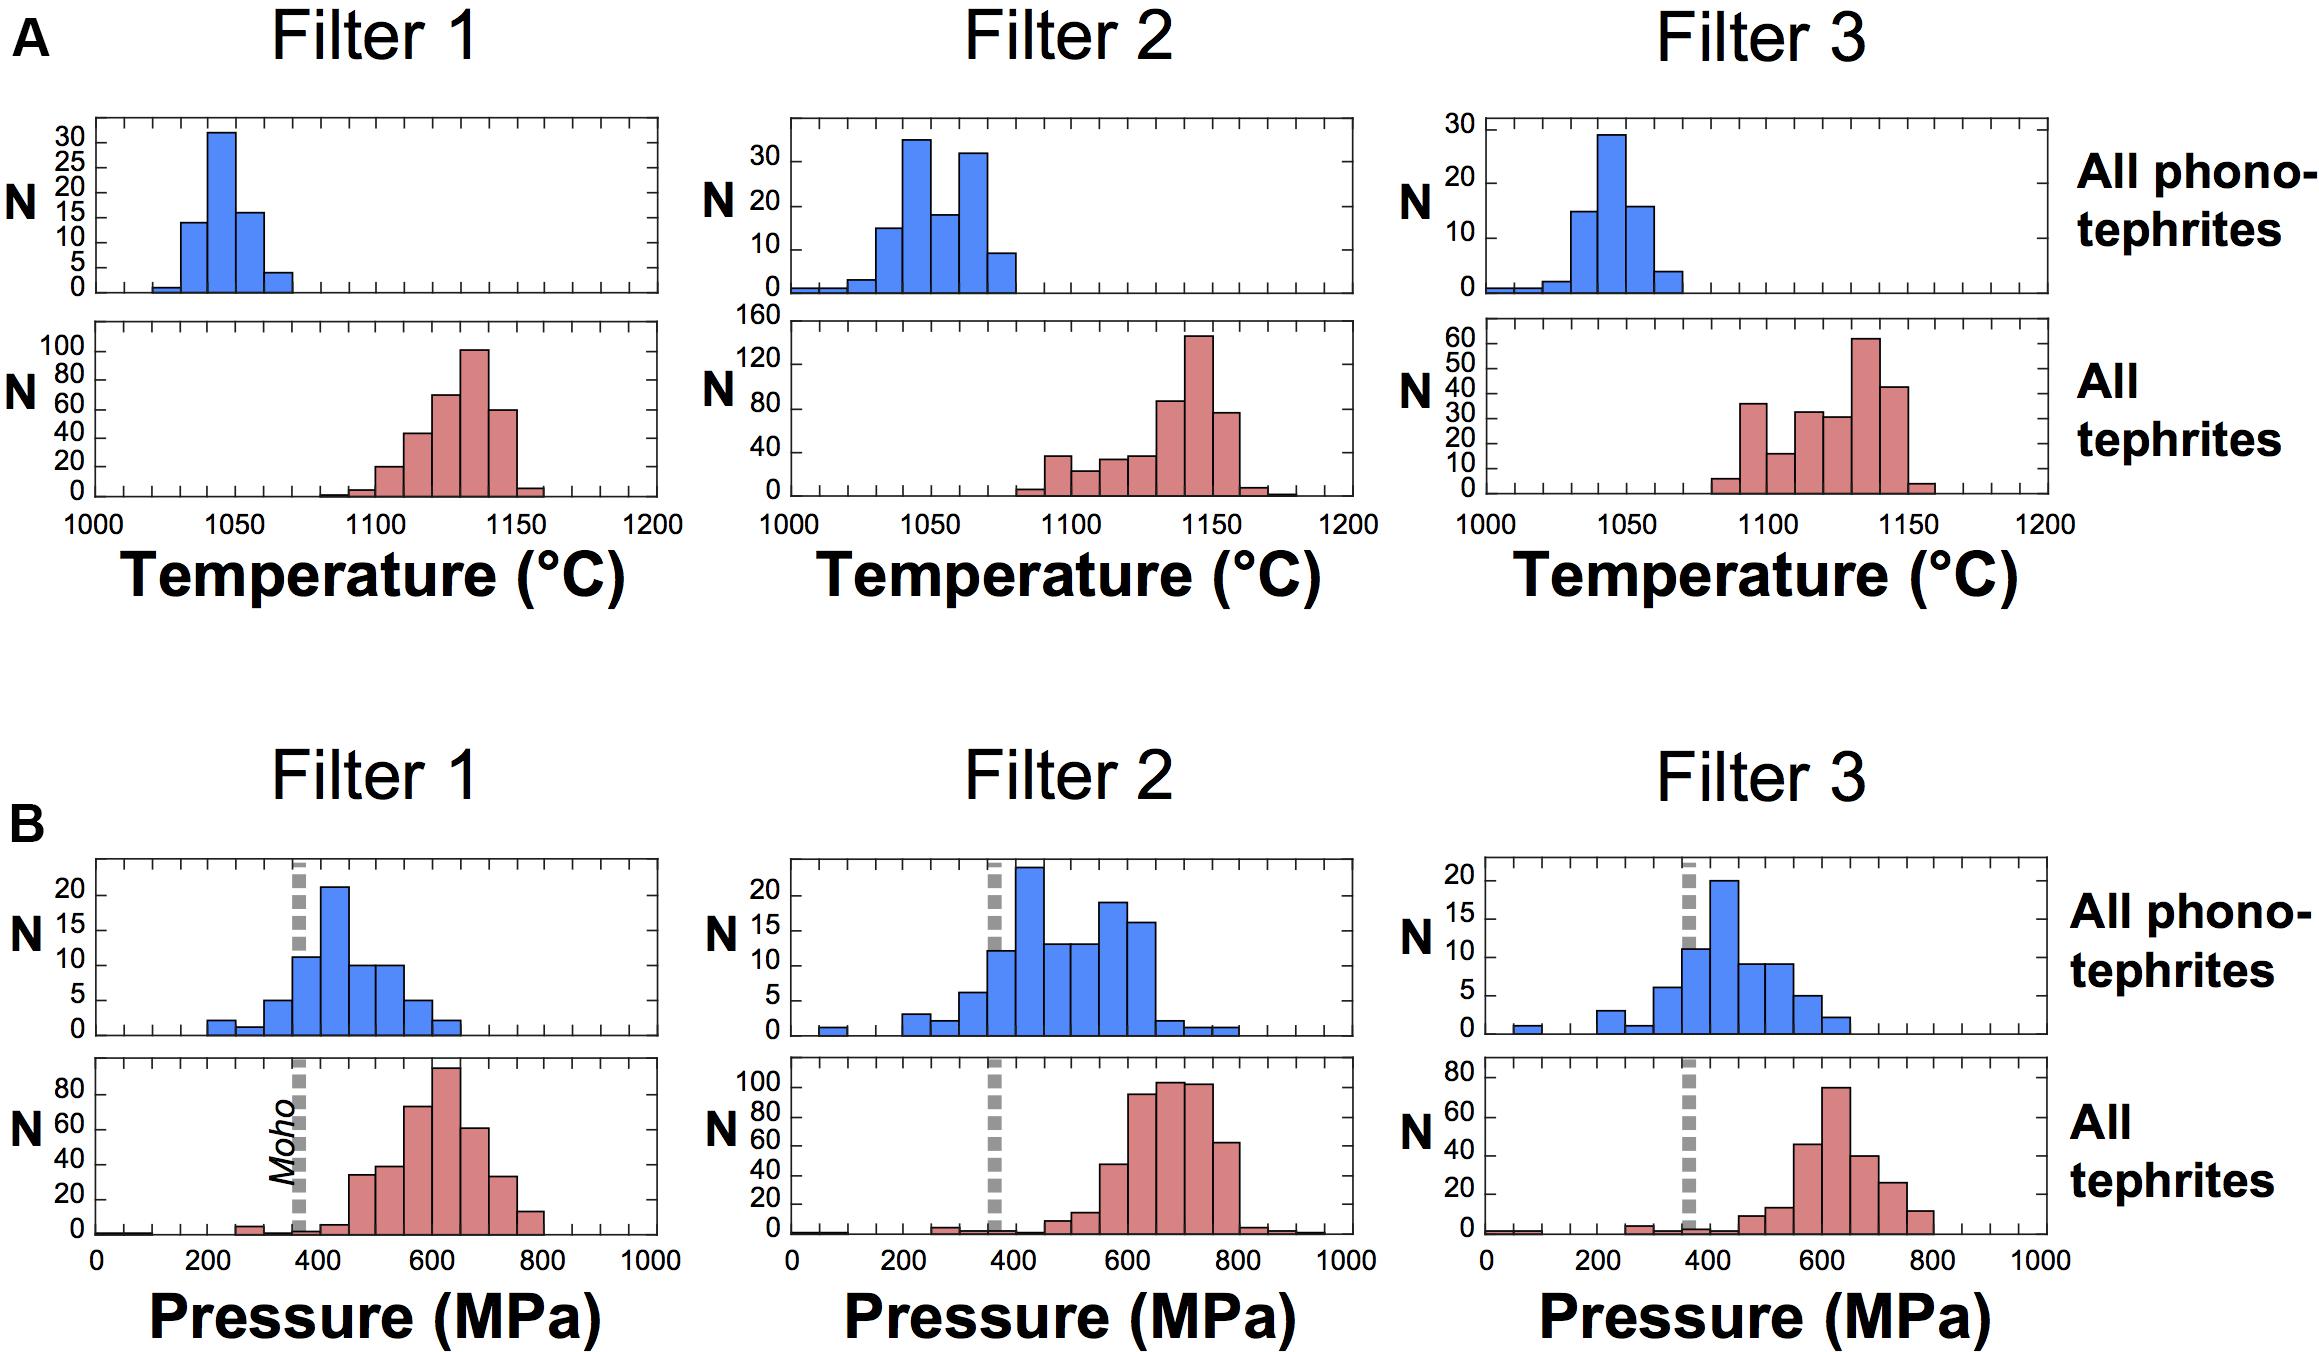
Figure 5. Summarized results of clinopyroxene-melt thermobarometry using the Putirka et al. (2003) calibration. Shown are the data for all clinopyroxenes in phonotephrites (blue) and in tephrites (red); N is the number of values. Data were filtered as described in the text and show little dependency of the filter used. (A) Temperature histograms with 10°C bins. (B) Pressure histograms with 50 MPa bins; dashed lines mark the approximate pressure at Moho depth after the crustal model of Pim et al. (2008).
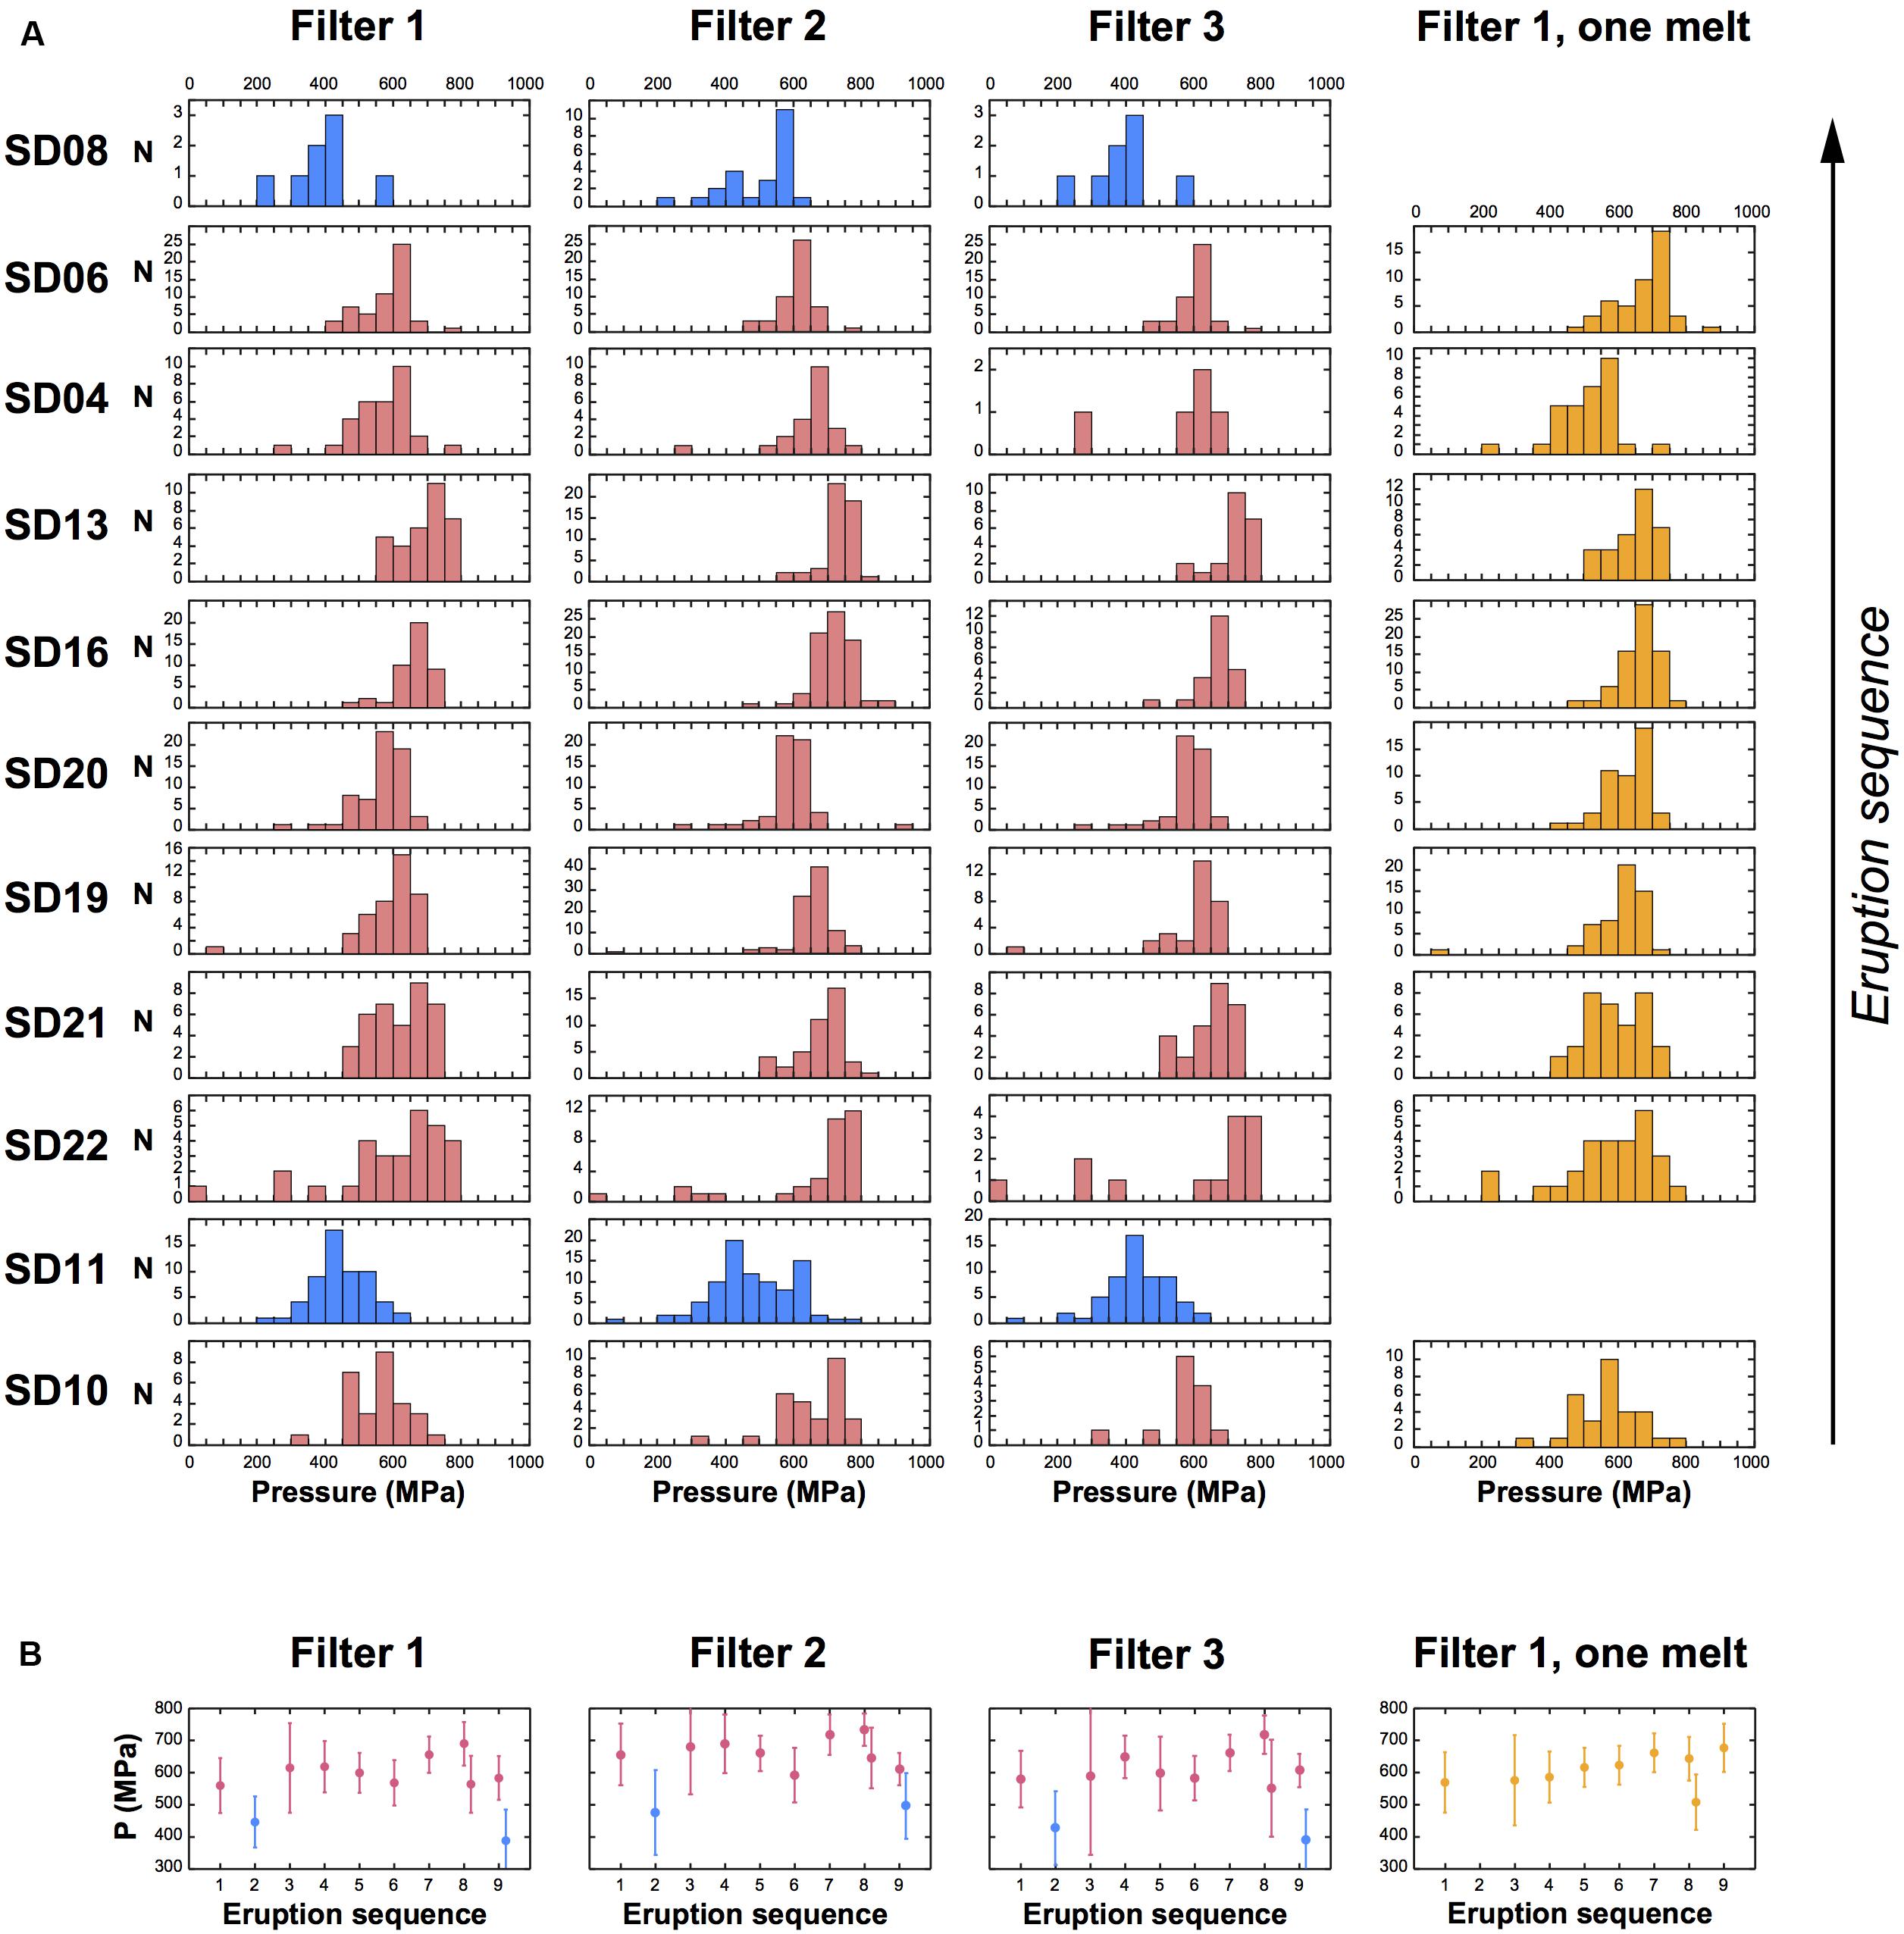
Figure 6. Single-sample results of clinopyroxene-melt barometry using the Putirka et al. (2003) calibration; data were filtered as described in the text. First three columns use each sample’s groundmass composition, fourth column uses the average tephrite groundmass composition for all tephrite samples. (A) Pressures for every sample sorted by eruption sequence from bottom (oldest) to top (youngest). Note that samples SD13 and SD04 have the same sequential order based on field relations, as do samples SD06 and SD08. (B) Average pressure for every sample plotted against eruption sequence number; error bars indicate ± 1 standard deviation. The data display some inter-sample variability that is only weakly dependent of the filter used.
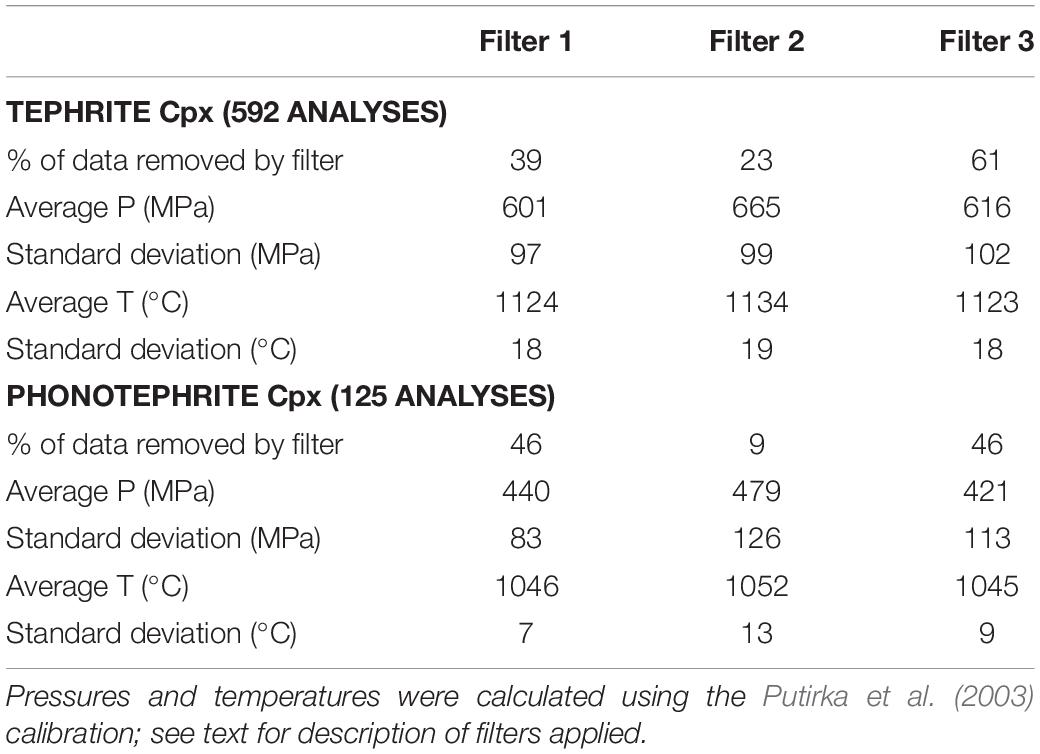
Table 3. Overview of P-T data for clinopyroxene rims and host melt.
Temperatures obtained after applying the different filters are remarkably similar, with averages of 1123–1134°C for tephrites and 1045–1052°C for phonotephrites; standard deviations (σ) are around 18 and 10°C, respectively. For average pressures there is little difference between filters 1 and 3, with values around 600–620 MPa for tephrites and 420–440 MPa for phonotephrites, and respective standard deviations around 100 MPa (Table 3). Filter 2 results in average pressures that are around 50 MPa higher. Overall the frequency distributions for the different filters are very similar, and differences are within the prediction errors of the thermobarometer (Figure 5). Our calculated pressures are around 150–200 MPa lower than those from Mata et al. (2017), who applied the same thermobarometer to cores of clinopyroxene phenocrysts paired with whole-rock compositions.
For comparison, we applied Equations (33) and (30) of Putirka (2008) to the same data assuming a H2O content of 2.5 wt% based on results for olivine-hosted melt inclusions (Moussallam et al., 2019). By using filter 1, average temperatures are 1135 ± 15°C for tephrites and 1079 ± 13°C for phonotephrites; corresponding pressures are 825 ± 115 and 701 ± 145 MPa, respectively (±1 σ indicated). The leverage of melt H2O on calculated temperatures and pressures is around −12°C and +35 MPa per wt% increase, hence variations by a few wt% of H2O would affect P-T estimates within the calibration errors of the thermobarometers. The data show that the alternative calibration yields higher pressures than the Putirka et al. (2003) model, a greater variance, and smaller pressure differences between tephrites and phonotephrites. Nevertheless, the data for both models still overlap within their prediction errors. The discrepancies illustrate that the possible error of our data may be larger than the standard deviation for a single data set might suggest. We also assessed the effect of analytical uncertainty of the groundmass data on calculated pressures. For this we generated a test data set by randomly imposing up to ±3 standard deviations for each element on a mean melt analysis (cf. Klügel et al., 2005). By using uncertainties reported in Supplementary Table S3 we obtained pressure uncertainties of around ±70 MPa, which is well below the calibration error of the barometers but may cause a significant part of the observed data spread.
Looking at thermobarometric data for individual samples, calculated pressures indicate some inter-sample variability among the tephrites (Figure 6A). This is best seen in diagrams of average pressure for each sample versus eruption sequence, where variations are similar for each filter, although most pressures overlap within one standard deviation (Figure 6B). However, this is uncertain for filter 3, which removes all but a few points for some samples. Likewise, calculated temperatures also show considerable variability (Supplementary Figure S2). Samples SD04 and SD06, the most and least MgO-rich of our tephrite samples (Table 2), yield the highest and lowest temperatures, respectively. Remarkably, pressure and temperature variabilities are strongly reduced if the average tephrite melt composition is used for all tephrite samples. In this case all samples except SD04 show strongly overlapping pressure and temperature ranges (Figure 6 and Supplementary Figure S3).
To sum up, the different filters and calibrations yield mean pressures between about 600 and 800 MPa for the tephrites and slightly lower values for the phonotephrites, with 600 and 440 MPa being our preferred values, respectively. As the Moho near Fogo is located at 12–13 km depth, or around 350 MPa (Pim et al., 2008), this consistently indicates pre-eruptive storage of the 2014–2015 tephrites and phonotephrites in the uppermost mantle, in agreement with the findings by Mata et al. (2017) obtained for clinopyroxene cores.
Thermobarometry Along Clinopyroxene Rim Traverses
In order to assess the effect of clinopyroxene rim zonations on the thermobarometric data, we analyzed some compositional profiles perpendicular to planar crystal surfaces across the 10–50 μm wide rim zones (Figure 7 and Supplementary Table S4). Overall the rim zones are complex and chemically highly variable. In most but not all cases they are characterized by steeply decreasing Mg# and Si toward the crystal surface, accompanied by increasing Ti and Al; variations in Na show little systematics. In BSE images many crystals also show an outermost zone < 2 μm wide, which could not be analyzed reliably. The compositions within the rim zones can vary considerably between phenocrysts of a single sample, and also between different faces of a single crystal. For the traverses shown in Figure 7, pressures calculated along the rim zones range between 430 and 880 MPa, and temperatures between 1127 and 1164°C. When applying filter 3, these ranges are reduced to 500–670 MPa and 1131–1153°C, respectively, within the range for single clinopyroxene rim analyses (Figure 5).
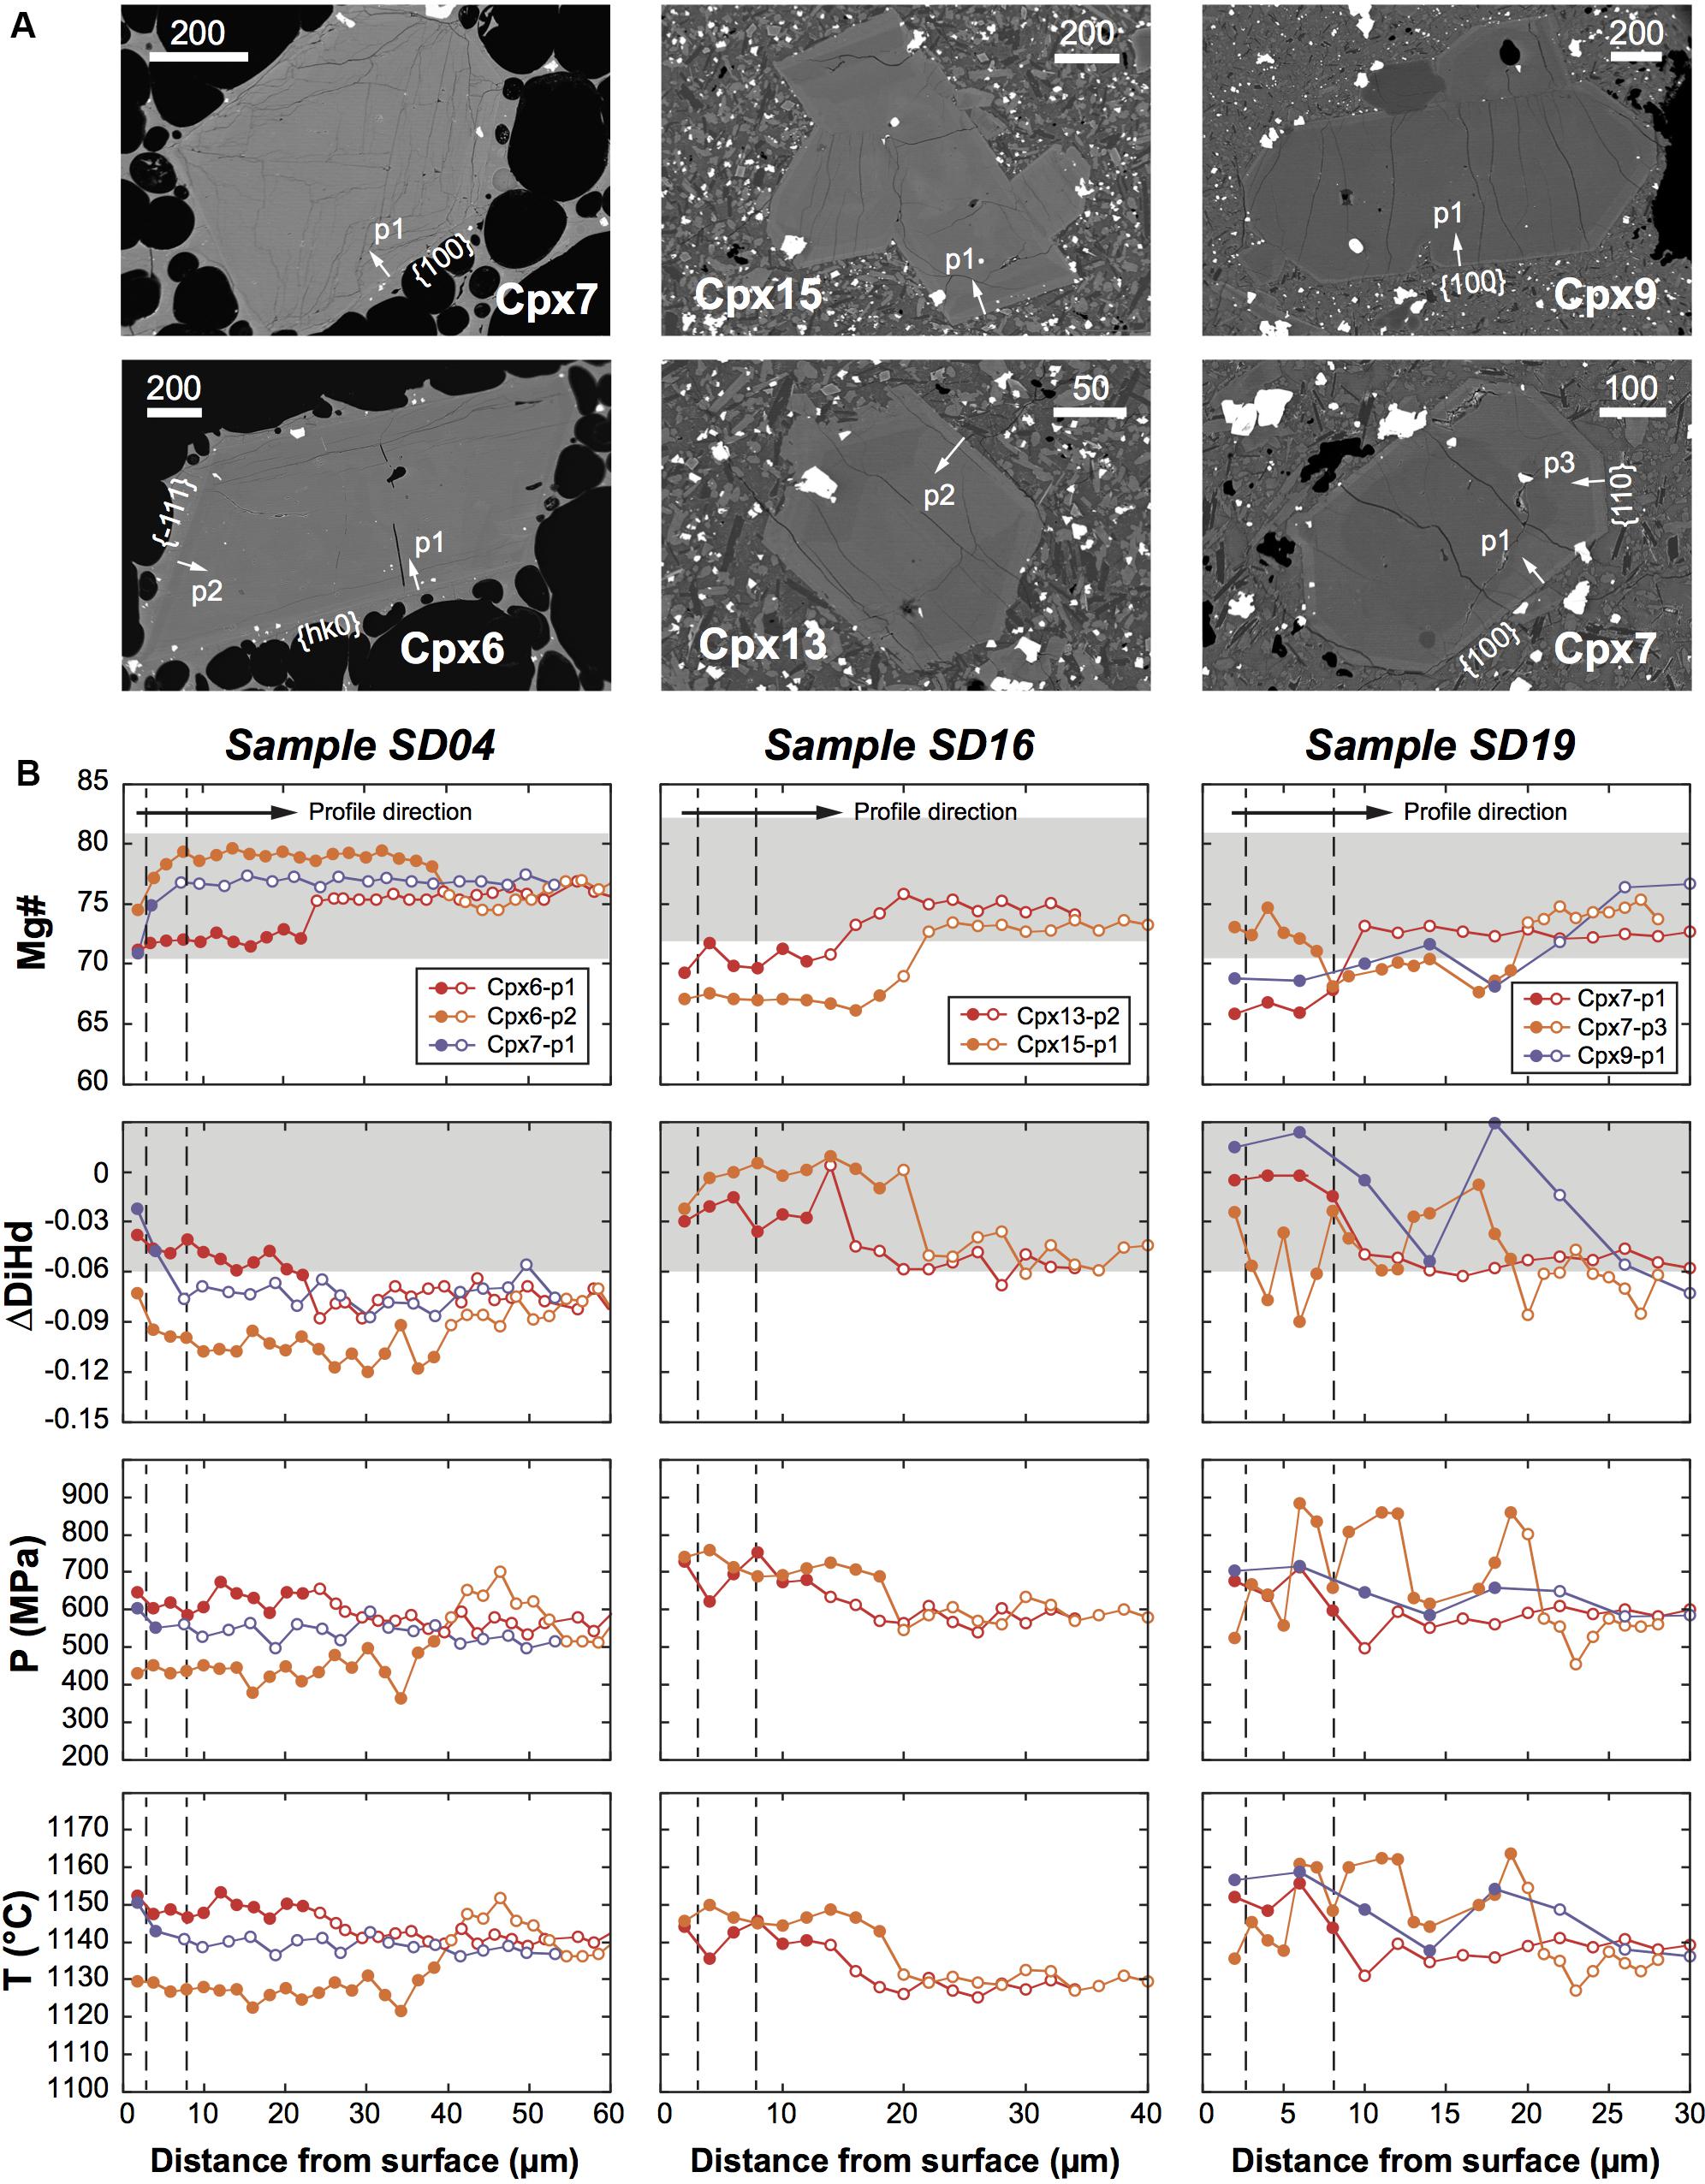
Figure 7. (A) BSE images of zoned clinopyroxene phenocrysts from three samples, indicating the locations of compositional traverses. The outer rim zones are well recognized. See Figure 2 for microphotographs of some of the crystals. (B) Profiles across the clinopyroxene rims indicated above. Shown are clinopyroxene Mg#, ΔDiHd calculated after Mollo et al. (2013), and pressures and temperatures after Putirka et al. (2003); all calculated values use the host groundmass composition. Filled symbols mark points located within the rim zones. Dashed lines delimit the range of 3–8 μm distance to the crystal surface, where most rim analyses for thermobarometry were carried out. Gray shading marks the equilibrium range used for the KD(Fe-Mg)cpx–liq and ΔDiHd filter criteria.
Olivine-Melt Thermometry and Melt Redox
In order to assess olivine-melt equilibria, to predict the Fe-Mg partition coefficient KD(Fe-Mg)ol–liq and to calculate melt temperature and redox, we used measured groundmass compositions as our preferred approximation to pre-eruptive melt compositions (Table 2). The predicted KD(Fe-Mg)ol–liq after Equation (8c) of Putirka (2016b) for five olivine-phyric samples are within a narrow range of 0.305–0.310. These values combined with measured olivine compositions yield molar Fe2+/Mg ratios of the groundmass between 0.76 and 0.86, implying Fe3+/Fetot between 0.26 and 0.36 (average 0.31). These results exclude olivine compositions that would yield groundmass Fe3+ below or close to zero, as these obviously indicate disequilibrium. For the average Fe3+/Fetot ratio of 0.31 the analyzed groundmass compositions would be in equilibrium with olivine Fo79.7–81.4, which agrees well with the observed range for phenocryst cores (Fo80.0–81.5) and some rims. Most observed rim compositions, however, are too low in forsterite content to be in equilibrium with the groundmass (Figure 4B).
Oxygen fugacity was calculated using the recent calibration of Putirka (2016b). For a Fe3+/Fetot ratio of 0.31 we obtained log(fO2) between −7.7 and −7.6, or 0.2–0.3 log units above the NNO buffer, for the 2014–2015 tephrite melt. This is 0.6–2.0 log units below the estimates of Mata et al. (2017), which were based on kaersutite phenocryst compositions (see below). For comparison, calculation of KD(Fe-Mg)ol–liq using the model of Toplis (2005) would yield an average value of 0.27, resulting in a mean Fe3+/Fetot ratio of 0.21 and an oxygen fugacity of 0.5–0.6 log units below NNO.
For olivine-melt thermometry we used a melt H2O content of 2.5 wt% as above and a pressure of 600 MPa derived from clinopyroxene-melt barometry, considering that olivine and clinopyroxene are coexisting phenocryst phases in these rocks. According to Putirka (2008) the most precise olivine thermometer for hydrous systems is Equation (4) of Putirka et al. (2007), with a SEE of 29°C for hydrous systems and 43°C overall. Its application to groundmass and mean olivine core compositions yields 1113–1122°C (Supplementary Table S5), in good agreement with clinopyroxene-melt thermometry (Figure 5). The dependency of calculated temperatures on melt H2O and pressure is about −18°C per wt% and +5°C per 100 MPa increase, respectively. Thus, variations by 2 wt% H2O or 700 MPa would affect temperature estimates within the calibration uncertainty. Olivine rims have lower forsterite contents but give higher temperatures than cores (1122–1138°C), which is not plausible and reaffirms the inferred disequilibrium between rim and groundmass compositions.
Amphibole Thermobarometry and Hygrometry
The empirical thermobarometric and chemometric equations of Ridolfi et al. (2012) allow calculation of melt temperature, pressure, H2O content, and oxygen fugacity based on the composition of amphibole crystals alone. The reported SEE for the calibration data are T ± 24°C, P ± 12%, H2Omelt ± 0.8 wt% and fO2 ± 0.4 log units. Recent tests by Putirka (2016a) show that the thermometer is comparatively precise, whereas the performance of the barometer is intrinsically limited by the lack of P-sensitive amphibole components, as is expressed by a precision of ± 400 MPa for a test data set. Pressures obtained from the amphibole barometer should thus be compared to independent barometers. Likewise, the precision of the hygrometer is limited because amphibole saturation and composition show little dependency on melt H2O (Putirka, 2016a).
Application of the Ridolfi et al. (2012) equations on average compositions of seven amphibole phenocrysts from an early and a late erupted phonotephrite yield temperatures of 1040–1056°C, pressures of 610–660 MPa, melt H2O contents of 3.9–4.3 wt%, and oxygen fugacities of 1.1–1.6 log units above the NNO buffer (Supplementary Table S6), comparable to data from Mata et al. (2017). The amphibole-derived temperatures show excellent agreement with clinopyroxene-melt thermobarometry on the host phonotephrites, whereas the pressures are slightly higher, although they overlap with those obtained using the alternative calibration (Equation 30 of Putirka, 2008). Calculated oxygen fugacities are higher than those for the tephrites (NNO+0.3), which is plausible because Fe3+/Fetot ratios typically increases during crystal fractionation. The values imply a melt Fe3+/Fetot ratio of 0.40–0.46 (after Putirka, 2016b), as compared to 0.26–0.36 found for the tephrites. Considering that Fe3+/Fetot of 0.46 seems rather oxidized, we suggest that an oxygen fugacity of NNO+1.1 provides an upper bound for the phonotephrites. The calculated melt H2O contents are above those found in olivine-hosted melt inclusions from Fogo (up to 2.6 wt%; Moussallam et al., 2019), but appear plausible considering the differentiated nature of the phonotephrites compared to the mafic tephras investigated by these authors.
Fluid Inclusion Barometry
Fluid inclusions are comparatively rare in phenocrysts from the 2014–2015 eruptive products, in contrast to melt inclusions. We analyzed 216 primary and secondary fluid inclusions in 12 clinopyroxene phenocrysts from samples SD04 (pyroclasts) and SD10, SD13, and SD16 (lava flows). Primary inclusions occur either singly or randomly orientated in clusters, whereas secondary inclusions form trails that extend to grain boundaries (Figures 2G,H). Secondary inclusions are more abundant and tend to be smaller than primary ones. Inclusions are oval to spherical or are negatively crystal-shaped. The largest measured inclusion was 25 μm in size, but most were < 5 μm. Inclusions indicating partial decrepitation, such as small cracks or radiating trails of micro-inclusions (cf. Roedder, 1984), were not investigated.
The investigated inclusions froze to solid CO2 and vapor during cooling to between −90 and −100°C; further cooling to −190°C did not generate additional phase transitions. During reheating, few inclusions showed a melting interval with initial melting temperatures (Ti) between −59.7 and −57.5°C, but for most inclusions initial and final melting (Tm) coincided. Overall Tm ranged between −59.3 and −56.6°C, the triple point of pure CO2 (Supplementary Table S9). Melting temperatures below −56.6°C indicate the presence of components such as N2 or CH4 in the inclusions (Andersen and Neumann, 2001; Frezzotti et al., 2002). Inclusions with Tm between −57.5 and −56.6°C contain less than 5 mole% of these components (van den Kerkhof, 1990), which should not significantly affect the interpretation of the P-T conditions during fluid trapping if pure CO2 inclusions are assumed. Inclusions with Tm below −57.5°C (18 inclusions from sample SD13) were discarded. We found no evidence for H2O or OH-bearing secondary phases in any observed inclusion (cf. Andersen and Neumann, 2001; Frezzotti et al., 2002; Frezzotti and Touret, 2014). Our data thus suggest that the fluid inclusions consist of almost pure CO2, similar to inclusions observed in lavas from other Fogo eruptions (Hildner et al., 2011, 2012).
Most measured inclusions homogenized into the liquid phase between 27.9 and 31.1°C, close to the critical point of pure CO2 (Figure 8A). No systematic difference between primary and secondary inclusions was found. For eleven inclusions no phase transition above the CO2 triple point could be observed; these probably homogenized into the vapor phase. Calculated densities range from 0.47 to 0.66 g/cm3 and show a bimodal distribution (Figure 8B), however, the upper frequency maximum is due to a single inclusion-rich crystal. Importantly, fluid inclusions in the quenched sample SD04 yield higher densities than those in lava flow samples. For a model temperature of 1140°, CO2 isochores calculated after Sterner and Pitzer (1994) indicate a pressure range of 190–340 MPa (average 297 ± 31 MPa) (Figure 8B). The dependency on temperature is weak; a variation of ± 20°C would result in a pressure variation of ± 3 to ± 6 MPa for the density range observed. The calculated pressures are less than those indicated by clinopyroxene-melt barometry, and are equivalent to the depth of the lower oceanic crust and Moho boundary near Fogo (Pim et al., 2008).
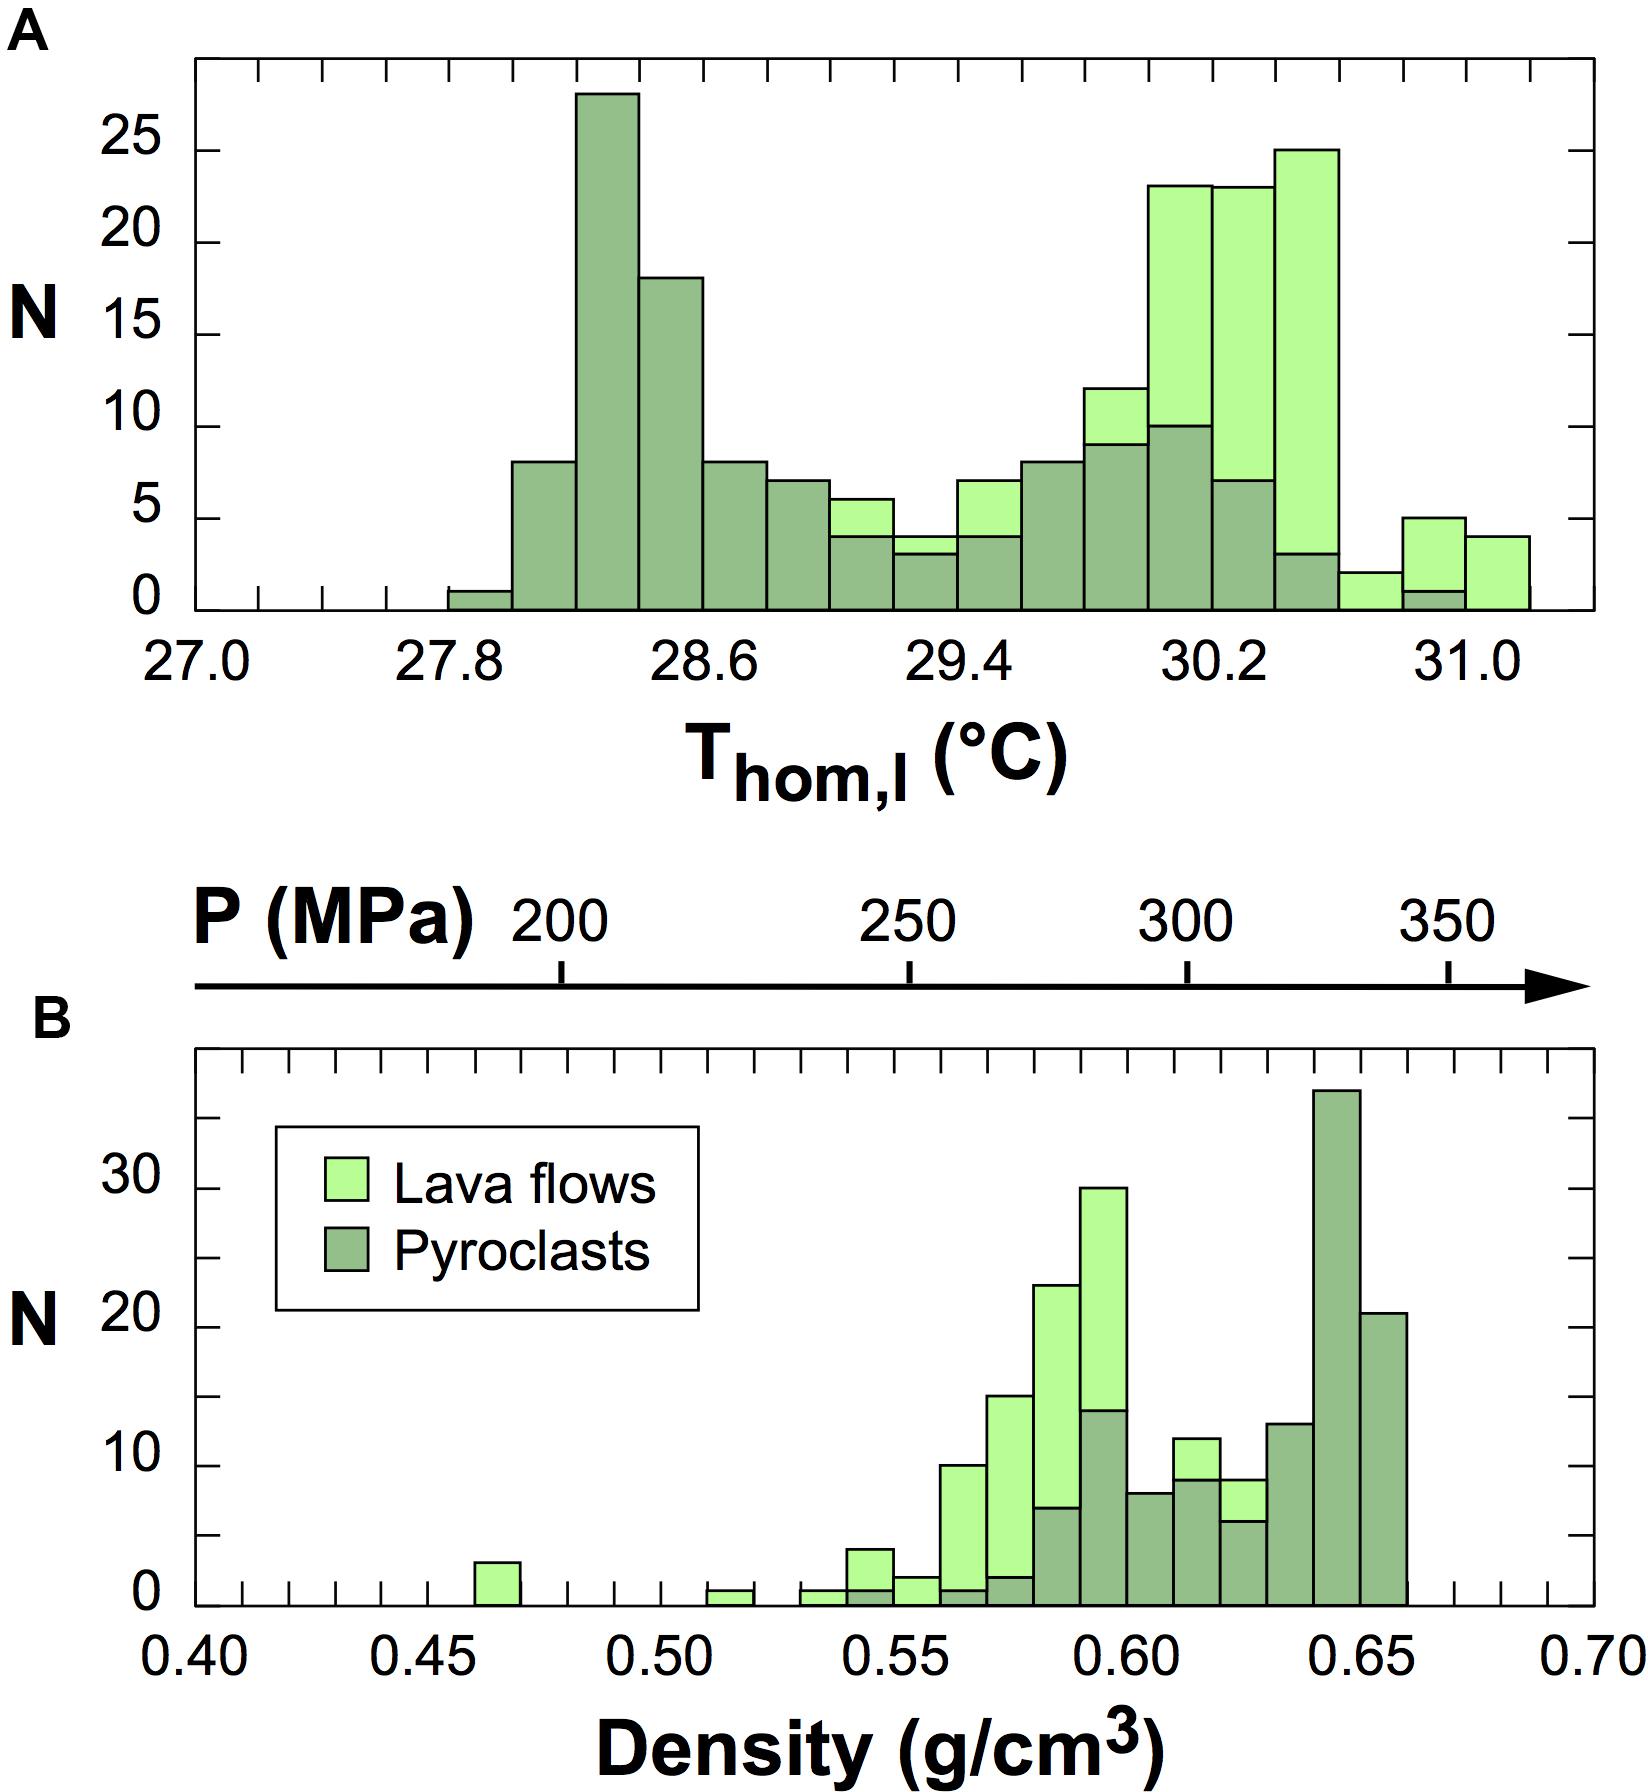
Figure 8. Frequency distribution of (A) homogenization temperatures and (B) densities of clinopyroxene-hosted fluid inclusions as determined by microthermometry. Inclusions from quenched glassy lapilli (sample SD04) have higher densities than those from lava flow samples, indicating continuing re-equilibration during the time the samples resided in the flowing lava.
Discussion
In this study, we have obtained petrological data to shed light on magmatic processes before and during the 2014–2015 Fogo eruption. We begin the discussion with a critical appraisal of the thermobarometric data obtained for clinopyroxene rims, with emphasis on equilibrium tests and the role of sector zonations. We then discuss the origin and implications for rim zonations of clinopyroxene and olivine phenocrysts, and evaluate the fluid inclusion data. After summarizing the data in a model of magma storage and ascent during the 2014–2015 eruption, a synopsis of the magmatic plumbing system beneath Fogo is given.
Clinopyroxene-Melt Equilibrium Tests
The coefficient KD(Fe-Mg)cpx–liq is an often-used but insufficient test for chemical equilibrium between clinopyroxene and melt. As the equilibrium range of 0.04–0.68 for global experimental data is rather large, with a mean of 0.28 ± 0.08 (Putirka, 2008), the test provides a minimum requirement rather than a tight filter. It is also not reliable, because KD(Fe-Mg)cpx–liq still can be around 0.28 in the case of disequilibrium crystallization (Putirka, 2008; Mollo et al., 2013; Mollo and Masotta, 2014). Conversely, the coefficient can be beyond the equilibrium range if sector zonations occur, because Mg is strongly susceptible to sector partitioning (Ubide et al., 2019). Despite these weaknesses, KD(Fe-Mg)cpx–liq provides information on equilibrium and crystal growth conditions when used together with other partition coefficients and/or tests comparing predicted and measured clinopyroxene components DiHd, EnFs, Jd, and CaTs (Putirka, 2008; Ubide et al., 2019; Neave et al., 2019). The ΔDiHd test is particularly useful in this respect, because the DiHd component is a robust disequilibrium indicator and strongly depends on cooling rates (Mollo et al., 2010, 2013).
The usefulness of ΔDiHd for equilibrium tests has been demonstrated by phase equilibrium experiments and by investigations on natural samples (e.g., Mollo et al., 2013; Ubide et al., 2019), yet interpretations are not always straightforward as is shown by our data for clinopyroxene rims. For tephrite-hosted clinopyroxenes, ΔDiHd values calculated after the prediction equations of Putirka (1999) and of Mollo et al. (2013) show good negative correlations with clinopyroxene Mg# and dominantly have positive and negative values, respectively (Figures 9A,D). As the Mg# decreases, ΔDiHd after Mollo et al. (2013) approaches zero, whereas ΔDiHd after Putirka (1999) departs from zero. These relations reflect the dependency of both models on uncertainties in our P-T estimates used as input parameters. The Putirka (1999) model for DiHd is T-dependent, whereas the more recent Mollo et al. (2013) model is P-T-dependent and calibrated over a much broader experimental data set. Indeed, if temperatures for the Putirka (1999) model were increased by 40°C, the values for ΔDiHd shown in Figure 9A would be almost identical to Figure 9D. Nonetheless, both prediction models indicate equilibrium (ΔDiHd = 0) within 2 SEE for most values of our data set. By comparison with the compositions of co-existing olivine phenocrysts, clinopyroxenes in equilibrium with the host melt should have high Mg# around 75–80; for these compositions the observed KD(Fe-Mg)cpx–liq is close to 0.28 (Figure 9E).
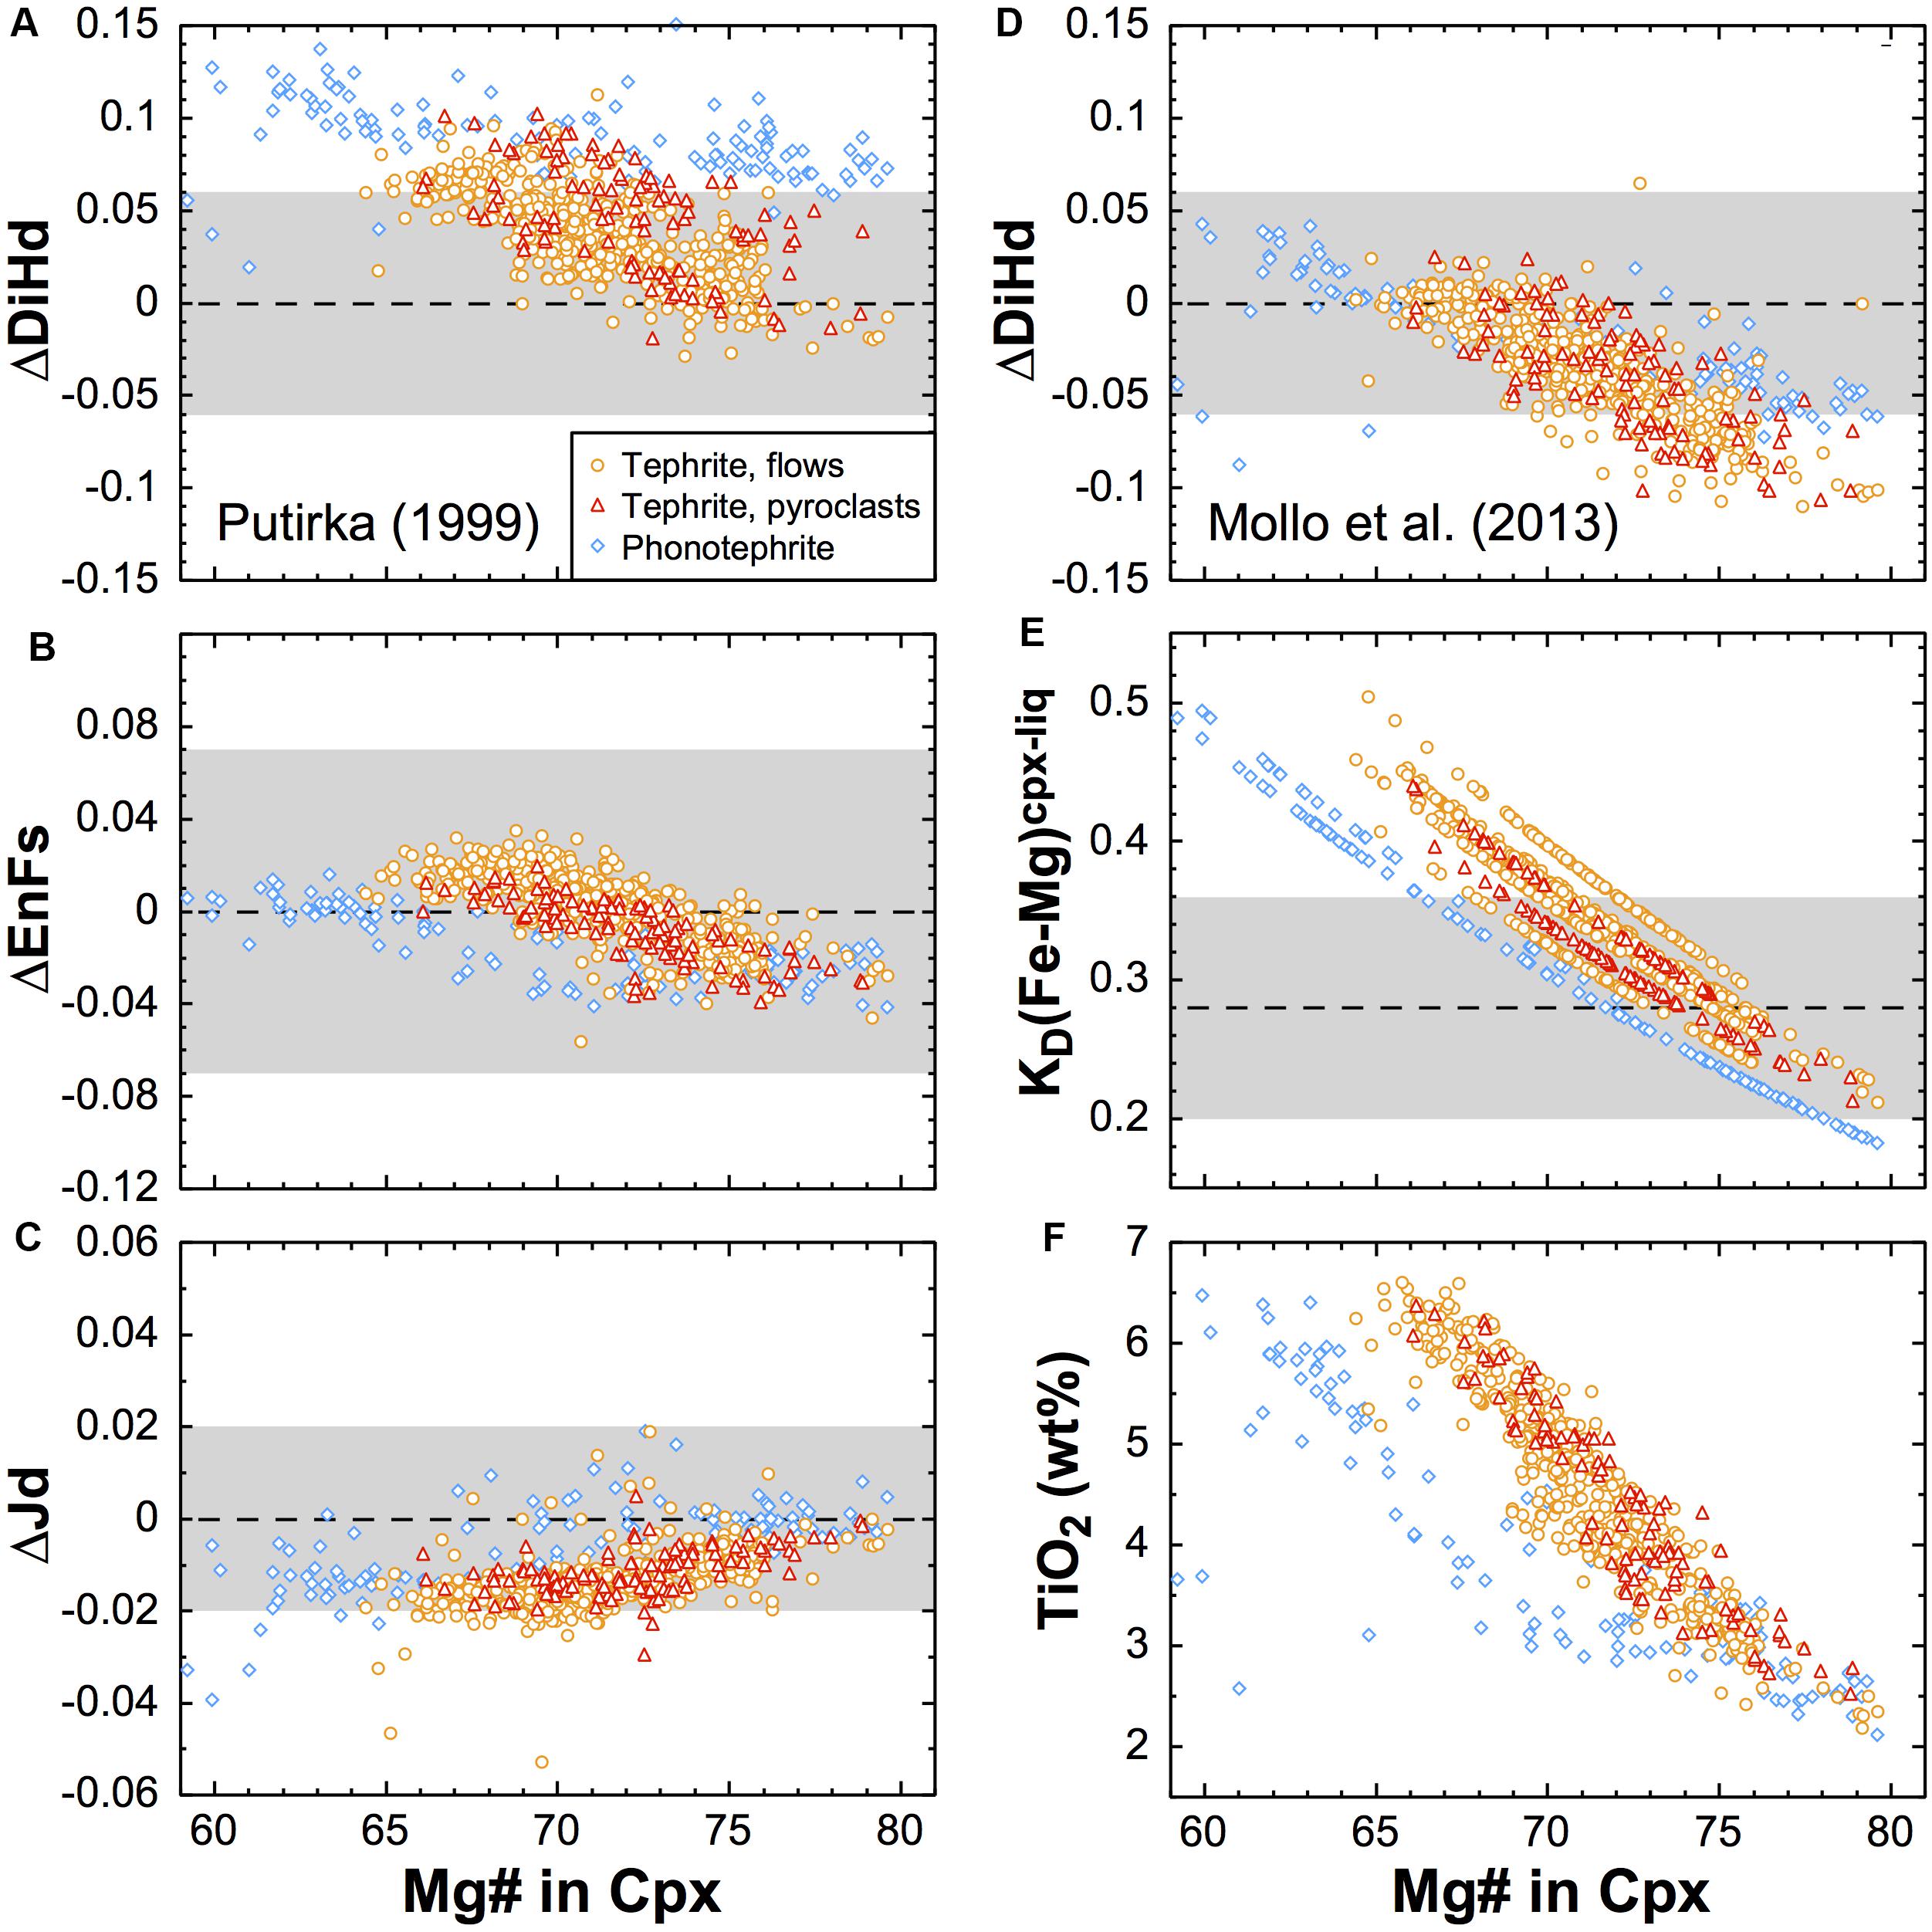
Figure 9. Compositional range and equilibrium criteria for the rims of clinopyroxene phenocrysts in tephrites (590 analyses) and phonotephrites (diamonds; 125 analyses) from the 2014–2015 eruption. The diagrams present clinopyroxene Mg# versus (A) ΔDiHd; (B) ΔEnFs; (C) ΔJd; (D) ΔDiHd after Mollo et al. (2013); (E) measured KD(Fe-Mg)cpx–liq using groundmass compositions; and (F) TiO2 in clinopyroxene. In (A–C) the delta notations indicate the difference between predicted and measured clinopyroxene components after Putirka (1999). For ΔEnFs, the more recent calibration of Mollo et al. (2013) yields a similar distribution but is shifted by +0.010 to +0.015. Dashed lines show the equilibrium values for clinopyroxene components and the global mean for KD(Fe-Mg)cpx–liq; gray fields encompass ± 1 SEE of the model error for clinopyroxene components, and ± 1 standard deviation for the mean KD(Fe-Mg)cpx–liq (Putirka, 2008). For tephrites the diagrams discriminate between crystals in rapidly cooled pyroclasts (samples SD04 and SD06; triangles) and slowly cooled lava flows (circles), showing that there is no significant difference between both groups.
Our results confirm the suitability of sector-zoned phenocryst rims for clinopyroxene-melt thermobarometry (Ubide et al., 2019). By using appropriate melt compositions and applying robust filters, useful pressure and temperature estimates can be obtained, as is corroborated by the low standard deviations of our P-T estimates (Table 3), and by the good agreement between predicted and measured EnFs and Jd components (Figures 9B,C). The advantage of our approach is that the known melt composition for each sample permits removal of rim analyses that are not in equilibrium with the melt. Another useful approach is iterative selection of putative equilibrium melts from a data base of glass and whole-rock analyses until a composition that best meets given equilibrium criteria is found (Barker et al., 2015; Neave and Putirka, 2017). This is the only way to go if the former host melt of the crystals cannot be analyzed, but has the disadvantage that analyses representing a period of disequilibrium growth may also be included and paired with “equilibrium” liquids. The present study uses one fixed (melt composition) and one variable (rim compositions) quantity, whereas the alternative approach uses two variable quantities. This may bias the results and yield a larger spread of pressure and temperature estimates.
We also tested our filtering approach by tentatively using tephrite whole-rock rather than groundmass compositions for thermobarometry on clinopyroxene rims, even though this violates textural evidence. This increases the number of crystal-melt pairs removed from 39 to 61% for filter 1 mostly due to the KD(Fe-Mg)cpx–liq criterion, and from 23 to 60% for filter 2; filter 3 removes almost all data. Calculated mean temperatures and pressures increase considerably to 1171°C/830 MPa for filter 1 and 1188°C/940 MPa for filter 2 (cf. Table 3); the standard deviations of pressure estimates also increase. These pressures overlap with the data reported for clinopyroxene phenocryst cores paired with whole-rock compositions (Mata et al., 2017), which is not unexpected because core and rim compositions overlap (Figure 4). The test thus shows that filters 1 and 2 have limited capability in removing clinopyroxene-melt pairs that are not in textural equilibrium, and that a wide range of P-T estimates can be obtained when testing for compositional equilibrium alone. Whereas we do not know which of these P-T estimates are closer to true values, we favor our data shown in Table 3 as these are backed by the petrographic relationships.
Zonations in Clinopyroxene Rims and Implications for Thermobarometry
An intriguing aspect of our data set is the large variability of rim compositions of clinopyroxene phenocrysts (Figure 4A). Even though all clinopyroxene rims were analyzed close to planar crystal faces, they encompass a larger compositional range than the cores. This is remarkable because the rims represent similar pressures and temperatures during growth, at least within a single sample. The most plausible explanation for this observation is sector zonation of clinopyroxene rim zones, as is also apparent in many BSE images (Figure 7A).
It has long been recognized that sector zonations are very common in clinopyroxene phenocrysts in alkalic as well as in sub-alkalic melts, even if they are euhedral (e.g., Strong, 1969; Ferguson, 1973; Nakamura and Coombs, 1973; Wass, 1973; Downes, 1974; Leung, 1974; Brophy et al., 1999). The zonations are attributed to kinetic effects when crystals grow at conditions beyond equilibrium, at considerable degrees of undercooling (Kouchi et al., 1983; Schwandt and McKay, 2006). As a consequence, cations of major and trace elements are partitioned among different sectors that grow at different rates. The partitioning depends on the degree of undercooling and cation charge/radius in a complex way. Commonly, fast-growing {−111} hourglass sectors are Si-Mg enriched, whereas slow-growing {hk0} prism sectors are Al-Ti enriched; other elements show a more variable behavior (Leung, 1974; Kouchi et al., 1983; Welsch et al., 2016; Ubide et al., 2019). Indeed, our data for clinopyroxene rims show good positive correlation of Mg# with Si, and good negative correlations with Al, Ti and Na (Figure 4A). This can be expressed in terms of a coupled substitution reaction between {−111} hourglass and {hk0} prism sectors: [Si4+ + Mg2+]{–111} ⟺ [Al3+ + Ti4+ + Na+]{hk0} (Welsch et al., 2016; Ubide et al., 2019; Neave et al., 2019). In consequence, different sectors have strongly differing compositions even if they grew concomitantly, which results in highly variable pressure and temperature estimates when thermobarometry is applied (Mollo et al., 2013; Mollo and Masotta, 2014; Hammer et al., 2016; Neave et al., 2019; Ubide et al., 2019).
The complex influence of sector zonations on thermobarometric results is exemplified by our compositional traverses across clinopyroxene rim zones (Figure 7). Crystal Cpx6 from sample SD04 (Figure 2A) exhibits a concentrical but heterogeneous rim zone. At profile Cpx6-p1 it is 22 μm wide and has higher Fe, Al, and Ti, and lower Mg and Si, than at profile Cpx6-p2 where it is 40 μm wide. This clearly reflects sector zonation, with profile Cpx6-p1 crossing a prism sector {hk0} and Cpx6-p2 crossing the hourglass or basal sector {−111} (cf. Downes, 1974; Leung, 1974; Welsch et al., 2016; Ubide et al., 2019). Clinopyroxene components, Mg# and ΔDiHd thus differ strongly between both profiles but tend to converge near the crystal surface. Consequently, pressures and temperatures calculated for both profiles differ by ca. 200 MPa and 20°C, respectively, almost independent of the distance to the crystal surface. Indeed, pressures calculated along Cpx6-p2 are below the values for most tephrite-hosted clinopyroxenes of the eruption (cf. Figure 5). Profile Cpx6-p1, in contrast, yields reasonable P-T estimates at the outer rim zone; the values also agree with those at the outer rim of profile Cpx7-p1 from another phenocryst.
Considering sample SD16, the rim zones of profiles Cpx13-p2 and Cpx15-p1 are both around 20 μm wide and have slightly different compositions (Figure 7). The values for ΔDiHd after Mollo et al. (2013) are all within the equilibrium range, as are the differences between predicted and measured clinopyroxene components after Putirka (1999), suggesting that both rim zones grew at conditions not far from equilibrium. Both profiles also indicate similar pressures and temperatures. The Mg# of the rim zones, however, are well below the equilibrium range considered, probably because the profiles are located in Mg-poor sectors. In sample SD19, crystal Cpx7 exhibits a rim zone of about 10–20 μm thickness that is well recognized in a BSE image (Figure 7). Profile Cpx7-p3 at prism form {110} reveals irregular variability of ΔDiHd and Mg# with little correlation between both, and large variability of P-T estimates. In contrast, profile Cpx7-p1 at prism form {100} reveals consistently low values for ΔDiHd, strongly decreased Mg#, and less variable P-T estimates in the rim zone, similar to the profiles from sample SD16.
In summary, our clinopyroxene rim traverses show that P-T estimates can be critically affected by the choice of the crystal facet or sector analyzed, but show little dependence on the distance to the crystal surface. This is surprising because the analyzed host groundmass composition is in equilibrium strictly with the clinopyroxene surface only. Nevertheless, the distance of analytical spots to the crystal surface should be as small as possible, although the outermost few μm cannot be analyzed reliably by electron microprobe due to excitation of the adjacent groundmass by the electron beam.
Origin of Clinopyroxene Rim Zonations
The presence of sector zonations in clinopyroxene rim zones, but lack of hopper or dendritic morphologies, suggest that the rims formed by rapid but near-equilibrium crystal growth at low degrees of undercooling, likely < 25°C (Kouchi et al., 1983). Clinopyroxene crystal cores, in contrast, are commonly anhedral and/or complexly zoned, and are inferred to have formed in diverse conditions. Many appear to represent cumulate fragments or entrained crystal mush. Sector zonations in the cores are common (Figure 7A), but their limited compositional range compared to rim zones suggests that they formed at lower growth rates. This situation is comparable to clinopyroxene phenocrysts at Etna volcano (Ubide et al., 2019), but is in contrast to the results from a detailed clinopyroxene study from Haleakala volcano, Hawaii, which record initial rapid disequilibrium growth followed by a period of slower crystallization before eruption (Hammer et al., 2016; Welsch et al., 2016). The rims of phonotephrite-hosted clinopyroxenes show similar correlations of Mg# with Si, Al, and Ti as tephrite-hosted ones, but shifted to lower Mg# (Figure 4A). This is consistent with rapid but near-equilibrium growth of the rims in a more evolved melt, resulting in sector zonation as expressed by the covariations of Mg, Si, Al, and Ti observed.
The sector-zoned clinopyroxene rim zones raise the question whether they formed in magma reservoirs at depth, or at shallow levels or surface during eruption. For the second scenario, one would expect differences in rim thickness and composition between quickly cooled pyroclasts with glassy matrix (samples SD04 and SD06) and samples that cooled slowly during lava flow emplacement and cooling. Figure 9 shows that this is not the case, as compositional range and equilibrium criteria of clinopyroxene rims do not differ between pyroclasts and lava flow samples. This similarity implies similar growth conditions for all clinopyroxene rim zones, no matter how fast the magma had cooled after eruption. It follows that the rims must have grown at depth, which is consistent with the barometric results giving overlapping mantle pressures for all tephrite-hosted clinopyroxenes, irrespective of the sample type (Figure 6). An exception are the < 2 μm thin outermost rim zones recognized in BSE images of many crystals from lava flows. These likely formed during cooling of the lava, but are too thin to be analyzed reliably with the electron microprobe.
The time scale to form the rim zones may be approximated by a simple one-dimensional diffusion model for the boundary between rim zone and crystal core. We assume that the rim zone formed instantaneously at time t = 0 with a stepwise change in Mg# (Figure 7), that will subsequently be leveled by Fe-Mg interdiffusion to form an s-shaped gradient. The time for a compositional step to develop an s-shaped profile of length L by diffusion is then approximated as:
(e.g., Klügel et al., 2000), where DFe–Mg is the Fe-Mg interdiffusion coefficient. The time t thus represents the period between rim zone formation and the end of diffusion across the rim-crystal core boundary. By using a constant DFe–Mg of 4 × 10–19 m2s–1 calculated after Müller et al. (2013) for diopside at 1140°C, we obtain diffusion times ranging from 4 days for a < 3 μm long gradient (sample SD04 profile Cpx6-p1), to max. 30 days for up to 8 μm long s-shaped gradients in other profiles (Figure 7). These values provide an upper limit for the actual duration of the period in which the rim zones formed, because crystal growth during diffusion (the moving boundary problem) as well as 3-D cutting effects of the investigated crystals are neglected (cf. Costa et al., 2008). Being well aware of these limitations, we suggest that the rim zones of clinopyroxene phenocrysts formed during a few days to weeks. Remarkably, this range of time scales holds for the entire eruption, because neither the width of the rim zones nor their transition to the core region vary systematically between our samples, whose emplacement dates cover a period of about 2 months (Table 1). Indeed, the sharpest rim zone boundary and therefore the shortest diffusion time scale is for profile Cpx6-p1 in sample SD04 from the late stage of the eruption. These observations have the important implication that the rim zones do not reflect an event precursory to the 2014–2015 eruption, but formed sequentially during the course of the eruption within the uppermost mantle, at pressures indicated by our barometric data.
We envisage two plausible scenarios for undercooling and rapid growth of clinopyroxene rim zones at depth: cooling of the host melt due to mixing with a cooler and more evolved magma, or rapid undercooling due to H2O loss and consequent rise in liquidus temperature (Sparks and Pinkerton, 1978). Magma mixing is a common process for many basaltic volcanoes and may trigger eruptions, as is indicated by petrological studies (e.g., Klügel and Klein, 2006; Kahl et al., 2011). However, the rim zonations of tephrite-hosted clinopyroxenes are not consistent with growth in a more evolved melt. Such a melt would be higher in SiO2, Al2O3 and alkalies, and lower in Mg# and CaO, as is indicated by the liquid line of descent (cf. Hildner et al., 2012). This is at odds with the observed compositional changes in most rim zones, and with the contrasting changes in Mg# at the rims of the same crystal (Cpx6 in sample SD04; Figure 7), which are better explained by sector zonations. We conclude, instead, that the rim zones reflect an episode of significant H2O loss from the melt driving increased crystallization. This could be caused by rapid rise of the magma to another storage level in the mantle or within a convecting reservoir, followed by closed-system degassing, which more effectively removes H2O from a melt than open-system degassing (Métrich and Wallace, 2008). Alternatively, rapid H2O loss could occur by CO2 flushing of the magma reservoir, when the melt re-equilibrates with large amounts of a CO2-rich fluid phase released from another melt at deeper levels (Métrich and Wallace, 2008; Caricchi et al., 2018). This scenario is not unlikely because highly alkalic Si-undersaturated melts as at Fogo can dissolve >1 wt% of CO2 at upper mantle conditions (Shishkina et al., 2014; Longpré et al., 2017), and begin to exsolve a carbonic fluid at pressures in excess of 1 GPa as is indicated by fluid inclusion data (Hansteen et al., 1991). The assumption of high CO2 contents in primary Fogo melts is also consistent with the occurrence of carbonatites on Fogo and adjacent Cape Verde islands (e.g., Hoernle et al., 2002).
A distinction between closed-system degassing and CO2 flushing as major cause for the inferred H2O loss would require H2O-CO2 data from melt inclusions (Métrich and Wallace, 2008), which are not available. But our data for clinopyroxene rim zones require either process to occur during the ongoing eruption, at a stage where the continuous flux of magma involved movement within a limited pressure range, around 600 MPa, for a few days to weeks. Such near-isobaric magma movement during eruption can occur within a complex storage system (Klügel et al., 2015). This suggests the presence of a deeper storage level from where the eruption was fed, as is probably reflected by the higher pressures obtained for tephrite clinopyroxene cores than for the rims (Mata et al., 2017; Figure 10).
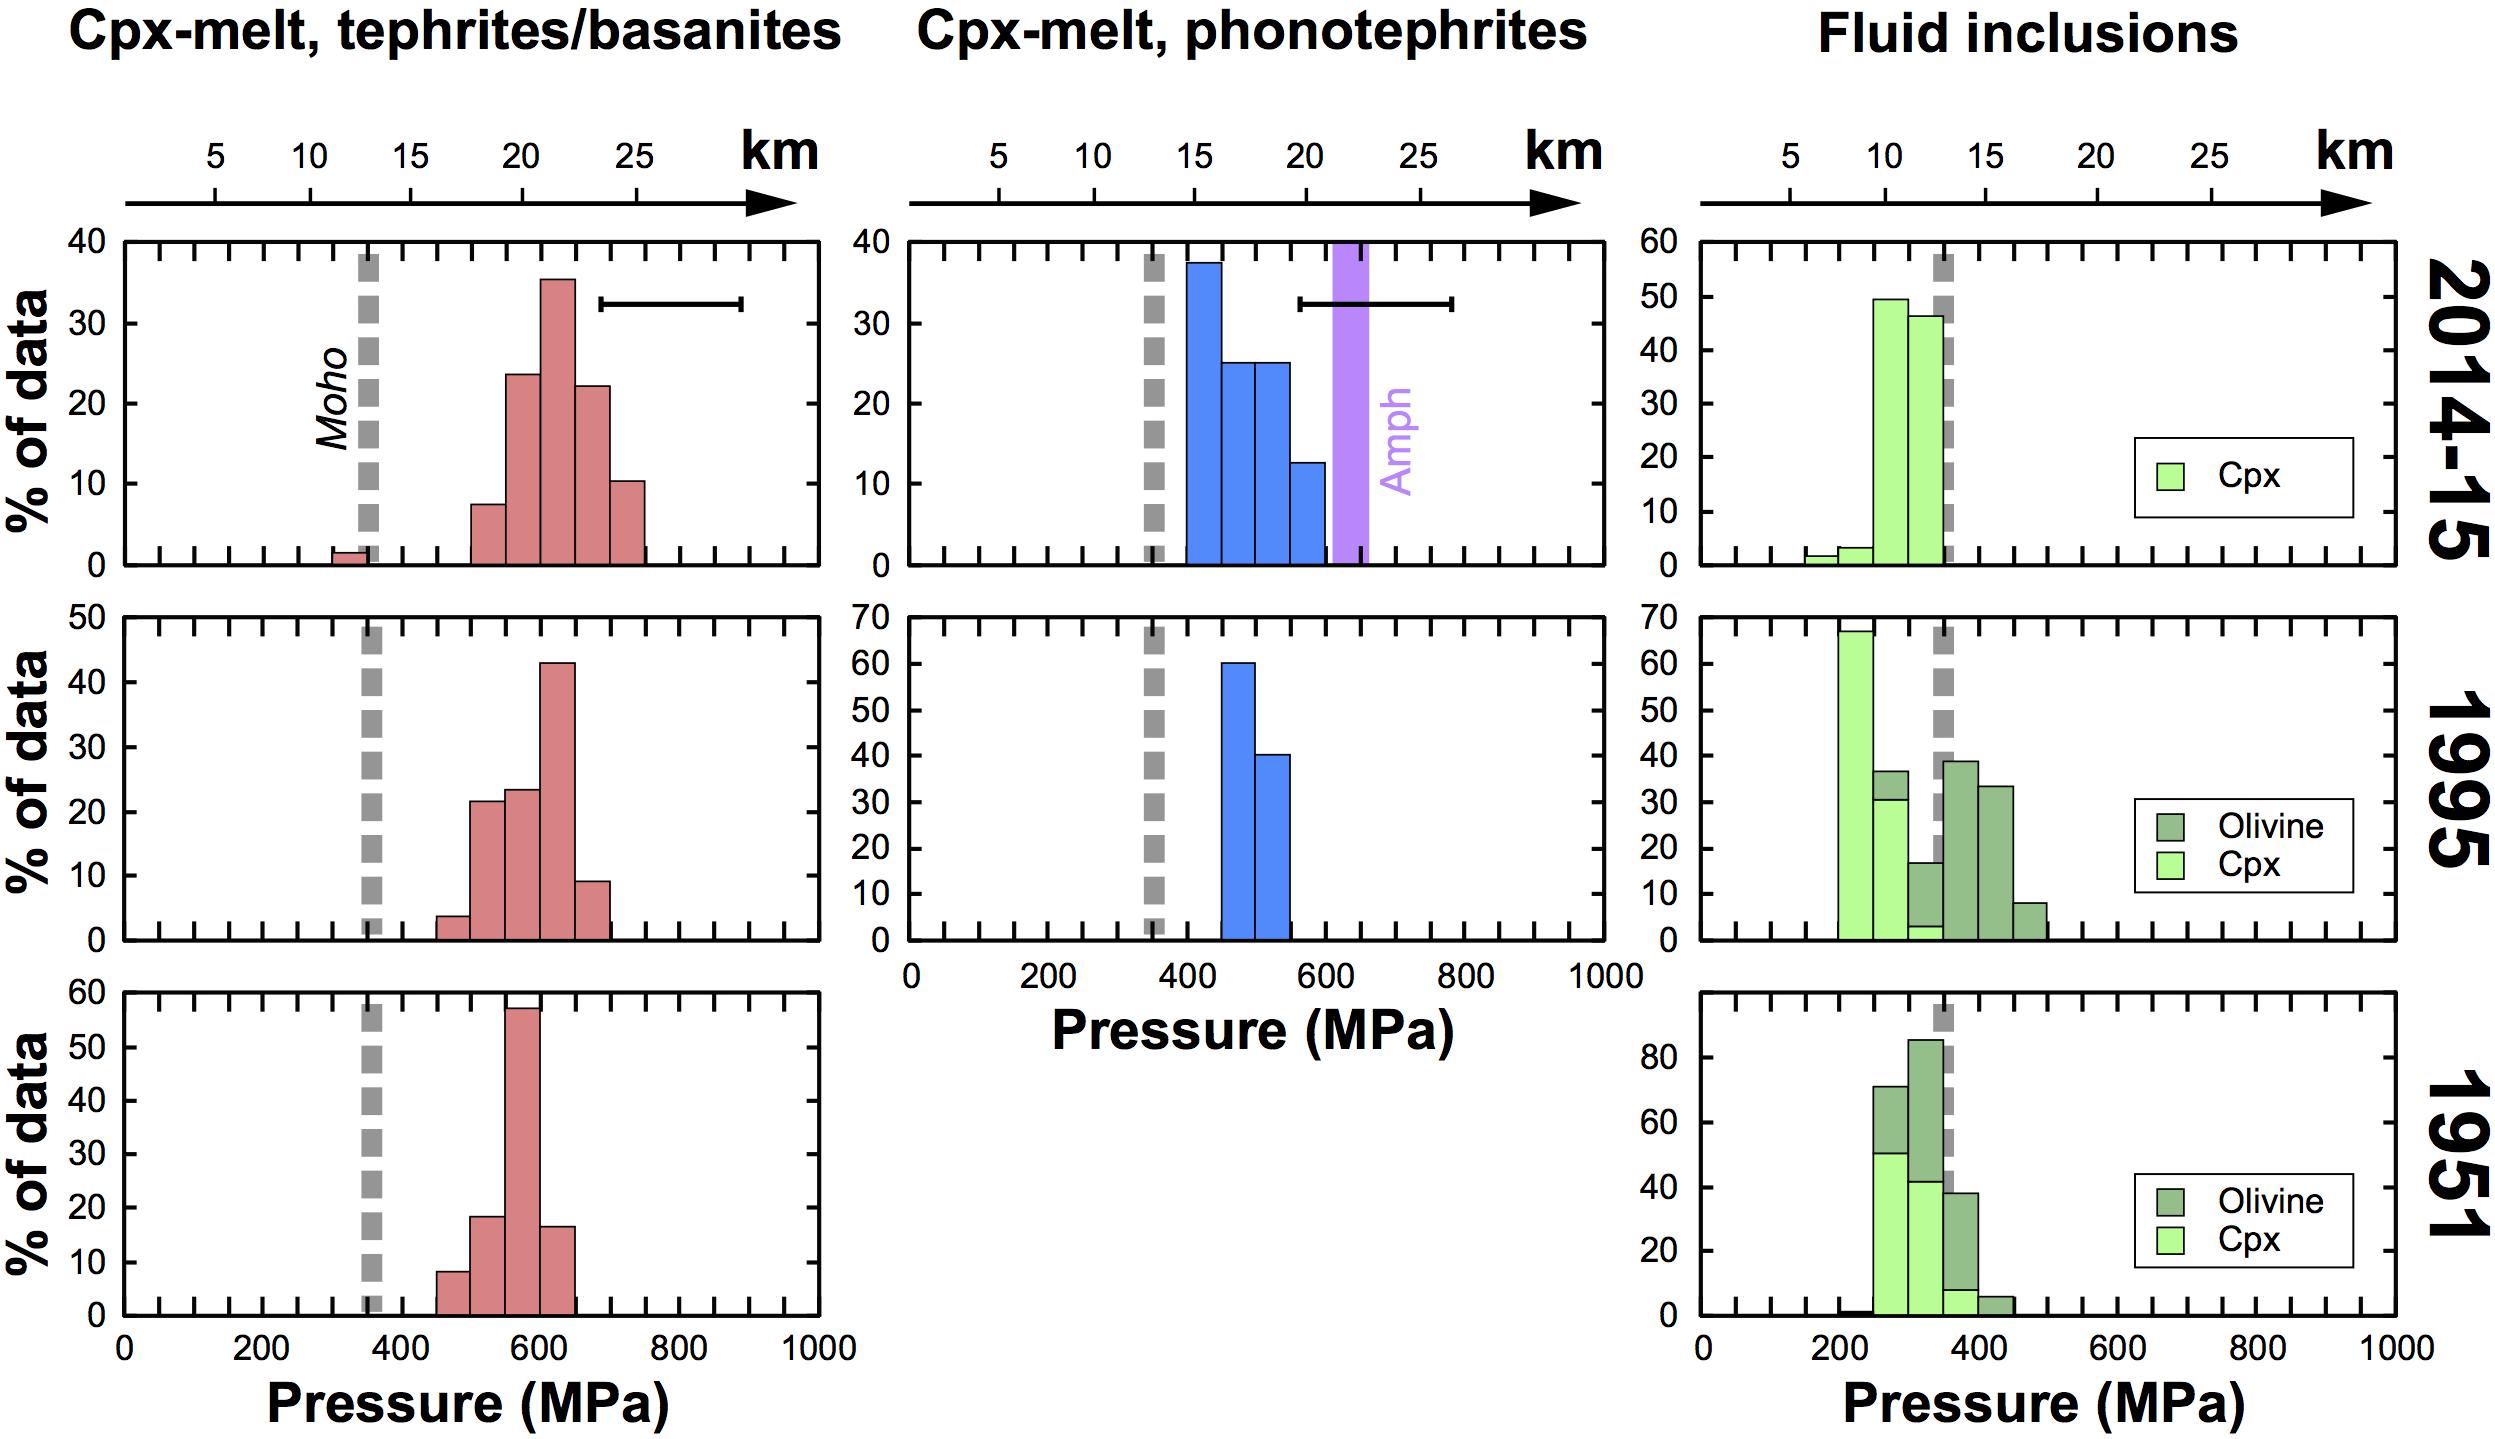
Figure 10. Overview of barometric data for the 2014–2015 eruption (first row), and comparison to data for the preceding 1995 and 1951 eruptions (second and third row; after Hildner et al., 2011, 2012). The diagrams for clinopyroxene-melt barometry display data for phenocryst rims, using the Putirka et al. (2003) calibration and filter 1 as equilibrium test. Shown are the average pressures calculated for each crystal, rather than single analyzed points as in Figure 5. Horizontal bars mark the data range for clinopyroxene cores from Mata et al. (2017), and vertical bar labeled “Amph” indicates the pressure range obtained for amphiboles in phonotephrites after Ridolfi et al. (2012). During the 1951 eruption no phonotephrite was erupted. The depth of the Moho (dashed thick lines) and the conversion of pressure to depth are based on the crustal model of Pim et al. (2008).
Implications of Olivine Rim Zonations
Our data for olivine phenocrysts in lava flow samples reveal that forsterite contents at the rims are too low as to be in equilibrium with the groundmass, and that the rim zoning profiles are shorter in lava flow samples collected near the vents than in those collected far from the vents. These observations imply formation of the olivine rim zonations mainly during lava flow emplacement and cooling after eruption. As the Mg# of the melt decreased due to growth of ferromagnesian crystals, normal zonations developed by a combination of Fe-Mg interdiffusion within the olivine crystals and their growth. The disequilibrium between olivine rims and groundmass likely reflects the preservation of compositional heterogeneities within the advancing lava. As melt transport in the lava flow was not sufficiently turbulent for homogenization to occur, Fe-Mg equilibrium was maintained only locally at the olivine-melt interface, but not at some millimeters distance where our groundmass analyses were carried out. For the quenched lapilli sample SD04, in contrast, there was no time for post-eruptive crystal growth, and olivine rims are close to Fe-Mg equilibrium with the glassy matrix.
The length of zoning profiles at olivine rims from samples SD10 and SD13 (∼4–14 μm) are remarkably similar to those from lava flow samples from the 1995 Fogo eruption that were also collected near the vent (Hildner et al., 2011). These authors analyzed the zonations using a simple semi-infinite slab model for one-dimensional Fe-Mg diffusion, assuming constant olivine composition for time t < 0 and instantaneous change to different but constant composition at the olivine-melt interface at t = 0; olivine growth or dissolution were neglected. We applied the same diffusion model to olivines from the 2014–2015 lavas and obtained good agreement between analyzed and modeled rim zonations (Supplementary Figure S1 and Supplementary Table S8). Hildner et al. (2011) concluded that the zonations had developed in less than half a day if temperature was fixed at 1100°C. In a slowly cooling lava flow, however, diffusion rates gradually decrease and inferred time scales increase. If we assume a constant DFe–Mg for a putative mean temperature of 1000 °C as crude approximation, we obtain a value of 2.2 × 10⁻¹⁷ m2s–1 for diffusion along [001] (Dohmen and Chakraborty, 2007). This would increase the time scale of Hildner et al. (2011), who used a value of 1.1 × 10⁻¹⁶ m2s–1, by a factor of 5. We suggest, therefore, that the zoning profiles from samples SD10 and SD13 developed within 2–3 days during lava flow emplacement and cooling. For samples SD16 and SD21 collected from breakout lobes far from the vents (Figure 1C), zoning profiles in olivines are broadly twice as long, resulting in a time scale on the order of 1–2 weeks. This is consistent with the time interval between the rapid advance of the main flow lobe in the last week of November and its inflation in the first few days of December, and the subsequent formation of the Bangaeira breakout lobe, mainly in the period between 7 and 16 December (Figure 1C and Table 1.
The very short zoning profiles in sample SD04 (<3 μm) have implications for the speed of magma ascent during the phase of intense strombolian activity in January 2015. When applying the same diffusion model using a temperature of 1140°C as derived from our thermometry, the zonations yield a time scale of <3 h for concomitant growth and diffusive Fe-Mg exchange at olivine rims; for profile directions other than [001] the time scale increases to < 12 h owing to diffusion anisotropy (cf. Dohmen and Chakraborty, 2007). Growth and diffusion are both a consequence of intense H2O degassing of the ascending magma at shallow levels, because this results in increasing liquidus temperature, increasing degree of undercooling, increasing crystal nucleation and growth, and decreasing melt Mg# (Sparks and Pinkerton, 1978). Our data thus suggest a magma transit time of less than 3–12 h from the final storage level to the surface for the period of intense strombolian activity represented by this sample.
Pressures Derived From Fluid Inclusion Barometry
The clustering of pressures obtained by fluid inclusion barometry is commonly attributed to storage or temporary residence of magma at a discrete level, where formation and/or re-equilibration of inclusions occur (e.g., Roedder, 1983; Hansteen et al., 1998; Zanon et al., 2003; Frezzotti and Peccerillo, 2004; Hansteen and Klügel, 2008; Zanon, 2015). Most pressures derived from CO2-dominated fluid inclusions in the 2014–2015 tephrites are in the range 240–340 MPa (Figure 8B), well below the range indicated by clinopyroxene-melt barometry. This difference is partly due to post-entrapment processes, in particular diffusive H2O loss and volumetric re-equilibration, which reduce inclusion densities (Roedder, 1984; Bodnar, 2003). The CO2-dominated fluid inclusions from Fogo should have contained significant H2O upon trapping, a part of which may have become lost by rapid hydrogen diffusion when the host crystal re-equilibrated with the degassing host melt (Mackwell and Kohlstedt, 1990; Bakker and Jansen, 1991; Lloyd et al., 2016). We assess the impact of this effect by assuming complete loss of 10 mol% of H2O in the trapped fluid, an amount estimated from a degassing model for basanite melt at about 500 MPa (Dixon et al., 1997). Adding this amount back to the inclusions increases densities by a factor of 1.045 (Hansteen and Klügel, 2008) and changes the main pressure range of our data to 280–410 MPa, calculated using the Kerrick and Jacobs (1981) equation of state for the H2O-CO2 system. It is, however, possible that the trapped fluid had contained far less H2O if CO2 flushing of the magma had occurred from a deep source. In this case H2O loss during magma ascent would be less significant, and fluid inclusion compositions would closely reflect trapping conditions.
Volumetric re-equilibration of fluid inclusions can occur by plastic deformation (stretching) of the host crystal, in response to increasing inclusion overpressure during magma ascent (Bodnar, 2003). Stretching is fast at magmatic temperatures; for example, decompression by 1000 MPa within two days can lower the densities of olivine-hosted CO2 inclusions by around 10% (Wanamaker and Evans, 1989). To our knowledge, no such data exist for clinopyroxene, but fluid inclusion data suggest similar or larger degrees of re-equilibration than for olivine (Klügel et al., 2000). The effect of stretching is not optically evident but can be recognized by density distributions (Hansteen and Klügel, 2008), as is exemplified by our data. The highest CO2 inclusion densities were obtained for quickly quenched lapilli (sample SD04), with a maximum at around 0.65 g/cm3 and a tailing toward lower values, whereas inclusions from lava flow samples have lower densities with a maximum around 0.56–0.60 g/cm3 (Figure 8). This difference suggests that considerable re-equilibration occurred during the residence time of a sample in the flowing lava, and underlines the advantage of using glassy tephra for fluid inclusion studies. The best pressure estimate for fluid inclusion trapping or re-equilibration is thus based on the highest densities for sample SD04, indicating minimum pressures of 320–340 MPa, i.e., within the lowermost crust (Figure 10).
The pressures indicated by fluid inclusions likely reflect temporary residence of magma near the Moho boundary, as it moves from a mantle reservoir to the surface during eruption. For short residence times on the order of hours to days, this pending level will not necessarily be reflected by the more sluggish mineral-based barometers. The result is a bimodal pressure distribution (Figure 10), as is commonly observed (Klügel et al., 2015). This explanation was corroborated by combined seismic and petrological observations from the 2011–2012 eruption at El Hierro, Canary Islands (Longpré et al., 2014). The El Hierro eruption also demonstrated that a section of lateral magma flow is a possible explanation for temporary magma residence at a limited pressure range during an eruption (López et al., 2012; Martí et al., 2013). We suggest that the fluid inclusion data for the 2014–2015 Fogo eruption reflect short-term “stalling” (i.e., near-isobaric magma movement) of the ascending magma within a complex accumulation zone in the lowermost crust, following previous movement within the uppermost mantle as discussed above.
Model for Magma Plumbing During the 2014–2015 Eruption
Based on the combined data we propose a model for magma storage and transport during the 2014–2015 eruption of Fogo (Figure 11). The main storage level where the tephrite magma had accumulated before eruption is probably reflected by barometric data for the cores of normally zoned or unzoned clinopyroxene phenocrysts, indicating 700–900 MPa (24–30 km depth b.s.l.), within the uppermost mantle (Mata et al., 2017). During the course of the eruption the ascending magma picked up crystal mush and cumulate fragments from the walls of the reservoir system, as is indicated by abundant crystal aggregates (microxenoliths) and complex and/or patchy zonations of many clinopyroxene phenocryst cores. At pressures around 600 MPa (21 km depth), the flowing magma passed through a complex storage region, possibly an interconnected network of magma pockets and dikes/sills, where it moved or stayed at nearly isobaric conditions for a few days to weeks (Figure 11). Here the observed rim zones grew around clinopyroxene crystals at increased growth rates, expressed by pronounced sector zonations. The reason for undercooling was probably significant H2O loss of the magma, either by closed-system degassing following decompression, or by flushing with a CO2-rich fluid phase released from a melt at deeper levels.
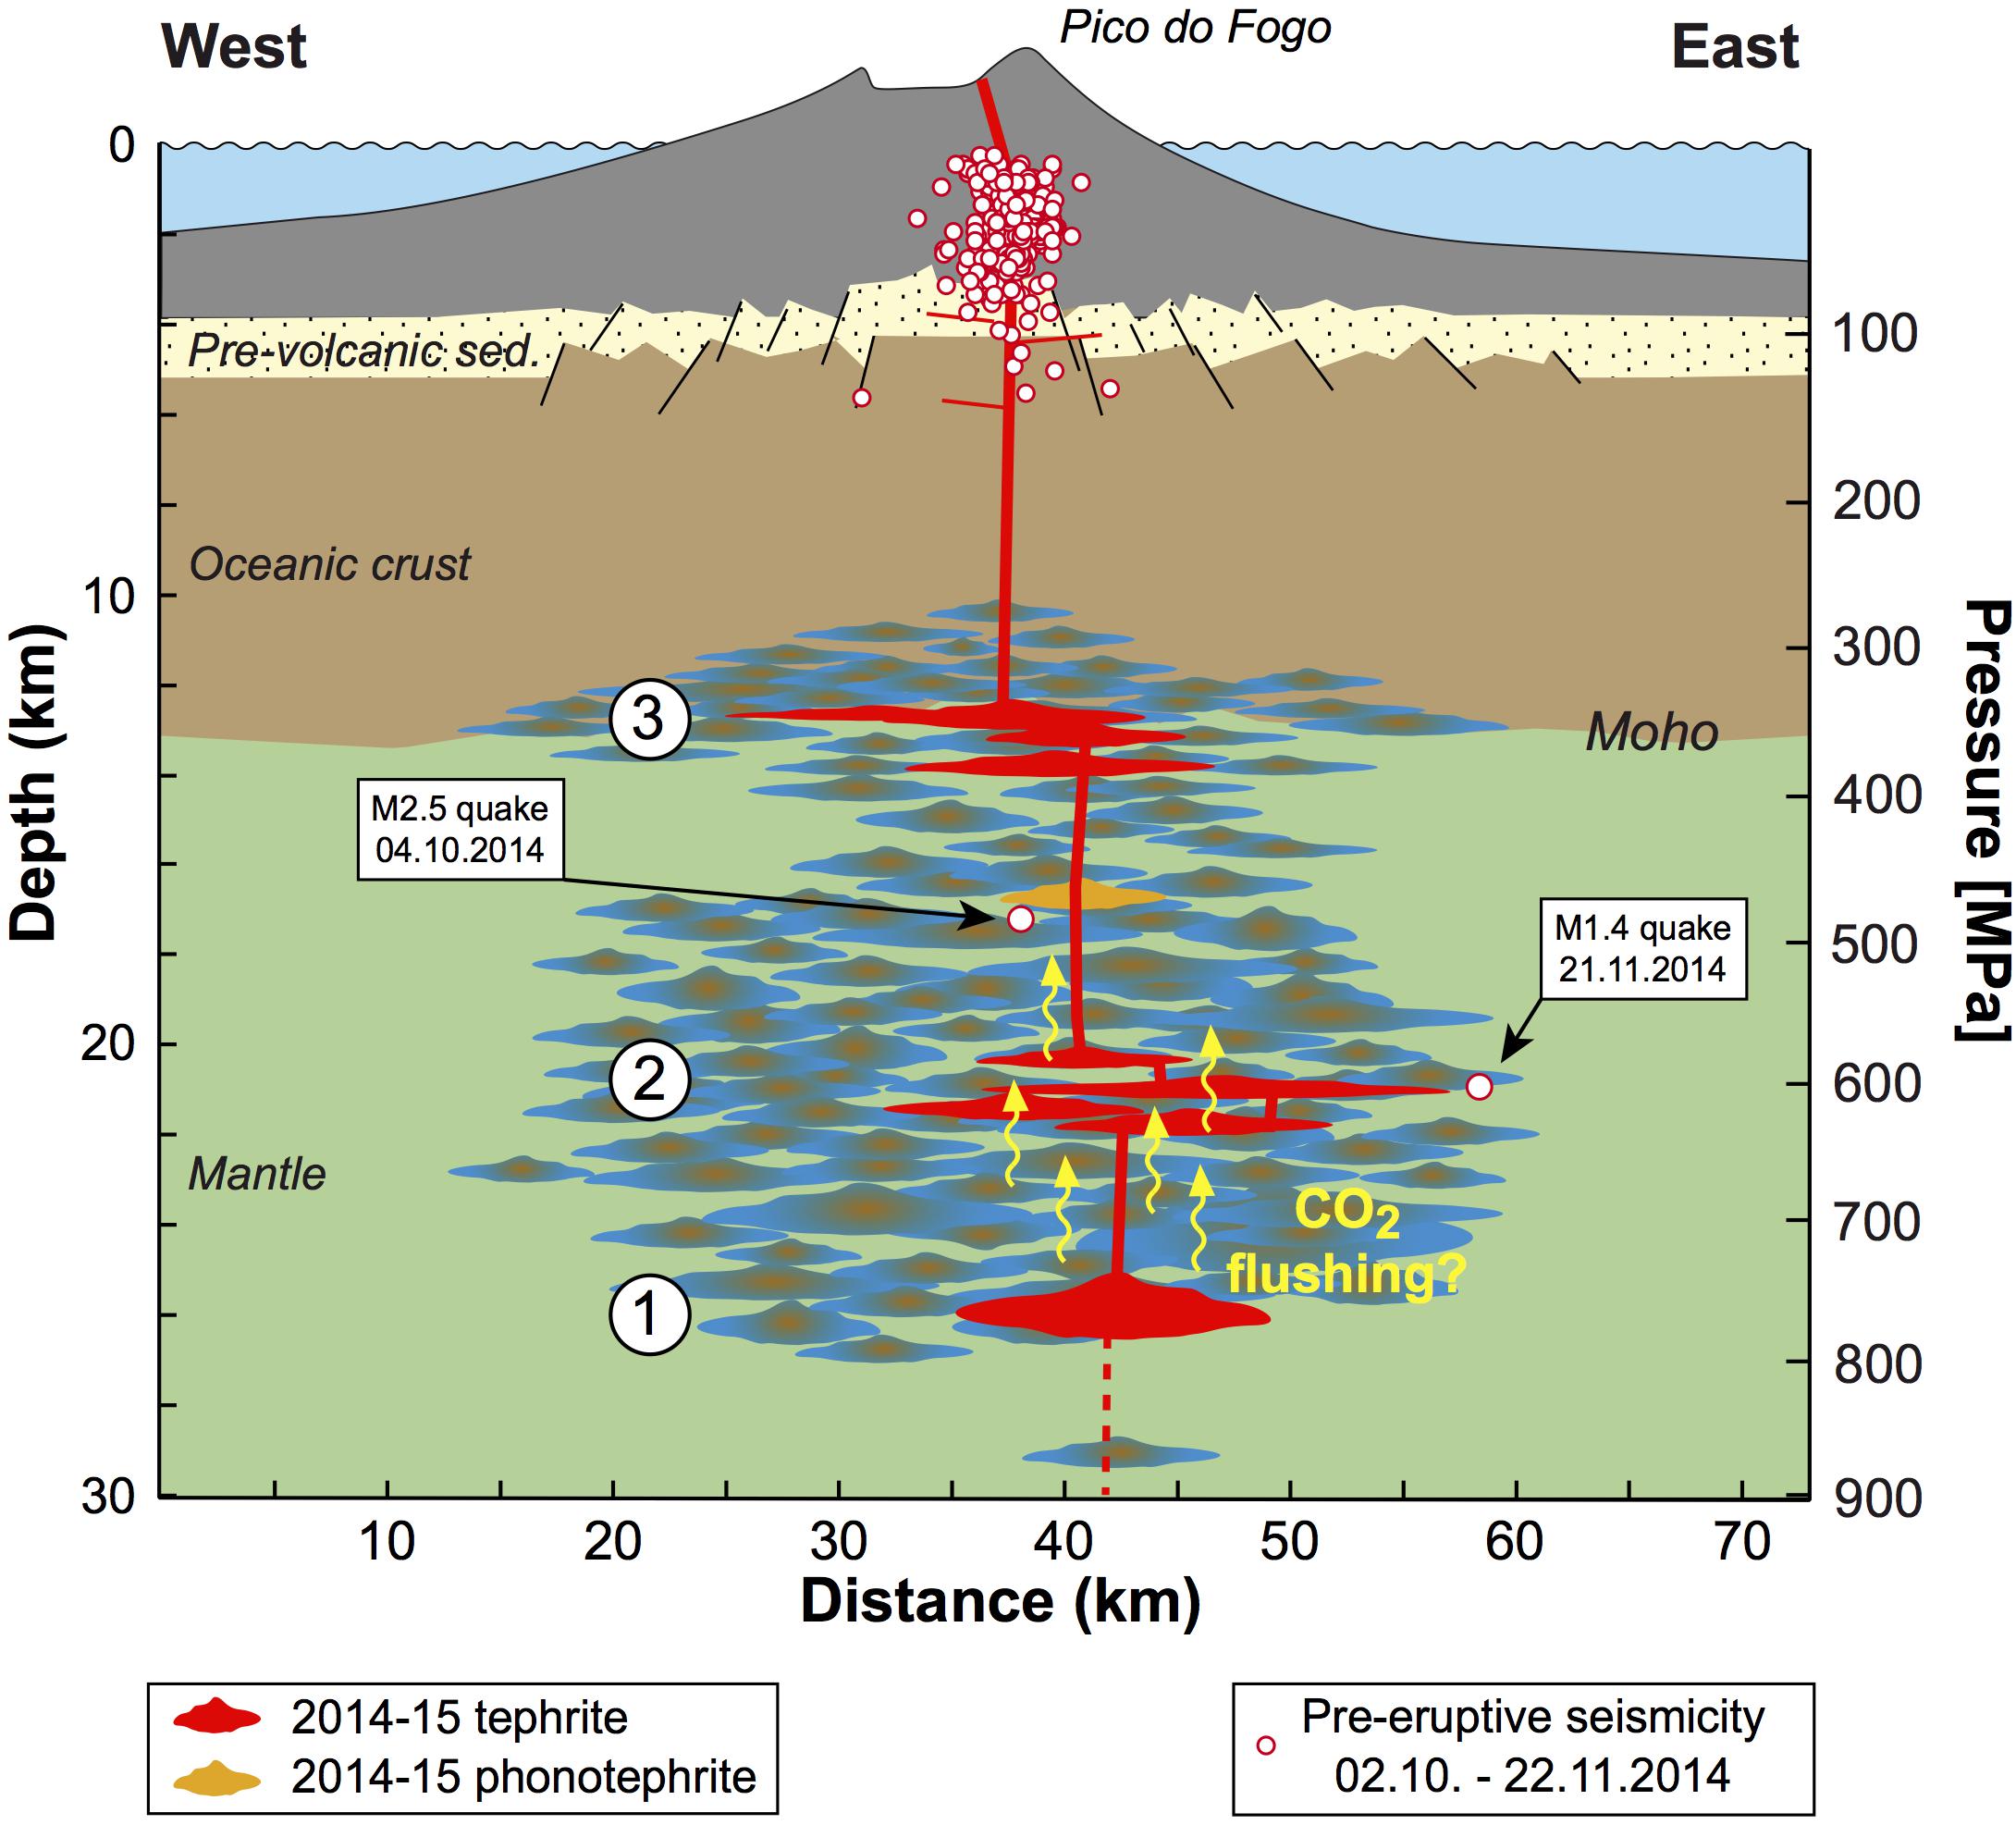
Figure 11. Cross-section of Fogo (2x vertical exaggeration) with lithological boundaries after the crustal model of Pim et al. (2008), showing the inferred magma plumbing and seismic precursors of the 2014–2015 eruption. Magma storage in the uppermost mantle is envisaged as a complex system with interconnected small pockets or compartments, in which batches of melt can evolve separately. This allows compositionally diverse magmas to be discharged in a single eruption (Klügel et al., 2005; Gudmundsson, 2012; Hildner et al., 2012). Major magma storage levels for the 2014–2015 magmas are indicated: (1) storage and crystal fractionation before eruption as indicated by clinopyroxene cores; (2) temporary stalling (near-isobaric magma flow) in a complex storage zone as indicated by clinopyroxene rims; (3) temporary stalling in a magma accumulation zone near the Moho as indicated by fluid inclusions.
During its passage through the storage system in the uppermost mantle, the magma encountered a small pocket of phonotephritic magma, probably a remnant from an earlier eruption or intrusive event. Small volumes of the phonotephrite ascended and were erupted alongside with the tephrite during some phases of the eruption (Figure 6). This was accompanied by mingling and limited mixing, as is exemplified by samples SD08 (mingled bomb) and SD06 (transitional composition). The rims of phonotephrite-hosted clinopyroxenes have a similar compositional variability as tephrite-hosted ones, which suggests formation at similar conditions. This coincidence may lend some support to the idea of CO2 flushing to cause H2O loss in different magma pockets. The time between H2O loss and phonotephrite eruption was too short to form thick opacite reaction rims around amphiboles (Figure 2F). In contrast, amphiboles in the phonotephrite samples investigated by Mata et al. (2017) show thick reaction rims that were inferred to have grown in > 1 month.
Complex near-isobaric magma movement in the mantle storage system at around 600 MPa, combined with varying flow rates and local mixing with earlier remnant magmas, may explain the mild irregular variations in melt composition during the course of eruption (Table 2). It may also explain the variations of barometric results between different samples (Figure 6B), as these depend not only on pressure but also on melt composition and on crystal growth rates as discussed above. The magma flow rate might have had an influence on the barometric results, but deciphering causal relationship would require barometric data for more samples as well as data for the magma flux over time.
As the magma continued to rise, it entered another “stalling” level around the Moho to lowermost crust. This horizon has been denoted as magma accumulation zone (Klügel et al., 2015) and is reflected by density distributions of fluid inclusions, but not by clinopyroxene barometry. The magma thus remained at this level for not very long, probably no more than a day. After leaving this zone, final ascent to the surface was fast and occurred in less than 3–12 h in the case of sample SD04 from the late phase of the eruption, as was deduced from olivine rim zonations. There is no petrological indication for another horizon between the lower crust and the surface that would slow down the ascending magma.
Implications for Magma Plumbing at Fogo
A comparison of the barometric data for the 2014–2015, 1995, and 1951 Fogo eruptions reveals a consistent picture of magma storage and transport (Figure 10). Clinopyroxene-melt barometry on phenocryst rims and groundmass in tephrites yields very similar pressure distributions for all three eruptions with maxima around 550–700 MPa. The small differences between eruptions may reflect different methods to determine melt compositions: the present study applied in-situ groundmass analyses by LA-ICP-MS, whereas data for the 1995 and 1951 eruptions used glass analyses and whole-rock compositions corrected for phenocryst content (Hildner et al., 2011, 2012). The pressures document last equilibration between clinopyroxene phenocrysts and host melt at about 19–24 km depth, in a complex storage system in the uppermost mantle. This is not necessarily the depth at which the bulk of the magma accumulates before eruption, because data for the 2014–2015 eruption suggest prior storage at deeper levels (Mata et al., 2017). Magma movement into or from deeper reservoirs was probably the cause for an isolated cluster of >20 earthquakes with focal depths between approximately 38 and 44 km, that were recorded on 15 August 2016 (Leva et al., 2019). The presence of magma reservoirs at such great depths is, however, not reflected by existing mineral barometry data from Fogo.
Phonotephrites appear to form at similar or slightly shallower levels than tephrites and basanites, as is suggested by clinopyroxene-melt barometry data for the 1995 and 2014–2015 eruptions (Figure 10). It appears common that small amounts of phonotephrite are discharged at the beginning and/or end of an eruption (Munhá et al., 1997; Hildner et al., 2011). The phonotephrites are probably derived by crystal fractionation from magmas left in the mantle storage system after an eruption, and are pushed ahead by the newly arriving magma. Mixing between the different magmas is limited, however, as only few samples have intermediate compositions.
Another complex magma accumulation zone common to recent Fogo eruptions appears to exist at about 10–14 km depth, around the Moho. This is inferred from fluid inclusion barometry on phenocrysts from the 2014–2015 and 1951 tephrites, yielding overlapping pressures around 250–400 MPa (Figure 10). Inclusions in phenocrysts from the 1995 eruption indicate a more widespread pressure distribution, which can be explained by two distinct host lava types (tephrites/basanites and phonotephrites) for the investigated phenocrysts. Magmas are believed to remain at this depth range for a short time, on the order of a day, before rapid final ascent to the surface continues. Such behavior could be explained by lateral magma movement around Moho depths, as was the case for the 2011–2012 El Hierro eruption (López et al., 2012; Martí et al., 2013; Longpré et al., 2014), but for Fogo no such evidence exists.
The available petrological and geodetic data demonstrate that crustal magma storage is subordinate at Fogo. This does not rule out that sills and dikes in addition to the main conduit intrude the crust and volcanic edifice at various levels before and during an eruption. But the volume of individual intrusions is limited, because no island-wide deformation was recorded during the pre-eruptive and co-eruptive phases of the 1995 and 2014–2015 eruptions (Amelung and Day, 2002; González et al., 2015). Neither is there a crustal magma reservoir, nor has there been one in the recent past of the island (Hildner et al., 2012).
Comparison With Seismic Monitoring Data
Remarkably, the seismic precursors of the 2014–2015 eruption were much shallower than the depths inferred for magma storage (Figure 11). The only exceptions are a single M2.5 event at ca. 17 km depth, which was considered to be the first precursor heralding the ascent of new magma, and a M1.4 event at ca. 21 km depth. These depths coincide very well with our clinopyroxene-melt barometry data. Further movement of the magma through newly formed dikes occurred almost aseismically, until it reached the sediment layer beneath Fogo and the volcanic edifice itself. Dike emplacement resulted in a seismic swarm of <300 small events during 6 days before eruption. The situation at Fogo in 2014 was thus very different from the 2011–2012 eruption at El Hierro, where precursory unrest involved >10,000 seismic events located within the lower crust to Moho, as well as island-wide surface deformation and increased CO2, H2S and radon emissions, over 3 months (López et al., 2012; Pérez et al., 2012; Martí et al., 2013; González et al., 2015). This difference in precursory unrest is likely related to the much longer recurrence intervals at El Hierro (1–2 kyrs; Carracedo et al., 2001) compared to Fogo (around 20 years; Day et al., 2000), resulting in a different thermal state of the crust beneath both islands. In addition, the volume erupted in 2011–2012 at El Hierro (330 × 106 m3; Rivera et al., 2013) was considerably larger than at Fogo (44 × 106 m3; Richter et al., 2016), implying a much greater deformation of the host rocks around the magma reservoirs.
Conclusion
Our petrological study of samples from the Fogo 2014–2015 eruption yields the following conclusions:
• The strategy of sampling a stratigraphically controlled sequence was beneficial and revealed some variation in melt composition during the course of the eruption.
• Clinopyroxene-melt thermobarometry was successfully applied to phenocryst rim and host groundmass pairs, even though the rims are sector-zoned due to rapid growth. Mineral-melt pairs had to be filtered using appropriate equilibrium criteria.
• Rim zones around clinopyroxene phenocrysts formed during the ongoing eruption, within a few days to weeks, as a consequence of H2O loss from the melt. This could have been caused by either degassing following a rise of the magma, or CO2 flushing by a carbonic fluid phase released at deeper levels. The rim zones do not reflect an event precursory to the 2014–2015 eruption.
• Our barometric data suggest that most clinopyroxene rim zones formed at around 600 MPa pressure, during a phase of near-isobaric magma movement through a complex storage system within the uppermost mantle. The magma entered this system after having accumulated at deeper levels before eruption.
• CO2-dominated fluid inclusions in clinopyroxene phenocrysts document short stalling (on the order of a day) of the ascending magma within the lowermost crust to Moho.
• Normal rim zonations of olivine phenocrysts formed mainly during lava flow emplacement and cooling after eruption. Olivine zonations are very short in quenched samples, suggesting a magma transit time of less than 3–12 h from the last storage level to the surface.
Data Availability Statement
All datasets generated for this study are included in the article/Supplementary Material.
Author Contributions
SD developed the sampling strategy, selected sampling sites, and collected the samples. BF collected and processed the seismic data. AK and MS analyzed the samples with electron microprobe and LA-ICP-MS. MS carried out microthermometry. AK led the petrological modeling and the writing of the manuscript. All authors were actively involved in the discussion, interpretation of the data, and participated in the preparation of the manuscript.
Funding
The analyses at Bremen University were carried out during the M.Sc. thesis of MS and were supported by department funds and by the German Research Foundation (DFG Grant KL1313/9-2, Programmpauschale).
Conflict of Interest
The authors declare that the research was conducted in the absence of any commercial or financial relationships that could be construed as a potential conflict of interest.
Acknowledgments
We thank B. Hirn and F. Ferrucci (Open University, United Kingdom) for processing the Operational Land Imager (OLI) and Earth Observing-1 Advanced Land Imager (ALI) data, and S. Sopke and P. Monien (Universität Bremen) for support during the analytical work. We appreciate the thoughtful and constructive reviews by SM and TK, and the comments by the associate editor, TU, which clarified some aspects and improved the manuscript.
Supplementary Material
The Supplementary Material for this article can be found online at: https://www.frontiersin.org/articles/10.3389/feart.2020.00157/full#supplementary-material
Downloadable Excel versions of Tables 1–3 are available as Supplementary Material S10–S12.
References
Amelung, F., and Day, S. (2002). InSAR observations of the 1995 Fogo, Cape Verde, eruption: implications for the effects of collapse events upon island volcanoes. Geophys. Res. Lett. 29, 41–47. doi: 10.1029/2001GL013760
Andersen, T., and Neumann, E. R. (2001). Fluid inclusions in mantle xenoliths. Lithos 55, 301–320. doi: 10.1016/s0024-4937(00)00049-9
Bakker, R. J., and Jansen, J. B. H. (1991). Experimental post-entrapment water loss from synthetic CO2-H2O inclusions in natural quartz. Geochim. Cosmochim. Acta 55, 2215–2230. doi: 10.1016/0016-7037(91)90098-p
Barker, A., Troll, V., Carracedo, J., and Nicholls, P. (2015). The magma plumbing system for the 1971 Teneguía eruption on La Palma, Canary Islands. Contribut. Mineral. Petrol. 170, 1–21. doi: 10.1007/s00410-015-1207-7
Bodnar, R. J. (2003). “Reequilibration of fluid inclusions,” in Fluid Inclusions: Analysis and Interpretation, Short Course Series, eds I. Samson, A. Anderson, and D. Marshall (Vancouver: Mineralogical Association of Canada), 213–231.
Brophy, J. G., Whittington, C. S., and Park, Y. R. (1999). Sector-zoned augite megacrysts in Aleutian high alumina basalts: implications for the conditions of basalt crystallization and the generation of calc-alkaline series magmas. Contribut. Mineral. Petrol. 135, 277–290. doi: 10.1007/s004100050512
Cappello, A., Ganci, G., Calvari, S., Pérez, N. M., Hernández, P. A., Silva, S. V., et al. (2016). Lava flow hazard modeling during the 2014-2015 Fogo eruption, Cape Verde. J. Geophys. Res. Solid Earth 121, 2290–2303. doi: 10.1002/2015jb012666
Caricchi, L., Sheldrake, T. E., and Blundy, J. (2018). Modulation of magmatic processes by CO2 flushing. Earth Planet. Sci. Lett. 491, 160–171. doi: 10.1016/j.epsl.2018.03.042
Carracedo, J. C., Badiola, E. R., Guillou, H., de La Nuez, J., and Pérez Torrado, F. J. (2001). Geology and volcanology of la palma and el hierro, western Canaries. Estud. Geol. 57, 175–273.
Cashman, K. V., Sparks, R. S. J., and Blundy, J. D. (2017). Vertically extensive and unstable magmatic systems: a unified view of igneous processes. Science 355:eaag3055. doi: 10.1126/science.aag3055
Costa, F., Dohmen, R., and Chakraborty, S. (2008). Time scales of magmatic processes from modeling the zoning patterns of crystals. Rev. Mineral. Geochem. 69, 545–594. doi: 10.1515/9781501508486-015
Costa, F., and Morgan, D. (2011). “Time constraints from chemical equilibration in magmatic crystals,” in Timescales of Magmatic Processes: From Core to Atmosphere, eds A. Dosseto, S. P. Turner, and J. A. Van Orman (Hoboken, NJ: Blackwell Publishing Ltd), 125–159. doi: 10.1002/9781444328509.ch7
Crough, S. T. (1978). Thermal origin of mid-plate hot-spot swells. Geophys. J. R. Astron. Soc. 55, 451–469. doi: 10.1111/j.1365-246x.1978.tb04282.x
Crough, S. T. (1982). Geoid anomalies over the Cape Verde Rise. Mar. Geophys. Res. 5, 263–271. doi: 10.1007/BF00305564
Davidson, J. P., Morgan, D. J., Charlier, B. L. A., Harlou, R., and Hora, J. M. (2007). Microsampling and isotopic analysis of igneous rocks: implications for the study of magmatic systems. Ann. Rev. Earth Planet. Sci. 35, 273–311. doi: 10.1146/annurev.earth.35.031306.140211
Day, S. J., Carracedo, J. C., Guillou, H., Pais Pais, F. J., Badiola, E. R., Fonseca, J. F. B. D., et al. (2000). Comparison and cross-checking of historical, archaeological and geological evidence for the location and type of historical and sub-historical eruptions of multiple-vent oceanic island volcanoes. Geol. Soc. Lond. Spec. Public. 171:281. doi: 10.1144/GSL.SP.2000.171.01.21
Day, S. J., Heleno da Silva, S. I. N., and Fonseca, J. F. B. D. (1999). A past giant lateral collapse and present-day flank instability of Fogo, Cape Verde Islands. J. Volcanol. Geotherm. Res. 94, 191–218. doi: 10.1038/s41467-017-01256-2
Dixon, J. E., Clague, D. A., Wallace, P., and Poreda, R. (1997). Volatiles in alkalic basalts from the North Arch volcanic field, Hawaii: extensive degassing of deep submarine-erupted alkalic series lavas. J. Petrol. 38, 911–939. doi: 10.1093/petroj/38.7.911
Dohmen, R., and Chakraborty, S. (2007). Fe-Mg diffusion in olivine II: point defect chemistry, change of diffusion mechanisms and a model for calculation of diffusion coefficients in natural olivine. Phys. Chem. Miner. 34, 409–430. doi: 10.1007/s00269-007-0158-6
Doucelance, R., Escrig, S., Moreira, M., Gariépy, C., and Kurz, M. (2003). Pb-Sr-He isotope and trace element geochemistry of the Cape Verde Archipelago. Geochim. Cosmochim. Acta 67, 3717–3733. doi: 10.1016/s0016-7037(03)00161-3
Downes, M. J. (1974). Sector and oscillatory zoning in calcic augites from M. Etna, Sicily. Contribut. Mineral. Petrol. 47, 187–196. doi: 10.1007/BF00371538
Eisele, S., Reißig, S., Freundt, A., Kutterolf, S., Nürnberg, D., Wang, K. L., et al. (2015). Pleistocene to Holocene offshore tephrostratigraphy of highly explosive eruptions from the southwestern Cape Verde Archipelago. Mar. Geol. 369, 233–250. doi: 10.1016/j.margeo.2015.09.006
Escrig, S., Doucelance, R., Moreira, M., and Allégre, C. J. (2005). Os isotope systematics in Fogo Island: evidence for lower continental crust fragments under the Cape Verde Southern Islands. Chem. Geol. 219, 93–113. doi: 10.1016/j.chemgeo.2005.02.011
Faria, B., and Fonseca, J. F. B. D. (2014). Investigating volcanic hazard in Cape Verde Islands through geophysical monitoring: network description and first results. Nat. Hazards Earth Syst. Sci. 14, 485–499. doi: 10.5194/nhess-14-485-2014
Ferguson, A. K. (1973). On hour-glass sector zoning in clinopyroxene. Mineral. Magaz. 39, 321–325. doi: 10.1180/minmag.1973.039.303.08
Foeken, J. P. T., Day, S., and Stuart, F. M. (2009). Cosmogenic 3He exposure dating of the Quaternary basalts from Fogo, Cape Verdes: Implications for rift zone and magmatic reorganisation. Q. Geochronol. 4, 37–49. doi: 10.1016/j.quageo.2008.07.002
Frezzotti, M. L., Andersen, T., Neumann, E. R., and Simonsen, S. L. (2002). Carbonatite melt–CO2 fluid inclusions in mantle xenoliths from Tenerife, Canary Islands: a story of trapping, immiscibility and fluid–rock interaction in the upper mantle. Lithos 64, 77–96. doi: 10.1016/s0024-4937(02)00178-0
Frezzotti, M. L., and Peccerillo, A. (2004). Fluid inclusion and petrological studies elucidate reconstruction of magma conduits. EOS Trans. Am. Geophys. Union 85, 157–163. doi: 10.1029/2004eo160001
Frezzotti, M.-L., and Touret, J. L. R. (2014). CO2, carbonate-rich melts, and brines in the mantle. Geosci. Front. 5, 697–710. doi: 10.1016/j.gsf.2014.03.014
González, P. J., Bagnardi, M., Hooper, A. J., Larsen, Y., Marinkovic, P., Samsonov, S. V., et al. (2015). The 2014–2015 eruption of Fogo volcano: geodetic modeling of Sentinel-1 TOPS interferometry. Geophys. Res. Lett. 42, 9239–9246. doi: 10.1002/2015GL066003
Gudmundsson, A. (2012). Magma chambers: formation, local stresses, excess pressures, and compartments. J. Volcanol. Geotherm. Res. 23, 19–41. doi: 10.1016/j.jvolgeores.2012.05.015
Hammer, J., Jacob, S., Welsch, B., Hellebrand, E., and Sinton, J. (2016). Clinopyroxene in postshield Haleakala ankaramite: 1. efficacy of thermobarometry. Contribut. Mineral. Petrol. 171, 1–23. doi: 10.1007/s00410-015-1212-x
Hansteen, T. H., Andersen, T., Neumann, E. R., and Jelsma, H. (1991). Fluid and silicate glass inclusions in ultramafic and mafic xenoliths from Hierro, Canary Islands: implications for mantle metasomatism. Contribut. Mineral. Petrol. 107, 242–254. doi: 10.1007/bf00310710
Hansteen, T. H., and Klügel, A. (2008). “Fluid inclusion thermobarometry as a tracer for magmatic processes,” in Reviews in Mineralogy Vol. 69: Minerals, Inclusions And Volcanic Processes, eds K. D. Putirka and F. J. Tepley (Chantilly: Mineralogical Society of America), 143–177. doi: 10.2138/rmg.2008.69.5
Hansteen, T. H., Klügel, A., and Schmincke, H. U. (1998). Multi-stage magma ascent beneath the Canary Islands: evidence from fluid inclusions. Contribut. Mineral. Petrol. 132, 48–64. doi: 10.1007/s004100050404
Heleno da Silva, S., Day, S., and Fonseca, J. (1999). Fogo volcano, Cape Verde Islands: seismicity-derived constraints on the mechanism of the 1995 eruption. J. Volcanol. Geotherm. Res. 94, 219–231. doi: 10.1016/s0377-0273(99)00104-3
Hildner, E., Klügel, A., and Hansteen, T. H. (2012). Barometry of lavas from the 1951 eruption of Fogo, Cape Verde Islands: implications for historic and prehistoric magma plumbing systems. J. Volcanol. Geotherm. Res. 21, 73–90. doi: 10.1016/j.jvolgeores.2011.12.014
Hildner, E., Klügel, A., and Hauff, F. (2011). Magma storage and ascent during the 1995 eruption of Fogo, Cape Verde Archipelago. Contribut. Mineral. Petrol. 162, 751–772. doi: 10.1007/s00410-011-0623-6
Hoernle, K., Tilton, G., Le Bas, M. J., Duggen, S., and Garbe-Schönberg, D. (2002). Geochemistry of oceanic carbonatites compared with continental carbonatites: mantle recycling of oceanic crustal carbonatite. Contribut. Mineral. Petrol. 142, 520–542. doi: 10.1007/s004100100308
Holm, P. M., Grandvuinet, T., Friis, J., Wilson, R., Barker, A. K., and Plesner, S. (2008). An 40Ar-39Ar study of the Cape Verde hot spot: temporal evolution in a semistationary plate environment. J. Geophys. Res. 113:B08201.
Jarosewich, E., Gooley, R., and Husler, J. (1987). Chromium augite - a new microprobe reference sample. Geostand. Newslett. 11, 197–198. doi: 10.1111/j.1751-908x.1987.tb00027.x
Jarosewich, E. J., Nelen, J. A., and Norberg, J. A. (1980). Reference samples for electron microprobe analysis. Geostand. Newslett. 44, 257–258.
Jenkins, S. F., Day, S. J., Faria, B. V. E., and Fonseca, J. F. B. D. (2017). Damage from lava flows: insights from the 2014-2015 eruption of Fogo, Cape Verde. J. Appl. Volcanol. 6:6. doi: 10.1186/s13617-017-0057-6
Jochum, K. P., Willbold, M., Raczek, I., Stoll, B., and Herwig, K. (2005). Chemical Characterisation of the USGS Reference Glasses GSA-1G, GSC-1G, GSD-1G, GSE-1G, BCR-2G, BHVO-2G and BIR-1G Using EPMA, ID-TIMS, ID-ICP-MS and LA-ICP-MS. Geostand. Geoanalyt. Res. 29, 285–302. doi: 10.1111/j.1751-908x.2005.tb00901.x
Kahl, M., Chakraborty, S., Costa, F., and Pompilio, M. (2011). Dynamic plumbing system beneath volcanoes revealed by kinetic modeling, and the connection to monitoring data: an example from Mt. Etna. Earth Planet. Sci. Lett. 308, 11–22. doi: 10.1016/j.epsl.2011.05.008
Kahl, M., Chakraborty, S., Costa, F., Pompilio, M., Liuzzo, M., and Viccaro, M. (2013). Compositionally zoned crystals and real-time degassing data reveal changes in magma transfer dynamics during the 2006 summit eruptive episodes of Mt. Etna. Bull. Volcanol. 75:692. doi: 10.1007/s00445-013-0692-7
Kerrick, D. M., and Jacobs, G. K. (1981). A modified Redlich-Kwong equation for H2O, CO2 and H2O-CO2 mixtures at elevated temperatures and pressures. Am. J. Sci. 281, 735–767.
Klügel, A., Hoernle, K. A., Schmincke, H. U., and White, J. D. L. (2000). The chemically zoned 1949 eruption on La Palma (Canary Islands): petrologic evolution and magma supply dynamics of a rift-zone eruption. J. Geophys. Res. 105, 5997–6016. doi: 10.1029/1999jb900334
Klügel, A., Hansteen, T. H., and Galipp, K. (2005). Magma storage and underplating beneath Cumbre Vieja volcano, La Palma (Canary Islands). Earth Planet. Sci. Lett. 236, 211–226. doi: 10.1016/j.epsl.2005.04.006
Klügel, A., and Klein, F. (2006). Complex magma storage and ascent at embryonic submarine volcanoes from Madeira Archipelago. Geology 34, 337–340.
Klügel, A., Longpré, M.-A., García-Cañada, L., and Stix, J. (2015). Deep intrusions, lateral magma transport and related uplift at ocean island volcanoes. Earth Planet. Sci. Lett. 431, 140–149. doi: 10.1016/j.epsl.2015.09.031
Kokfelt, T. F. (1998). A Geochemical And Isotopic Study Of The Island Of Fogo, The Cape Verde Islands. Ph.D. thesis, University of Copenhagen, Copenhagen.
Kouchi, A., Sugawara, Y., Kashima, K., and Sunagawa, I. (1983). Laboratory growth of sector zoned clinopyroxenes in the system CaMgSi2O6-CaTiAl2O6. Contribut. Mineral. Petrol. 83, 177–184. doi: 10.1007/BF00373091
LeMaitre, R. W., Bateman, P., Dudek, A., Keller, J., Lameyre, J., Le Bas, M. J., et al. (1989). A Classification of Igneous Rocks and Glossary of Terms - Recommendations of the International Union of Geological Sciences Subcommission on the Systematics of Igneous Rocks. Oxford: Blackwell Scientific Publications.
Leung, I. S. (1974). Sector-zoned titanaugites: morphology, crystal chemistry, and growth. Am. Mineral. 59, 127–138.
Leva, C., Rümpker, G., Link, F., and Wölbern, I. (2019). Mantle earthquakes beneath Fogo volcano, Cape Verde: evidence for subcrustal fracturing induced by magmatic injection. J. Volcanol. Geotherm. Res. 386:106672. doi: 10.1016/j.jvolgeores.2019.106672
Lloyd, A. S., Ferriss, E., Ruprecht, P., Hauri, E. H., Jicha, B. R., and Plank, T. (2016). An assessment of clinopyroxene as a recorder of magmatic water and magma ascent rate. J. Petrol. 57, 1865–1886. doi: 10.1093/petrology/egw058
Longpré, M. A., Klügel, A., Diehl, A., and Stix, J. (2014). Mixing in mantle magma reservoirs prior to and during the 2011–2012 eruption at El Hierro, Canary Islands. Geology 42, 315–318. doi: 10.1130/G35165.1
Longpré, M.-A., Stix, J., Klügel, A., and Shimizu, N. (2017). Mantle to surface degassing of carbon- and sulphur-rich alkaline magma at El Hierro, Canary Islands. Earth Planet. Sci. Lett. 460, 268–280. doi: 10.1016/j.epsl.2016.11.043
López, C., Blanco, M. J., Abella, R., Brenes, B., Cabrera Rodríguez, V. M., Casas, B., et al. (2012). Monitoring the volcanic unrest of El Hierro (Canary Islands) before the onset of the 2011–2012 submarine eruption. Geophys. Res. Lett. 39, 1–7. doi: 10.1029/2012GL051846
Mackwell, S. J., and Kohlstedt, D. L. (1990). Diffusion of hydrogen in olivine: implications for water in the mantle. J. Geophys. Res. 95, 5079–5088.
Madeira, J., Brum da Silveira, A., Mata, J., Mourao, C., and Martins, S. (2008). The role of mass movements on the geomorphologic evolution of ocean islands: examples from Fogo and Brava in the Cape Verde archipelago. Comunões Geol. 95, 99–112.
Madeira, J., Ramalho, R. S., Hoffmann, D. L., Mata, J., and Moreira, M. (2019). A geological record of multiple Pleistocene tsunami inundations in an oceanic island: the case of Maio, Cape Verde. Sedimentology 67, 1529–1552. doi: 10.1111/sed.12612
Marques, F. O., Hildenbrand, A., Victória, S. S., Cunha, C., and Dias, P. (2019). Caldera or flank collapse in the Fogo volcano? What age? Consequences for risk assessment in volcanic islands. J. Volcanol. Geotherm. Res. 388:106686. doi: 10.1016/j.jvolgeores.2019.106686
Martí, J., Pinel, V., López, C., Geyer, A., Abella, R., Tárraga, M., et al. (2013). Causes and mechanisms of the 2011–2012 El Hierro (Canary Islands) submarine eruption. J. Geophys. Res. 118, 1–17. doi: 10.1002/jgrb.50087
Martínez-Moreno, F. J., Monteiro Santos, F. A., Madeira, J., Pous, J., Bernardo, I., Soares, A., et al. (2018). Investigating collapse structures in oceanic islands using magnetotelluric surveys: the case of Fogo Island in Cape Verde. J. Volcanol. Geotherm. Res. 357, 152–162. doi: 10.1016/j.jvolgeores.2018.04.028
Masson, D. G., Le Bas, T. P., Grevemeyer, I., and Weinrebe, W. (2008). Flank collapse and large-scale landsliding in the Cape Verde Islands, off West Africa. Geochem. Geophys. Geosyst. 9:Q07015.
Mata, J., Martins, S., Mattielli, N., Madeira, J., Faria, B., Ramalho, R. S., et al. (2017). The 2014–15 eruption and the short-term geochemical evolution of the Fogo volcano (Cape Verde): evidence for small-scale mantle heterogeneity. Lithos 288-289, 91–107. doi: 10.1016/j.lithos.2017.07.001
Métrich, N., and Wallace, P. J. (2008). “Volatile abundances in basaltic magmas and their degassing paths tracked by melt inclusions,” in Reviews in Mineralogy and Geochemistry Vol. 69: Minerals, Inclusions And Volcanic Processes, eds K. D. Putirka and F. J. Tepley (Chantilly: Mineralogical Society of America), 363–402. doi: 10.1515/9781501508486-011
Mollo, S., Del Gaudio, P., Ventura, G., Iezzi, G., and Scarlato, P. (2010). Dependence of clinopyroxene composition on cooling rate in basaltic magmas: implications for thermobarometry. Lithos 118, 302–312. doi: 10.1016/j.lithos.2010.05.006
Mollo, S., and Masotta, M. (2014). Optimizing pre-eruptive temperature estimates in thermally and chemically zoned magma chambers. Chem. Geol. 368, 97–103. doi: 10.1016/j.chemgeo.2014.01.007
Mollo, S., Putirka, K., Misiti, V., Soligo, M., and Scarlato, P. (2013). A new test for equilibrium based on clinopyroxene-melt pairs: clues on the solidification temperatures of Etnean alkaline melts at post-eruptive conditions. Chem. Geol. 352, 92–100. doi: 10.1016/j.chemgeo.2013.05.026
Moussallam, Y., Longpré, M.-A., McCammon, C., Gomez-Ulla, A., Rose-Koga, E. F., Scaillet, B., et al. (2019). Mantle plumes are oxidised. Earth Planet. Sci. Lett. 527:115798. doi: 10.1016/j.epsl.2019.115798
Müller, T., Dohmen, R., Becker, H. W., Heege, J., and Chakraborty, S. (2013). Fe-Mg interdiffusion rates in clinopyroxene: experimental data and implications for Fe-Mg exchange geothermometers. Contribut. Mineral. Petrol. 166, 1563–1576. doi: 10.1007/s00410-013-0941-y
Munhá, J. M., Mendes, M. H., Palácios, T., Silva, L. C., and Torres, P. C. (1997). “Petrologia e geoquímica da erupção de 1995 e de outras lavas históricas na Ilha do Fogo, Cabo Verde,” in A Erupção Vulcanica de 1995 Na Ilha Do Fogo, Cabo Verde, ed. A. Réffega (Lisbon: Instituto de Investigação Científica e Tropical), 171–186.
Nakamura, Y., and Coombs, D. S. (1973). Clinopyroxenes in the tawhiroko tholeiitic dolerite at Moeraki, north-eastern Otago, New Zealand. Contribut. Mineral. Petrol. 42, 213–228. doi: 10.1007/BF00371586
Neave, D. A., Namur, O., Shorttle, O., and Holtz, F. (2019). Magmatic evolution biases basaltic records of mantle chemistry towards melts from recycled sources. Earth Planet. Sci. Lett. 520, 199–211. doi: 10.1016/j.epsl.2019.06.003
Neave, D. A., and Putirka, K. (2017). A new clinopyroxene-liquid barometer, and implications for magma storage pressures under Icelandic rift zones. Am. Mineral. 102, 777–794. doi: 10.2138/am-2017-5968
Pérez, N. M., Padilla, G. D., Padrón, E., Hernández, P. A., Melián, G. V., Barrancos, J., et al. (2012). Precursory diffuse CO2 and H2S emission signatures of the 2011–2012 El Hierro submarine eruption, Canary Islands. Geophys. Res. Lett. 39:L16311. doi: 10.1029/2012gl052410
Pim, J., Peirce, C., Watts, A. B., Grevemeyer, I., and Krabbenhoeft, A. (2008). Crustal structure and origin of the Cape Verde Rise. Earth Planet. Sci. Lett. 272, 422–428. doi: 10.1016/j.epsl.2008.05.012
Putirka, K. (1999). Clinopyroxene + liquid equilibria to 100 kbar and 2450 K. Contribut. Mineral. Petrol. 135, 151–163. doi: 10.1007/s004100050503
Putirka, K. (2016a). Amphibole thermometers and barometers for igneous systems and some implications for eruption mechanisms of felsic magmas at arc volcanoes. Am. Mineral. 101, 841–858. doi: 10.2138/am-2016-5506
Putirka, K. (2016b). Rates and styles of planetary cooling on Earth, Moon, Mars, and Vesta, using new models for oxygen fugacity, ferric-ferrous ratios, olivine-liquid Fe-Mg exchange, and mantle potential temperature. Am. Mineral. 101, 819–840. doi: 10.2138/am-2016-5402
Putirka, K. D. (2008). “Thermometers and barometers for volcanic systems,” in Reviews in Mineralogy and Geochemistry Vol. 69: Minerals, Inclusions And Volcanic Processes, eds K. D. Putirka and F. J. Tepley (Chantilly: Mineralogical Society of America), 61–120. doi: 10.1515/9781501508486-004
Putirka, K. D., Mikaelian, H., Ryerson, F., and Shaw, H. (2003). New clinopyroxene-liquid thermobarometers for mafic, evolved, and volatile-bearing lava compositions, with applications to lavas from Tibet and the Snake River Plain, Idaho. Am. Mineral. 88, 1542–1554. doi: 10.2138/am-2003-1017
Putirka, K. D., Perfit, M., Ryerson, F. J., and Jackson, M. G. (2007). Ambient and excess mantle temperatures, olivine thermometry, and active vs. passive upwelling. Chem. Geol. 241, 177–206. doi: 10.1016/j.chemgeo.2007.01.014
Putirka, K. D., and Tepley, F. J. (eds) (2008). Reviews in Mineralogy and Geochemistry Vol. 69: Minerals, Inclusions And Volcanic Processes. Chantilly: Mineralogical Society of America.
Ramalho, R. S., Winckler, G., Madeira, J., Helffrich, G. R., Hipólito, A., Quartau, R., et al. (2015). Hazard potential of volcanic flank collapses raised by new megatsunami evidence. Sci. Adv. 1:e1500456. doi: 10.1126/sciadv.1500456
Richter, N., Favalli, M., De Zeeuw-van Dalfsen, E., Fornaciai, A., Fernandes, R., Pérez, N., et al. (2016). Lava flow hazard at Fogo Volcano, Cabo Verde, before and after the 2014–2015 eruption. Nat. Hazards Earth Syst. Sci. 16, 1925–1951. doi: 10.5194/nhess-16-1925-2016
Ridolfi, F., Renzulli, A., and Puerini, M. (2012). Calcic amphiboles in calc-alkaline and alkaline magmas: thermobarometric and chemometric empirical equations valid up to 1,130 °C and 2.2 GPa. Contribut. Mineral. Petrol. 163, 877–895. doi: 10.1007/s00410-011-0704-6
Rivera, J., Lastras, G., Canals, M., Acosta, J., Arrese, B., Hermida, N., et al. (2013). Construction of an oceanic island: insights from the El Hierro (Canary Islands) 2011-2012 submarine volcanic eruption. Geology 41, 355–358. doi: 10.1130/G33863.1
Roedder, E. (1983). Geobarometry of ultramafic xenoliths from Loihi Seamount, Hawaii, on the basis of CO2 inclusions in olivine. Earth Planet. Sci. Lett. 66, 369–379. doi: 10.1016/0012-821x(83)90152-8
Schwandt, C. S., and McKay, G. A. (2006). Minor- and trace-element sector zoning in synthetic enstatite. Am. Mineral. 91, 1607–1615. doi: 10.2138/am.2006.2093
Shishkina, T. A., Botcharnikov, R. E., Holtz, F., Almeev, R. R., Jazwa, A. M., and Jakubiak, A. A. (2014). Compositional and pressure effects on the solubility of H2O and CO2 in mafic melts. Chem. Geol. 388, 112–129. doi: 10.1016/j.chemgeo.2014.09.001
Span, R., and Wagner, W. (1996). A new equation of state for carbon dioxide covering the fluid region from the triple point temperature to 1100 K at pressures up to 800 MPa. J. Phys. Chem. Ref. Data 25, 1509–1596. doi: 10.1063/1.555991
Sparks, R. S. J., and Pinkerton, H. (1978). Effect of degassing on rheology of basaltic lava. Nature 276, 385–386. doi: 10.1038/276385a0
Sterner, S. M., and Pitzer, K. S. (1994). An equation of state for carbon dioxide valid from zero to extreme pressures. Contribut. Mineral. Petrol. 117, 362–374. doi: 10.1007/bf00307271
Strong, D. F. (1969). Formation of hour glass structure in augite. Mineral. Magaz. 37, 472–479. doi: 10.1180/minmag.1969.037.288.07
Toplis, M. J. (2005). The thermodynamics of iron and magnesium partitioning between olivine and liquid: criteria for assessing and predicting equilibrium in natural and experimental systems. Contribut. Mineral. Petrol. 149, 22–39. doi: 10.1007/s00410-004-0629-4
Torres, P., Madeira, J., Silva, L., Brum da Silveira, A., Serralheiro, A., and Mota Gomes, A. (1997). Carta Geológica das Erupções Históricas da Ilha do Fogo (Cabo Verde): revisão e actualização. Comun. Instit. Geol. Mine. 84, A193–A196.
Ubide, T., Mollo, S., Zhao, J.-X., Nazzari, M., and Scarlato, P. (2019). Sector-zoned clinopyroxene as a recorder of magma history, eruption triggers, and ascent rates. Geochim. Cosmochim. Acta 251, 265–283. doi: 10.1016/j.gca.2019.02.021
van den Kerkhof, A. M. (1990). Isochoric phase diagrams in the systems CO2-CH4 and CO2-N2: application to fluid inclusions. Geochim. Cosmochim. Acta 54, 621–629. doi: 10.1016/0016-7037(90)90358-r
Wanamaker, B. J., and Evans, B. (1989). Mechanical re-equilibration of fluid inclusions in San Carlos olivine by power-law creep. Contribut. Mineral. Petrol. 102, 102–111. doi: 10.1007/bf01160194
Wass, S. Y. (1973). The origin and petrogenetic significance of hour-glass zoning in titaniferous clinopyroxenes. Mineral. Magaz. 39, 133–144. doi: 10.1180/minmag.1973.039.302.01
Welsch, B., Hammer, J., Baronnet, A., Jacob, S., Hellebrand, E., and Sinton, J. (2016). Clinopyroxene in postshield Haleakala ankaramite: 2. Texture, compositional zoning and supersaturation in the magma. Contribut. Mineral. Petrol. 171, 1–19. doi: 10.1007/s00410-015-1213-9
Worsley, P. (2015). Physical geology of the Fogo volcano (Cape Verde Islands) and its 2014–2015 eruption. Geol. Today 31, 153–159. doi: 10.1111/gto.12102
Zanon, V. (2015). “Conditions for mafic magma storage beneath fissure zones at oceanic islands. The case of São Miguel Island (Azores archipelago),” in Chemical, Physical and Temporal Evolution of Magmatic Systems, eds L. Caricchi and J. D. Blundy (London: Geological Society of London Special Publications), 85–104. doi: 10.1144/sp422.4
Keywords: magma storage, magma ascent, thermobarometry, intraplate volcanism, petrology
Citation: Klügel A, Day S, Schmid M and Faria B (2020) Magma Plumbing During the 2014–2015 Eruption of Fogo (Cape Verde Islands). Front. Earth Sci. 8:157. doi: 10.3389/feart.2020.00157
Received: 28 February 2020; Accepted: 27 April 2020;
Published: 05 June 2020.
Edited by:
Teresa Ubide, University of Queensland, AustraliaReviewed by:
Silvio Mollo, Sapienza University of Rome, ItalyTakeshi Kuritani, Hokkaido University, Japan
Copyright © 2020 Klügel, Day, Schmid and Faria. This is an open-access article distributed under the terms of the Creative Commons Attribution License (CC BY). The use, distribution or reproduction in other forums is permitted, provided the original author(s) and the copyright owner(s) are credited and that the original publication in this journal is cited, in accordance with accepted academic practice. No use, distribution or reproduction is permitted which does not comply with these terms.
*Correspondence: Andreas Klügel, YWtsdWVnZWxAdW5pLWJyZW1lbi5kZQ==