 Chuhan Lu
 Jiaxin Ye
 Min Yang
- Key Laboratory of Meteorological Disaster, Ministry of Education/Joint International Research Laboratory of Climate and Environment Change/Collaborative Innovation Center on Forecast and Evaluation of Meteorological Disasters, Nanjing University of Information Science and Technology, Nanjing, China
An unusual heat wave was observed at 83% of all recording stations in northeastern China, North China, and Inner Mongolia from mid-July to early August 2018. The local maximum temperatures exceeded 40°C and brought great impacts to people's lives and the social economy. Using NCEP/NCAR reanalysis data and station data from the China Meteorological Administration, we study the characteristics and formation of this high-temperature event. The results show that a stable, deep, local, anomalous high over northern China was the main reason for this high-temperature event. A silk-road teleconnection circulation appeared in the upstream part at the midlatitudes of Eurasia and was accompanied by clear energy dispersion of an eastward midlatitude Rossby wave, which favored the divergence of wave energy over Northeast China and led to an increase in geopotential heights and the formation and maintenance of the local anomalous high in North China. Simultaneously, the northern typhoons “Ampil” and “Jongdari” had connections with the local anomalous high, generated obvious secondary meridional circulations, and amplified the downdrafts in the region of the high and the maintenance and intensification of high temperatures. Further analysis revealed that the sea surface temperature anomalies (SSTAs) in the middle of the North Atlantic Ocean in earlier periods would initiate negative vorticity sources on the northwestern side in the high-level troposphere and have a great impact on the generation and maintenance of the high-level silk-road teleconnection.
Introduction
The fifth report of the Intergovernmental Panel on Climate Change (IPCC) pointed out that global warming has been obvious over the past 100 years (Pachauri et al., 2014). With this background, the substantial increasing mean temperature lead to high risks of extreme high-temperature events (Stocker et al., 2013). Especially since the late 20th century, the frequency and strength of extreme high-temperature events have increased (Frich et al., 2002; Grotjahn et al., 2014). The heat wave that swept across Europe in 2003 caused nearly 25,000 deaths (Garcaí-Herrera et al., 2010). Additionally, Moscow experienced extremely high temperatures exceeding 30°C for 33 days in 2010, and more than 15,000 people died, the accompanying fires and drought caused 15 billion USD losses (Alexander, 2010).
Due to global warming, the number of heat wave events in China has increased since the middle of the 20th century (Ding et al., 2010; Wei and Chen, 2011; Wang et al., 2012). Since 1999, extremely hot periods lasting more than 10 days have appeared nearly every year (Li et al., 2013). In North China, located at higher latitudes, the summertime temperatures are lower than those of the southern regions such as the southwestern, Jianghuai, and South China regions. The strength of high-temperature events has clearly increased since the 1960s, and the rate of increase has reached 5°C/10 years (Li et al., 2017).
Research has revealed that general circulation anomalies are the direct cause of the high-temperature events in North China. Sun et al. (2011) indicated that the persistent extremely high temperatures in North China in the period from mid-July to late August are related to positive geopotential height anomalies in the mid/high levels of the troposphere. Positive geopotential height anomalies favor solar radiation reaching the ground and lead to local high temperatures. The interannual variations in the Okhotsk High (Sato and Takahashi, 2005) and polar vortex (Gu and Yang, 2006) as well as the Eurasian teleconnection (Li and Ruan, 2018) are closely associated with summertime temperatures in North China. In addition, mid-latitude teleconnections like the silk road pattern (Enomoto et al., 2003), contributing to the formation of the Bonin high, the West Pacific Subtropical high during summer, may also influencing the air temperature and precipitation around the Asian jet regions (Enomoto et al., 2009; Ye and Lu, 2011). Wakabayashi and Kawamura (2004) also noted that the western Asia-Japan teleconnection is an important teleconnection that affects summertime temperatures in Japan. Besides, external forcing, such as the snow cover on the Tibetan Plateau (Wu et al., 2012) and El Nino events (Niu and Guo, 1998), are related to summertime heat waves in North China.
In the midsummer of 2018 (July 18th to August 5th), heat waves dominated the northeastern, northern part, and Inner Mongolia in China; the number of days with high temperatures and maximum temperatures broke records in many places and exerted great effects on the local economy and people's lives (Wang et al., 2019; Xu et al., 2019). However, the dynamical formation mechanism for these persistent high-temperature events and its possible extremal forcing factors are still unclear. We will focus on these regional high-temperature events in North China. Through analyzing the characteristics of the general circulation anomalies and the abnormal activities of Rossby waves at midlatitudes, as well as the sea surface temperatures in the North Atlantic, we will further study the mechanisms and forcing.
Data and Methodology
Data
The data used in this study were as follows: (1) daily surface observations from 160 stations from 1959 to 2018 supplied by the National Meteorological Information Center, including daily maximum and mean temperatures; (2) the paths and the strengths of typhoons Ampil and Jongdari supplied by the website of Weather China for typhoons; (3) National Centers for Environmental Prediction/National Center for Atmospheric Research(NCEP/NCAR) reanalysis 1 (Kalnay et al., 1996) of daily data from 1959 to 2018 with a horizontal resolution of 2.5 × 2.5° and 17 vertical levels. The variables contained in these data are: 2 m temperatures, horizontal winds, geopotential heights, vertical velocities, and radiation fluxes. The climatic means of these variables use the 30-year (1979–2008) mean data from the NCEP/NCAR website; and (4) National Oceanic and Atmospheric Administration (NOAA) high resolution SSTs (Reynolds et al., 2007) from 1982 to 2018 with a horizontal resolution of 0.25 × 0.25°.
Definitions
(1) To define extreme high-temperature events, we use percentile-based extreme high- temperature thresholds, with one threshold for each calendar day, which is calculated as the 95th percentile (TX95p) of the distribution of daily maximum temperatures on that calendar day and across all years in the baseline period 1981–2010. A day when daily maximum temperatures (TX) >TX95p was defined as being an extremely high-temperature day.
(2) The definition of a heat wave: According to the latitude and threshold for historic extreme high temperatures, we used the World Meteorological Organization (WMO) definition of a station heat wave. When the station daily maximum temperatures exceed 32°C and last for 3 days or more, then these conditions are defined as a heat wave event (Qian and Wang, 2017), which can be discussed in the context of a persistent extreme high-temperature process.
Methodology
(1) Rossby flux: To investigate the characteristics of Rossby wave propagation during the studying period, we used the TN wave activity flux (Takaya and Nakamura, 2001) to diagnose the wave energy propagations. Assuming the wave is stationary, the formula of horizontal T-N Wave-Activity Flux could yield as followed:
where ψ′ designates compute perturbation stream-function represented by geopotential anomalies in Quasi-Geostrophic assumption.
(2) SRI index: Enomoto et al. (2003) called the wave train in the midlatitudes the silk-road pattern. We used the silk-road pattern teleconnection index SRI (Wakabayashi and Kawamura, 2004; Wang L. et al., 2018) to describe the characteristics of the geopotential height teleconnection in the atmosphere from western Asia to eastern Asia.
denotes the normalized geopotential height at 200 hPa.
The 2018 Extreme High-Temperature Events in Northeast and North China
The Characteristics of Extremely High-Temperature Events
In midsummer, 2018, a persistent regional high temperature events affected Northeast China, part of North China and the eastern parts of Inner Mongolia. According to Table 1, from July 18th to August 5th, heat wave was observed at 25 of 30 selected stations (83.3%), the mean maximum temperature reached 36°C, and the local maximum temperatures exceeded 40°C, which were 2–3°C higher than those in the corresponding period and formed the largest anomaly in this area since 1959. Meanwhile, most stations experienced two heat wave events that exhibited two fluctuating processes in this period.
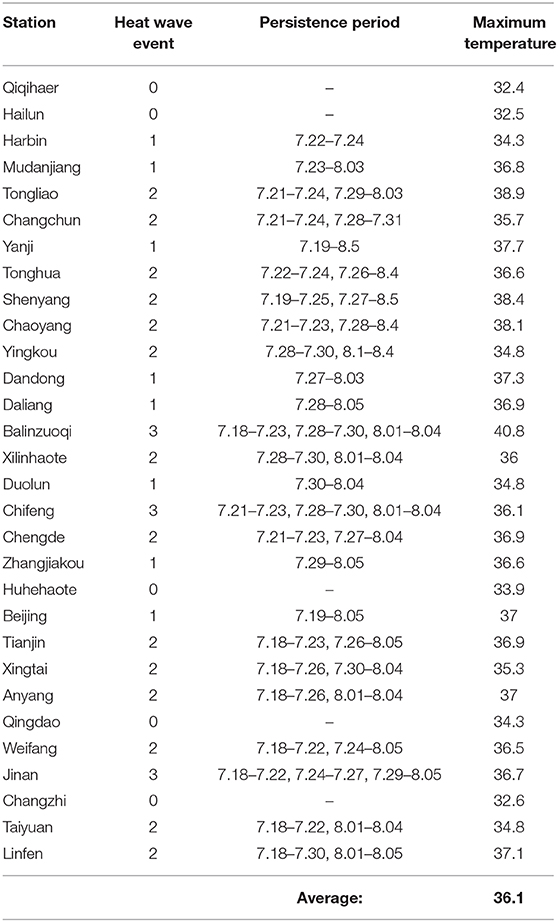
Table 1. Showing the statistics of heat wave events (July 18th to August 5th).
As shown in Figure 1 the ratios of extremely high-temperature days to the total days during July 18th - August 5th in most of North China (25 stations) are higher than 60%, including 5 stations experienced an extremely persistent hot condition during the whole study period. This indicates a regional and long-lasting hot midsummer occurred in North China.
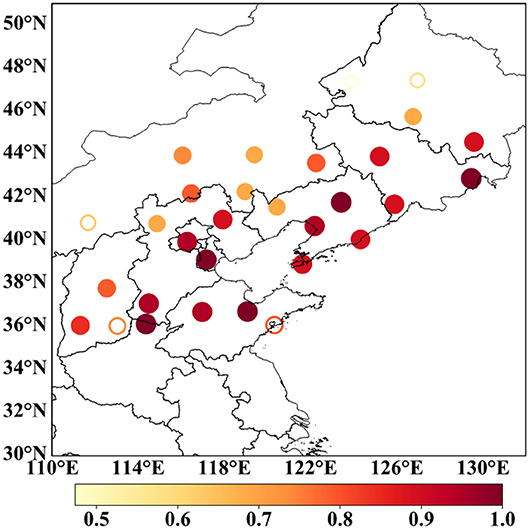
Figure 1. The distribution of the 30 selected stations and the high-temperature characteristics (solid dots indicate the stations that experienced heat wave events; shading represents the ratio of the number of days with extremely high temperatures to the total number of days; the dots denote stations with no heat wave events).
The Effects of Anomalous Local High Temperatures
In late July 2018, a ridge of subtropical high abnormally crossed to the north of 40°N (figure not shown). Figure 2 shows the mean anomalies of the geopotential height at 500 hPa and the 2 m temperatures from July 18th to August 5th, 2018. When the subtropical high was north of its normal position, there was an anomalous local upper high in North China and the heat wave-affected regions including Inner Mongolia, Shanxi, North China and most parts of Northeast China were covered by this abnormal local high.
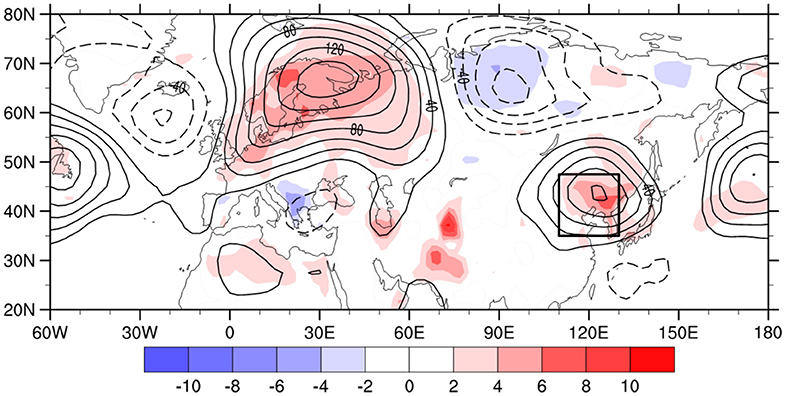
Figure 2. July 18th-August 5th mean anomalies of the geopotential heights (contours, gpm) and 2 m temperatures (shaded, °C); the rectangle denotes the region that was primarily affected by this high-temperature process.
Using the main region (e.g., 110–130°E, 35–47.5°N) that was influenced by this high-temperature process, we show the regional mean geopotential heights and temperatures in Figure 3. Figure 3A shows the time series of the normalized high-temperature regional mean 2 m temperatures and 500 hPa geopotential heights from July 18th to August 5th. The regional mean geopotential heights and temperatures evolved with each other. Both exhibited two fluctuations and the correlation coefficient reached 0.81. Figure 3B shows the normalized geopotential heights and temperatures for the corresponding period averaged from 1959 to 2018. On an interannual timescale, the geopotential heights were in phase with the temperatures, and the correlation coefficient reached 0.69, which was significant at 99% confidence level. The temperatures and geopotential height anomalies in this region were significantly positively related. The geopotential height anomalies for the corresponding period in 2018 reached the maximum values for these 60 years (e.g., 1959 to 2018) (Figure 3B), thus showing that the 2018 anomalous high in North China was stronger than that in normal years (Figure 2). Through the above analysis, the anomalous local high in North China may be a key cause leading to the persistent high-temperature events in North and Northeast China.
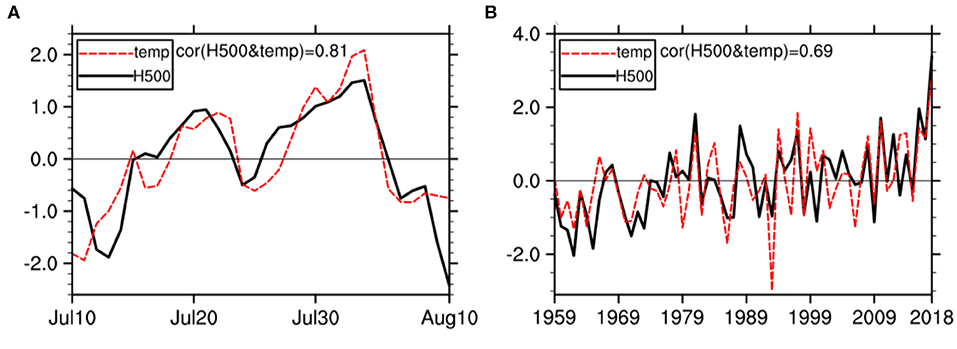
Figure 3. High-temperature regional means (110–130°E, 35–47.5°N) of (A) daily normalized 2 m temperatures and 500 hPa geopotential heights from July 10th to August 10th, 2018; (B) normalized 2 m temperatures and 500 hPa geopotential heights in the multiyear mean daily data from July 18th to August 5th from 1959 to 2018.
Figure 4 shows the longitude-height section for 35–47.5°N for the averaged geopotential heights and vertical velocities from July 18th to August 5th. An abnormal high existed in the troposphere in the region from North China to the middle part of Japan (120–140°E); the center of this high was located near 200 hPa and exhibited a deep quasibarotropic structure (Figure 4A). In the vertical velocity section (Figure 4B), downdrafts appeared from the surface to 200 hPa in North China from 120 to 130°E; the center of the maximum was near 300 hPa in the troposphere. The vertical velocity anomalies in this region were positive, i.e., in this high-temperature process, there were strong downdrafts in North China that were consistent with the results shown in Figure 4A. All suggested that the dynamic effect may be an important cause for the formation and maintenance of this anomalous local high.
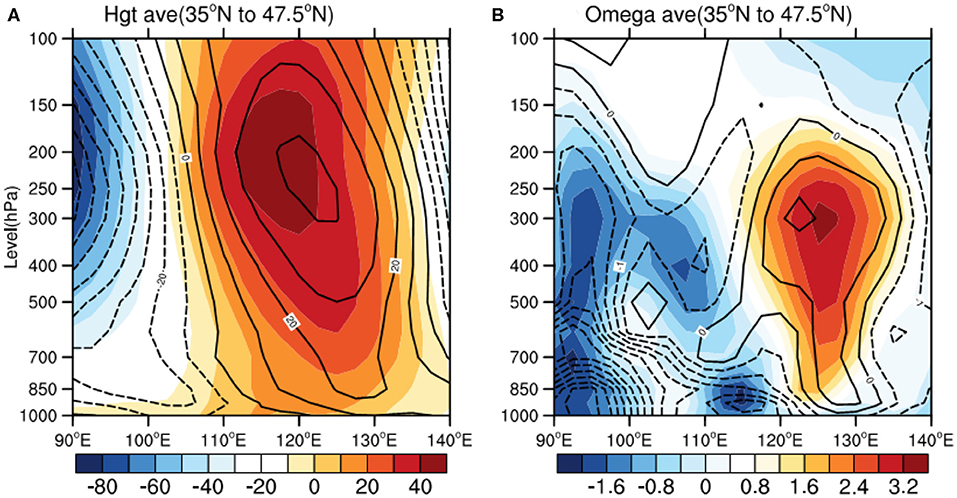
Figure 4. Longitude-height section of 35–47.5°N mean from July 18th to August 5th in 2018 (A) geopotential heights (contours) and geopotential height anomalies (shading), latitudinal mean subtracted, units: gpm; (B) vertical velocities (contours) and vertical velocity anomalies (shading), multiplied by 100, units: Pas-1.
Figure 5 shows the OLR anomalies and downward shortwave radiation anomalies averaged from July 18th to August 5th. Positive centers of OLR (Figure 5A) and downward shortwave radiation (Figure 5B) anomalies existed in the region of the anomalous high over North China. Notable positive OLR anomalies displayed in North China suggests dominant downdrafts and decrease of clouds in the anomalous high region. These explain the downward shortwave radiation increased and heated the surface leading to local temperature increases. Therefore, it is evident from Figure 2 that the positions of the positive 2 m temperature anomalies and local anomalous high were close to each other.
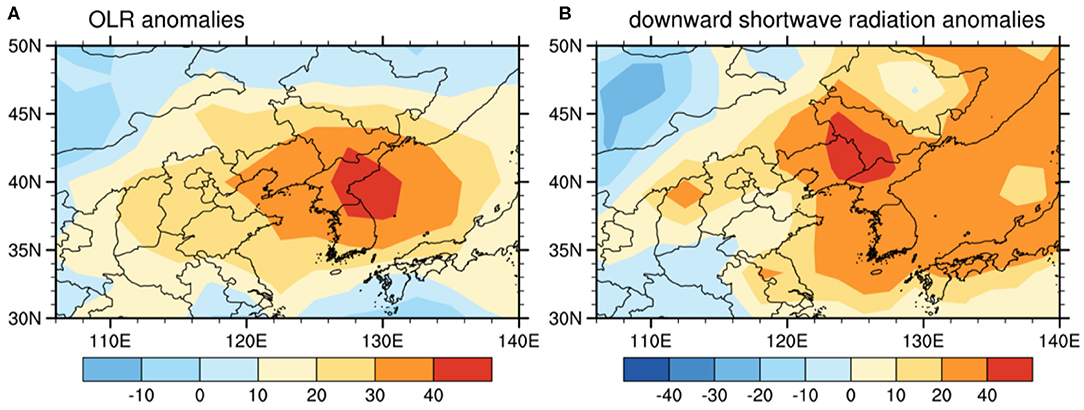
Figure 5. July 18th-August 5th averaged (A) OLR anomalies; (B) downward shortwave radiation anomalies in 2018 units: Wm−2.
The Effects of Typhoons Ampil and Jongdari
During the high-temperature period, Typhoons Ampil, and Jongdari prevailed over the western Pacific to the south of the anomalous high (Figure 6). In particular, Typhoon Jongdari followed an anomalous track: after its generation on July 25th, it turned around twice to the south of Japan and the East China Sea in sequence and made landfall in Shanghai on August 3rd. During the emergence of Typhoon Jongdari, the intensity of the local anomalous high reached its maximum in North China. As shown in Figure 6, the track of Typhoon Jongdari coincided with the outer flow of the anomalous high after the westward turn of Jongdari. Along a line connecting the center of the anomalous high and typhoon low (Figure 7A), we constructed a vertical section of the divergent winds (Figure 7B). A strong, closed secondary circulation was located between the anomalous high and the typhoon and induced local low anomalies, whose centers were in the mid-troposphere and the wide sinking branch was on the southeastern side of the anomalous high. As shown in Figure 2, the center of the positive temperature anomalies was on the southeastern side of the anomalous high. This indicates that the secondary circulation formed by the anomalous high and typhoon strengthened the downdrafts in northeastern Asia and further contributed to the maintenance of local high temperatures.
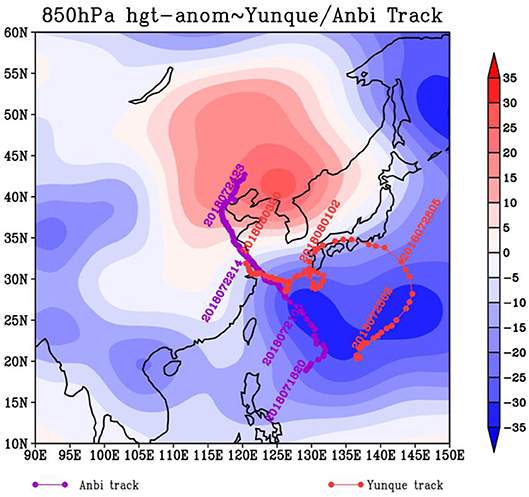
Figure 6. Tracks of typhoons Ampil and Jongdari. The shaded areas are the 850 hPa geopotential height anomalies averaged from July 18th to August 5th in 2018 (gpm).
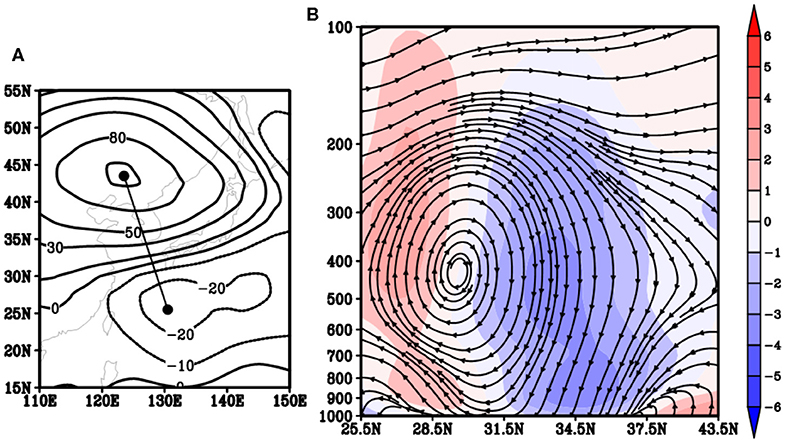
Figure 7. The values averaged from July 18th to August 5th of 2018 for (A) the 500 hPa geopotential height anomalies (gpm) where the straight line runs between the center of the local high and typhoon and (B) the secondary vertical circulation over the local high and typhoon centers, where the streamlines denote the vertical circulation formed by horizontal divergent winds and by vertical motion over the line connecting the centers. Shading represents the vertical velocity (Pa.s−1).
Possible Dynamic Mechanisms for the Anomalous High
The Characteristics of the Upstream Rossby Wave
From the analysis above, the anomalous high in North China exhibited a deep vertical structure, whose maximum center was near the top of the troposphere ~200 hPa and indicated the leading role of upper level circulation on the lower level circulation as well as its role on the abnormal weather. Rossby wave activity at midlatitudes may have great effects on the formation and maintenance of local highs at midlatitudes (e.g., Enomoto et al., 2009). The distribution of the relative vorticity anomalies (60°W−180°E, 20–80°N) averaged between July 18th and August 5th at 200 hPa (Figure 8A) shows that a region of strong negative vorticity stretched from North China to mid-Japan and that the anticyclonic system was obvious at 200 hPa. From investigating the upstream circulations of the anomalous high at 200 hPa (Figure 8A), we see that a zonal wave train with vorticity anomalies in the western North Atlantic (–)—Mediterranean (+)—Caspian Sea (–)—Balkhash Lake (+)—northern China (–) was located at the mid/high latitudes. This pattern resembles that of a “silk-road” wave train (Enomoto et al., 2009; Kosaka et al., 2009).
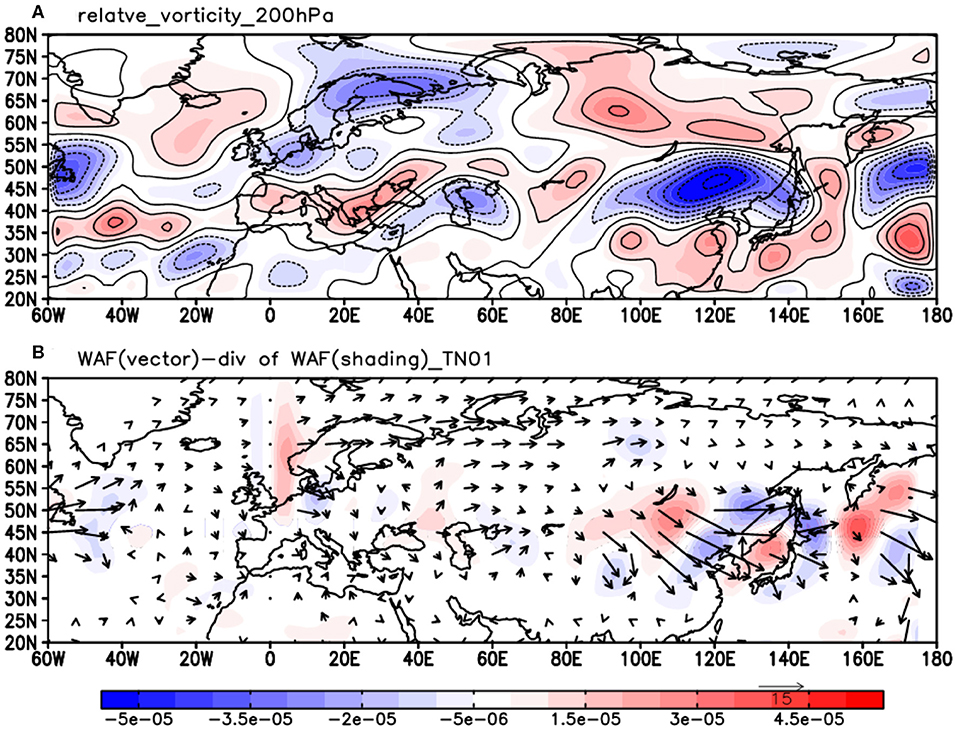
Figure 8. (A) The distribution of anomalous vorticity (shaded; s−1); (B) wave activity fluxes (vector; m2.s−2) and divergence of wave activity fluxes (shaded; m.s−2); both were averaged between 18 July and 05 Auguest at 200 hPa.
To further investigate the possible effects of the anomalous Rossby wave activity at mid/high latitudes by using the T-N wave activity fluxes described by Takaya and Nakamura (2001), we calculated the wave activity fluxes (WAFs) from the North Atlantic to Japan; their spatial distributions are shown in Figure 8B. The midlatitude Rossby wave train arose near 60°W in the North Atlantic, propagated to the east, passed the Caspian Sea and Balkhash Lake and reached China. Meanwhile, the wave fluxes converged in Northeast China, North China and mid-Japan and indicated that, through dispersion, the upstream midlatitude wave train favored the intensification and the maintenance of the local anomalous high over North China.
To study the effects of the silk-road teleconnection and midlatitude Rossby wave activity on the local anomalous high, the interannual variations in the regional mean normalized temperatures, geopotential heights, and the SRI index are investigated (Figure 9). The year-to-year evolution of the high-temperature region, temperature anomalies, and SRI exhibit high consistency, and the correlation coefficient among them reached 0.617, which was significant at 99% confidence level. This indicated that the intensification of the silk-road teleconnection favored temperature increases in northern China and increased the probability of the emergence of local heat wave events. Meanwhile, the regional mean geopotential heights were positively correlated with the SRI, and their correlation coefficients reached 0.704. In particular, the SRI index, regional temperature anomalies, and geopotential heights all presented increasing tendencies after 2000 and all reached their maxima in 2018. These factors indicated that the midlatitude Rossby-related SRI exhibited an intensifying trend that resulted in increasing geopotential heights over North China and mid-Japan, followed by intensified downdrafts and increases in surface shortwave radiation, thus bringing local extreme high-temperature events in recent years such as those in 2018.
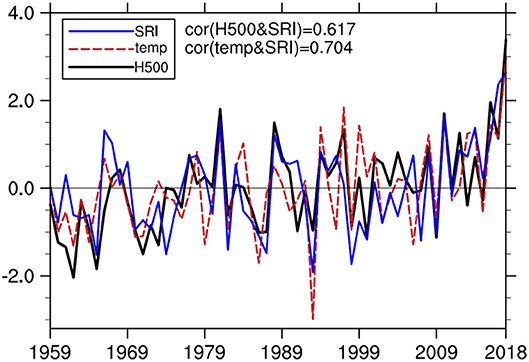
Figure 9. Interannual series of the regional mean (high-temperature region 110–130°E, 35–47.5°N) normalized 2 m temperatures, 500 hPa geopotential heights and SRI.
The Effects of the Atlantic SSTA on Rossby Wave Activity
The thermodynamic effects of oceans on the atmosphere above cause anomalies in geopotential heights and divergent winds in high level of the troposphere and hence, the rotation initiated can be the Rossby wave source (Held et al., 2002; Li et al., 2019). To study the relationship between SSTA and the “silk-road” midlatitude Rossby wave, we analyzed the correlations between SRI indexes in the study period and SSTA during the preceding 2 weeks (Figure 10). The previous SSTA in the middle of the North Atlantic and the Black Sea were positively and significantly correlated with the SRIs and were significant at the 0.05 level. This indicates that when there were positive SSTA in the middle part of the North Atlantic in previous periods, it may have been easier to initiate a “silk-road” Rossby wave, which leads to higher temperatures in North China and Northeast China.
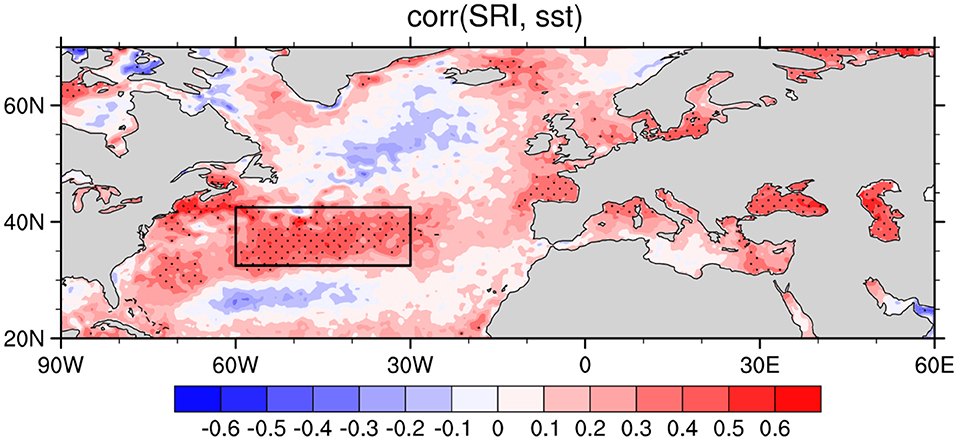
Figure 10. The distribution of correlation coefficients between SSTA (July 1st-July 15th averaged) and SRIs (July 18th-August 5th averaged) (the dots are significant regions at 95% confidence level and the rectangle denotes the chosen key SST region).
Based on the SSTA variations in the North Atlantic in June and July 2018 (Figure 11A) and before the emergence of the heat wave in Northeast China, the SSTs in the North Atlantic increased significantly and lasted from July 1st. It can be seen from the averaged SSTA in early July 2018 (Figure 11B) that the SSTA in the North Atlantic exhibited a tripolar pattern with positive anomalies in the middle of the North Atlantic (e.g., 30–45°N). The summertime positive SSTA in the North Atlantic could have induced the low-level anomalous cyclonic circulation and the high-level divergent field to its northwestern side through the Gill response (Gill, 1980). Correspondingly, the anomalies generated anticyclonic circulation in the high-level troposphere on the northwestern side of the SSTA, which would be consistent with the negative vorticity source in the high-level troposphere in this process (Figure 8). The vorticity source, which was forced by the positive SSTA, stimulated a downstream silk-road Rossby wave train pattern. The geopotential heights increased in North China and led to high temperatures. The North Atlantic tripolar SSTA index exhibited an intense positive phase (figure omitted). Before the emergence of the high-temperature event, the SSTA had a positive-negative distribution from south to north (Figure 11B), which may be related to the maintenance of the springtime tripolar SSTA in the North Atlantic (Sun, 2014).
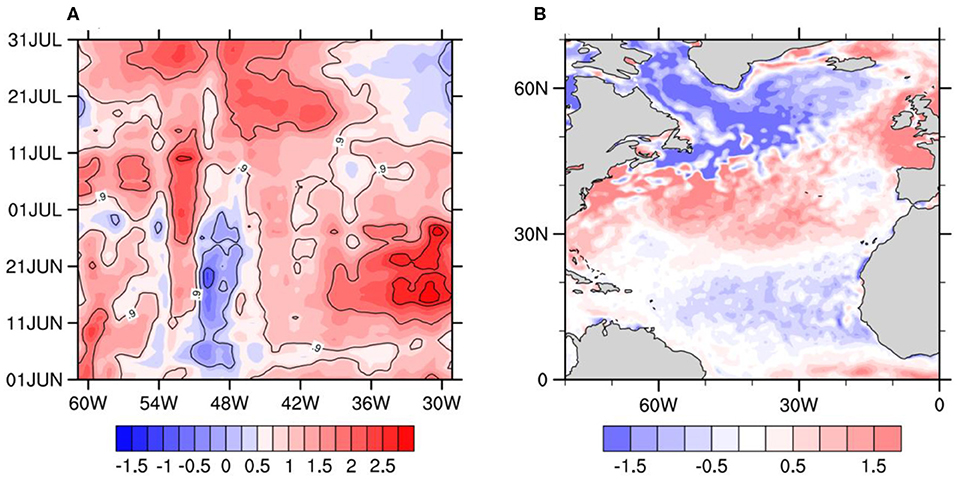
Figure 11. (A) Longitude-time section of SSTA (32.5°N-42.5°N averaged); (B) SSTA in North Atlantic in the previous period (01 July-15 July).
Conclusion and Discussion
Based on NCEP/NCAR reanalysis and daily data from the National Meteorological Information Center of the China Meteorological Administration, we discussed the mechanisms leading to the 2018 mid-summer heat wave in North China. In addition, we analyzed the generation of the local anomalous high in North China through Rossby wave dispersion and by oceanic thermodynamic forcing.
This high-temperature process in North China lasted from July 18th to August 5th. The region impacted covered Liaoning and Jilin Provinces, and neighboring provinces such as Inner Mongolia and Hebei were also affected to some extent. The mean maximum temperature reached 36°C, which was 2–3°C higher than that of the corresponding period and was the maximum high temperature in this region in nearly 60 years. Analyzing the anomalous circulations during the same period, the strongest deep anomalous high since 1959 appeared over North China. The maintenance of this local anomalous high was the main cause of the high-temperature event in North China. Under the control of this anomalous high, extremely strong downdrafts prevailed in North China, leading to fewer clouds and more shortwave radiation arriving at the surface. As a result, local temperatures increased. Meanwhile, with the interaction between the northward typhoon and the local anomalous high, strong secondary circulation formed, and intensified the downdrafts over the region being influenced by high temperatures, thus causing the high-temperature events to persist and become more intense.
The Rossby wave activity in the midlatitudes of Eurasia played an important role in the generation and maintenance of the local anomalous high. From the calculation of wave activity fluxes, we found an anomalous wave train similar to the “silk-road” teleconnection at the midlatitudes of Eurasia during this period. This wave train originated from the North Atlantic at the midlatitudes and propagated eastward. Due to downward energy dispersion, the local anomalous high in North China intensified and persisted.
During the previous period of this heat wave event, the SSTs in the middle of the North Atlantic Ocean displayed pronounced positive anomalies, resulting in a negative vorticity source on the northwestern side of the North Atlantic in the high-level troposphere and initiated a “silk-road” teleconnection wave train, finally leading to the local anomalous high in North China and the generation of high temperatures.
The results of this study indicate that this high-temperature event is attributed to the stable and persistent local anomalous high in North China and to the “silk-road” teleconnection wave train, which was initiated by the upstream North Atlantic SSTA. In addition, studies of the causes of the 2018 extreme high-temperature event rely on correlation analyses and dynamic diagnostic methods; we will verify these results through numerical tests and build a physical model in our future work.
Data Availability Statement
The raw data supporting the conclusions of this article will be made available by the authors, without undue reservation.
Author Contributions
CL and JC contributed conception and design of the study. JY and SW organized the database. MY, QL, and WH performed the statistical analysis. JC wrote the first draft of the manuscript. All authors contributed to manuscript revision, read, and approved the submitted version.
Funding
This work was supported by the National Key Research and Development Program of China under contract No. 2019YFC1510201.
Conflict of Interest
The authors declare that the research was conducted in the absence of any commercial or financial relationships that could be construed as a potential conflict of interest.
Acknowledgments
We are truly grateful to the two reviewers for providing professional comments and suggestions to this study. The authors would like to thank NOAA-PSL (Physical Sciences Laboratory) at https://psl.noaa.gov/data/gridded/data.ncep.reanalysis.html.
References
Alexander, L. (2010). Climate science: extreme heat rooted in dry soils. Nat. Geosci. 4:1213. doi: 10.1038/ngeo1045
Ding, T., Qian, W. H., and Yan, Z. W. (2010). Changes in hot days and heat waves in China during 1961-2007. Int. J. Climatol. 30, 1452–1462. doi: 10.1002/joc.1989
Enomoto, T., Endo, H., Harada, Y., and Ohfuchi, W. (2009). Relationship between high-impact weather events in Japan and propagation of Rossby waves along the Asian jet in July 2004. J. Meteorol. Soc. Japan 87, 139–156. doi: 10.2151/jmsj.87.139
Enomoto, T., Hoskins, B. J., and Matsuda, Y. (2003). The formation mechanism of the Bonin high in August. Quart. J. R. Meteorol. Soc. 129, 157–178. doi: 10.1256/qj.01.211
Frich, P., Alexander, L., Della-Marta, P., Gleason, B., Haylock, M., Klein Tank, A. M. G., et al. (2002). Observed coherent changes in climatic extremes during the second half of the twentieth century. Clim. Res. 19, 193–212. doi: 10.3354/cr019193
Garcaí-Herrera, R., Daíz, J., Trigo, R. M., Luterbacher, J., and Fischer, E. M. (2010). A review of the European summer heat wave of 2003. Crit. Rev. Environ. Sci. Technol. 40, 267–306. doi: 10.1080/10643380802238137
Gill, A. E. (1980). Some simple solutions for heat-induced tropical circulation. Quart. J. R. Meteorol. Soc. 106, 447–462. doi: 10.1002/qj.49710644905
Grotjahn, R., Barlow, M., Black, R., Cavazos, T., Gutowski, W., Gyakum, J., et al. (2014). Workshop on Analyses, Dynamics, and Modeling of Large-Scale Meteorological Patterns Associated With Extreme Temperature and Precipitation Events (No.2014-2). Washington, DC: U.S. CLIVAR Project Office. doi: 10.5065/D6ZK5F2N
Gu, S. N., and Yang, X. Q. (2006). Variability of the Northern Circumpolar Vortex and its association with climate anomaly in China. Sci. Meteorol. Sinica, 26, 135–142. doi: 10.1016/S1872-2032(06)60022-X
Held, I. M., Ting, M., and Wang, H. (2002). Northern winter stationary waves: theory and modeling. J. Clim. 15, 2125–2144. doi: 10.1175/1520-0442(2002)015<2125:NWSWTA>2.0.CO;2
Kalnay, E., Kanamitsu, M., Kistler, R., and Kistler, W. (1996). The NCEP/NCAR reanalysis 40-year project. Bullet. Am. Meteorol. Soc. 77, 437–471. doi: 10.1175/1520-0477(1996)077<0437:TNYRP>2.0.CO;2
Kosaka, Y., Nakamura, H., Watanabe, M., and Kimoto, M. (2009). Analysis on the dynamics of a wave–like teleconnection pattern along the summertime Asian jet based on a reanalysis dataset and climate model simulations(Evaluations of CMIP3 model performance for various atmospheric and oceanic phenomena, part I). J. Meteorol. Soc. Japan 87, 561–580. doi: 10.2151/jmsj.87.561
Li, J., and Ruan, C. (2018). The north Atlantic–Eurasian teleconnection in summer and its effects on Eurasian climates. Environ. Res. Lett. 13:024007. doi: 10.1088/1748-9326/aa9d33
Li, J. P., Zheng, F., Sun, C., Feng, J., Wang, J. (2019). Pathways of influence of the Northern Hemisphere mid-high latitudes on East Asian climate: a review. Adv. Atmos. Sci. 36, 902–921. doi: 10.1007/s00376-019-8236-5
Li, L. G., Wang, H. B., Zhao, Z. Q., Liu, X. M., Wan, Z. H., Sun, F. H., et al. (2013). Effect of shifting weather stations on urban heat island intensity (in Chinese). J. Meteorol. Environ. 29, 54–60.
Li, Y., Ding, Y., and Li, W. (2017). Observed trends in various aspects of compound heat waves across China from 1961 to 2015. J. Meteorol. Res. 31, 455–467. doi: 10.1007/s13351-017-6150-2
Niu, R., and Guo, W. (1998). The characteristic analysis of high temperature in China in the summer of (1997). Meteorol. Monthly 24, 44–49.
Pachauri, R. K., Allen, M. R., Barros, V. R., Broome, J., Cramer, W., Christ, R., et al. (2014). “Climate change 2014: synthesis report,” in Contribution of Working Groups I, II and III to the Fifth Assessment Report of the Intergovernmental Panel on Climate Change, Vol. 151 (Geneva: IPCC), 40–41.
Qian, Y., and Wang, J. F. (2017). The association between consecutive days'heat wave and cardiovascular disease mortality in Beijing, China. BMC Public Health 17:223. doi: 10.1186/s12889-017-4129-7
Reynolds, R. W., Smith, T. M., Liu, C. Y., Chelton, D. B., Casey, K. S., and Schlax, M. G. (2007). Daily high-resolution-blended analyses for sea surface temperature. J. Clim. 20, 5473–5496. doi: 10.1175/2007JCLI1824.1
Sato, N., and Takahashi, M. (2005). Dynamical processes related to the appearance of the Okhotsk High during early midsummer. J. Clim. 20, 4982–4994. doi: 10.1175/JCLI4285.1
Stocker, T. F., Qin, D., Plattner, G. K., Tignor, M. M. B., Allen, S. K., Boschung, J., et al. (2013). Climate Change 2013: The Physical Science Basis. Contribution of Working Group I to the Fifth Assessment Report of the Intergovernmental Panel on Climate Change (Cambridge; New York, NY: Cambridge University Press), 1535.
Sun, J. Q. (2014). Record-breaking SST over mid-North Atlantic and extreme high temperature over the Jianghuai–Jiangnan region of China in 2013. Chinese Sci. Bullet. 59, 3465–3470. doi: 10.1007/s11434-014-0425-0
Sun, J. Q., Wang, H. J., and Yuan, W. (2011). Decadal variability of the extreme hot event in China and its association with atmospheric circulations (in Chinese). Clim. Environ. Res. 16, 199–208.
Takaya, K., and Nakamura, H. (2001). A formulation of a phase-independent wave-activity flux for stationary and migratory quasigeostrophic eddies on a zonally varying basic flow. J. Atmos. Sci. 58, 608–627. doi: 10.1175/1520-04692001058<0608:AFOAPI>2.0.CO;2
Wakabayashi, S., and Kawamura, R. (2004). Extraction of major teleconnection patterns possibly associated with the anomalous summer climate in Japan. J. Meteorol. Soc. Japan 82, 1577–1588. doi: 10.2151/jmsj.82.1577
Wang, L., Wang, C., and Guo, D. (2018). Evolution mechanism of synoptic-scale EAP teleconnection pattern and its relationship to summer precipitation in China. Atmos. Res. 214:150–162. doi: 10.1016/j.atmosres.2018.07.023
Wang, Q., Zhai, P. M., and Yu, R. (2019). Analysis of extreme weather and climate events and circulation characteristics in the Northern Hemisphere in July 2018 (in Chinese). Transact. Atmos. Sci. 42, 28–35.
Wang, Z. Y., Ding, Y. H., Zhang, Q., and Song, Y. F. (2012). Changing trends of daily temperature extremes with different intensities in China. Acta Meteorol. Sinica 26, 399–409. doi: 10.1007/s13351-012-0401-z
Wei, K., and Chen, W. (2011). An abrupt increase in the summer high temperature extreme days across China in the mid-1990s. Adv. Atmos. Sci. 28, 1023–1029. doi: 10.1007/s00376-010-0080-6
Wu, Z. W., Lin, H., Li, J. P., Jiang, Z. H., and Ma, T. T. (2012). Heat wave frequency variability over North America: two distinct leading modes. J. Geophys. Res. 117:D02102. doi: 10.1029/2011JD016908
Xu, K., Lu, R. Y., Mao, J. Y., and Chen, R. D. (2019). Circulation anomalies in the mid–high latitudes responsible for the extremely hot summer of 2018 over northeast Asia. Atmos. Oceanic Sci. Lett. 12, 231–23. doi: 10.1080/16742834.2019.1617626
Keywords: heat wave, silk-road teleconnection, Rossby wave, Typhoon, North China
Citation: Lu C, Ye J, Wang S, Yang M, Li Q, He W, Qin Y, Cai J and Mao J (2020) An Unusual Heat Wave in North China During Midsummer, 2018. Front. Earth Sci. 8:238. doi: 10.3389/feart.2020.00238
Received: 13 April 2020; Accepted: 03 June 2020;
Published: 07 August 2020.
Edited by:
Lei Zhang, University of Colorado Boulder, United StatesReviewed by:
Shengping He, University of Bergen, NorwayWen Xing, University of Colorado Boulder, United States
Copyright © 2020 Lu, Ye, Wang, Yang, Li, He, Qin, Cai and Mao. This is an open-access article distributed under the terms of the Creative Commons Attribution License (CC BY). The use, distribution or reproduction in other forums is permitted, provided the original author(s) and the copyright owner(s) are credited and that the original publication in this journal is cited, in accordance with accepted academic practice. No use, distribution or reproduction is permitted which does not comply with these terms.
*Correspondence: Yujing Qin, cWlueXVqaW5nQG51aXN0LmVkdS5jbg==