 Robert S. Fausto
 Jakob Abermann
 Andreas P. Ahlstrøm
- 1Geological Survey of Denmark and Greenland (GEUS), Copenhagen, Denmark
- 2Department of Geography and Regional Science, University of Graz, Graz, Austria
Introduction
Quantifying area and volume loss of the world's glaciers outside the large ice sheets has caught the attention of policy makers and the public due to the potential impact on sea-level rise (e.g., AMAP, 2019; IPCC, 2019; Wouters et al., 2019; Zemp et al., 2019). Recent in-situ measurements from the Greenland Ice Sheet and its peripheral glaciers show that they are on average losing mass due to climate change (e.g., AMAP, 2019).
The robustness of sea-level rise predictions rely heavily on observational data from glaciers in the world, which is why reliable mass balance measurements are in high demand (AMAP, 2019; IPCC, 2019). The Programme for Monitoring of the Greenland ice sheet (PROMICE) initiated in 2007, is delivering such in situ data from a network of automatic weather stations (AWSs) covering eight different regions of the Greenland ice sheet and one location on the peripheral glacier Mittivakkat in south-east Greenland (Figure 1, Van As et al., 2011). The PROMICE in situ data is also valuable for calibrating and validating melt and energy balance estimates from remote sensing or surface mass balance models (AMAP, 2019; IPCC, 2019). A database accessible through the PROMICE data portal (https://www.promice.org/PromiceDataPortal) provides a Greenland wide mass balance data collection with associated background information (Machguth et al., 2016). In this data report, we focus on the AWS location on the peripheral glacier Mittivakkat (MIT) in south-east Greenland and present its annual surface mass balance for the period 2009–2019 derived from the daily automatic weather station data product found on the PROMICE data portal (https://doi.org/10.22008/promice/data/aws).
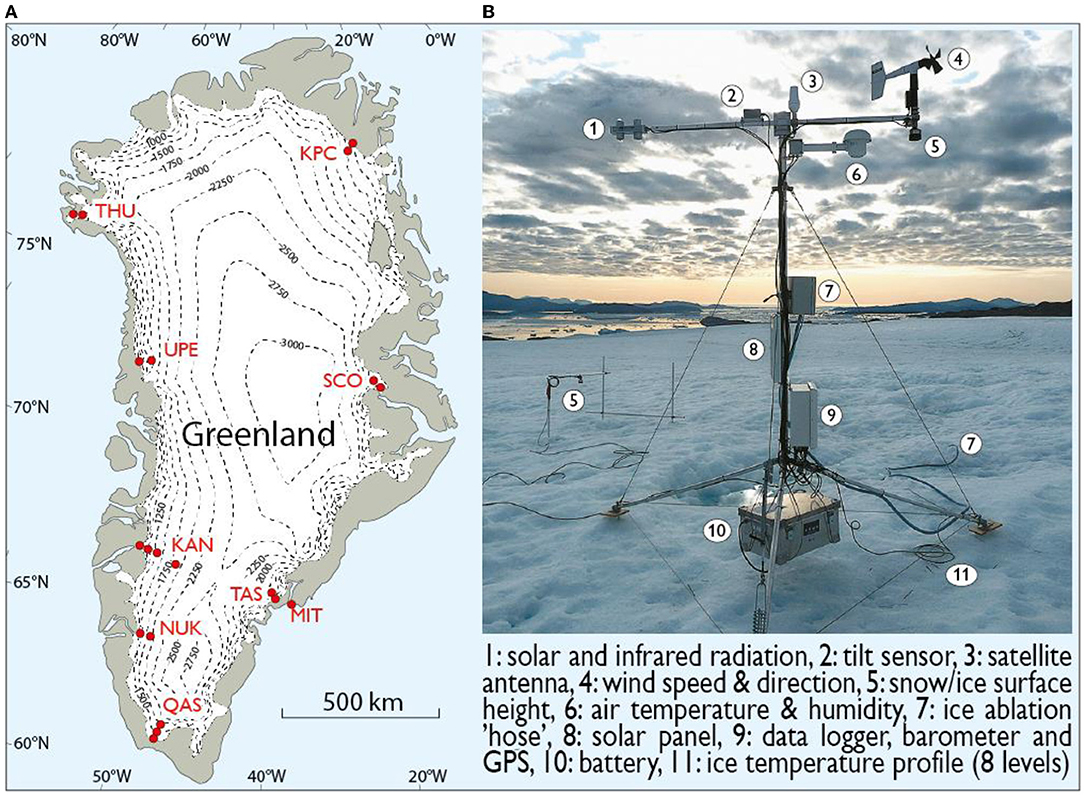
Figure 1. (A) Map of Greenland with the locations of the PROMICE automatic weather stations. Dotted lines: elevation contours. (B) Photograph of a standard PROMICE AWS.
Methods
Mittivakkat Automatic Weather Station
The Mittivakkat (MIT) automatic weather station (AWS) is part of the PROMICE network in Greenland, which currently consists of eight regions with two (or three) AWSs all located at different elevations (see Figure 1 for details) (Ahlstrøm et al., 2008). In PROMICE, the MIT location is currently the only station on a glacier in Greenland outside the main ice sheet. Mittivakkat glacier is located in SE Greenland on the island of Ammassalik (Figure 1, MIT). Mittivakkat glacier covers an area of ca. 32 km2 (e.g., Mernild et al., 2015) and the AWS is located below the long-term equilibrium altitude (ELA), resulting on average in a negative surface mass balance at the AWS site. The AWS location is 65.69 N 37.83 W 440 m a.s.l and it was established on 3 May 2009 at the start of the melt season on top of winter snowpack. During the establishment, we also made a snowpit with a snowheight of 2.7 m and a mean bulk density of 425 kg m−3.
In general, the PROMICE AWSs measure the following meteorological variables: air temperature, pressure, humidity, wind speed, and the downward and upward components of shortwave and longwave radiation, originating from the sun and earth system, respectively. The AWSs also record temperature profiles in the upper 10 m of ice, GPS-derived location and diagnostic parameters such as station tilt, which is crucial for correcting solar radiation measurements. A GEUS-developed pressure transducer and two sonic ranging devices measure snow and ice surface height change due to ablation and accumulation (Fausto et al., 2012a). The AWSs record instantaneous values of all parameters at a 10-min time interval, apart from wind speed, which is recorded as an average based on the number of propeller rotations. All data is stored locally awaiting collection during maintenance visits. On top of the 10-min data stored locally, the AWS also transmits hourly averages of the most transient variables (Figure 1, instruments: 1, 4, and 6) via the Iridium satellite between days 100 and 300 of each year, while the remaining variables are transmitted at 6-h intervals. In the wintertime, transmissions have a daily frequency to save battery power. All data and metadata specifications for all sensors is stored in the PROMICE database and is freely available for download at www.promice.dk (Fausto and Van As, 2019).
Instrumentation and Accuracy
The PROMICE AWSs are equipped with an Ørum & Jensen NT1400/NT1700 pressure transducer assembly (PTA) and two Campbell Scientific SR50A sonic ranging devices that allow us to monitor surface height change due to accumulation and ablation. The pressure transducer assembly is made of a sealed (non-freezing) liquid-filled hose with a pressure transducer located at the bottom/end (Figure 1, instrument 7). The hose is drilled into the ice and a pressure signal is then monitored by the transducer, which is exerted by the vertical liquid column over the sensor (see Fausto et al., 2012a for more detail on the setup). The depth of the pressure transducer inside the hose can be scaled to depth using the density of the antifreeze liquid and atmospheric pressure variation. The free-floating tripod of the AWS moves downward with a melting ice surface, while the hose melts out of the ice, effectively reducing the overburden pressure of the liquid column over the pressure transducer at the bottom of the hose. The reduction in pressure thus returns ice ablation estimates. Bøggild et al. (2004) constructed and deployed the first assembly in 2001 and during its first successful tests, the system was developed further resulting in a significantly improved pressure transducer assembly with an associated improvement in data quality (Fausto et al., 2012a).
Fausto et al. (2012a,b) also demonstrates that the PROMICE ice ablation measurements by pressure transducers are well-suited in remote regions outperforming other established methods. The pressure transducer assembly is especially suitable for high melt areas due to the independency of stakes drilled into the ice. For instance, at every AWS maintenance visit, we perform stake readings, which offer information on changes in the surface height. However, stake readings only produce a low-frequency record because measurements can only be achieved when stakes are visited. The PROMICE AWSs also have two SR50A sonic ranging devices, with one mounted on the tripod sensor boom, while the other is mounted on a separate stake assembly (Figure 1, Instrument 5). The manufacturer (Campbell Scientific) of the SR50A gives an accuracy of ± 1 cm or ± 0.4% of the height measured with temperature correction. Fausto et al. (2012a) tested this accuracy for periods with zero surface mass balance and found standard deviations of 1.7 cm and 0.6 cm (after spike removal) or 0.7 and 0.6% of the measured distance by the two SR50As, respectively. Precision of the readings may in general reduce over time due to sensor degradation. The challenge with surface mass balance studies using sonic ranging devices mounted on stake assemblies drilled into the ice is that the assemblies often become unstable when they melt out more than 3 m. Unstable stake assemblies often move with the wind or could even collapse during strong wind events, making the readings from the sonic ranging device unreliable. In comparison, the PTA continues to stay operational until it has melted out, reducing the need for annual station visits, in turn lowering the expense associated with logistics in Greenland considerably. The manufacturer states that the measurement uncertainty of the pressure transducer sensor is 2.5 cm, while a mean standard deviation outside of the melt season is found to be 1 cm (Fausto et al., 2012a). The relatively small standard deviation indicates a small random error, which is comparable to the sonic ranging device. Fausto et al. (2012a) also investigated the precision of the pressure transducer readings over time and found that it is reduced over time due to a degradation of the sensor because of a continuous pressure. Calibration tests of the pressure transducer show that sensor sensitivity drift amounts to 1.6% on average for a 4-years measuring period, which suggests that drift is not a large source of error. Using the combined information of measurement uncertainty of the pressure transducer and the sensor sensitivity drift, we arrive at an uncertainty on annual surface mass balance estimates of ~0.1 m ice eq.
Mittivakkat Annual Surface Mass Balance Records for 2009–2019
We present the MIT annual surface mass balance record in Table 1. The surface mass balance record is based on the corrected measurements of the PTA from the PROMICE AWS dataset product (Fausto and Van As, 2019). When the PTA fails, we supplement the annual surface mass balance estimate with sonic ranger readings and with manual stake readings obtained during maintenance visits. We calculate the annual surface mass balance as the difference in height between the end-of-melt-season minimum surface level in the given year and the previous year (Figure 2).
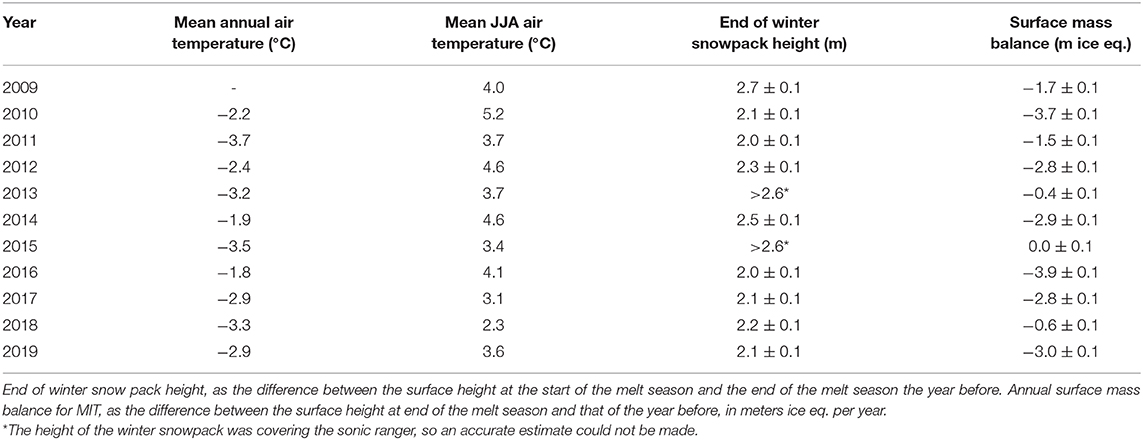
Table 1. Mean annual and June, July, August (JJA) air temperatures.
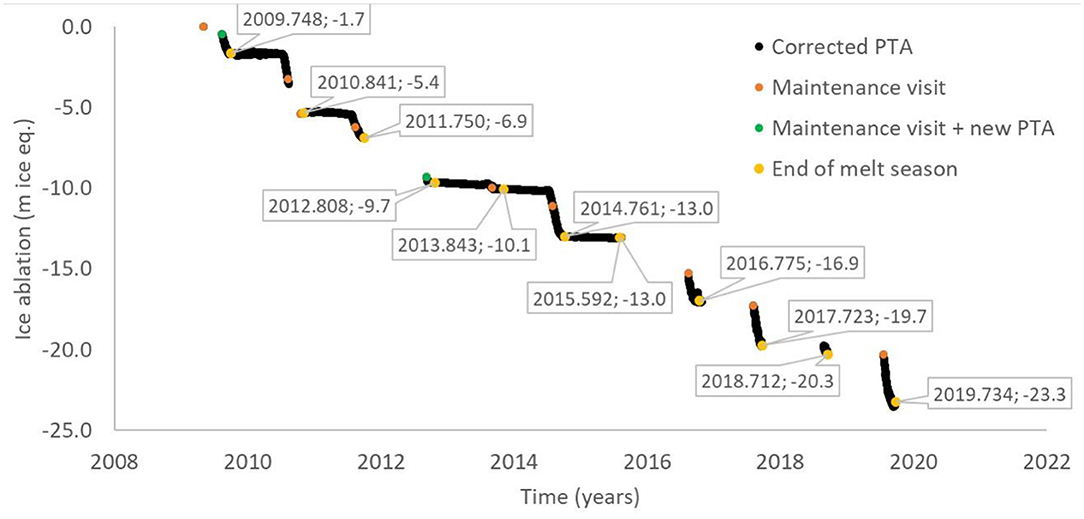
Figure 2. Corrected pressure transducer assembly (PTA) readings following Fausto et al. (2012a). PTA readings were vertically shifted for new PTAs drilled into the ice in order to align the data into a continuous cumulative ice ablation record.
Table 1 and Figure 2 shows that 2016 was the largest mass loss year followed by 2010 and 2019 for the 10-years PROMICE dataset. For instance, the record-warm summer of 2012 (in most regions of Greenland) is only ranked the sixth largest mass loss due to a large amount of winter/spring snow at the MIT location that had to melt before negative surface mass balance can occur (Table 1). All years showed net mass loss except for 2015, which ended with a zero surface mass balance (Table 1). Since snow was present at the surface during maintenance in 2015, we used both sonic rangers on the AWS to confirm that all snow at the surface melted, while no ice under the snowpack was lost before the melt season ended (Figure 2 and Table 1). The years 2010 and 2016 were both characterized by below average winter accumulation with a long period of positive air temperatures during the year, which are both important for net mass loss (Tedesco et al., 2011; Van As et al., 2011). It is the combination of low winter accumulation and relatively high temperatures, which causes low albedo on the glacier in 2010, 2014, and 2016, that resulted in large annual surface mass balance estimates. The inter-annual surface mass balance for the MIT station were successfully obtained every year yielding a 100% success rate with an overall total mass loss of 23.3 m ice equivalent for the whole period at this location.
Conclusions
The annual surface mass balance were estimated using the PROMICE data product (Fausto and Van As, 2019) and the fieldwork maintenance reports. PROMICE remains committed to maintaining a well-documented database for storing and disseminating Greenland glaciological and meteorological data freely available on https://www.promice.org/PromiceDataPortal.
Data Availability Statement
All datasets generated for this study are included in the article/supplementary material.
Author Contributions
RF derived the annual ablation totals and wrote the data report with help from JA and AA. All authors contributed to the article and approved the submitted version.
Conflict of Interest
The authors declare that the research was conducted in the absence of any commercial or financial relationships that could be construed as a potential conflict of interest.
Acknowledgments
The Programme for Monitoring of the Greenland Ice Sheet (PROMICE) was funded by the Geological Survey of Denmark and Greenland (GEUS) and the Danish Ministry of Climate, Energy and Utilities under the Danish Cooperation for Environment in the Arctic (DANCEA), and is conducted in collaboration with the National Space Institute (DTU Space) and Asiaq (Greenland Survey).
References
Ahlstrøm, A. P., Gravesen, P., Andersen, S. B., Van As, D., Citterio, M., Fausto, R. S., et al. (2008). A new programme for monitoring the mass loss of the Greenland ice sheet. Geol. Surv. Denmark Greenland Bull. 15, 61–64. doi: 10.34194/geusb.v15.5045
AMAP (2019). AMAP Climate Change Update 2019: An Update to Key Findings of Snow, Water, Ice and Permafrost in the Arctic (SWIPA) 2017. Oslo, Arctic Monitoring and Assessment Programme (AMAP), 12pp.
Bøggild, C. E., Olesen, O. B., Ahlstrøm, A. P., and Jørgensen, P. (2004). Automatic glacier ablation measurements using pressure transducers. J. Glaciol. 50, 303–304. doi: 10.3189/172756504781830097
Fausto, R. S., and Van As, D. (2019). Programme for monitoring of the Greenland ice sheet (PROMICE): automatic weather station data. GEUS. doi: 10.22008/PROMICE/DATA/AWS
Fausto, R. S., Van As, D., Ahlstrøm, A. P., Andersen, S. B., Andersen, M. L., Citterio, M., et al. (2012b). Ablation observations for 2008-2011 from the Programme for Monitoring of the Greenland Ice Sheet (PROMICE). Geol. Sur. Denmark Greenland Bull. 26, 73–76. doi: 10.34194/geusb.v26.4765
Fausto, R. S., Van As, D., Ahlstrøm, A. P., and Citterio, M. (2012a). Assessing the accuracy of Greenland ice sheet ice ablation measurements by pressure transducer. J. Glaciol. 58, 1144–1150. doi: 10.3189/2012JoG12J075
IPCC (2019). “IPCC special report on the ocean and cryosphere in a changing climate,” in D. C. Pörtner, V. Roberts, P. Masson-Delmotte eds.
Machguth, H., Thomsen, H. H., Weidick, A., Abermann, J., Ahlstrøm, A. P., Andersen, M. L., et al. (2016). Greenland surface mass balance observations from the ice sheet ablation area and local glaciers. J. Glaciol. 62, 861–887. doi: 10.1017/jog.2016.75
Mernild, S. H., Malmros, J. K., Yde, J. C., Wilson, R., Knudsen, N. T., Hanna, E., et al. (2015). Albedo decline on Greenland's Mittivakkat Gletscher in a warming climate. Int. J. Climatol. 35, 2294–2307. doi: 10.1002/joc.4128
Tedesco, M., Fettweis, X., Van den Broeke, M. R., Van de Wal, R. S. W., Smeets, C. J. P. P., Van de Berg, W. J., et al. (2011). The role of albedo and accumulation in the 2010 melting record in Greenland. Environ. Res. Lett. 6:014005. doi: 10.1088/1748-9326/6/1/014005
Van As, D., Fausto, R. S., Ahlstrøm, A. P., Andersen, S. B., Andersen, M. L., Citterio, M., et al. (2011). Programme for Monitoring of the Greenland Ice Sheet (PROMICE): first temperature and ablation records. Geol. Surv. Denmark Greenland Bull. 23, 73–76. doi: 10.34194/geusb.v23.4876
Wouters, B., Gardner, A. S., and Moholdt, G. (2019). Global glacier mass loss during the GRACE satellite mission (2002–2016). Front. Earth Sci. 7:96. doi: 10.3389/feart.2019.00096
Keywords: Greenland, automatic weather station (AWS), surface mass balance, ablation, mittivakkat glacier
Citation: Fausto RS, Abermann J and Ahlstrøm AP (2020) Annual Surface Mass Balance Records (2009–2019) From an Automatic Weather Station on Mittivakkat Glacier, SE Greenland. Front. Earth Sci. 8:251. doi: 10.3389/feart.2020.00251
Received: 19 December 2019; Accepted: 08 June 2020;
Published: 14 July 2020.
Edited by:
Fanny Brun, Université Grenoble Alpes, FranceReviewed by:
Ellyn Mary Enderlin, University of Maine, United StatesDavid F. Porter, Columbia University, United States
Copyright © 2020 Fausto, Abermann and Ahlstrøm. This is an open-access article distributed under the terms of the Creative Commons Attribution License (CC BY). The use, distribution or reproduction in other forums is permitted, provided the original author(s) and the copyright owner(s) are credited and that the original publication in this journal is cited, in accordance with accepted academic practice. No use, distribution or reproduction is permitted which does not comply with these terms.
*Correspondence: Robert S. Fausto, cnNmQGdldXMuZGs=