 Hao Yang
 Guanyu Xu3
- 1Hubei Key Laboratory for Heavy Rain Monitoring and Warning Research, Institute of Heavy Rain, China Meteorological Administration, Wuhan, China
- 2WeatherOnline Institute of Meteorological Applications, Wuxi, China
- 3Wuhan Central Meteorological Observatory, Wuhan, China
- 4Tongren Meteorological Administration, Tongren, China
- 5Changzhi Meteorological Administration, Changzhi, China
Under the background of global warming, the studies of quantitative water vapor transport characteristics in arid and semi-arid Central Asia are rare. We examine the spatiotemporal variation of precipitation in Central Asia from 1979 to 2017 based on Global Precipitation Climatology Project (GPCP) and circulation reanalysis data. We simulate the sources and transport of water vapor in different regions of Central Asia in winter and summer using the Hybrid Single-Particle Lagrangian Integrated Trajectory (HYSPLIT) model. The seasonal variation in precipitation over the whole region of Central Asia shows a single minimum in September, with little change in the amount of precipitation in other months; however, there are clear regional and seasonal differences in precipitation in western (region I) and eastern (region II) Central Asia. In region I, the maximum and minimum amounts of precipitation are observed in winter and summer, respectively, whereas in region II, the maximum amount of precipitation occurs in summer and the minimum in winter. The amount of precipitation in winter increased significantly more than the amount of precipitation in summer in both regions I and II from 1979 to 2017. Quantitative calculations of water vapor transport show that Europe and the North Atlantic Ocean are the largest sources of water vapor for regions I and II and contribute > 50% of the transport of water vapor in both winter and summer. The contribution of water vapor from other sources varies greatly in different seasons. For region I, the second highest contribution to water vapor in winter is transport from the South Atlantic Ocean, while in summer is from the Arctic Ocean and northern Asia. For region II, water vapor from the local area (Xinjiang) makes an important contribution in summer. These differences in the transport of water vapor are related to seasonal adjustments in the atmospheric circulation system. In winter, straight westerly winds can bring large amounts of water vapor from the Atlantic Ocean and the Mediterranean and Caspian seas. In summer, the northerly currents from the Arctic Ocean are strong due to the anticyclonic circulation maintained in Central Asia. The water vapor flux budget across each border and the net budget in region I are higher than those in region II in winter. The response of water vapor transport to global warming in Central Asia shows a north shift during past 40 years.
Introduction
Studies of the Earth’s hydrological cycle, water resources and changes in precipitation are challenging and are particularly important under the current rapid rate of global warming (Chen et al., 2011); the warming rate during the past 30 years was the highest during the 20th century (IPCC, 2013). Central Asia is located in the largest temperate arid region in the world and is extremely sensitive to changes in the Earth’s climate (Bernauer and Siegfried, 2012; Zhao et al., 2014; Zhao and Zhang, 2015). Numerous studies have been conducted to try to understand the instability of water resources in Central Asia (Chen et al., 2010; Wang et al., 2010; Gessner et al., 2013; Huang et al., 2014; Li et al., 2018). Precipitation in Central Asia is influenced by a westerly circulation and the North Atlantic Oscillation, which is significantly different from the situation in East Asia (Aizen et al., 2001; Huang et al., 2013). Some studies have examined the different spatial and temporal variations in precipitation in different parts of Central Asia (Bothe et al., 2012; Ursula et al., 2013; Chen et al., 2018). Ma and Fu (2007) found that the trend for droughts in central Eurasia is increasing. The annual precipitation and number of extreme precipitation events in the arid regions of northwest China are also increasing, but the growth rates in each season are different (Xu et al., 2010; Wang et al., 2013; Chen et al., 2014; Huang et al., 2015, 2016; Li et al., 2016). The increasing or decreasing trend of precipitation in Central Asia during the past 80 years mainly depends on the changing trend in winter precipitation (Chen et al., 2011; Xu et al., 2015; Yao and Chen, 2015).
Precipitation is the result of the transformation of water vapor in the atmosphere and both the transport of water vapor and its source are important factors (Xu et al., 2008a, 2016; Chen et al., 2012). Based on moisture budget analysis, Peng et al. (2018) showed that the warming induced of the Earth’s climate by humans has increased the specific humidity over all of Central Asia, which, in turn, has increased the amount of precipitation in eastern Central Asia. The sources of water vapor in spring, autumn and winter in Central Asia include the Arctic Ocean, the Mediterranean Sea, the Black Sea and the Caspian Sea, whereas the water vapor in summer mainly comes from the Atlantic Ocean and continental Europe in the mid- and high latitudes (Shi and Sun, 2008; Guan et al., 2019). Dai et al. (2011) analyzed the constant water vapor field in the troposphere from Xinjiang to the Atlantic Ocean and found that the main sources of water vapor in Xinjiang were from lakes and oceans to the west. With the current trend in global warming, more water vapor is sourced from high latitudes, such as the North Atlantic and Arctic oceans. Besides the sources, the altitude is also an important factor for water vapor transport. For example, in the Tien Shan region of Central Asia, the largest water vapor budget is observed in the mid-troposphere, and the next highest occurs in the lower troposphere (Yang et al., 2013; Xie et al., 2018).
Most previous studies, although important in revealing the relationship between precipitation and the regional water vapor balance, were limited by their use of a Eulerian approach, which is unable to assess the origin of moisture from remote source regions (James et al., 2004; Xu et al., 2008b; Chen et al., 2010; Jiang et al., 2019). Trajectory analysis methods based on a Lagrangian framework have been developed to provide a good technical approach to study the transport of water vapor and source–sink analysis (Stohl and James, 2004; Jiang et al., 2013; Huang and Cui, 2015; Stein et al., 2015; Yang et al., 2019). Several models, such as the Hybrid Single-Particle Lagrangian Integrated Trajectory (HYSPLIT) (Draxler and Hess, 1998) or FLEXible PARTicle (Stohl et al., 2005) models allow the calculation of back-trajectories. Yang et al. (2014) used the HYSPLIT model to analyze sources of water vapor and their transport to explain abnormal precipitation in East China. This model was also used to simulate the trajectories of air parcels in the rainy season in northern China to investigate the sources of moisture, their variation and the eventual relationship with precipitation in this region (Jiang et al., 2017).
Studies using a Lagrangian approach for the quantitative analysis of water vapor transport are mainly concentrated in the East Asian monsoon region. By contrast, few studies have addressed the sources of moisture in arid and semi-arid Central Asia under a global warming scenario. The main purpose of this study was therefore to determine the spatiotemporal characteristics of the variation in precipitation in Central Asia and to quantitatively evaluate the transport of water vapor from different sources. The remainder of the paper is organized as follows. The datasets and methods are introduced in Section “Data and Methods.” Section “Spatiotemporal Variation of Precipitation in Central Asia” describes the spatiotemporal variation in precipitation. Section “Water Vapor Transport Based on Lagrangian Analysis” illustrates the characteristics of water vapor transport based on a Lagrangian analysis. Our conclusions and discussion are presented in Section “Discussion and Conclusion.”
Data and Methods
Data
The monthly mean precipitation data used in this study are provided by the Global Precipitation Climatology Project (GPCP Version 2.3) with a horizontal resolution of 1° × 1° for the time period 1979–2017, which has been assessed the processing and accuracy by Adler et al. (2018). The datasets used to drive the HYSPLIT_4.9 model are from the National Centers for Environment Prediction and National Center for Atmospheric Research (NCEP/NCAR) and include the air temperature, height, the zonal and meridional winds with 17 levels in the vertical direction (1000–10 hPa), the relative humidity at eight levels (1000–300 hPa) and the vertical speed (ω) with 12 levels (1000–100 hPa)1. These data are available from 1948 at a temporal resolution of 6 h and a spatial resolution of 2.5°. The European Centre for Medium Range Weather Forecasts ERA-Interim 6-hourly reanalysis product (with a horizontal resolution of 1° and 37 vertical levels from 1000 to 1 hPa) is used in the synoptic analysis and dynamical diagnosis. The variables used include the temperature, geopotential height, wind and specific humidity (Berrisford et al., 2011).
Lagrangian Trajectory Calculation
The National Oceanic and Atmospheric Administration Air Resources Laboratory’s HYSPLIT model (Draxler and Hess, 1998) is a complete system for computing simple air parcel trajectories as well as complex transport, dispersion, chemical transformation and deposition simulations. This model is run with the NCEP/NCAR reanalysis data in this work. The HYSPLIT_4.9 model assumes that a parcel passively follows the winds; the starting points are not necessarily located on the data grid points because the HYSPLIT model uses a bilinear interpolation to calculate meteorological variables at times and locations between the standard times and grid points available in the gridded datasets. The final position is computed from the mean velocity at the initial position (P) and first-guess position (P′):
where V is velocity of air parcels, the integration time step Δt is variable (Δt < 0.75Umax), where Umax represents one meteorological grid, here Δt = 6 h. Three-dimensional back-trajectories are calculated to track the sources of mid-level (1500 m and 3000m above the ground) moisture. The contribution of the water vapor (Q) carried by air parcels is calculated as:
where q is the specific humidity carried by each air parcel, m is the number of air parcels for different moisture sources and n is the total number of all air parcels. Water vapor is lost or replenished as a result of precipitation or evaporation during transportation, so the contribution of water vapor at the initial (Qi) and final (Qf) locations of the air parcels are calculated simultaneously. The calculation method for the water vapor contribution has been described in detail by (Jiang et al., 2017).
Water Vapor Fluxes
For the purpose of comparison with the Lagrangian method, moisture fluxes and budget within the Eulerian framework in Central Asia are calculated. Just like the target region for Lagrangian backtracking trajectories, we select the rectangular zone, representing Central Asia (32–50° N, 48–95° E). The water vapor flux vector Q, used to explore the temporal variation and the spatial distribution of water vapor over Central Asia, can be defined by:
where g is gravitational acceleration (cm⋅s–1), ps is surface pressure, pt is the pressure at the top of the troposphere (hPa), is the wind vector (m⋅s–1), and q is specific humidity (g⋅kg–1). The vector Q [kg⋅(m⋅s)–1] can be devided into zonal water vapor flux vector Qλ and meridional water vapor flux vector Qφ. The vertical integration of moisture through the four boundaries can be calculated.
Spatiotemporal Variation of Precipitation in Central Asia
Spatial Distribution of Precipitation in Central Asia
The study area covers Xinjiang in western China and five countries in Central Asia (Kazakhstan, Uzbekistan, Turkmenistan, Kyrgyzstan, and Tajikistan). This region accounts for one-third of the world’s arid land. It is a typical inland arid area with a fragile ecological environment and is very sensitive to climate change (Miao et al., 2017). Precipitation has a significant impact on the local ecological environment and ecosystems (Turkes et al., 2009; Li et al., 2017).
The topography of Central Asia is complex and the distribution of precipitation is non-uniform (Figure 1). The highest mean annual precipitation (Figure 1A) occurs in the north and south of Central Asia. For example, the precipitation in northern Kazakhstan, Kyrgyzstan and Tajikistan exceeds 1.2 mm day–1 and most of the abundant precipitation is orographic as a result of the influence of the Tian Shan Mountains and the Pamir Plateau (Chen et al., 2011). The precipitation is low in eastern and western Central Asia where the terrain is dominated by plains and deserts. The mean annual precipitation in the Taklimakan desert in Xinjiang is <0.4 mm day–1.
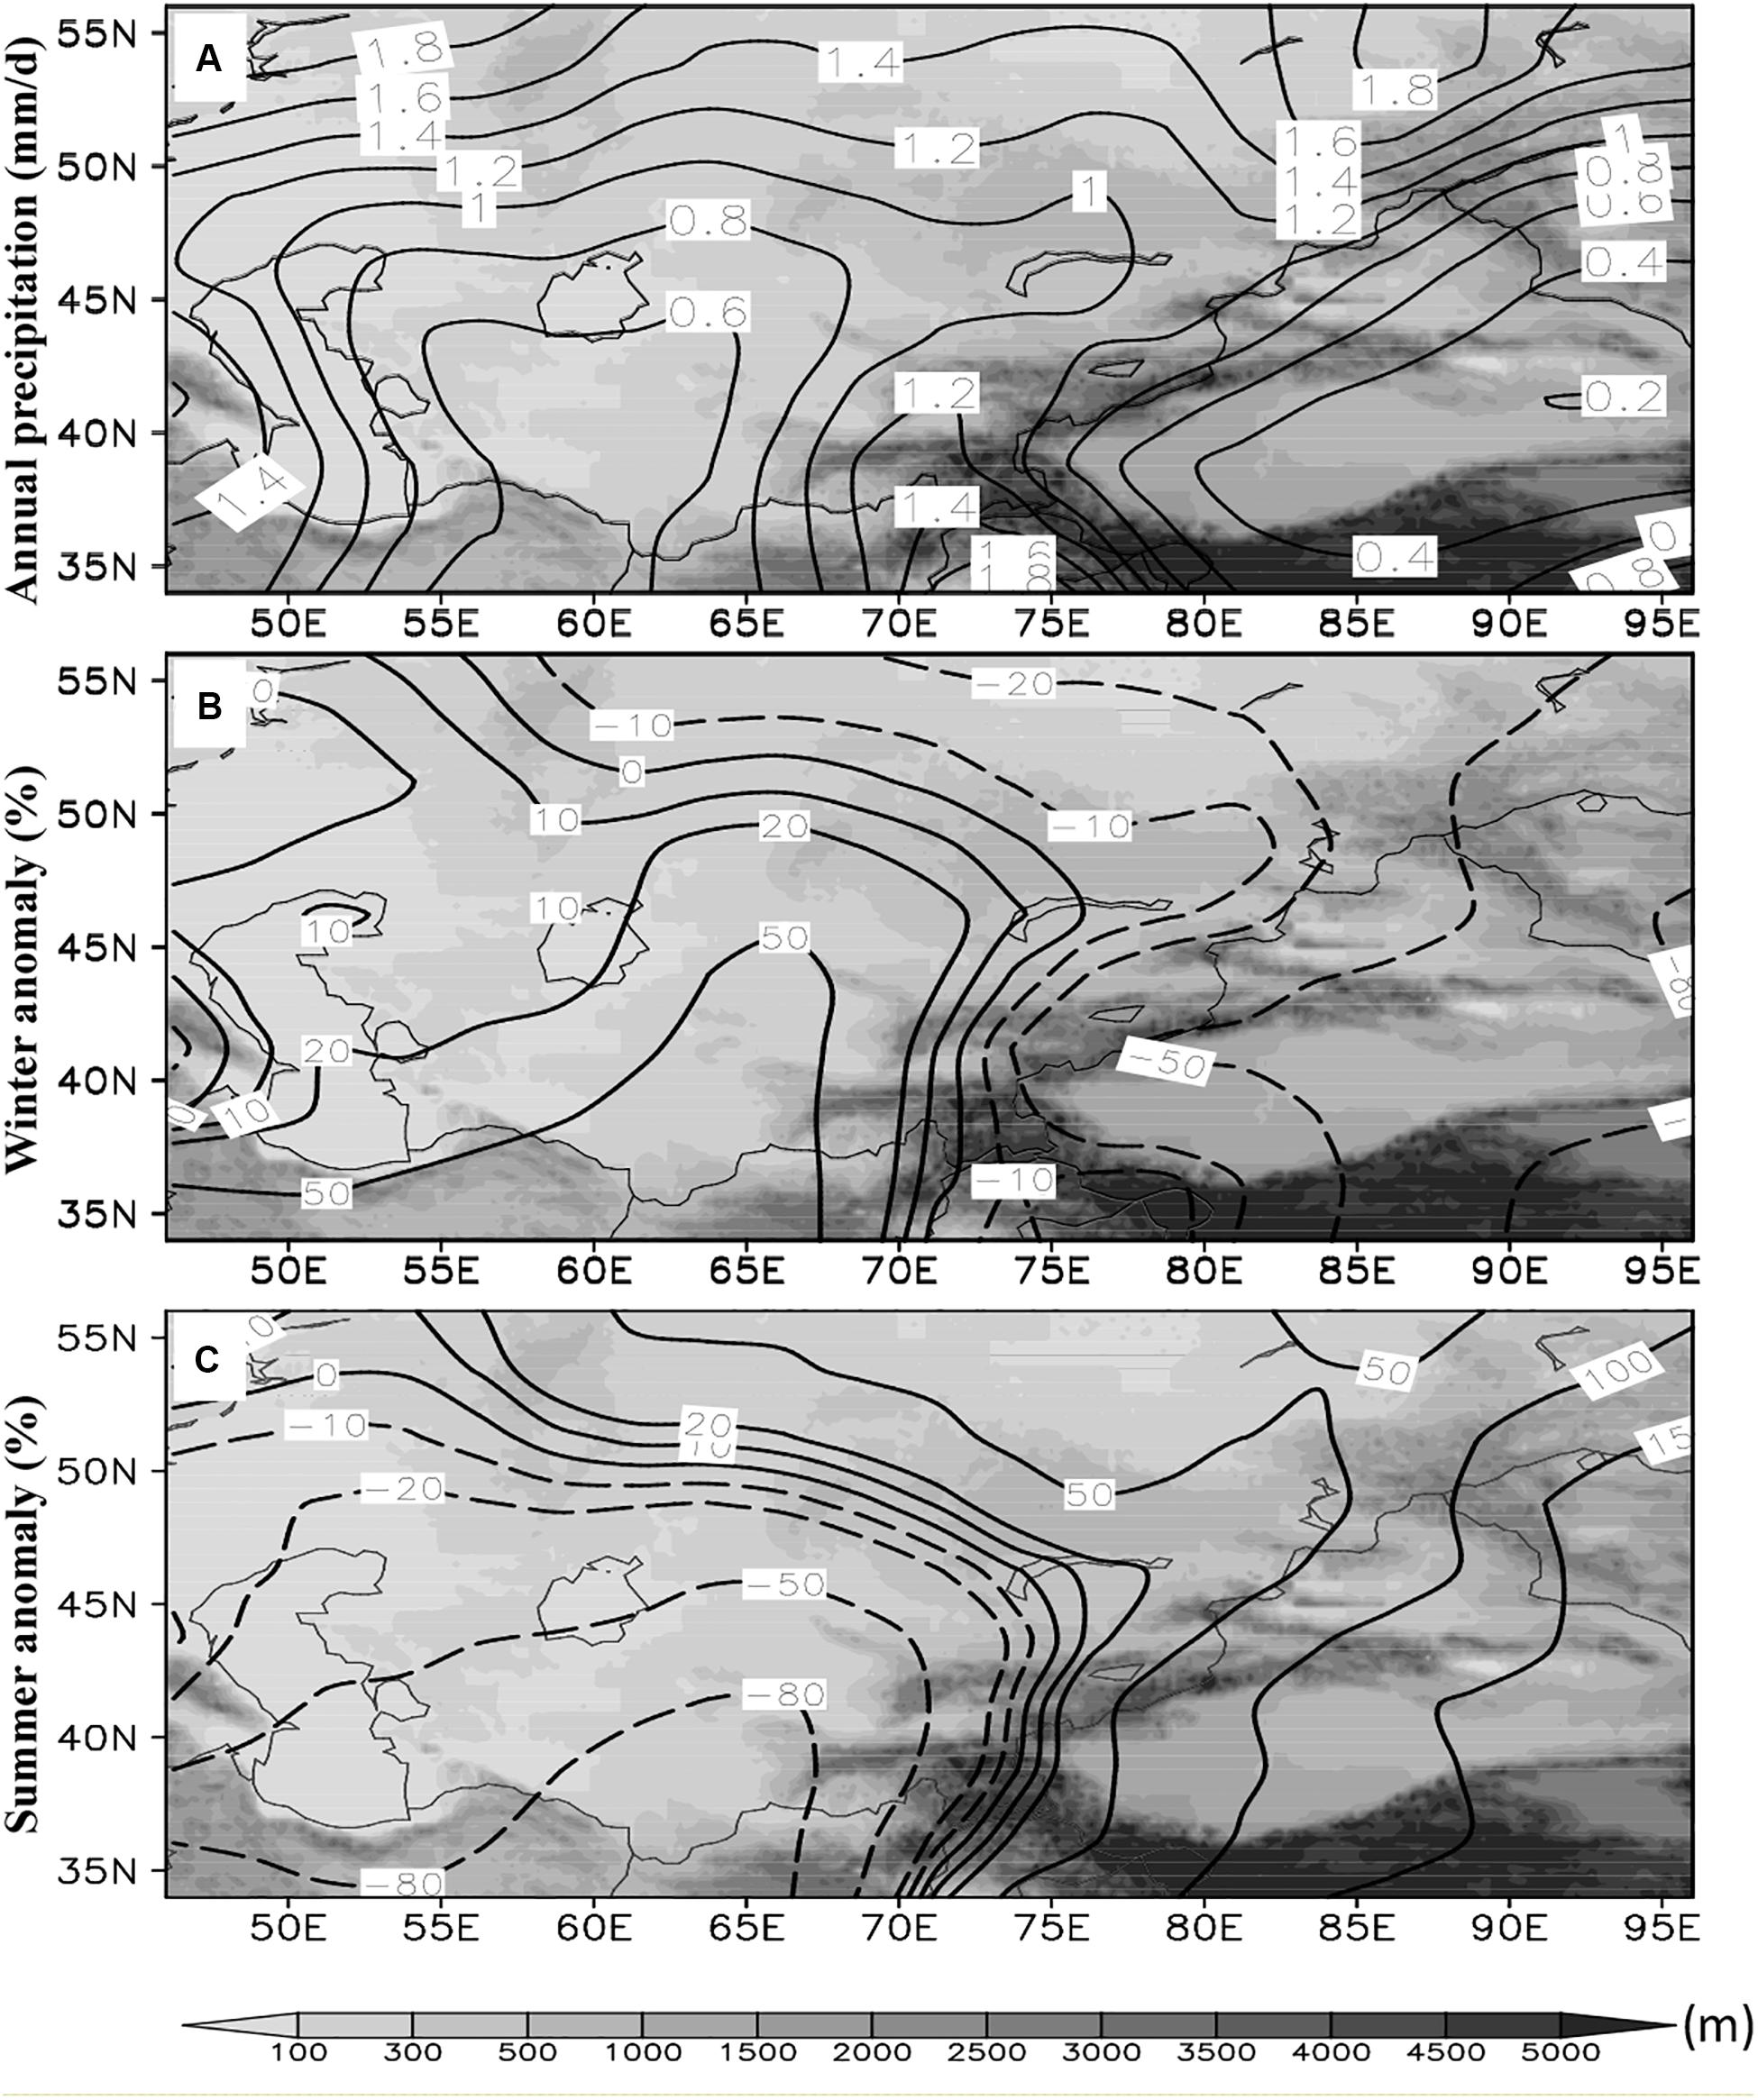
Figure 1. Distribution of the (A) daily precipitation throughout the year (contours; units: mm day–1) and anomalies of daily precipitation (contours; units: %) in (B) winter and (C) summer in Central Asia from 1979 to 2017. Topographic features are shown by shading (units: m).
The precipitation varies between winter (December–January–February) and summer (June–July–August). In winter, the daily precipitation in the west of Central Asia is more than those in the eastern part (Figure 1B). It is common that in the west and middle of Central Asia, the daily precipitation in winter is 10–50% more than that throughout the year, especially over 50% more in the southwestern part. By contrast, the precipitation in eastern Central Asia is 50% less. In summer, there is higher precipitation in eastern Central Asia, but lower precipitation in western Central Asia (Figure 1C). The daily precipitation in summer is 100% more than that throughout the year in Xinjiang, while in western Central Asia is 20–100% less. This difference between winter and summer is mainly a result of the westerly circulation, North Atlantic Oscillation and the East Asian monsoon (Aizen et al., 2001; Böhner, 2006).
Temporal Variation in Precipitation
This analysis shows clear differences in the distribution of precipitation between eastern and western Central Asia in winter and summer. We therefore divide Central Asia into two regions for convenience: western Central Asia is referred to as region I and eastern Central Asia is referred to as region II (Figure 2A). The monthly change in total area in regions I and II is calculated separately in further analyses of the seasonal variation in the distribution of precipitation (Figure 2B).
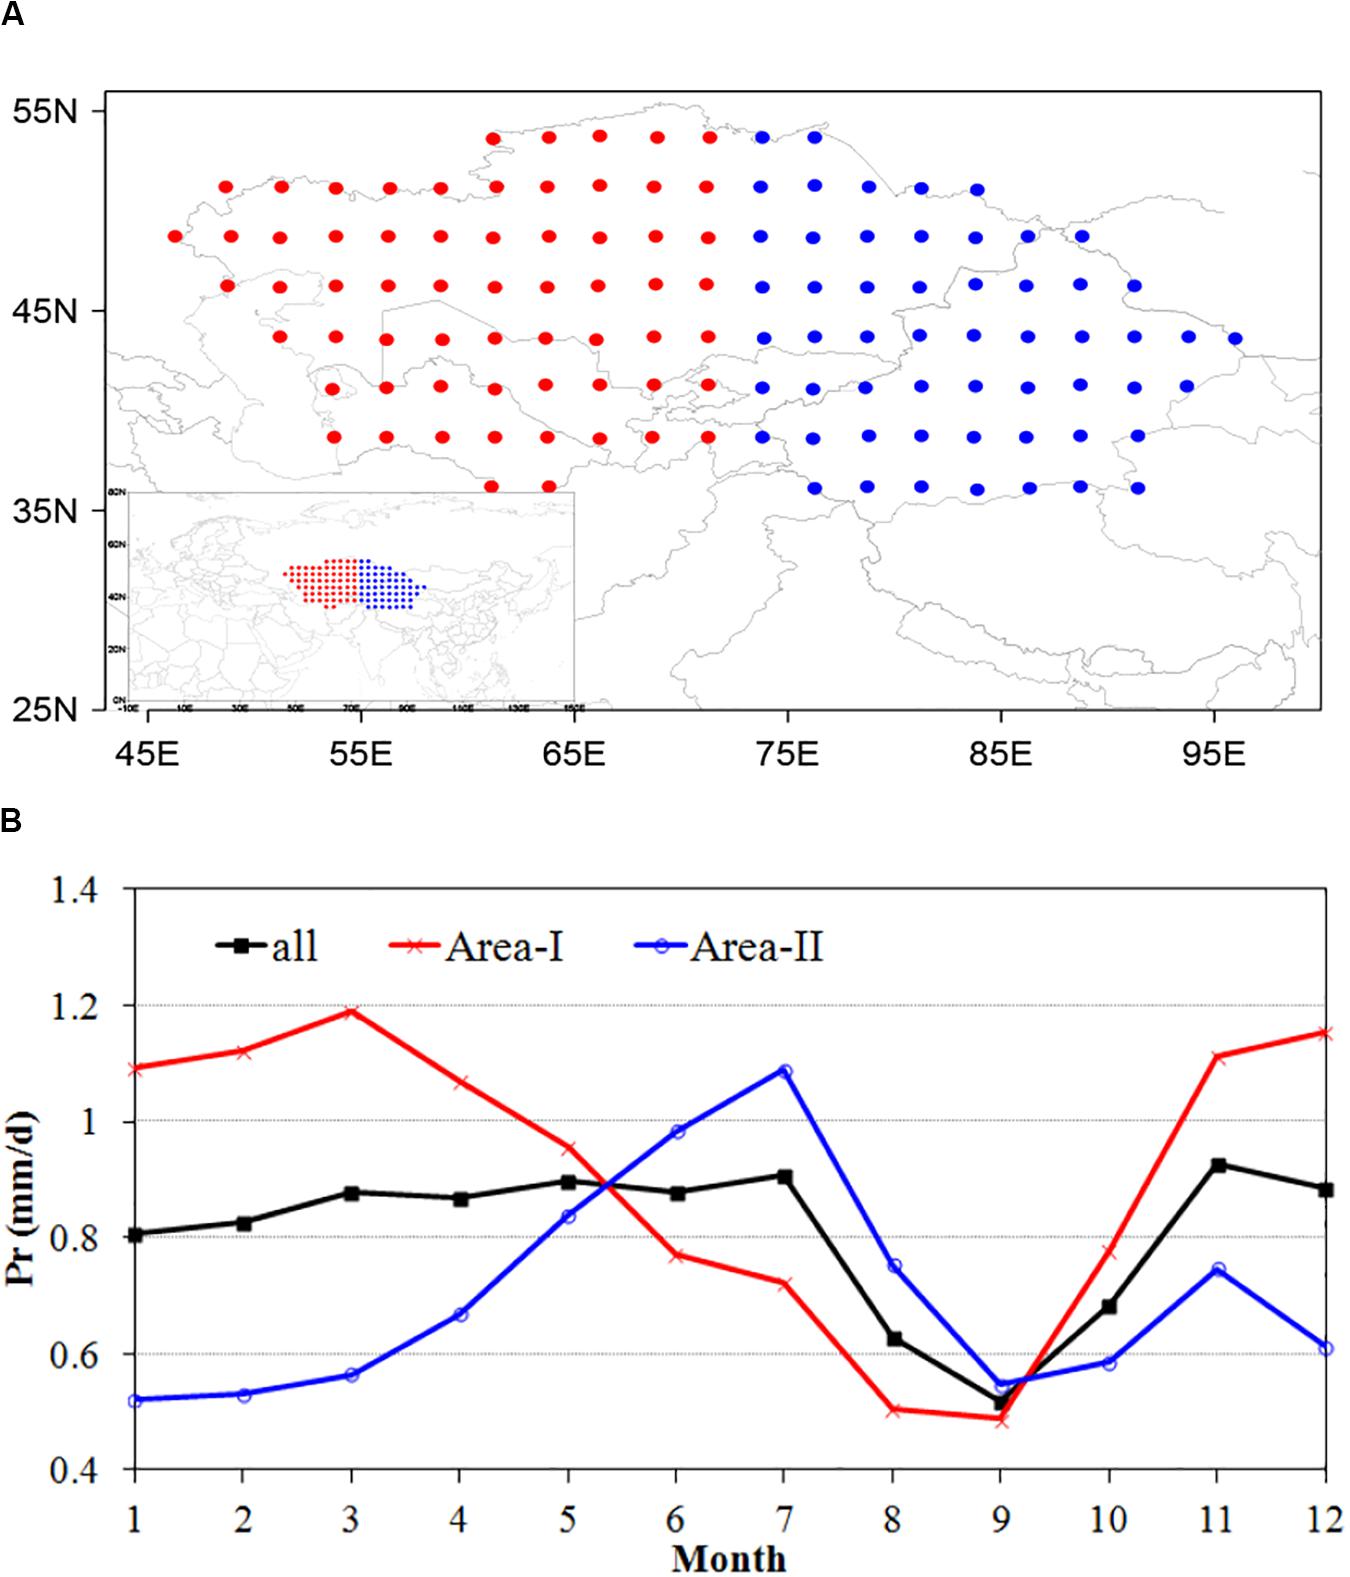
Figure 2. (A) Climatological setting for the two subdivisions (red, region I; blue, region II) of Central Asia and (B) their annual cycles of precipitation (mm day–1). The grid points in part (A) are chosen to match those for the precipitation statistics and the HYSPLIT simulation.
The variation in the monthly mean precipitation in area-averagedCentral Asia shows little change in the first half of the year and is between 0.8 and 1.0 mm day–1 from January to July. It decreases significantly in August and the minimum precipitation (0.52 mm day–1) occurs in September. The precipitation gradually increases from October. By contrast, regions I and II show a reverse seasonal variation. The maximum precipitation in region I (1.19 mm day–1) occurs in March and the minimum precipitation (0.49 mm day–1) is observed in September. However, the maximum precipitation in region II occurs in July, whereas the minimum precipitation occurs in January. In terms of the seasonal mean, considerable precipitation falls during the winter in region I and very little precipitation occurs in summer, whereas in region II the maximum and minimum precipitation occur in summer and winter, respectively (Table 1). The annual mean precipitation in region I is 0.91 mm day–1, but only 0.70 mm day–1 in region II.

Table 1. Seasonal precipitation (mm day–1) in region I, region II, and entire Central Asia.
Under the current background of global warming, climate change having a significant impact on precipitation in Central Asia (Chen et al., 2009; Song and Bai, 2016). Figure 3 shows the interannual variation in winter and summer precipitation in regions I and II from 1979 to 2017. The precipitation in winter and summer in region I has increased by 0.61 and 0.33 mm decade–1, respectively. The precipitation in region II shows a larger jump, increasing by 1.72 and 1.40 mm decade–1 in winter and summer, respectively, significant at the 10% level. Winter precipitation shows the fastest rate of increase and summer precipitation the slowest. The increase in precipitation in Central Asia is in contrast with the decreasing trend for precipitation in north and northeast China and arid area of Africa (Xu et al., 2016; Jiang et al., 2017). Therefore the response of precipitation to global warming in Central Asia is different from those in non-arid region, as well as other arid region. Su and Wang (2007) found that the increasing humidity in northwestern China since the 1980s is closely associated with the shift of ENSO from a cold to warm phase at the same time. Besides the climatic trend exists in precipitation, there are also significant periodic changes, such as 2–3 years cycles in winter and summer precipitation in both regions I and II (not shown).
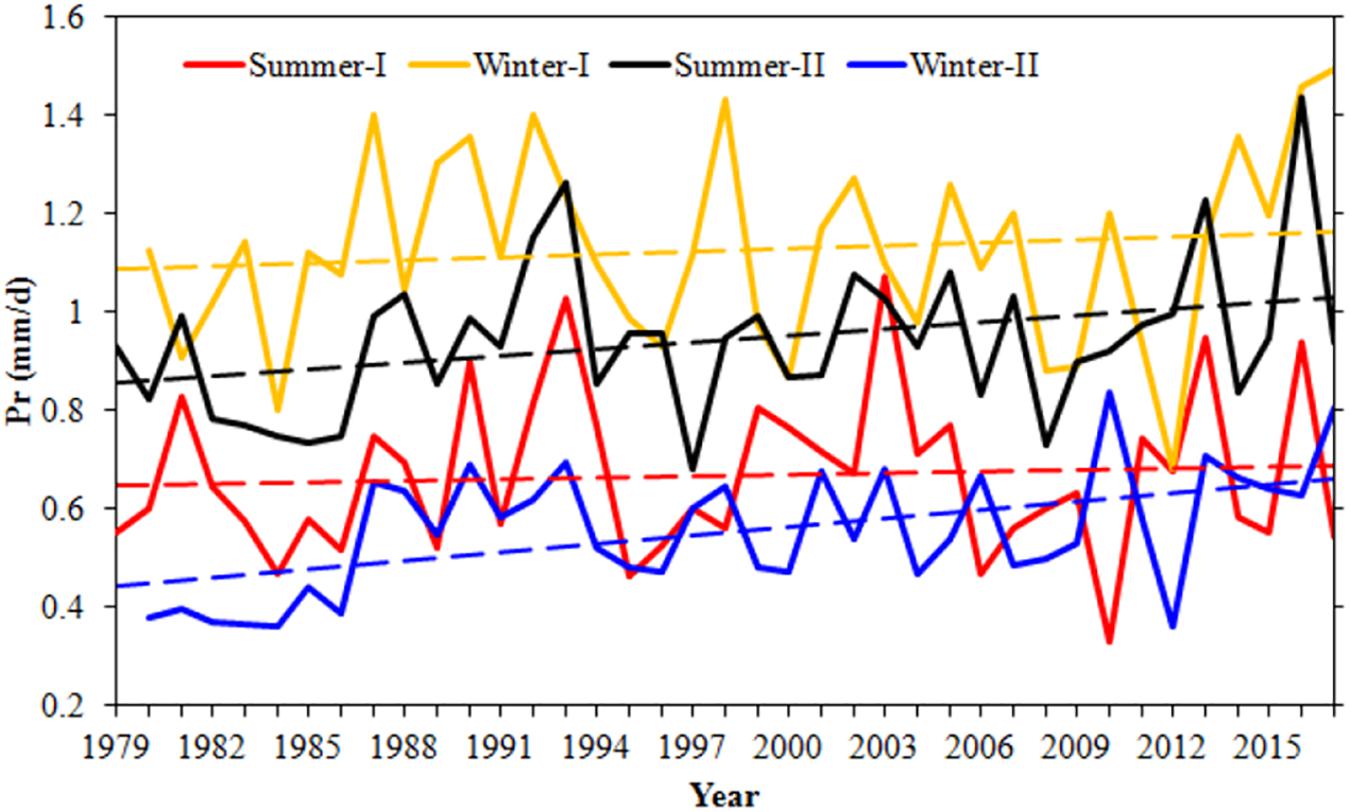
Figure 3. Variation and linear trends of winter and summer precipitation in regions I and II of Central Asia during the time period 1979–2017 (dotted lines are the linear fits).
We calculated the statistical correlation coefficient between the precipitation time series from different regions and seasons in Central Asia (Table 2). In winter, regions I and II are strongly influenced by the Siberian anticyclonic circulation. As a result, the winter precipitation in regions I and II is highly correlated (correlation coefficient 0.63). The correlation coefficient between precipitation in region I in winter and precipitation in region II in summer is 0.36, whereas the correlation coefficient between precipitation in region II in winter and summer is 0.39. That because strong winter Asian monsoon will strengthen the summer monsoon in the following summer, which results in excess precipitation in Central Asia.
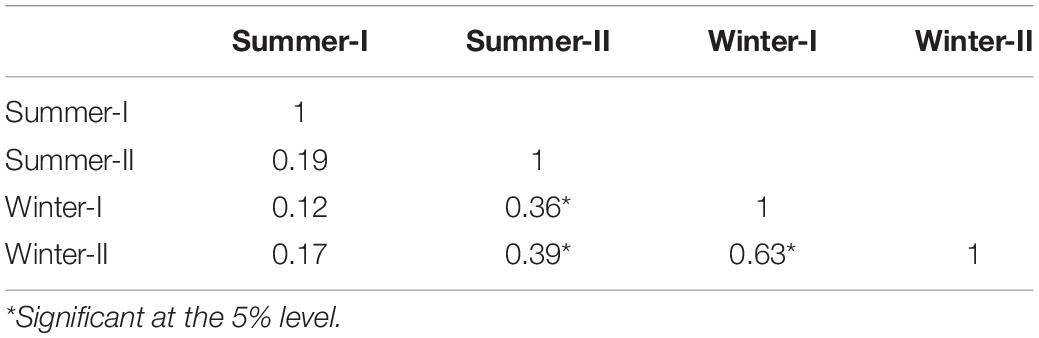
Table 2. Correlation coefficients between the time series of summer and winter precipitation in regions I and region II.
The seasonal variation in precipitation over the whole of Central Asia therefore shows a single minimum in September, but little change in other months. There are clear regional and seasonal differences in precipitation between the western and eastern regions of Central Asia. In region I, the maximum and minimum precipitation are observed in winter and summer, respectively, whereas for region II the maximum precipitation occurs in summer and the minimum in winter. Winter precipitation has increased significantly faster than summer precipitation during the time period 1979–2017.
Water Vapor Transport Based on Lagrangian Analysis
Water Vapor Trajectory Simulation Program
An abundant supply of water vapor is a necessary condition for precipitation. We use the HYSPLIT model to simulate and track the trajectories of water vapor carried by air masses in Central Asia in winter and summer during the time period 1979–2017. As a result of the very large number of simulated trajectories over a long period of time, it is difficult to use the clustering method to conduct statistical analyses of the sources of water vapor. Jiang et al. (2013) proposed a tracking method for massive air parcels and discussed the climatological characteristics of water vapor transport in the Mei-yu season over the Yangtze River basin. This method provides a good technical method of analyzing the variation in moisture over a long timescale.
Central Asia is selected as the simulated target area and the winter and summer simulations are carried out separately in regions I and II. A total of 63 and 57 points with a spatial resolution 2° × 2° are identified as the starting points of the trajectories in the two regions (Figure 2A). As most of the moisture is concentrated in the mid- and lower troposphere and the study area spans many mountains and basins in Central Asia (Figure 1), heights of 1500 and 3000 m above ground are selected as the initial height of the simulation. The position of the air parcels is output every 6 h, with 10-day back-trajectories at each grid point. We obtain the specific humidity at the corresponding position using physical variables such as the relative humidity and temperature. It is worth mentioning that the water transport analyzed in this study cannot sure generate precipitation in central Asia, but can reflect the water source related to precipitation to some extent.
Assessment of Sources of Moisture in Winter and Summer
The water vapor source distribution of Central Asia in winter and summer can be clearly identified by the back-trajectory simulation and tracking the air parcels. Figure 4A shows the climatological spatial distribution of water vapor (specific humidity) carried by the air parcels on day 10 before reaching region I in winter. The water vapor is mainly distributed over western Eurasia, northern Africa and the North Atlantic Ocean. The maximum value center is located near the Mediterranean Sea and there is another large value center near the coasts of Europe. The air parcels and specific humidity can be traced southward to the Arabian Sea and northern Africa near 10° N, westward to North America, northward to the Arctic and eastward to western Siberia. The shading shows that the temperature of the air parcels in winter is distributed in an east–west band and decreases from south to north. The temperature of the southernmost air parcels is about 15°C, whereas the temperature near the Arctic is less than −30°C. There are many differences between winter and summer in region I. In summer (Figure 4B), the maximum center for water vapor is located on the north side of the Caspian Sea and is more to the east and north than in winter. The temperature of the air parcels is clearly higher than in winter, with the temperature in the south > 25°C and the temperature over the whole of Eurasia > 0°C. The temperature of the air parcels over the North Atlantic Ocean are <0°C as a result of their high altitude. The air parcels and specific humidity in summer can be traced eastward to eastern Central Siberia, southward to 20° N and westward to North America.
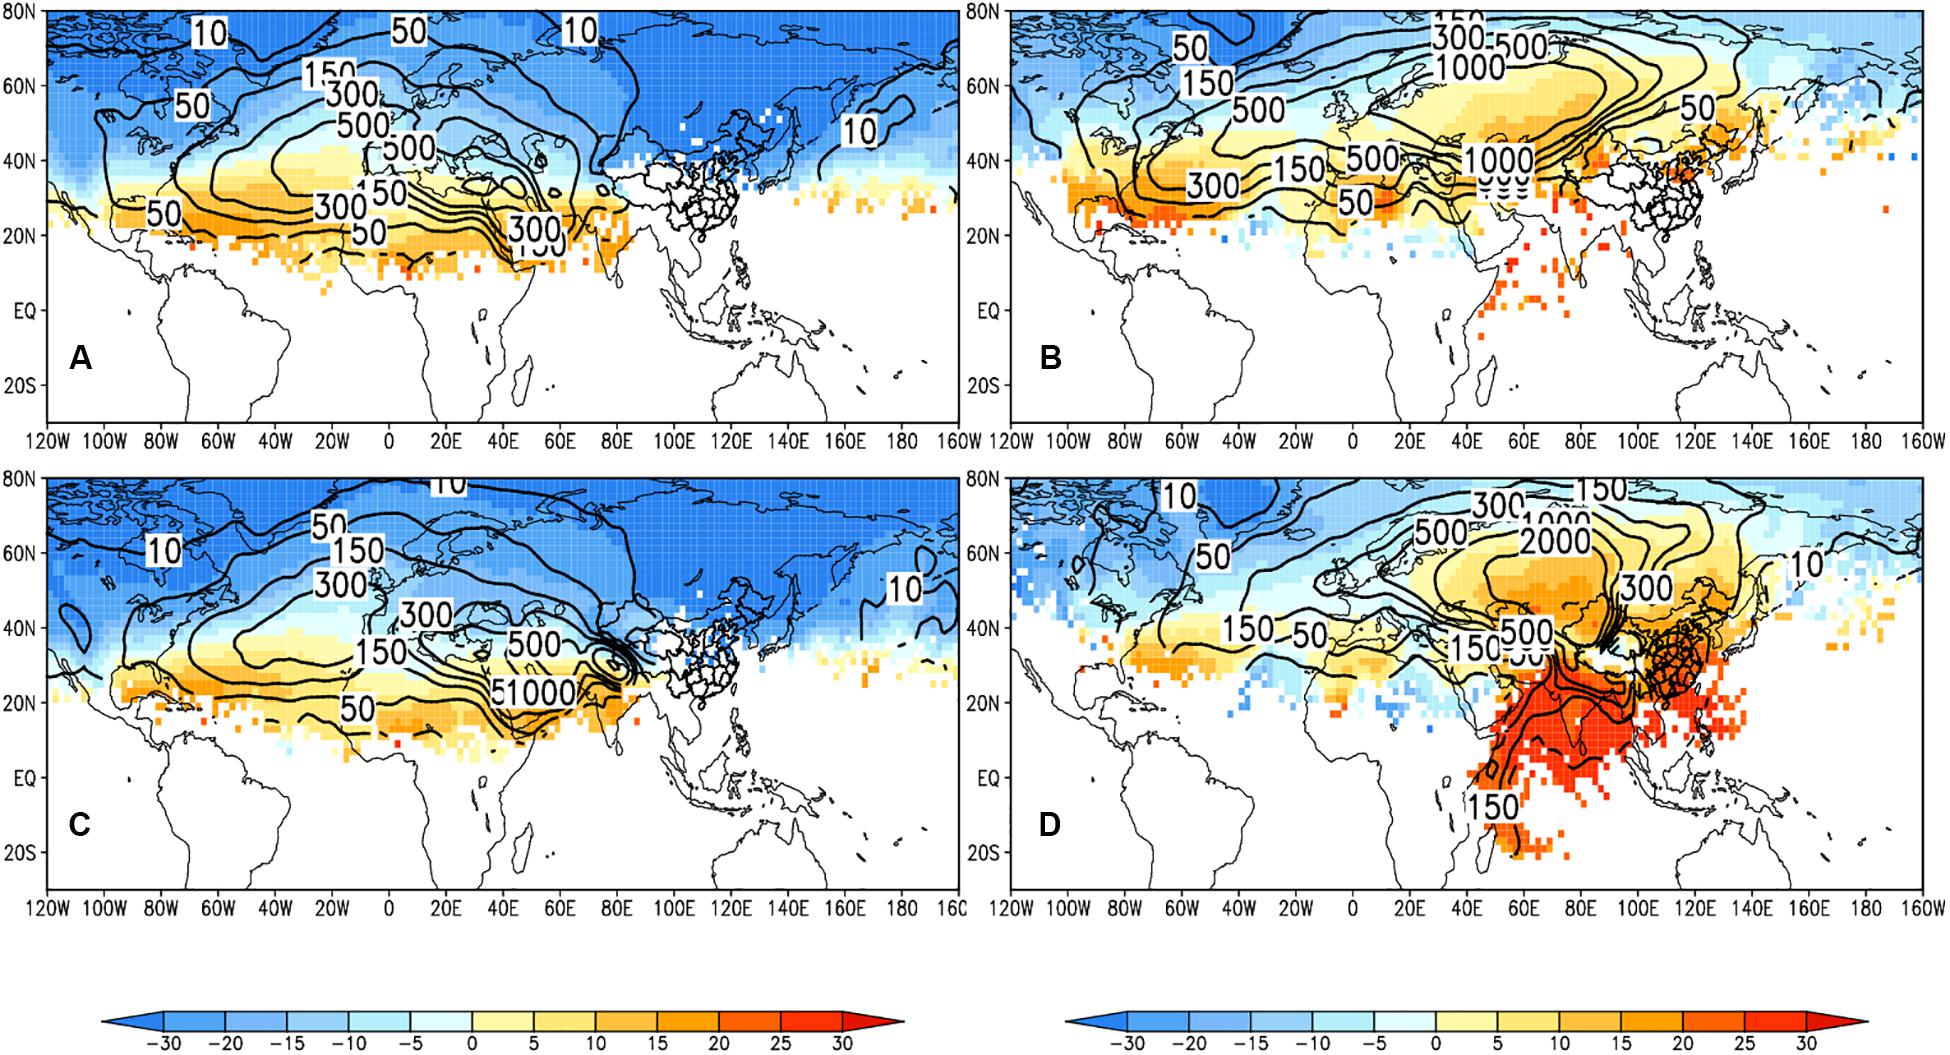
Figure 4. Spatial distribution of the specific humidity carried by air parcels on day 10 before arriving in (A,B) region I and (C,D) region II of Central Asia in (A,C) winter and (B,D) summer during the time period 1979–2017. Contours for the number of air parcels weighted by specific humidity in g kg–1; shading for the temperature of air parcels in °C.
The distribution of water vapor in region II in winter is similar to that in region I (Figure 4C), but the maximum moisture source is more to the south and east, near the Arabia Peninsula. Figure 4D shows the situation in summer for region II. On day 10 before arrival in the region, the air parcels are pushed southward to Madagascar and their temperature is generally >25°C. The isolines of specific humidity in this area are distributed along the eastern coast of Africa as a result of the strong cross-equatorial jet in summer. By contrast, the large value center of water vapor is located in Central Asia and is further north in summer than in winter. There is less water vapor over the North Atlantic in region II than in region I, but more moisture from China. The specific humidity isolines are dense in the south, but sparse in the north in both winter and summer. This structure is consistent with our expectations and indicates that the air parcels from the south are warmer and wetter, whereas those from the north are drier and colder. The water vapor carried by the air mass in summer is much greater than that in winter.
This analysis only describes the spatial distribution of sources of water vapor for Central Asia. To confirm the robustness of results obtained with the quantitative contribution of water vapor transport from different areas, we define five key regions: (1) the North Atlantic–Europe; (2) local regions I or II; (3) the Arctic–northern Asia; (4) the Atlantic–Africa; and (5) the Indian–Pacific Ocean (Figure 5). The water vapor contribution of each area is evaluated as the proportion of specific humidity (carried by air parcels in the initial and final positions) residing in the region compared with the total specific humidity by formula (3).
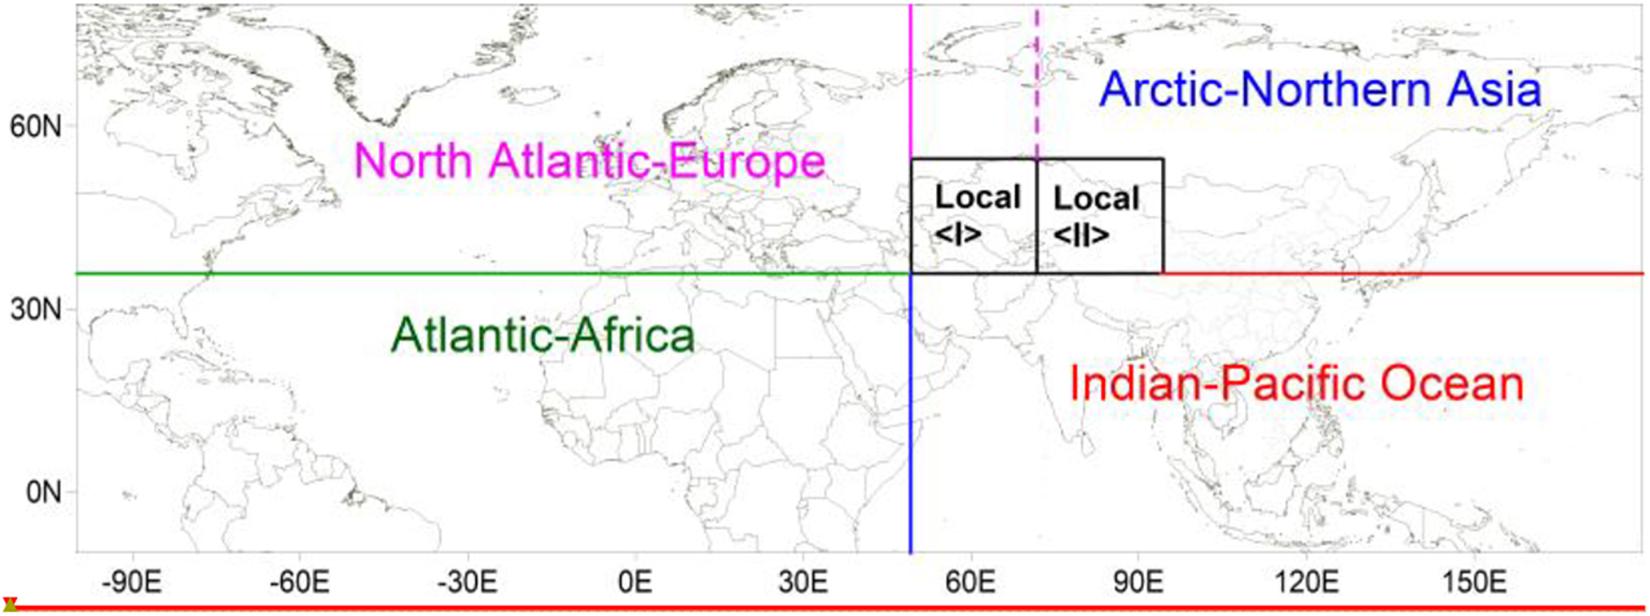
Figure 5. Partition of the sources of water vapor in regions I and II in Central Asia.
Figure 6 shows the contribution of water vapor transport from different sources for regions I and II in winter and summer. The largest contribution of water vapor for region I in winter (Figure 6A) is from the North Atlantic–Europe. The air parcels from this area account for 70% of the global total, but only transport 57% of the water vapor from the initial position. After transportation, the amount of water vapor increases to 68% at the final position due to evaporation from the Mediterranean and Black seas. The second highest source of moisture is the Atlantic–Africa, where the air parcels (16%) carry more water vapor (33%) at the initial position, but lose some during transportation to carry 21% at the final position. The minimum contribution of water vapor transport is from the Arctic–northern Asia. The ratios of air parcels, moisture at the initial position and moisture at the final position are 8, 2 and 5%, respectively. For region II in winter, the maximum contribution of water vapor also comes from the North Atlantic–Europe, but is only 46% at the initial position, much smaller than that of region I due to the higher altitude of the air parcels. The height decreases and the water vapor is continuously replenished during movement to the target area and the final contribution is 63%. Because region II is affected by southerly winds in winter (Huang et al., 2013), there is more water vapor from south (the Atlantic–Africa and the Indian–Pacific Ocean), which account for 31 and 22%, respectively, at the initial position. Some moisture in the air parcels is consumed during northward transport when they pass over plateaus, leaving only 22 and 12%, respectively, at the final positions.
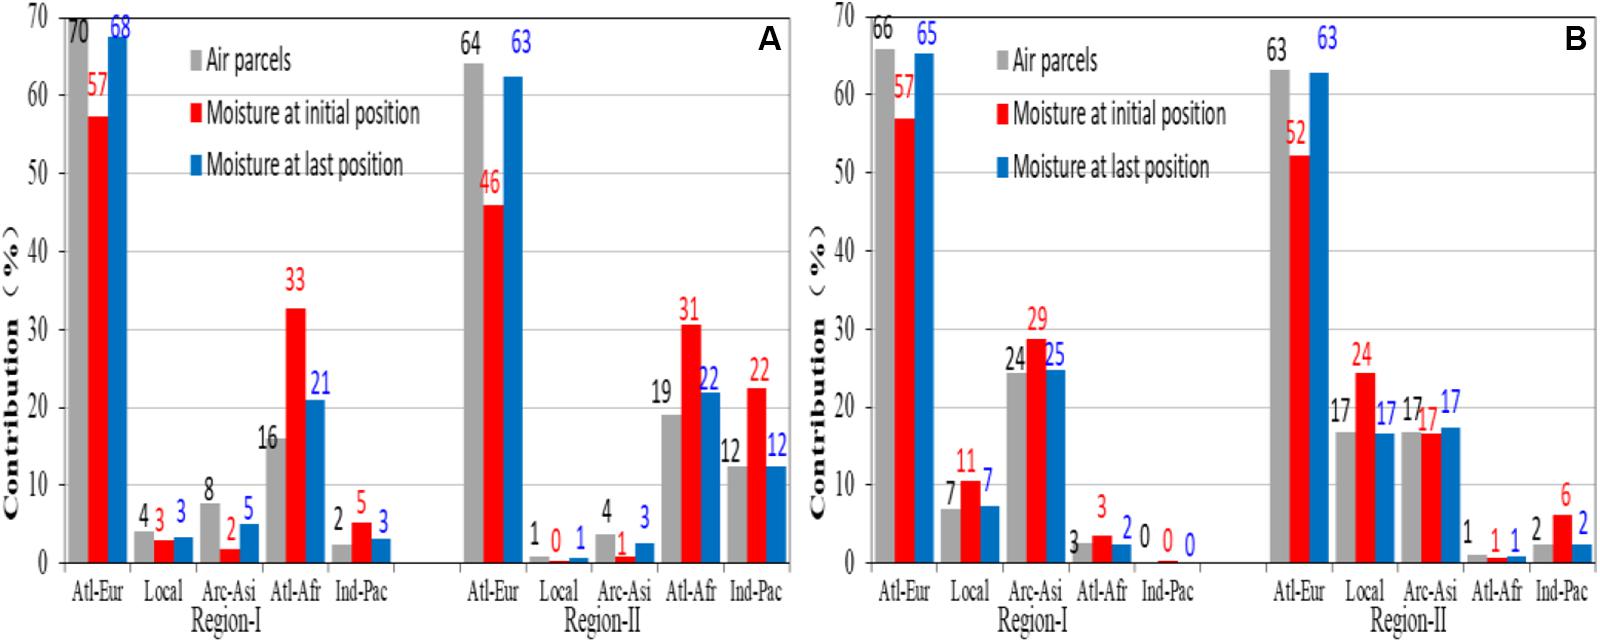
Figure 6. Contribution of air parcels and moisture at the initial and final positions from various regions in (A) winter and (B) summer during 1979–2017.
In summer (Figure 6B), the maximum contribution of water vapor transport for both regions I and II still originate from the North Atlantic–Europe, with 65 and 63% at the final position, respectively. The second highest source of water vapor for region I is the Arctic–northern Asia. A small amount of the moisture in the air parcels from the ocean is consumed during the southward movement, with 25% at the final position. There is very little water vapor from the two sources in the south, which indicates that region I is not affected by southerly winds in summer. The second highest contribution of water vapor for region II comes from the local area; the Arctic–northern Asia is another important source of moisture.
In this paper, we compared the contribution of water vapor transport from different sources in 2013–2017 with those in 1979–1983. The comparison revealed a northward movement of moisture sources under global warming. In winter (Figure 7A), contributions of the North Atlantic–Europe for regions I and II during 1979–1983 are 68 and 59%, they increased to 73 and 68% after 30 years (2013–2017), while the moisture from Atlantic-Africa and Indian-Pacific Ocean decreased, both in regions I and II. In summer (7b), contribution of local area decreased from 9 to 4% in region I, more moisture from the Arctic–northern Asia during 2013–2017 than that during 1979–1983. In region II, during recent 5 years, the contribution of North Atlantic–Europe decreased, but the Arctic–northern Asia increased.
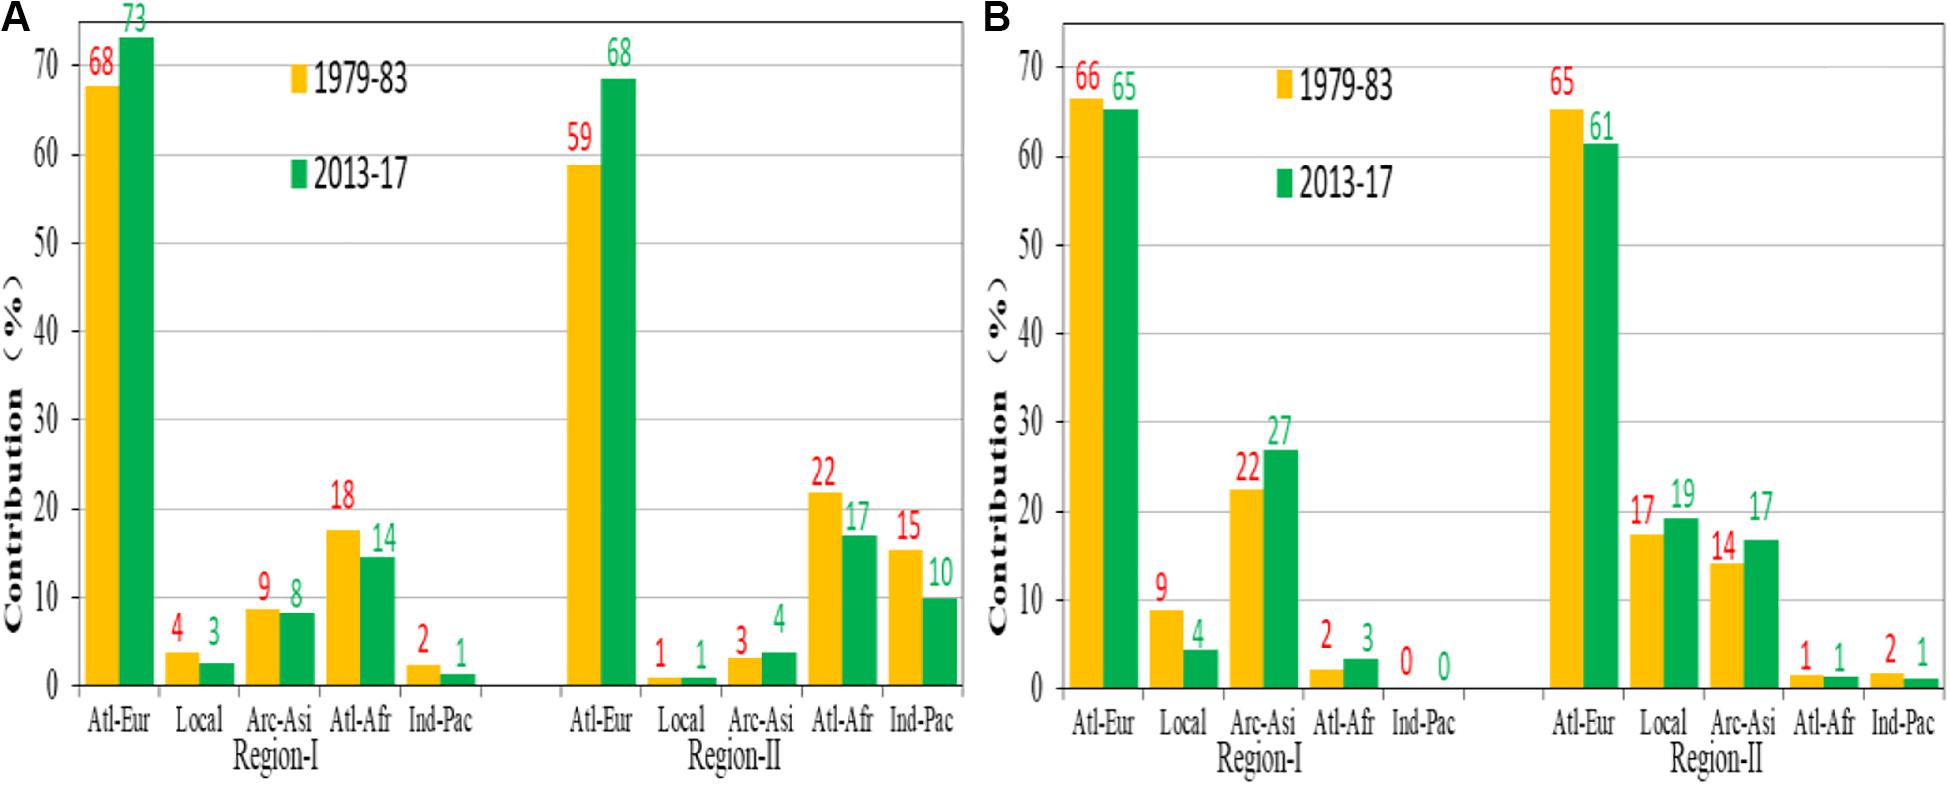
Figure 7. Contribution of moisture at the final positions from various regions in (A) winter and (B) summer during 1979-1983 and 2013-2017.
The response of water vapor transport to global warming in Central Asia shows a north shift during past 40 years, it is likely caused by north shift of the subtropical high and westerly jet (Chen et al., 2011). Especially in summer, the global warming causes the subtropical high to move northeastward, which leads to a large scale subsidence of air mass in the Iran Plateau that suppresses the precipitation development (Guan et al., 2019). Moreover, observational analysis showed that a weakened south Asian summer monsoon could result in the cooling in middle and upper troposphere over Central Asia and furthermore generate favorable anomalous water vapor transport for generating more summer precipitation in east part of Central Asia (Zhao et al., 2014).
We also need to point out that the conclusions from the Lagrangian method are from a single realization with air parcels in the target area having their starting elevation at two particular levels (1500 and 3000 m). Although we could not precisely consider the whole-column water vapor over target area, our calculation did provide relevant information on the origin of low-level atmospheric water vapor, which is the most relevant for precipitation (Läderach and Sodemann, 2016).
Atmospheric Circulation and Eulerian Moisture Flux
Based on the quantitative analysis of water vapor transport for regions I and II in Central Asia in winter and summer, it can be seen that the contribution of moisture from different sources varies significantly in different seasons. This difference is clearly related to the seasonal adjustment in the atmospheric circulation.
The atmospheric circulation from the ERA-Interim reanalysis dataset during the time period 1979–2017, including the geopotential height and water vapor transport, are examined. There is a high-pressure ridge in Siberia in mid- to high latitudes in winter (Figure 8A), the dry and cold westerly circulation of which strongly influences region II. By contrast, region I is affected by a weak low-pressure trough and receives more precipitation. There is an abundant scientific literature investigating the moisture budget in northwest China using an Eulerian approach. For the purpose of comparison with the Lagrangian method, the moisture fluxes and budget in Central Asia are calculated within the Eulerian framework. As for the target region of the Lagrangian back-tracking trajectories, we select two rectangular zones, representing regions I and II (32–50° N, 48–95° E). Figure 7A shows the mean state of the vertically integrated water vapor transport from the ground to 200 hPa in winter. There is a clear northeast–southwest high-value zone in region I. The vertically integrated water vapor fluxes at the four boundaries are assessed separately (Table 3). In winter, the western and southern boundaries show an inflow of water vapor into region I, with mean values of 4565.3 × 108 t a–1 from the west and 587.5 × 10⁸ t a–1 from the south. The eastern and northern boundaries show an outflow of water vapor, with mean values of 3235.4 × 108 t a–1 from the east and 496.8 × 10⁸ t a–1 from the north. The net income of water vapor from all boundaries is 1420.6 × 108 t a–1. The inflow and outflow of water vapor at the four boundaries of region II are less than those for region I in winter. The net income of water vapor is only 336.3 × 10⁸ t a–1, much lower than that in region I.
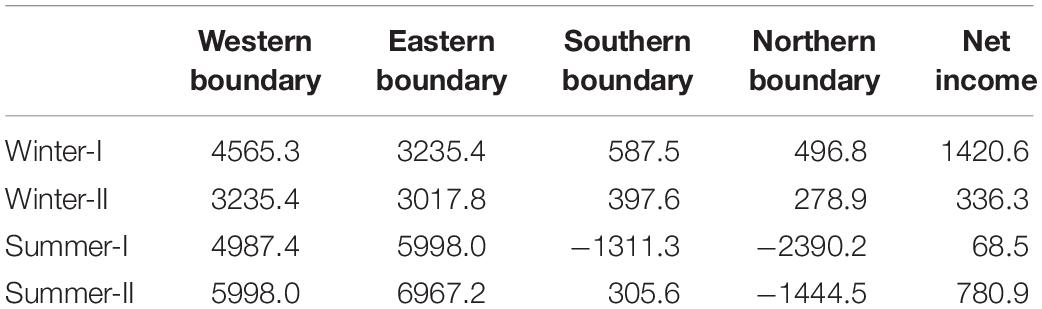
Table 3. Annual mean flux of water vapor transport for every boundary and the net income in regions I and II in winter and summer from 1979 to 2017 (units: × 108 t a–1).
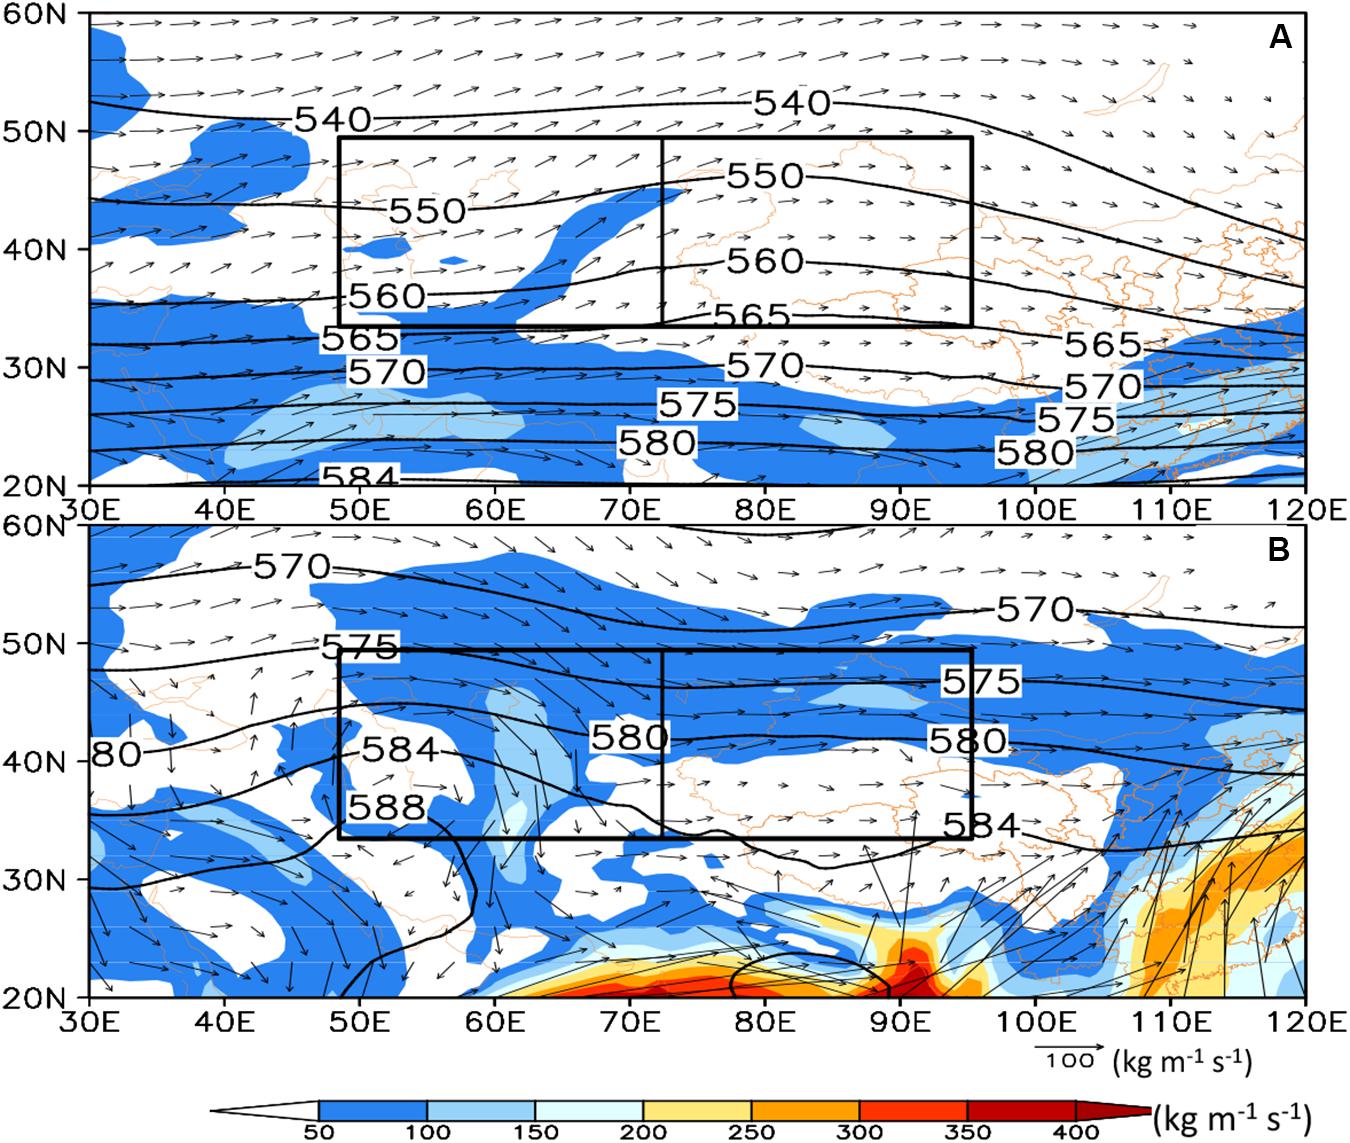
Figure 8. Vertically integrated water vapor transport (vectors and shading; units: kg m–1 s–1) from the ground to 200 hPa and the geopotential heights at 500 hPa (contours; units: gpm) in (A) winter and (B) summer from 1979 to 2017. The black boxes denote regions I and II.
Figure 8B shows that the atmospheric circulation in summer is clearly different from that in winter. The 500 hPa geopotential height shows two ridges and one trough in the mid- to high latitudes of Central Asia. Region I is located at the front of the high-pressure ridge. Under the influence of the anticyclonic circulation, air flows with water vapor are transported from north to south. Region II, including Xinjiang, is under the control of the low-pressure trough. This is the season with a higher annual precipitation and the most frequent impacts from the low-latitude circulation system of the summer monsoon. The transport of water vapor from the south makes an important contribution to the precipitation. At the same time, cold air at high latitudes can reach region II. Precipitation often occurs when the cold air meets the flow of warm moisture in this area. The western and northern boundaries show an inflow of water vapor into region I, with mean values of 4987.4 × 108 t a–1 from the west and 2390.2 × 108 t a–1 from the north. By contrast, the eastern and southern boundaries show an outflow of water vapor. The net income of water vapor from all boundaries is 68.5 × 10⁸ t a–1. The boundaries of the inflow of water vapor into region II increase to three, with mean values of 5998.0 × 108 t a–1 from the west, 1444.5 × 108 t a–1 from the north and 305.6 × 10⁸ t a–1 from the south. Only the eastern boundary shows an outflow of water vapor. The net income of water vapor from all boundaries is 780.9 × 10⁸ t a–1 (Table 3).
A positive value on the western (eastern) boundary indicates an inflow (outflow) of water vapor from west to east; a negative value on the western (eastern) boundary indicates an outflow (inflow) of water vapor from east to west. A positive value on the southern (northern) boundary indicates an inflow (outflow) of water vapor from south to north; a negative value on the southern (northern) boundary indicates an outflow (inflow) of water vapor from north to south.
The seasonal differences in precipitation and water vapor transport for winter and summer depend on the dynamic and thermal effects of the Tibetan Plateau (Chen et al., 2012). Cold high pressure is seen over the plateau in winter and hot low pressure in summer, which leads to the establishment of the Tibetan Plateau monsoon and changes the quasi-zonal circulation in Central Asia (Böhner, 2006; Bothe et al., 2012). Figure 9 shows the climatology of the wind and temperature at 850 hPa and the divergence of the water vapor flux in the atmospheric column in winter and summer. In winter (Figure 9A), Central Asia is under the control of mid-latitude westerlies. However, the westerlies are blocked by the Tibetan Plateau near 60 °E and divided into northern and southern tributaries. The northern branch around the plateau mainly reaches the study area from the southwest, bringing abundant water vapor from the Black Sea, Mediterranean Sea and Caspian Sea to region I, but there is only a little moisture left when it arrives in region II. The southern branch around the plateau blows from the continent to the ocean, becoming the upstream air flow of India and the Arabian Sea. As a result of the high terrain on the eastern side of the Tian Shan Mountains and the Pamir Plateau, the water vapor flux from southwestern Central Asia has a strong southerly wind component, whereas the water vapor flux from the north is mainly westerly winds and forms a negative convergence zone, except in the Caspian Sea area. The temperature in the lower troposphere in region II, especially in Xinjiang, is about 5°C lower than in region I, corresponding to the cold high-pressure region located over Xinjiang (not shown).
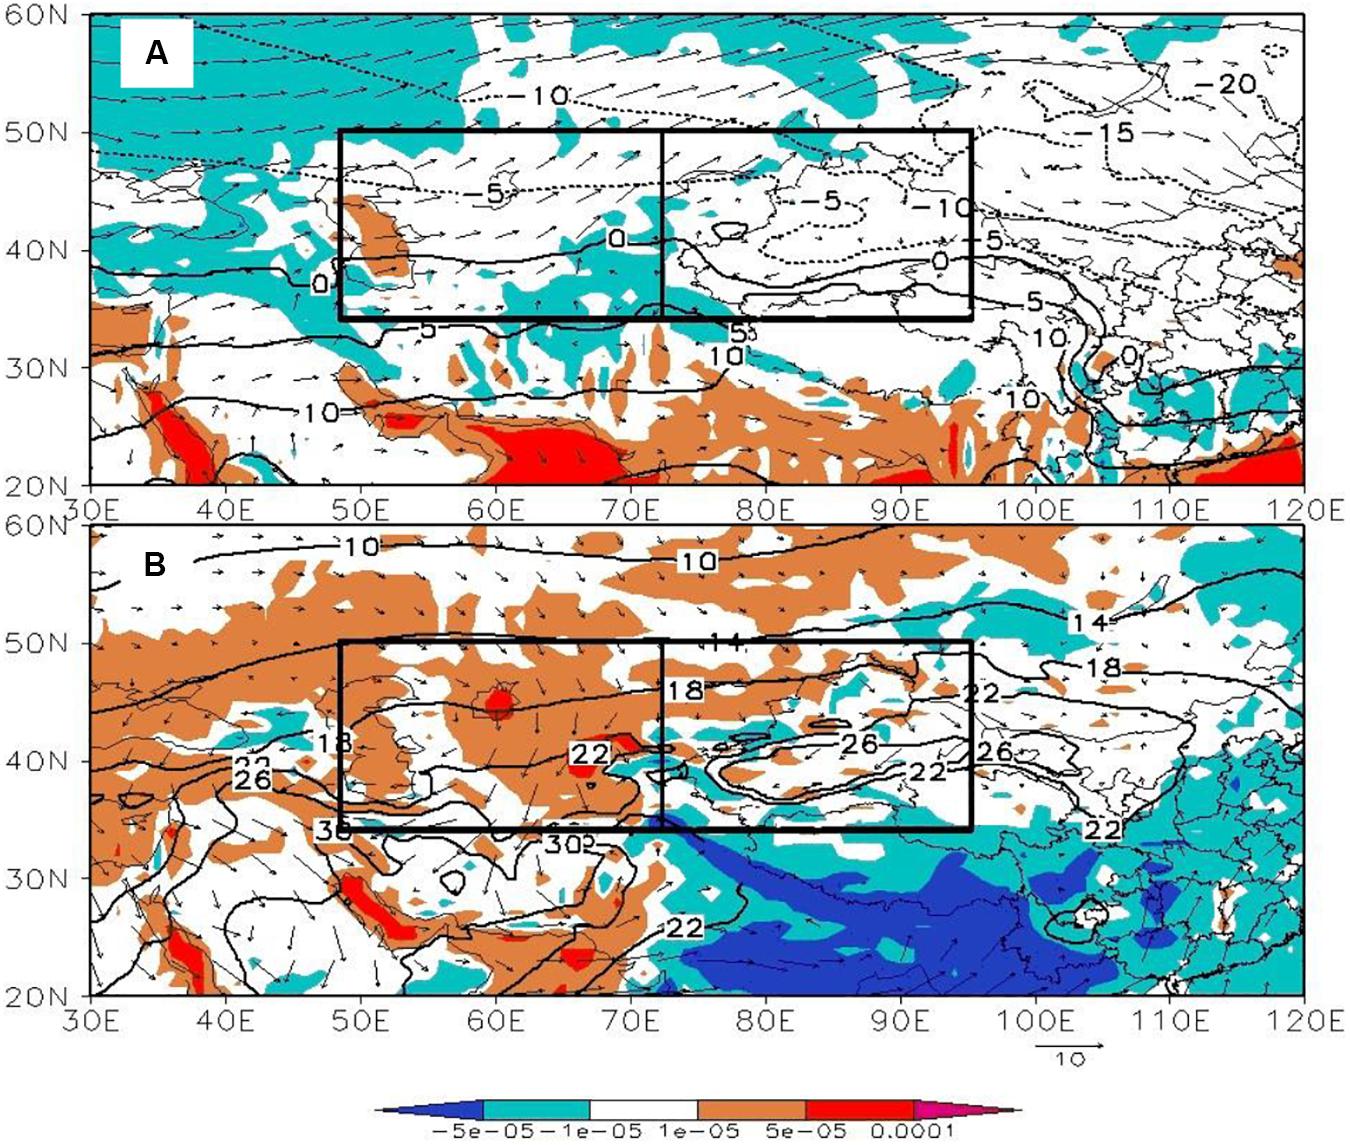
Figure 9. Climatology of wind flows (arrows; units: m s–1) and temperature (contours; units: °C) at 850 hPa and the divergence of the water vapor flux in the atmospheric column (shading; units: kg m–2 s–1 hPa–1) in (A) winter and (B) summer from 1979 to 2017. The black boxes denote regions I and II.
During summer (Figure 9B), the Caspian Sea area is controlled by a semi-permanent anticyclone as a result of the lower surface temperature acting as a strong cold source near the ground. In the east of the anticyclone, region I is influenced by the dry continental northerly wind. This northerly wind can cross the Iranian plateau and reach the coast of the Arabian Sea. This circulation therefore produces a large divergent region of water vapor and region I is hot, dry and rainless in summer. However, most of region II (especially the northern Xinjiang) is an area of convergence for water vapor because it is located on the windward side of the Pamir Plateau and Tian Shan mountains. Therefore, northern Xinjiang has the most precipitation during summer. The temperature of the Tarim Basin in southern Xinjiang shows a high-value center in a zone of water vapor divergence. This area located on the leeward side of the Tian Shan mountains, there is only a little water vapor from the Arctic Ocean can pass through the Tian Shan mountains. The southern region II, located on the north edge of the Tibetan Plateau, is also a convergence zone, receiving water vapor input via the plateau where originates from the Indian Ocean (as shown in Figure 8B).
Discussion and Conclusion
Precipitation and the transport of water vapor in the arid region of Central Asia are closely related to the westerly winds in mid-latitudes and are simultaneously influenced by the Asian monsoon (Chen et al., 2010; Huang et al., 2013). The seasonal variation in precipitation is clearly unique. Studies of the quantitative characteristics of water vapor are rare (Guan et al., 2019). Based on GPCP precipitation and atmospheric circulation reanalysis data, this study analyzed the temporal and spatial variation of precipitation in Central Asia from 1979 to 2017 and used the Lagrangian trajectory model HYSPLIT to quantitatively simulate the sources and transport of water vapor in winter and summer. The atmospheric circulation leading to the different directions of water vapor transport was also considered.
The monthly precipitation in Central Asia shows a single minimum, with less precipitation in August, September and October. There are clear regional and seasonal differences in precipitation between regions I and II. There is more precipitation in winter than in summer in region I, whereas summer is the rainy season in region II. The increasing trend of precipitation in winter is significantly more robust than that in summer and the precipitation in region II increases faster than that in region I. Compared to regional temperature, the responses of regional precipitation to global warming is complicated. In response to the rapid warming, the precipitation in the major area of Central Asia is increasing rapidly and fluctuated with greater magnitudes. The precipitation in southwest area, however, is weakly decreasing (Chen et al., 2011).
The European continent and North Atlantic Ocean are the most important sources of water vapor in regions I and II and contribute > 50% of the transported water vapor in both winter and summer. The Atlantic Ocean provides more water vapor to region I in winter than in summer, whereas the Arctic Ocean and northern Asia provide more water vapor in summer than in winter. In region II, the Atlantic and Indian oceans are the main sources of water vapor in winter, but the local area and the Arctic Ocean are the main sources of water vapor in summer. These differences are related to the seasonal adjustment of the atmospheric circulation systems. The straight westerlies in winter bring water vapor from the Atlantic Ocean and the Mediterranean and Caspian seas, whereas in summer, which is influenced by an anticyclonic circulation, the northerly winds from the Arctic Ocean are strong. The water vapor flux at each boundary and the net budget in region II are less than those in region I in winter. The response of water vapor transport to global warming in Central Asia shows a north shift during past 40 years.
This study confirms that the precipitation and transport of water vapor in Central Asia are closely related to the seasonal adjustment of the general circulation system, which cannot be separated from the adjustment of the sea surface temperature. Previous studies have shown that winter precipitation in Xinjiang and other places is significantly related to the winter sea surface temperature of the western coast of the Pacific Ocean. Winter precipitation in the west of Central Asia decreases when the temperature of the Arabian Sea increases, whereas the summer precipitation increases (Aizen et al., 2001; Bothe et al., 2012).
A large number of studies have shown that precipitation in the arid region of Central Asia shows an increasing trend with global warming, but the increased gradients present regional differences that are inconsistent and complex as a result of the response of the regional precipitation to a warming climate (Huang et al., 2014; Li et al., 2016). The variation of precipitation in the arid region of Central Asia has a good relationship with the variation of the westerly winds, as well as the amount of water vapor transported to the mid-latitudes. Some researchers have suggested that human activities also play an important part by changing the underlying surface in this region (Bernauer and Siegfried, 2012). Difficulties in the study of climate change in Central Asia can mainly be ascribed to the scarcity of observational data (Zhu et al., 2015) and there has been insufficient consideration of the performance and improvement of climate models in this region. Therefore the research on the detection and attribution of climate change in Central Asia needs to be strengthened from three aspects: observations; simulations; and dynamic mechanisms. This will clarify the impacts of natural forcing, internal variability and anthropogenic forcing on the climate of the region.
Data Availability Statement
The monthly mean precipitation data used in this study are provided by the Global Precipitation Climatology Project (GPCP Version 2.3: http://eagle1.umd.edu/GPCP_ICDR/GPCP_Monthly.html). The datasets used to drive the HYSPLIT_4.9 model are from the National Centers for Environment Prediction and National Center for Atmospheric Research (NCEP/NCAR) (http://ready.arl.noaa.gov/gbl_reanalysis.php). The ECMWF provides atmospheric reanalysis data (https://apps.ecmwf.int/datasets/data/interim-full-daily/levtype=sfc/).
Author Contributions
HY was the primary designer of this study, produced the figures, and wrote the manuscript. GX and YW contributed to the design of the experiment and provided input to figure and text editing. HM contributed to the manuscript revision. All the authors contributed to the article and approved the submitted version.
Funding
This work was supported by the National Key R&D Program of China (Grant No. 2018YFC1507202); National Natural Science Foundation of China (Grants 41620104009 and 91637211); and the Central Asia Atmospheric Science Research Foundation (CAAS201803).
Conflict of Interest
The authors declare that the research was conducted in the absence of any commercial or financial relationships that could be construed as a potential conflict of interest.
Acknowledgments
The authors acknowledge the National Oceanic and Atmospheric Administration/Air Resources Laboratory for providing the HYSPLIT model and the European Centre for Medium Range Weather Forecasts for providing atmospheric reanalysis data. The authors thank the referees for their thoughtful comments, which helped to improve our manuscript.
Footnotes
References
Adler, R. F., Mathew, S., George, H., Wang, J., Gu, G., Bolvin, D., et al. (2018). The global precipitation climatology project (GPCP) monthly analysis (New Version 2.3) and a review of 2017 global precipitation. Atmosphere 9:138. doi: 10.3390/atmos9040138
Aizen, E. M., Aizen, V. B., Melack, J. M., Nakamura, T., and Ohta, T. (2001). Precipitation and atmospheric circulation patterns at mid-latitudes of Asia. Int. J. Climatol. 21, 535–556. doi: 10.1002/joc.626
Bernauer, T., and Siegfried, T. (2012). Climate change and international water conflict in Central Asia. J. Peace Res. 49, 227–239. doi: 10.1177/0022343311425843
Berrisford, P., Dee, D., Poli, P., and Brugge, R. (2011). The ERA-Interim archive Version 2.0. Technical Report. London: ECMWF.
Böhner, J. (2006). General climatic controls and topoclimatic variations in Central and High Asia. Boreas 35, 279–295. doi: 10.1111/j.1502-3885.2006.tb01158.x
Bothe, O., Fraedrich, K., and Zhu, X. (2012). Precipitation climate of central Asia and the large-scale atmospheric circulation. Theo. Appl. Clim. 108, 345–354. doi: 10.1007/s00704-011-0537-2
Chen, B., Xu, X. D., Yang, S., and Zhang, W. (2012). On the origin and destination of atmospheric moisture and air mass over the Tibetan Plateau. Theo. Appl. Clim. 110, 423–435. doi: 10.1007/s00704-012-0641-y
Chen, F. H., Chen, J. H., Holmes, J., Boomer, I., and Austin, P. (2010). Moisture changes over the last millennium in arid central Asia: a review, synthesis and comparison with monsoon region. Quat. Sci. Rev. 29, 1055–1068. doi: 10.1016/j.quascirev.2010.01.005
Chen, F. H., Huang, W., Jin, L. Y., Chen, J. H., and Wang, J. S. (2011). Spatiotemporal precipitation variations in the arid Central Asia in the context of global warming. Sci. China Earth Sci. 54, 1812–1821. doi: 10.1007/s11430-011-4333-8
Chen, F. H., Wang, J. S., Jin, L. Y., Zhang, Q., and Li, J. (2009). Rapid warming in mid-latitude central Asia for the past 100 years. Front. Earth Sci. Chin. 3:42. doi: 10.1007/s11707-009-0013-9
Chen, X., Wang, S. S., Hu, Z. Y., Zhou, Q. M., and Hu, Q. (2018). Spatiotemporal characteristics of seasonal precipitation and their relationships with ENSO in Central Asia during 1901–2013. J. Geogr. Sci. 28, 1341–1368. doi: 10.1007/s11442-018-1529-2
Chen, Y., Deng, H., Li, B., and Li, Z. (2014). Abrupt change of temperature and precipitation extremes in the arid region of Northwest China. Quat. Int. 336, 35–43. doi: 10.1016/j.quaint.2013.12.057
Dai, X. G., Wang, P., and Zhang, K. J. (2011). A study on precipitation trend and fluctuation mechanism in northwestern China over the past 60 years. Acta Phys. Sin. 12, 527–537. doi: 10.7498/aps.62.129201
Draxler, R. R., and Hess, G. (1998). An overview of the HYSPLIT_4 modelling system for trajectories. Aust. Meteorol. Mag. 47, 295–308.
Gessner, U., Naeimi, V., and Klein, I. (2013). The relationship between precipitation anomalies and satellite-derived vegetation activity in Central Asia. Glob. Planet. Change 110, 74–87. doi: 10.1016/j.gloplacha.2012.09.007
Guan, X. F., Yang, L. M., Zhang, Y. X., and Li, J. (2019). Spatial distribution, temporal variation, and transport characteristics of atmospheric water vapor over Central Asia and the arid region of China. Glob. Planet. Change 172, 159–178. doi: 10.1016/j.gloplacha.2018.06.007
Huang, A. N., Zhou, Y., Zhou, Y., Zhang, Y. C., and Huang, D. (2014). Changes of the annual precipitation over central Asia in the twenty-first century projected by multi-models of CMIP5. J. Clim. 27, 6627–6646. doi: 10.1175/JCLI-D-14-00070.1
Huang, J. P., He, Y. L., Ji, M., Xie, Y. K., and Wang, S. S. (2016). Global semi-arid climate change over last 60 years. Clim. Dyn. 46, 1131–1150. doi: 10.1007/s00382-015-2636-8
Huang, W., Chen, F. H., Feng, S., and Chen, J. H. (2013). Interannual precipitation variations in the mid-latitude Asia and their association with large-scale atmospheric circulation. Chin. Sci. Bull. 58, 3962–3968. doi: 10.1007/s11434-013-5970-4
Huang, W., Feng, S., Chen, J. H., and Chen, F. H. (2015). Physical mechanisms of summer precipitation variations in the Tarim basin in Northwestern China. J. Clim. 28, 3579–3591. doi: 10.1175/JCLI-D-14-00395.1
Huang, Y., and Cui, X. (2015). Moisture sources of an extreme precipitation event in Sichuan, China, based on the Lagrangian method. Atmos. Sci. Lett. 16, 177–183. doi: 10.1002/asl2.562
IPCC (2013). Climate Change: The Physical Science Basis. Contribution of Working Group I to the Fifth Assessment Report of the Intergovernmental Panel on Climate Change. Cambridge: Cambridge University Press, 1535.
James, P., Stohl, A., Spichtinger, N., and Eckhardt, S. (2004). Climatological aspects of the extreme European rainfall of August 2002 and a trajectory method for estimating the associated evaporative source regions. Nat. Hazards Earth Syst. Sci. 4, 733–746. doi: 10.5194/nhess-4-733-2004
Jiang, J., Zhou, T., and Zhang, W. (2019). Evaluation of satellite and reanalysis precipitable water vapor data sets against radiosonde observations in central Asia. Earth Space Sci. 6, 1129–1148. doi: 10.1029/2019EA000654
Jiang, Z., Jiang, S., Shi, Y., Liu, Z. Y., and Li, W. (2017). Impact of moisture source variation on decadal-scale changes of precipitation in North China from 1951 to 2010. J. Geophys. Res. Atmos. 122, 600–613. doi: 10.1002/2016JD025795
Jiang, Z., Ren, W., Liu, Z., and Yang, H. (2013). Analysis of water vapor transport characteristics during the Meiyu over the Yangtze-Huaihe River valley using the Lagrangian method. Acta Meteorol. Sin. 71, 295–304. doi: 10.11676/qxxb2013.017
Läderach, A., and Sodemann, H. (2016). A revised picture of the atmospheric moisture residence time. Geophys. Res. Lett. 43, 924–933. doi: 10.1002/2015GL067449
Li, B., Chen, Y. N., and Chen, Z. S. (2016). Why does precipitation in northwest China show a significant increasing trend from 1960 to 2010? Atmos. Res. 167, 275–284. doi: 10.1016/j.atmosres.2015.08.017
Li, X. W., Gao, X. Z., Chang, Y. T., Mu, D. P., and Liu, H. L. (2018). Water storage variations and their relation to climate factors over Central Asia and surrounding areas over 30 years. Water Sci. Technol. Water Supply 18, 1564–1580. doi: 10.1016/j.quaint.2014.09.077
Li, Y., Yao, N., Sahin, S., and Appels, W. (2017). Spatiotemporal variability of four precipitation-based drought indices in xinjiang, china. Theor. Appl. Climatol. 129, 1017–1034. doi: 10.1007/s00704-016-1827-5
Ma, Z. G., and Fu, C. B. (2007). Global aridification in the second half of the 20th century and its relationship to large-scale climate background. Sci. China Earth Sci. 50, 776–788. doi: 10.1007/s11430-007-0036-6
Miao, Z., Luo, G. P., Philippe, D. M., Cai, P., and Kurban, A. (2017). Improved atmospheric modelling of the Oasis-desert system in Central Asia using WRF with actual satellite products. Remote Sensing 9, 1273–1297. doi: 10.3390/rs9121273
Peng, D. D., Zhou, T. J., Zhang, L. X., and Wu, B. (2018). Human contribution to the increasing summer precipitation in Central Asia from 1961 to 2013. J. Climate 31, 8005–8021. doi: 10.1175/JCLI-D-17-0843.1
Shi, Y. G., and Sun, Z. B. (2008). Climate characteristics of atmospheric precipitable water over Xinjiang and its variation. J. Desert Res. 28, 519–525. doi: 10.3724/SP.J.1011.2008.00323
Song, S., and Bai, J. (2016). Increasing winter precipitation over arid central Asia under global warming. Atmosphere 7:139. doi: 10.3390/atmos7100139
Stein, A. F., Draxler, R. R., Rolph, G. D., Stunder, B., and Cohen, M. D. (2015). NOAA’s HYSPLIT atmospheric transport and dispersion modeling system. B. Am. Meteorol. Soc. 96, 2059–2078. doi: 10.1175/BAMS-D-14-00110.1
Stohl, A., Forster, C., Frank, A., and Seibert, P. (2005). Technical note: the Lagrangian particle dispersion model FLEXPART version 6.2. Atmos. Chem. Phys. 5, 2461–2474. doi: 10.5194/acpd-5-4739-2005
Stohl, A., and James, P. (2004). A Lagrangian analysis of the atmospheric branch of the global water cycle. Part I: method description, validation, and demonstration for the August 2002 flooding in central Europe. J. Hydrometeorol. 5, 656–678. doi: 10.1175/1525-754120040052.0.CO;2
Su, M. F., and Wang, H. J. (2007). Relationship and its instability of ENSO–Chinese variations in droughts and wet spells. Sci China Ser. D Earth Sci. 50, 145–152. doi: 10.1007/s11430-007-2006-4
Turkes, M., Koc, T., and Saris, F. (2009). Spatiotemporal variability of precipitation total series over Turkey. Int. J. Climatol. 29, 1056–1074. doi: 10.1002/joc.1768
Ursula, G., Igor, K., Kuenzer, C., and Klein, D. (2013). The relationship between precipitation anomalies and satellite-derived vegetation activity in Central Asia. Glob. Planet. Change 110, 74–87. doi: 10.1016/j.gloplacha.2012.09.007
Wang, H. J., Chen, Y. N., and Chen, Z. S. (2013). Spatial distribution and temporal trends of mean precipitation and extremes in the arid region northwest of China during 1960-2010. Hydrol. Process. 27, 1807–1818. doi: 10.1002/hyp.9339
Wang, J., Chen, F., Jin, L., and Bai, H. Z. (2010). Characteristics of the dry/wet trend over arid central Asia over the past 100 years. Clim. Res. 41, 51–59. doi: 10.3354/cr00837
Xie, Z. M., Zhou, Y. S., and Yang, L. M. (2018). Review of study on precipitation in Xinjiang. Torrent. Rain Disast. 37, 204–212. doi: 10.3969/j.issn.1004-9045
Xu, D., Li, R. L., and Wang, C. H. (2016). Characteristics of precipitation changes and relationships with water vapor transport in typical arid regions of Asia and Africa under global warming. Clim. Environ. Res. 21, 737–748. doi: 10.3878/j.issn.1006-9585.2016.15256
Xu, L. G., Zhou, H. F., Du, L., Yao, H. J., and Wang, H. B. (2015). Precipitation trends and variability from 1950 to 2000 in arid lands of Central Asia. J. Arid Land 7, 514–526. doi: 10.1007/s40333-015-0045-9
Xu, L. G., Zhou, H. F., Liang, C., Du, L., and Li, H. (2010). Spatial and temporal variability of annual and seasonal precipitation over the desert region of China during 1951-2005. Hydrol. Process. 24, 2947–2959. doi: 10.1002/hyp.7708
Xu, X. D., Lu, C., Shi, X., and Gao, S. T. (2008a). World water tower: an atmospheric perspective. Geophy. Res. Lett. 35, 525–530. doi: 10.1029/2008GL035867
Xu, X. D., Shi, X. Y., Wang, Y. Q., Peng, S. Q., and Shi, X. H. (2008b). Data analysis and numerical simulation of moisture source and transport associated with summer precipitation in the Yangtze River Valley over China. Meteorol. Atmos. Phys. 100, 217–231. doi: 10.1007/s00703-008-0305-8
Yang, H., Jiang, Z., Liu, Z., and Zhang, Q. (2014). Analysis of climatic characteristics of water vapor transport based on the Lagrangian method: a comparison between Meiyu in the Yangtze-Huaihe River region and the Huabei rainy season. Chin. J. Atmos. Sci. 38, 965–973. doi: 10.3878/j.issn.1006-9895.1402.13228
Yang, H., Xu, G., Wang, X., Cui, C. G., Wang, J. Y., and He, D. X. (2019). Quantitative analysis of water vapor transport during Mei-Yu front rainstorm period over the Tibetan plateau and Yangtze-Huai River Basin. Adv. Meteorol. 8, 1–14. doi: 10.1155/2019/6029027
Yang, L., Yang, L. M., Tang, H., Liu, T., and Peng, J. (2013). Characteristics of water vapor transport over Tianshan Mountainous area from 2000 to 2011. Desert Oasis Meteor. 7, 21–25. doi: 10.3969/j.issn.1002-0799
Yao, J., and Chen, Y. (2015). Trend analysis of temperature and precipitation in the Syr Darya Basin in Central Asia. Theor. Appl. Climatol. 120, 521–531. doi: 10.1007/s00704-014-1187-y
Zhao, Y., Huang, A. N., Zhou, Y., Huang, D. Q., Yang, Q., Ma, Y. F., et al. (2014). Impact of the middle and upper tropospheric cooling over Central Asia on the summer rainfall in the Tarim basin. China. J. Clim. 27, 4721–4732. doi: 10.1175/JCLI-D-13-00456.1
Zhao, Y., and Zhang, H. (2015). Impacts of SST warming in tropical Indian ocean on CMIP5 model-projected summer rainfall changes over Central Asia. Clim. Dyn. 46, 1–16. doi: 10.1007/s00382-015-2765-0
Keywords: Central Asia, precipitation, water vapor transport, quantify, atmospheric circulation
Citation: Yang H, Xu G, Mao H and Wang Y (2020) Spatiotemporal Variation in Precipitation and Water Vapor Transport Over Central Asia in Winter and Summer Under Global Warming. Front. Earth Sci. 8:297. doi: 10.3389/feart.2020.00297
Received: 28 February 2020; Accepted: 25 June 2020;
Published: 22 July 2020.
Edited by:
Irina Alexandrovna Mironova, Saint Petersburg State University, RussiaReviewed by:
Wei Huang, Lanzhou University, ChinaJasti S. Chowdary, Indian Institute of Tropical Meteorology (IITM), India
Copyright © 2020 Yang, Xu, Mao and Wang. This is an open-access article distributed under the terms of the Creative Commons Attribution License (CC BY). The use, distribution or reproduction in other forums is permitted, provided the original author(s) and the copyright owner(s) are credited and that the original publication in this journal is cited, in accordance with accepted academic practice. No use, distribution or reproduction is permitted which does not comply with these terms.
*Correspondence: Hao Yang, eWFuZ2hhbzAyMDJAMTI2LmNvbQ==