 Yi-He Fang
 Yi-Tong Lin1
 Hong-Li Ren
 Chun-Yu Zhao
- 1Regional Climate Center of Shenyang, Liaoning Provencal Meteorological Administration, Shenyang, China
- 2 The Institute of Atmospheric Environment, China Meteorological Administration, Shenyang, China
- 3 Key Opening Laboratory for Northeast China Cold Vortex Research, CMA, Shenyan, China
- 4 State Key Laboratory of Severe Weather, Chinese Academy of Meteorological Sciences, Beijing, China
- 5 Climate Change Research Center, Institute of Atmospheric Physics, and Nansen-Zhu International Research Centre, Chinese Academy of Sciences, Beijing, China
- 6 Nanjing ZStar Software Technology Limited Company, Nanjing, China
The Northeastern China Cold Vortex (NCCV) processes during the early summer periods (June) from 1979 to 2018 were objectively identified in this study by using the daily precipitation data in Northeastern China (NEC), along with the six-hourly atmospheric circulation fields of ERA Interim/ECMWF, and the temperature field data and monthly mean sea surface temperature field data reconstructed by NOAA. Then, the NCCV processes from the objective identifications were divided into the Southern Cold Vortex (SCV) and the Northern Cold Vortex (NCV) according to the positions of their activity trajectories in the NEC geographical range. Next, an index was defined which could better represent the frequencies and intensities of the SCV and NCV. Relationships between the indices of the SCV and NCV and atmospheric circulation fields during the early summer months and the early Sea surface temperature (SST) fields were analyzed. Finally, the results of the sensitivity test of the AM2.1 model were used to verify the statistical analysis results. It was found that the SST factor impacting the intensity of the SCV was the North Atlantic Tripole in early April. The anomalies of the North Atlantic Tripole in April forced the formation of the “high-low pressure cooperation types” in early summer, which resulted in the intensity anomalies of the SCV. The SST factors impacting the intensity of the NCV were the south-north inverse SSTs of the Northwest Pacific (March) and the SSTs of the tropical Southeast Pacific (May). During the two examined periods of 1979–1999 and 2000–2018, the south-north inverse SST anomalies in the Northwest Pacific in March, as well as the SST anomalies in the tropical Southeast Pacific in May, were observed to have forced the formations of “double blocking low vortex types” and East Asia-Pacific teleconnection types during the early summer months, which resulted in anomalies in the NCV intensities. The AM2.1 model was found to have good simulation effects regarding the observed impact results of the SSTs on the early circulation types during the early summer months, which further supported the conclusions achieved from the statistical analysis results.
Introduction
The Northeastern China (NEC) region is the largest commodity grain base in China, and early summer is the growing season of the crops. Therefore, climatic anomalies which occur during the early summer months have very important impacts on the grain yields in the NEC region. During early summer seasons, the northeastern cold vortex occurs frequently. These occurrences often produce strong convective instability in the region and may cause such disastrous weather conditions as heavy rain events, low temperatures, and so on, which have potentially significant impacts on the climate anomalies of NEC. In the past, meteorologists have carried out a large number of meaningful research investigations into such aspects as identifications of the Northeastern China Cold Vortex (NCCV), climatological characteristics, influencing factors, and climate effects, and so on.
In regard to the NCCV identifications, Sun et al. (1994) put forward identification standards for the NCCV. Then using those indemnification standards, researchers designed computer objective identification methods for the NCCV processes (Wang et al., 2012; Liu et al., 2015). In addition, Gong et al. (2015) and Fang et al. (2016) carried out objective identification research which focused on the precipitation concentration periods of the NCCV. In other related studies, researchers have adopted methods which identified the maximum potential vorticity of isentropic surfaces, as well as constructing conceptual models of the physical parameters of the cutoff low pressure values, in order to identify the cutoffs of the low pressure zones in the NEC region (Wernli and Sprenger, 2007).
In addition, using different definition methods of the cold vortexes, statistical analyses of the climatological characteristics of cold vortexes have been carried out which involved examining the number of cold vortex occurrence days, variation trends, cycles, and spatial distributions, in accordance with the available data (Hu et al., 2011; Xie and Bu, 2012; Liu et al., 2015). Li et al. (2014) confirmed that the main reason for the unusually high precipitation during the early summer months of 2012 in Liaoning was the active NCCV. Liu et al. (2017) pointed out that cold vortex precipitation has significant “cumulative effects.” Gao and Gao (2018) also theorized that the NCCV played a major role in the unusually high precipitation which occurred during the early summer of 2013 in the NEC region. Liu et al. (2018) and Ding et al. (2019), respectively, analyzed the close relationships between the NCCV and the precipitation and air temperature values. In addition, many studies have also determined that the NCCV has significant impacts on the plum rains in the East Asian region, precipitation in Southern China, and precipitation in the Huai River Basin (He et al., 2007; Miao et al., 2006b; Li et al., 2015).
In terms of the influencing factors of the NCCV, many relevant research investigations have been carried out from the aspects of atmospheric circulation characteristics and SSTs. Liu et al. (2002), Miao et al. (2006a), and He et al. (2006), respectively, observed that the early North Pacific Oscillations, along with the northern annular module and the early North Pacific SSTs, were closely related to the NCCV. Lian et al. (2010) pointed out that the significant anomalies of the NCCV activities during the early summer months in the NEC region corresponded to the persistent abnormal circulation activities near the upper Ural Mountain and the lower regions of Japan. Bu and Xie (2013) summarized the deep dynamic reasons for the formations and maintenance of various NCC. Their research revealed that the Western Pacific teleconnection types were the downstream background circulation types of the NCCV activities, and the Western Pacific negative phases were conducive to the generation and maintenance of cold vortexes. Xie and Bueh (2016) analyzed the dynamic characteristics on the climate conditions of the impacts of the coordination between the NCCV and the high blocking pressure. In addition, the effects at seasonal time scales of the relationship of the aforementioned factors and the background fields of climate circulations were studied in-depth. Wang et al. (2018) and Chen et al. (2018), respectively, revealed the relationships between the surface thermal factors of Western Asia during the spring months and the downstream atmospheric circulation activities, and then investigated their impacts on the NCCV activities and precipitation values in the NEC region in early summer. Fang et al. (2018) carried out diagnostic analyses and numerical simulations of the causes of precipitation anomalies in the NEC region in early summer. It was pointed out in the aforementioned study that the anomalies of the North Atlantic Tripole (NAT) and the SSTs of the Kuroshio area were the possible factors causing the anomalies of circulation systems, such as the NCCV activities during the early summer months, as well as the high blocking pressure in the upper and lower reaches, and so on. Lu et al. (2020) analyzed the spring precipitation levels in the NEC region, and revealed the physical mechanism in which the SSTs of the tropical North Atlantic and the northwestern Pacific Ocean influenced the low value systems over the NEC region during the spring seasons with the characteristics of interannual variability. In addition, other meaningful research investigations have carried out from other relevant aspects (Fang et al., 2017a; Fang et al., 2017b; Zhao et al., 2018; Zhao et al., 2019).
In the present study, it was concluded that previous research regarding the NCCV had achieved fruitful results. However, the research experience of the climate predictions during the early summers of 2018 and 2019 indicated that only the predictions of the overall trends of the NCCV were successfully achieved. However, the more detailed research investigations regarding the precipitation characteristics in the NEC region were found to be inadequate. For example, it was observed that in 2018 and 2019, the more active trends of the NCCV than usual had been successfully predicted. However, since the actual positions were further northward during both years, this had resulted in climate prediction failures in the south sections of the NEC region. Due to the differences in the generation origins and activity paths, the positions of the NCCV in the north and south will be different. For example, such differences will be reflected in the atmospheric circulation fields, and the corresponding external forcing signals may also be different. Therefore, it has been necessary to carry out diagnoses and analyses of the causes of the position anomalies of the NCCV. From the perspective of the research progress, most of the research investigations have analyzed the anomalies of the NCCV as a whole, and none of the current research has focused on distinguishing the causes of the anomalies of the NCCV at different locations. Therefore, in the present study, by referring to the identification standards of NCCV proposed by Sun et al. (1994) and the concept of “Northern Cold Vortex (NCV), middle vortex, and Southern Cold Vortex (SCV),” a set of objective identification design methods of the NCCV were proposed. The processes of the NCCV obtained through the identification processes were divided into the SCV and NCV. Then, the influence mechanisms of the SSTs and atmospheric circulation activities on the SCV and NCV were studied, respectively, by combined statistical analysis and numerical simulation methods. The goal was to provide new information for the detailed predictions of early summer climate conditions in the NEC region.
Data Acquisition and Methodology
Data
The data used in this paper included the daily precipitation observation data of 208 meteorological stations in the NEC region from June of 1979 to June of 2018, which were provided by the National Meteorological Information Center. In addition, the 6-h ECMWF re-analyzed EAR Interim data (1°*1°) for the period ranging from 1979 to 2018, and the NOAA reconstructed monthly average SST data from 1979 to 2018, were analyzed. The geographical location of the NEC region is indicated by the circle in Figure 1A, and the spatial distribution of the 208 meteorological stations in the NEC region is shown in Figure 1B.
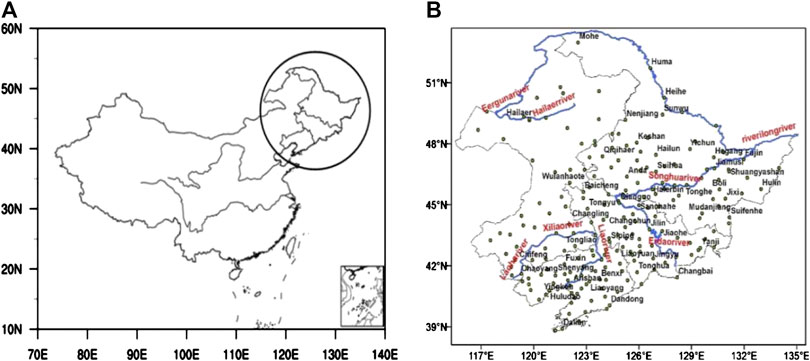
FIGURE 1. (A) Location of the Northeastern China region; and (B) distribution of the 208 meteorological stations in the Northeastern China region.
Research Methods
In this study, an objective identification method for the NCCV, along with a division method for the SCV and NCV, were successfully designed. The relationships between the SCV and NCV during the early summer months and the early SSTs and atmospheric circulation activities during the early summer months, were mainly analyzed using statistical methods, such as correlation and running correlation methods. Furthermore, based on the AM2.1 global atmospheric model, sensitivity tests were designed for the purpose of verifying this study’s statistical analysis conclusions of the relationships between the early SSTs and atmospheric circulation characteristics during the early summer months in the study area.
Objective Identification Method for the Northeastern China Cold Vortex
Step 1: The fires step in the identification process was tracing of the equipotential height line. The equipotential height line was traced within the scope of 500–600 dgpm on the 500 hPa isobaric surface at an interval of 4 dgpm using the 6-h EC re-analyzed EAR Interim data for the period ranging from June of 1979 to June of 2018. Then, its longitude and latitude values were output.
Step 2: Next, the equipotential height line was screened. The closed equipotential height line was screen out in the range of 30°–80°N and 85°–150°E using the results obtained in Step 1.
Step 3: The next step was the identification of the NCCV centers. The center of the innermost circle of isopotential height line in the same system was defined as the NCCV center. The average value of all the longitudes and latitudes of the innermost circle of the isopotential height line was determined to be the center longitude and center latitude. This study only examined the NCCV systems with centers within the range of 30°–60°N and 95°–140°E. If there was a low-pressure center on the 500 hPa isobaric surface, the center corresponding to the low-pressure center with a spatial temperature anomaly less than 0 was selected as the NCCV center. Then, the time, latitude, and longitude values of the NCCV centers were output.
Step 4: This step mainly included the identifications of the NCCV duration times. This study assumed that if two adjacent time levels had NCCV centers, and the distance between the two NCCV centers were less than 800 km, they were regarded as the same NCCV system. The duration times of NCCV centers screened in Step 3 were counted out. In addition, the NCCV systems with duration times greater than or equal to 72 h were screened out, and then the NCCV processes and related variables were output.
Division Method for the Southern Cold Vortex and Northern Cold Vortex
In accordance with the locations of the trajectory lines of the NCCV processes in the NEC region, all of the NCCV processes were divided into SCV and NCV categories, with the 45°N latitude as the threshold.
Special Case Description
In order to ensure a sufficient number of samples, if the trajectory of a cold vortex process included not only the part to the north of 45°N, but also the part to south of 45°N, then it was temporarily regarded as one NCV process and one SCV process, respectively. In those cases, such divisions could also show the influencing effects of a single cold vortex process on different locations within the NEC region.
Calculation Method of the Indexes of the Southern Cold Vortex and Northern Cold Vortex
The absolute values of the field anomaly calculations of the lowest potential height fields in the inner circles of the cold vortexes in all the SCV and NCV occurrence days from June of 1979 to June of 2018 were determined in order to obtain the SCV and NCV indexes. The adopted index calculation method was not only able to accurately reflect the number of cold vortex days, but also represented the intensities of cold vortex centers. At the same time, the cold vortex weather processes within the NEC region were transformed into a climate time scale. Among those, the spatial ranges of the SCV and NCV were: 36°–45°N, 110°–143°E and 45°–58°N, 110°–143°E, respectively.
Model Introduction and Sensitivity Test Design Method
The AM2.1 global atmospheric model [Geological Fluid Dynamics Laboratory (GFDL) Global Atmospheric Model Development Team, 2004] is an atmospheric circulation model of the Earth System model developed by GFDL, which is used for climate research and prediction processes. The model integrates the models which were previously used by GFDL, including the new grid atmospheric dynamic nucleus (GFDL Global Atmospheric Model Development Team, 2004). This model has been adopted in many studies regarding air-sea interaction processes (Stuecker et al., 2013; Li et al., 2016).
In order to confirm the correlations between the early SSTs and the 500 hPa height fields during the early summer months in the study area, three groups of tests were designed. Each group consisted of one group of control tests and one group of sensitivity tests which includes 12 ensemble members. The differences between the sensitivity tests and the control tests were that only the SST anomalies in the key areas were added to the sensitivity tests during the early stage. Otherwise, the tests were consistent in all other aspects. The results of the sensitivity tests minus the results of the control tests were considered as the influence effects of the SST anomalies in the key areas during the early stage on the 500 hPa height field in the early summer seasons. Table 1 details this study’s test design scheme.
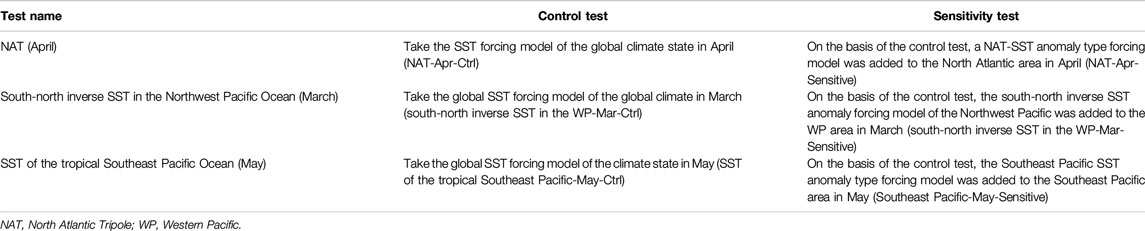
TABLE 1. Test design scheme.
Definition Indexes Used in This Study
The SST indices of the key areas were defined according to the regions where the correlation coefficient between the SCV and NCV indices during the early summer months in the NEC region and the SSTs in early March, April, and May passed the significance tests (see below).
North Atlantic Tripole Index
The differences between the SSTs of the North Atlantic Ocean in middle latitude areas in April (28°–38°N, 64°–36°W) and the average SST in the high latitude areas (42°–56°N, 62°–30°W) and lower latitude areas (6°S–26°N, 66°–12°W).
South-North Inverse SST Index of the Northwest Pacific Ocean
The differences in the average SSTs of the Northwest Pacific Ocean in March between the area range of 126°–152°E and 22°–38°N and the area range of 144°–164°E and 4°S–10°N.
SST Index of Southeast Pacific Ocean
The average value of the SSTs in the Southeast Pacific Ocean in May in the area range of 28°–6°S and 112°–70°W.
Relationships Between the Southern Cold Vortex and Northern Cold Vortex and the Temperature Values of the NEC Region
In accordance with the objective identification and rationality test methods for the NCCV introduced in the research method section of this study, combined with the divisions of the SCV and NCV and the index definition methods, the SCV index and NCV index were calculated, respectively. In Figure 2, the time series of the SCV and NCV indexes for the period ranging from 1979 to 2018 are shown. The following conclusions were drawn from the data shown in Figure 2. First of all, the NCV index was observed to be generally larger than the SCV index, which indicated that the NCCV system had a greater influence on the northern sections of the NEC region than on the southern sections. Secondly, the correlation coefficients of the two indexes had not passed the significance tests according to the calculation results, which indicated that they were mutually independent. In addition, it was further indicated that it was reasonable to divide the NCCV into the SCV and NCV. Finally, a trend was evident that both the SCV and NCV had failed to pass the significance tests.
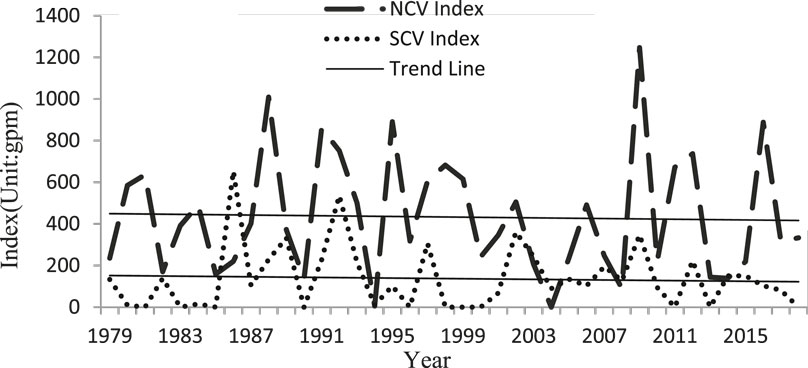
FIGURE 2. Time series of the Southern Cold Vortex (SCV) and Northern Cold Vortex (NCV) indices for the period ranging from 1979 to 2018.
Figures 3A,B show the distribution of the correlation coefficients between the SCV and NCV, respectively, and the temperature values during the early summer months in the NEC region from 1979 to 2018. It can be seen in the figures that the negative correlations between the SCV indexes and the temperature values in the middle and southern sections of the NEC region during the early summer months had passed the significance tests. Meanwhile, those in the northern sections of the NEC region had not passed the significance tests. Among those, it was determined that the failure to pass the significance test in a small part of the southern end of the region was related to the lower activities of the cold vortex in the south sections of the NEC region. The negative correlations between the NCV indexes and the temperature values in the middle and northern part of the NEC region during the early summer months passed the significance tests. These findings indicated that that the SCV and NCV indexes could significantly affect the temperature anomalies in the southern and northern parts of the NEC region in early summer, and that the definitions of the SCV and NCV indices were basically reasonable.
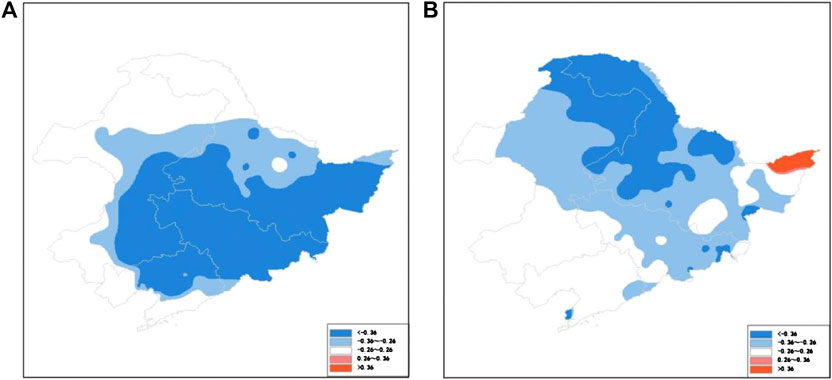
FIGURE 3. Distribution of the correlation coefficients of the (A) Southern Cold Vortex; and (B) Northern Cold Vortex with the temperature values during the early summer months in the Northeastern China region from 1979 to 2018. Shading indicates the correlation coefficients at the 90% confidence level.
Relationship Between the Southern Cold Vortex and Northern Cold Vortex Indexes and the Early Stages of the Global SSTs
As one of the external forcing signals of atmospheric conditions, SSTs will affect the climate through air-sea interactions. In this section of the study, the focus was determining whether or not the early SST factors were related to the SCV and NCV indexes during the early summer seasons in the study area. In addition, the relationships between the SSTs and the SCV and NCV indexes in early summer were analyzed.
Relationships Between the Southern Cold Vortex Indexes and the SST Fields
Figures 4A,B show the distributions of the correlation coefficients of the SCV indexes and the SSTs in March and April, respectively, for the period ranging from 1979 to 2018. It can be seen in the figures that the most significant and sustained signals of the Global SSTs were located in the North Atlantic region, and the signals in April were slightly stronger than those in March. In March and April, there was observed to be a correlation distribution of “− + −” from north to south, and the negative correlations between the south and north had passed the significance tests. This correlation distribution pattern reflected the continuous influences of the NAT anomalies which occurred during March and April on the NCCV in the early summer months. That is to say, the positive (negative) phases of the NAT in early March and April had a strong (weak) correspondence to the SCV. Therefore, it was preliminarily considered in this study that the NAT anomalies in March and April were the SST factors causing the intensity anomalies of the SCV.
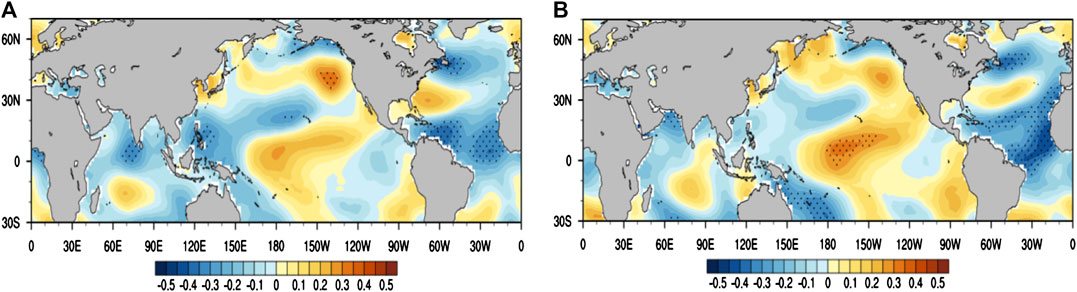
FIGURE 4. Distribution of the correlation coefficients between the Southern Cold Vortex index and the SSTs in (A) March; and (B) April for the period ranging from 1979 to 2018. Note: the point areas represent the locations where the correlation coefficients passed the significance tests.
Relationships Between the Northern Cold Vortex Indexes and the SSTs
Figures 5A–E show the distributions of correlations between the NCV indexes and the SSTs from January to May in the years 1979–2018. It can be seen in the figures that there were two very significant and persistent signals in global SSTs. For example, the south-north inverse SSTs of the northwest Pacific Ocean from January to March, and the SSTs of the tropical Southeast Pacific Ocean from April to May. Among those, the NCV indexes displayed significant positive correlations (positive in the north and negative in the south) with the northwest Pacific Ocean SSTs from January to March, and displayed significant positive correlations with the tropical Southeast Pacific Ocean SSTs from April to May. When the Northwest Pacific presented the trends of positive in the north and negative in the south for the SST anomalies from January to March, these were considered to be favorable conditions for the higher intensities of the NCV. They were otherwise were favorable for the lower intensities of the NCV. In addition, when the SSTs of the tropical Southeast Pacific Ocean were higher (lower) from April to May, the conditions were considered favorable for the higher (lower) intensities of the NCV. Therefore, this study preliminarily considered that the anomalies in the south-north inverse SSTs of the Northwest Pacific from January to March, and the SSTs in the tropical Southeast Pacific from April to May, were the SST factors causing the intensity anomalies of the NCV.
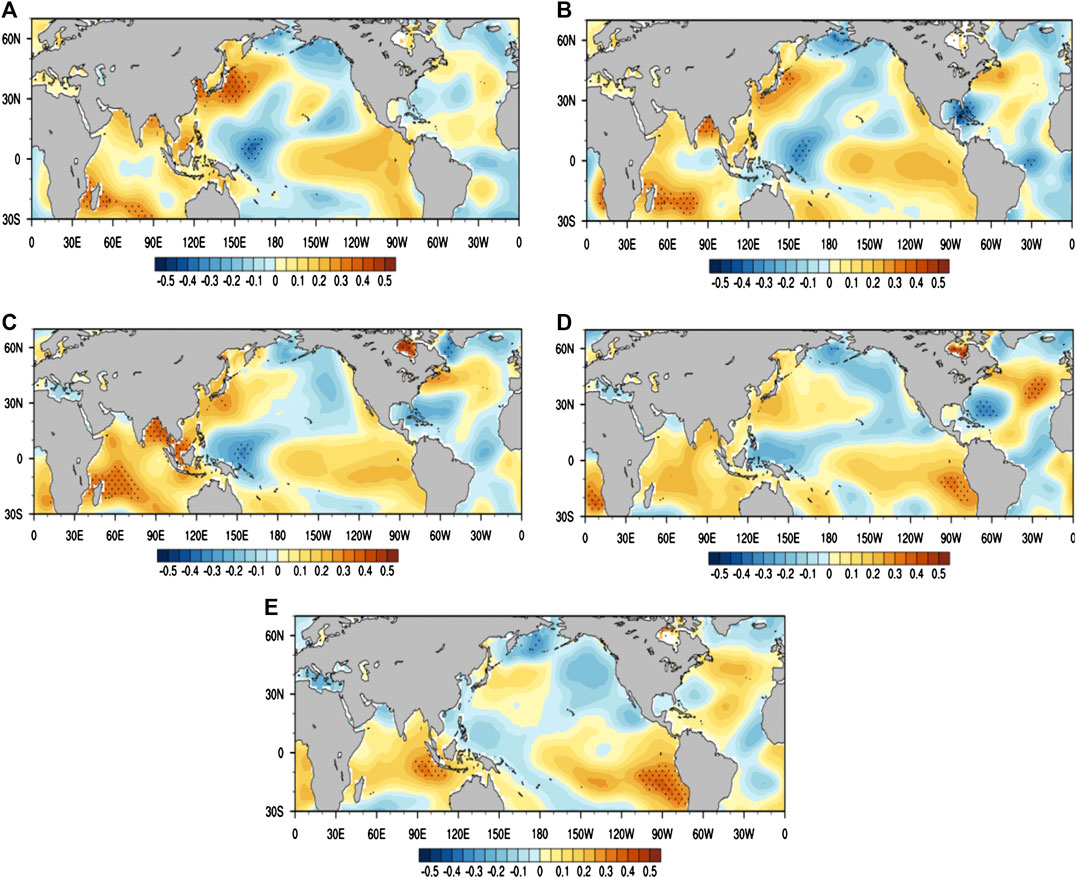
FIGURE 5. (A–E) Distributions of correlation coefficients between the Northern Cold Vortex indexes and SSTs from January to May during the period ranging from 1979 to 2018. Note: the point areas represent the areas where the correlation coefficients passed the significance tests.
In order to further verify the correlation between the intensities of the NCV during the different examined years and the key areas of SSTs in the early stages, the 21-years running correlation coefficients of the intensity indexes of the NCV from 1979 to 2018 with the south-north inverse SST indexes of the Northwest Pacific (March) and SST indexes of the tropical Southeast Pacific (May) are shown in Figures 6A,B respectively. It can be seen in Figure 6A that, roughly before the year of 2000, the coefficients of running correlations between the NCV intensity indexes and the south-north inverse SST indexes of the Northwest Pacific in March had stably passed the significance tests of 0.05 reliability. Meanwhile, after 2000, the coefficients of running correlations had failed to pass the significance tests. In addition, it can be seen in Figure 6B that, roughly after 1999, the coefficients of running correlations between the NCV intensity indexes and the SST indexes of the tropical Southeast Pacific in May had successfully passed the significance tests of 0.05 reliability. Therefore, it was observed in this study that the SST indices of the two key areas were significantly correlated with the intensity indexes of the NCV before and after 2000. Therefore, it was preliminarily assumed that the intensities of the NCV during the period ranging from 1979 to 1999 were mainly affected by the south-north inverse SSTs of the Northwest Pacific in March. Meanwhile, the intensities of the NCV from 2000 to 2018 were mainly affected by the SSTs of the tropical Southeast Pacific in May. The phase of Pacific Decadal Oscillation (PDO) exhibited an interdecadal reversed around 2000, and the influence of south-north inverse SST of the Northwest Pacific on the NCV may have been ondulated by PDO. However, the specific physical mechanism requires further study.
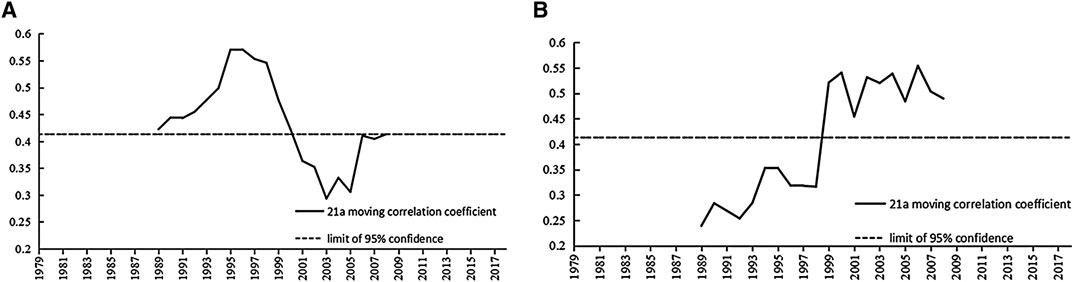
FIGURE 6. Coefficients of the 21-years running correlations of the Northern Cold Vortex intensity indexes with the (A) South-north inverse SST indexes of the Northwest Pacific in March; and (B) SST indexes of the tropical Southeast Pacific in May (1979–2018).
Relationships Between the Southern Cold Vortex and Northern Cold Vortex Indexes and the Atmospheric Circulation Fields During the Early Summer Periods
This section of the study focuses on revealing the relationships between the intensity indexes of the SCV and NCV and the atmospheric circulation fields within the same timeframes. The NCCV is known to be the most significant in the 500 hPa potential height field. Therefore, this study focused on the relationships between the 500 hPa potential height fields and the NCCV.
Figures 7A,B show the distributions of correlation coefficients of the intensity indexes of the SCV and NCV and the 500 hPa potential height field in the month of June during the investigated period. It can be seen in the figures that positive-negative alternating significant correlation areas existed along the latitude circle from the North Atlantic to the downstream near 60°N, which reflected the Rossby wave propagation characteristics. It can be seen in Figure 7A that the SCV intensity indexes had significant negative correlations with the height field of 500 hPa in June in the offshore area of China. However, there were significant positive correlations observed in the eastern Siberia areas. That is to say, the circulation types corresponding to the SCV intensity index anomalies during the same periods were the coordination types of the eastern Siberian high pressure and the offshore low pressure types (referred to as “high and low pressure coordination types”).
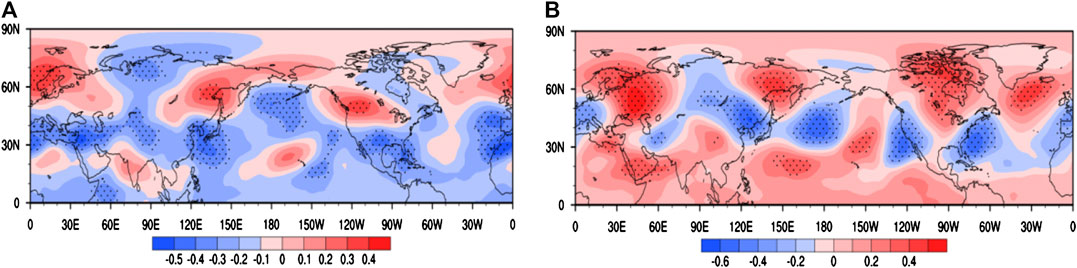
FIGURE 7. Distributions of the correlation coefficients between the (A) Southern Cold Vortex indexes; and (B) Northern Cold Vortex indexes, and the 500 hPa potential height fields in June. Note: the dotted areas represent the areas where the correlation coefficients passed the significance tests.
It can be seen from Figure 7B that the NCV intensity indexes displayed significant negative correlations with the height field of 500 hPa in June from Baikal Lake to the NEC region, while they displayed significant positive correlations with the areas west to the Ural Mountains, as well as the Okhotsk Sea and its northern areas. In other words, the circulation types corresponding to the NCV intensity index anomalies during the same time periods were the NEC Low Vortex types of the double-blocking high-pressure coordination of the Ural Mountains and the Okhotsk Sea (referred to as the “double-blocking low vortex types”). In addition, the results revealed a “+ − +” significant correlation distribution from the north to the south near 150°E. For example, the intensity of the NCV in the early summer months was also closely related to the East Asia-Pacific (EAP) teleconnection type during the same period.
Therefore, from this study’s comparison and analysis results of the data detailed in Figures 7A,B, it was determined that the main differences in the circulation types corresponding to the SCV and the NCV were reflected in the south-north positions of the circulation centers. In addition, the significant positive correlation centers of the high- and low-pressure coordination types corresponding to the SCV were determined to be roughly located at 55°N. The significant negative correlation centers were roughly located at 30°N; and the significant positive and negative correlation centers of the double-blocking low vortex types corresponding to the NCV were located at 60°N and 45°N, respectively.
Relationships Between the Early SSTs and the Atmospheric Circulation Fields During the Early Summer Periods
In the previous two sections, the contemporaneous circulation factors and the early SST factors related to the intensities of the SCV and NCV were determined, respectively. This section explores whether or not the correlation distribution patterns of the early SST factors and circulation fields in the early summer months were consistent with the contemporaneous circulation patterns of the SCV and NCV. It was believed that if they were found to be consistent, it could preliminarily be determined from the statistical relationships that the anomalies of SST factors in the early stage caused the anomalies in the circulation factors during the early summer months in the NEC region, which then led to the anomalies observed in the SCV and NCV.
Relationships Between the Key Areas of the SSTs of the Southern Cold Vortex and the Atmospheric Circulation Fields During the Early Summer Months
The distributions of the correlation coefficients between the NAT index in early April, and 500 hPa potential height fields in early summer are illustrated in Figure 8. It can be seen in the figure that there was also a positive-negative alternating correlation distribution near 60°N. However, the positive correlation area failed to pass the significance test. It was found that the significant negative correlation areas were located between northern China and Japan, and the eastern Siberia areas were the positive correlation areas. The distribution types and the intensity indexes of the SCV were found to be basically similar to the correlation distribution types (high- and low-pressure coordination types) of the 500 hPa height fields during the early summer months. Therefore, it was preliminarily considered that the abnormal forces of the NAT in early April formed the “high- and low-pressure coordination types” in early summer, which subsequently resulted in the abnormal intensities of the SCV. The wave activity fluxes in early summer regress from the previous NAT index show that the wave activity flux began from the North Atlantic and propagated downstream along the westerly belt of the northern hemisphere to East Asia (figure omitted), which further confirms that NAT may have had an effect on the NCCV. The specific mechanism will be studied in another paper. This conclusion was also determined to be similar to those reached by Fang et al. (2018) and Lu et al. (2020). It was indicated that the Atlantic SST anomalies can induce atmospheric diabatic heating, which stimulates quasi-barotropic mid- to high-latitude Rossby wave trains to the downstream along a parallel circle through the sea-air interactions. In addition, a cyclonic anomaly may have been caused in the NEC, which resulted in the abnormal intensities of the SCV. In addition, the distributions of the correlation coefficients between the NAT indexes in March and the 500 hPa potential height fields in early summer were similar to the results detailed in Figure 8. Therefore, since the significant correlation areas between the NAT and the intensity indexes of the SCV were more obvious in April than in March, the NAT in April was used in this study as the SST factor of the SCV.
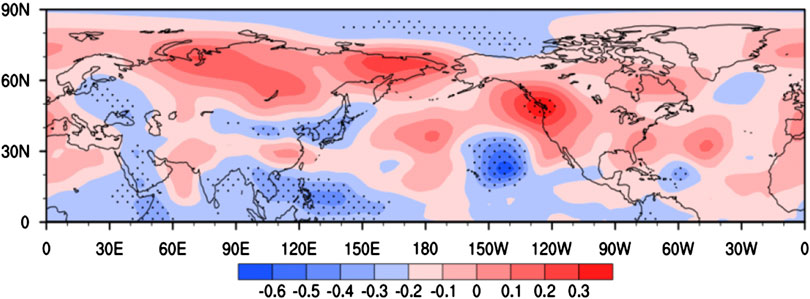
FIGURE 8. Distributions of the correlation coefficients between the North Atlantic Tripole indexes in early April and 500 hPa potential height fields in early summer. Note: the dotted areas represent the areas where the correlation coefficients passed the significance tests.
Relationships Between the Key Areas of the SSTs in the Northern Cold Vortex and the Atmospheric Circulation Fields During the Early Summer Periods
Figures 9A,B illustrate the distributions of the correlation coefficients of the south-north inverse SST indexes of the Northwest Pacific in March (1979–1999), and the SST indexes of the tropical Southeast Pacific in May (2000–2018), with the 500 hPa potential height fields in the early summer during the same periods. It can be seen in the figure that, with the exception of the differences in the locations of the significant correlation areas in some of the areas, both display the positive-negative alternating wave patterns near 60°N, and reflect the contemporaneous circulation types corresponding to the intensity indexes of NCV, that is, the “double-blocking low vortex types” and EAP teleconnection types. Therefore, it was preliminarily considered in this study that during the two periods (1979–1999 and 2000–2018), the south-north inverse SST anomalies in the Northwest Pacific Ocean in March and the SST anomalies in the tropical Southeast Pacific in May, had potentially forced the formations of double-blocking low vortex types and EAP teleconnection types during the early summer months, which subsequently led to the intensity anomalies of the NCV. The SST anomalies in the Northwest Pacific Ocean in early March may have stimulated an abnormal blockade situation in the downstream, and the blocking effect on the circulation system of the westerly belt may in turn have affected the northeastern cold vortex in early summer. Previous studies have also indicated that the subtropical southeast Pacific SST anomaly can excite an cyclone-anticyclone alternating wave train from the key area to the NEC across the northern and southern hemispheres, which can cause the anomalous atmospheric circulation anomalies in the mid-high latitudes of the northern hemisphere, thus affecting the intensity anomalies of the NCV (Gao and Gao, 2015).
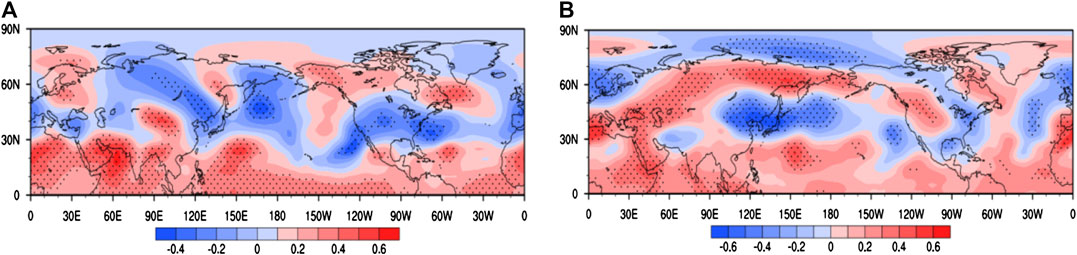
FIGURE 9. Distributions of the correlation coefficients between the (A) South-north inverse SST indexes of the Northwest Pacific in March (1979–1999); and (B) SST indexes of the tropical Southeast Pacific in May (2000–2018), and the 500 hPa potential height fields during the early summer months of the same time periods. Note: the dotted areas represent the areas where the correlation coefficients passed the significance tests.
Sensitivity Tests of the Numerical Model
The above-mentioned analysis results based on the observational data revealed the possible forcing effects of early SSTs on the atmospheric circulation fields during early summer seasons in the study area. In this section, the aforementioned observation results obtained using statistical methods were verified based on the sensitivity test results of AM2.1 global atmospheric model.
Testing of Sensitivity of the SST Factors of the Southern Cold Vortex Forces on the 500 hPa Height Fields During the Early Summer Months in the Study Area
The results of the first set of tests (NAT-Apr) are detailed in Figure 10. For example, the differences in the test results of the potential height fields between the sensitivity tests and the control tests. It can be seen in the figure that the overall distribution pattern of sensitivity test results were similar to those of observational results. The “high- and low-pressure coordination types” were also reflected. However, the overall positions were located north of the observational results. This indicated that NAT in early April had a certain physical significance in the forcing effects of high- and low-pressure coordination during the early summer periods. As previously mentioned, the Atlantic SST anomalies in early April can induce Rossby wave trains to the downstream through the sea-air interactions, which may result in the abnormal intensities of the SCV during the early summer.
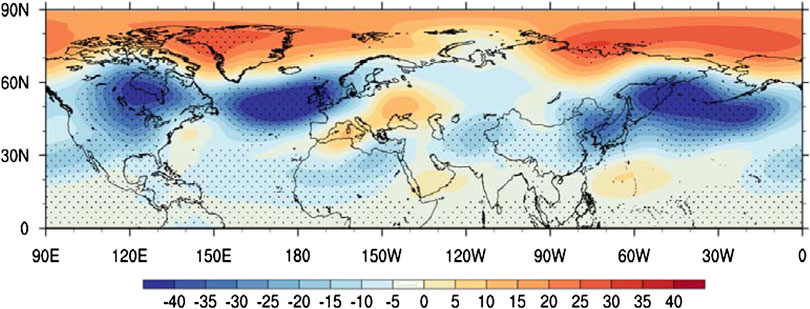
FIGURE 10. Simulated 500 hPa potential height fields during the early summer months in the first set of tests (NAT-Apr). Note: the shaded areas represent the areas where the differences between the sensitivity tests and the control tests passed the significance tests.
Testing of Sensitivity of the SST Factors of the Northern Cold Vortex Forces on the 500 hPa Height Fields During the Early Summer Periods in the Study Area
Figures 11A,B display the results of the second set of test (south-north inverse SST of the Northwest Pacific-Mar) and the third set of test (SST of the tropical Southeast Pacific-May), respectively. It can be seen in the figures that the overall distribution patterns of the two sets of sensitivity test results were very similar to the observational results (Figure 7B). Moreover, the “double-blocking low vortex types” and the EAP teleconnection types were also reflected. However, the overall positions, as well as the significance levels of the differences, had varied from the observational results. These results indicated that the south-north inverse SSTs of the Northwest Pacific in March, and SSTs of the tropical Southeast Pacific in May, had displayed physical significance in relation to the forcing effects of the “double-blocking low vortex types” and the EAP teleconnection types, respectively, during the early summer months in the study area. As previously analyzed, during the period 1979–1999, the intensity anomalies of the NCV in early summer may be mainly caused by the abnormal blockade situation in the downstream of NEC that stimulated by the SST anomalies in the Northwest Pacific Ocean in March. Additionally, during the period 2000–2018, the subtropical southeast Pacific SST anomalies in May play a major role in intensity anomalies of the NCV during the early summer. It excited an cyclone-anticyclone alternating wave train to the NEC across the northern and southern hemispheres, which can cause the anomalous atmospheric circulation anomalies in the mid-high latitudes of the northern hemisphere, thus inducing the intensity anomalies of the NCV. The above conclusion is based on sensitivity test and preliminary analysis of possible causes, the specific mechanism of which requires further analysis.
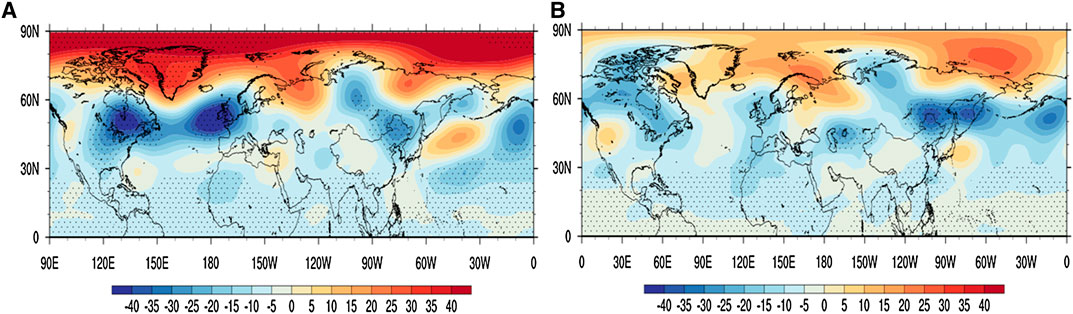
FIGURE 11. Simulated 500 hPa potential height fields during early summer in the (A) second set; and (B) third set of tests. Note: the shaded areas represent the areas where the differences between the sensitivity tests and the control tests had passed the significance tests.
Conclusions and Discussion
In this study, the NCCV processes were objectively identified by an improved objective identification method, and then divided into SCV and NCV. This study adopted statistical analysis and numerical simulation methods in order to examine the mechanisms of the influences of the SSTs in the early stage, as well as the atmospheric circulation fields during the early summer months, on the intensities of the SCV and NCV. The following conclusions were obtained from this study’s analysis:
(1) During the period ranging from 1979 to 2018, there were no significant variation trends in the SCV and NCV indices. The NCV indexes were found to be generally larger than the SCV indexes, indicating that the impacts of the NCCV systems on the north areas of the NEC region were stronger than on the southern areas. The correlation coefficients of the SCV and NCV indices failed to pass the significance tests, which suggested that it was reasonable to divide the NCCV into the SCV and NCV for individual analysis purposes.
(2) The intensity indexes of SCV and NCV were negatively correlated with the air temperature in the south-central sections of NEC and the north-central sections of NEC, respectively. It was confirmed that the definitions of the intensity indexes of the SCV and NCV were reasonable, as the low air temperature were corresponding to the strong cold vortex.
(3) In April of the previous years during the investigated periods, the unusual force of the NAT formed “high- and low-pressure coordination types” during early summer, which resulted in abnormal intensities of the SCV. The south-north inverse SST anomalies in the Northwest Pacific in March and the SST anomalies in the tropical Southeast Pacific in May forced the formations of “double-blocking low vortex types” and EAP teleconnection types in the early summer months during the periods ranging from 1979 to 1999 and 2000 to 2018, respectively, which subsequently resulted in anomalies in the intensities of the NCV.
(4) The AM2.1 model had the ability to most effectively simulate the forces of the SSTs in the observation results on the circulation patterns in the early summer during the preliminary stage. However, the results had varied from the observational results in positions and significance degrees. These findings further verified the reliability of the statistical analysis results, and confirmed that the statistical analysis results had a certain physical significance.
Due to the fact the NCCV weather processes were dominated by east-west moving paths, this study focused on the difference in the south-north positions of the NCCV. Therefore, some differences existed between the east and west positions of the NCCV, and relevant research investigations will be carried out accordingly. In addition, the observational results and numerical simulation results of the relationships between the SCV and the influencing factors were not as good as those of the NCV. This may have been due to the relatively small number of available samples for the SCV, and the fact that it was not a typical type of cold vortex in the NCCV. Therefore, in future studies, other methods will be used to conduct classified examinations of the NCCV processes. Moreover, the influence mechanisms of the SSTA over different key areas on the SCV and NCV in early summer were only discussed based on sensitivity testing and preliminary analysis, and the factors involved will be examined in future studies. Finally, in what way does the PDO modulates the influence of South-north inverse SST of the Northwest Pacific on the NCV is a matter that will also be explored.
Data Availability Statement
Publicly available datasets were analyzed in this study. This data can be found here: Atmospheric circulation data [https://apps.ecmwf.int/datasets/data/interim-full-daily/levtype=sfc/], Sea surface Temperature data [https://psl.noaa.gov/data/gridded/data.noaa.ersst.v4.html], and Precipitation observation data [http://idata.cma/idata/web/data/index?dataCode=SURF_CLI_CHN_MUL_DAY_V3].
Author Contributions
YF and YL, carried out the conception; HR, conception and design of the study; CZ and FZ, analysis of the data; and QL and CG, draw the figures.
Funding
This research was jointly supported by the National Natural Science Foundation of China (Grant No. 42005037); Liaoning Provincial Natural Science Foundation Project (PhD Start-up Research Fund 2019-BS-214); Special Scientific Research Project for the Forecaster (No. CMAYBY2018-018); Key technical project of Liaoning Meteorological Bureau; the National Key Research and Development Project (2018YFC1505601); Research Project of the Institute of Atmospheric Environment, CMA (2020SYIAE08 and 2020SYIAEZD5).
Conflict of Interest
CG is employed by the company Nanjing ZStar Software Technology Ltd.
The remaining authors declare that the research was conducted in the absence of any commercial or financial relationships that could be construed as a potential conflict of interest.
References
Bu, H. C. L., and Xie, Z. W. (2013). NCCV circulation and its dynamical features. Adv. Meteorol. Sci. Technol. 3, 34–39 [in Chinese]. doi:10.3969/j.issn.2095-1973.2013.03.005
Chen, H. S., Yang, J. Q., Zhang, W. X., and Teng, F. D. (2018). Possible linkages among early summer precipitation in NCCV and spring land surface thermal anomaly over West Asia. J. Mar. Meteorol. 38, 10–16 [in Chinese]. doi:10.19513/j.cnki.issn2096-3599.2018.01.002
Ding, T., Yuan, Y., Zhang, J., and Gao, H. (2019). 2018: the hottest summer in China and possible causes. J. Meteorol. Res. 33, 577–592. doi:10.1007/s13351-019-8178-y
Fang, Y.-H., Chen, H.-S., Gong, Z., Xu, F., and Zhao, C. (2017a). Multi-scheme corrected dynamic-analogue prediction of summer precipitation in northeastern China based on BCC_CSM. J. Meteorol. Res. 31, 1085–1095. doi:10.1007/s13351-017-7069-3
Fang, Y.-H., Chen, H.-S., Teng, F.-D., Wang, X.-J., Wang, J., and Zhao, C.-Y. (2017b). Changing contribution rate of heavy rainfall to the rainy season precipitation in northeast China and its possible causes. Atmos. Res. 197, 437–445. doi:10.1016/j.atmosres.2017.07.030
Fang, Y.-H., Chen, K.-Q., Chen, H.-S., Xu, S.-Q., Geng, X., Li, T.-Y., et al. (2018). The remote responses of early summer cold vortex precipitation in northeastern China to the precedent sea surface temperatures. Atmos. Res. 214, 399–409. doi:10.1016/j.atmosres.2018.08.007
Fang, Y. H., Gong, Z. Q., and Chen, H. S. (2016). Objective identification research on China northeast cold vortex precipitation period. Meteorol. Mon. 42, 80–88. doi:10.7519/j.issn.1000-0526.2016.01.010.
Gao, J., and Gao, H. (2015). Relationship between summer precipitation over northeastern China and sea surface temperature in the southeastern Pacific and the possible underlying mechanisms. Chin. J. Atmos. Sci. 39, 967–977 [in Chinese]. doi:10.3878/j.issn.1006-9895.1503.14246
Gao, J., and Gao, H. (2018). Influence of the northeast cold vortex on flooding in northeast China in summer 2013. J. Meteorol. Res. 32, 172–180. doi:10.1007/s13351-018-7056-3
GFDL Global Atmospheric Model Development Team (2004). The new GFDL global atmosphere and land model AM2-LM2: evaluation with prescribed SST simulations. J. Clim. 17, 4641–4673. doi:10.1175/JCLI-3223.1
Gong, Z.-Q., Feng, T.-C., and Fang, Y.-H. (2015). Objective identification research on cold vortex and mid-summer rainy periods in northeast China. Chin. Phys. B 24, 49204–49211. doi:10.1088/1674-1056/24/4/049204
He, J., Wu, Z., Jiang, Z., Miao, C., and Han, G. (2007). “Climate effect” of the northeast cold vortex and its influences on Meiyu. Chin. Sci. Bull. 52, 671–679. doi:10.1007/s11434-007-0053-z
He, J. H., Wu, Z. W., Qi, L., and Jiang, A. J. (2006). Relationships among the Northern Hemisphere annual mode, the northeast cold vortex and the summer rainfall in NEC. J. Meteorol. Environ. 22, 1–5 [in Chinese]. doi:10.3969/j.issn.1673-503X.2006.01.001
Hu, K. X., Lu, R. Y., and Wang, D. H. (2011). Cold vortex over NEC and its climate effect. Chin. J. Atmos. Sci. 35, 179–191 [in Chinese]. doi:10.3878/j.issn.1006-9895.2011.01.15
Li, C., Han, G. R., and Sun, Y. (2015). Anomalous features of northeast cold vortex in late 50 a and its correlation with rainfall in Huaihe River valley. Sci. Meteorol. Sin. 35, 216–222 [in Chinese]. doi:10.3969/2014jms.0092
Li, H. Y., Zhang, W. J., He, J. H., and Wang, Y. L. (2016). Influence of SST annual cycle on local air-sea processes during El Nino events. Hai Yang Xue Bao 38, 56–68 [in Chinese]. doi:10.3969/j.issn.0253-4193.2016.01.006
Li, J., Fang, Y. H., Li, F., and Hu, C. L. (2014). Large-scale circulation factors of early summer precipitation in Liaoning province and causes analysis of heavy precipitation in 2012. Meteorol. Mon. 40, 1114–1122 [in Chinese]. doi:10.7519/j.issn.1000-0526.2014.09.009
Lian, Y., Bu, H. C. L., Xie, Z. W., Shen, B. Z., and Li, S. F. (2010). The anomalous cold vortex activity in NEC during the early summer and the low-frequency variability of the Northern Hemispheric atmosphere circulation. Chin. J. Atmos. Sci. 34, 429–439 [in Chinese]. doi:10.3724/SP.J.1037.2010.00186
Liu, G., Feng, G. L., Qin, Y. L., Zeng, Y. X., Yang, X., and Yao, S. (2017). “Cumulative effect” of cold vortex precipitation in NEC in early summer. Chin. J. Atmos. Sci. 41, 202–212. doi:10.3878/j.issn.1006-9895.1602.15231
Liu, G., Lian, Y., Yan, P. C., Zeng, Y. X., Yang, X., and Cao, L. (2015). The objective recognition and classification of northeast cold vortex and analyses of the Northern Hemisphere atmospheric circulation characters in May to August. Sci. Geogr. Sin. 35, 1042–1050 [in Chinese]. doi:10.1016/j.chnaes.2015.06.005
Liu, G., Qu, M., Feng, G., Chu, Q., Cao, J., Yang, J., et al. (2018). Application study of monthly precipitation forecast in NEC based on the cold vortex persistence activity index. Theor. Appl. Climatol. 135, 1079–1090. doi:10.1007/s00704-018-2399-3
Liu, Z. X., Lian, Y., Gao, Z. T., Sun, L., and Shen, B. Z. (2002). Analyses of the Northern Hemisphere circulation characters during northeast cold vortex persistence. Chin. J. Atmos. Sci. 26, 361–372 [in Chinese]. doi:10.3878/j.issn.1006-9895.2002.03.07
Lu, R., Zhu, Z., Li, T., and Zhang, H. (2020). Interannual and interdecadal variabilities of spring rainfall over northeast China and their associated sea surface temperature anomaly forcings. J. Clim. 33, 1423–1435. doi:10.1175/JCLI-D-19-0302.1
Miao, C. S., Wu, Z. W., and He, J. H. (2006a). Relationship among the Northern Hemisphere annual mode, the NCCV and the precipitation during the first yearly rainy period in South China. J. Trop. Meteorol. 22, 593–599 [in Chinese]. doi:10.16032/j.issn.1004-4965.2006.06.011
Miao, C. S., Wu, Z. W., He, J. H., and Chi, Y. Z. (2006b). The anomalous features of the northeast cold vortex during the first flood period in the last 50 years and its correlation with rainfall in South China. Chin. J. Atmos. Sci. 30, 1249–1256 [in Chinese]. doi:10.3878/j.issn.1006-9895.2006.06.19
Stuecker, M. F., Timmermann, A., Jin, F.-F., McGregor, S., and Ren, H.-L. (2013). A combination mode of the annual cycle and the El Niño/Southern Oscillation. Nat. Geosci. 6, 540–544. doi:10.1038/ngeo1826
Sun, L., Zheng, X. Y., and Wang, Q. (1994). The climatological characteristics of northeast cold vortex in China. J. Appl. Meteorol. Sci. 5, 297–303 [in Chinese]. doi:10.3878/j.issn.1006-9895.1503.14246
Wang, C. W., Xu, H. M., and Ren, L. (2012). The objective identification method of northeast cold vortex. J. Meteorol. Environ. 28, 1–4 [in Chinese]. doi:10.3969/j.issn.1673-503X.2012.02.001
Wang, D., Chen, H. S., and Zhao, C. Y. (2018). Connection between spring land surface thermal anomalies over West Asia and decadal variation of early summer cold vortex in NEC. Chin. J. Atmos. Sci. 42, 70–80 [in Chinese]. doi:10.3878/j.issn.1006-9895.1706.16284
Wernli, H., and Sprenger, M. (2007). Identification and ERA-15 climatology of potential vorticity streamers and cutoffs near the extratropical tropopause. J. Atmos. Sci. 64, 1569–1586. doi:10.1175/JAS3912.1
Xie, Z. W., and Bu, H. C. L. (2012). Low frequency characteristics of NCCV and its background circulation pattern. J. Meteorol. Res. 70, 704–716 [in Chinese]. doi:10.11676/qxxb2012.057
Xie, Z. W., and Bueh, C. (2016). Cold vortex events over northeast China associated with the Yakutsk-Okhotsk blocking. Int. J. Climatol. 37, 381–398. doi:10.1002/joc.4711
Zhao, J., Zhou, J., Xiong, K., and Feng, G. (2019). Relationship between tropical Indian ocean SSTA in spring and precipitation of northeast China in late summer. J. Meteorol. Res. 33, 1060–1074. doi:10.1007/s13351-019-9026-9.
Keywords: Northeastern China Cold Vortex, early summer months, south-north positions of the Northeastern China Cold Vortex, Southern Cold Vortex and Northern Cold Vortex, North Atlantic Tripole, south-north inverse SSTs of the northwest Pacific, SSTs of the tropical southeast Pacific, model sensitivity testing
Citation: Fang Y-H, Lin Y-T, Ren H-L, Zhao C-Y, Zhou F, Li Q, Gu C-L (2020) Possible Relationships Between the Interannual Anomalies of the South-North Positions of the Northeastern China Cold Vortexes and the Sea Surface Temperatures (SSTs) During the Early Summer Periods. Front. Earth Sci. 8:557014.
Received: 29 April 2020; Accepted: 16 September 2020;
Published: 06 October 2020.
Edited by:
Zhu Zhiwei, Nanjing University of Information Science and Technology, ChinaReviewed by:
Tan Guirong, Nanjing University of Information Science and Technology, ChinaWu Shu, University of Wisconsin–Madison, United States
Copyright © 2020 Fang, Lin, Ren, Zhao, Zhou, Li and Gu. This is an open-access article distributed under the terms of the Creative Commons Attribution License (CC BY). The use, distribution or reproduction in other forums is permitted, provided the original author(s) and the copyright owner(s) are credited and that the original publication in this journal is cited, in accordance with accepted academic practice. No use, distribution or reproduction is permitted which does not comply with these terms.
*Correspondence: Hong-Li Ren, UmVucmVuaGxAY21hLmdvdi5jbg==