 Yingying Tian1Lewis A. Owen2Chong Xu1,3*Lingling Shen4Qing Zhou1Paula Marques Figueiredo2
- 1Key Laboratory of Active Tectonics and Volcano, Institute of Geology, China Earthquake Administration, Beijing, China
- 2Department of Marine, Earth, and Atmospheric Sciences, North Carolina State University, Raleigh, NC, United States
- 3National Institute of Natural Hazards, Ministry of Emergency Management of China, Beijing, China
- 4Beijing Meteorological Information Center, Beijing Meteorological Service, Beijing, China
The 2015 Mw 7.8 Gorkha earthquake in Nepal and the Mw 7.3 aftershock triggered at least 22,914 landslides that each had areas ≥500 m2 and lengths and widths ≥20 m. Amongst these landslides, 2,059 had areas >10,000 m2. Analyses of the landslide geometry, using length (L), width (W), height (H, from the crown to toe), reach angle (arctan value of H/L), and aspect ratio (L/W), show that most of the landslides have aspect ratios of 1.6–3.6 and reach angles of 35–45°. The fitting relationship between H and L is H = 0.87L − 11.11. The steep topography is likely the main factor that controls the landslide runout and planar shape. The landslides are divided into 3 geomorphometric categories using the aspect ratio: LS1 (L/W ≤ 2); LS2 (2 < L/W ≤ 4); and LS3 (L/W > 4). Statistical analyses of these categories with the control factors show that the landslide distribution does not relate to the three large-scale geologic faults that traverse the region, roads, accumulative precipitation before the earthquakes, and the small earthquakes that occurred during the 2012–2015 pre-monsoons in the study area. The 3 landslide categories are sensitive to similar conditions related to curvature, slope position, lithology, and peak ground acceleration. In contrast, the effects of elevation, slope angle, slope aspect, and streams on landslide distribution differ. Moreover, massive landslides (with areas >10,000 m2) are more likely to occur on the steeper hill slopes that in the higher elevation settings, which provide more substantial gravitational potential energy and long-runout space. As landslides with different geomorphometric shapes have various susceptible conditions, examining the landslide distribution based on their geometric characteristics provides a new way to study the landslide extent and mechanism.
Highlights
(1) Geomorphometric parameters of landslides triggered by the 2015 Gorkha earthquakes are defined;
(2) Spatial distributions of the landslides of different planar shapes show their vulnerable factor conditions;
(3) Landslides with areas >10,000 m2 are more likely to occur on the steeper hill slopes and in higher elevation settings;
(4) The terrain and streams are the major factors controlling the spatial distributions of landslides with various shapes and sizes.
Introduction
Geometric characteristics of earthquake-triggered landslides are associated with factors such as geomorphology, bedrock, soil, topography, vegetation, and seismic ground motion (Yang et al., 2006; Tian et al., 2017). Under strong ground shaking during an earthquake, hill slopes with larger slope angles, higher slope positions, and highly fractured rock masses can generate landslides with a more considerable fall height, smaller width, and larger length/travel distances (Nicoletti and Sorriso-Valvo, 1991). Since they run long distances, such landslides always have relatively greater mobility and likely lead to more significant hazards along their paths. Thus, the geomorphometric features of earthquake-triggered landslides have the potential to be used to study landslide mechanisms and hazard assessment (Hsü, 1975; Corominas et al., 2003; Xu et al., 2016a). Height (H), length (L), width (W), reach angle (arctan value of the height-length ratio, arctan [H/L]), and aspect ratio (length-width ratio, L/W) are primary parameters that can characterize the geometry of a landslide. Our method section below provides our full definitions of these descriptors. Among them, the reach angle and aspect ratio represent the relative mobility and 2-D morphology of landslides, respectively (Heim, 1932; Scheidegger, 1973; Corominas 1996; Xu et al., 2014; Xu and Xu, 2014; Tian et al., 2017; Roback et al., 2018; Tsou et al., 2018). As well, the aspect ratio has relationships with the landslide type (Parise and Jibson, 2000).
On April 25, 2015, an Mw 7.8 earthquake (28.230°N, 84.731°E, known as the Gorkha earthquake) with a focal depth of 8.2 km shook central Nepal, followed by an Mw 7.3 aftershock (27.809°N, 86.066°E) on May 12, 2015, that had a focal depth of 15 km. These earthquakes resulted in >8,800 fatalities and about US $7 billion in economic loss. Field surveys and synthetic aperture radar (SAR) analysis suggest that the earthquake-triggered landslides were the leading cause of the casualties, injuries, and financial damages in the affected area (Collins and Jibson, 2015; Moss et al., 2015; Yun et al., 2015). In all, the 2015 Gorkha earthquakes triggered >47,200 landslides (Xu et al., 2018). The Langtang landslide, in the Rasuwa region of Nepal, was the most colossal slope failure that was triggered by the Gorkha earthquake; it swept across the village of Langtang, resulting in >200 deaths (Collins and Jibson, 2015). Studies on these landslides include field investigations, interpretations of imagery, spatial distribution, and susceptibility assessment (Collins and Jibson, 2015; Kargel et al., 2016; Martha et al., 2016; Regmi et al., 2016; Xu et al., 2016b; Xu et al., 2017; Roback et al., 2018; Tsou et al., 2018), but there was little geomorphometry research. Tsou et al. (2018), e.g., presented a preliminary analysis on the planar geometry of the 912 seismic landslides in the Trishuli Valley, central Nepal following the Gorkha earthquake. In the study by Tsou et al. (2018), the landslide lengths range from 7 to 1,145 m, about 60% of which had aspect ratios (L/W) ≥ 5, and 90% ≥ 1.67. Roback et al. (2018) applied the L/H ratio to study the landslide mobility, showing that most of these landslides had L/H values close to 1 (the average L/H is 1.17). They found that the 38 most highly mobile landslides had L/H ratios >2 and runouts >200 m and mostly in an elevation range of 2,500–3,000 m above sea level (asl).
In this paper, we present an extensive study of the landslides to consider further the geomorphometric features of the landslides triggered by the 2015 Gorkha earthquake and to understand better the variety and nature of earthquake-triggered landslides in high mountain regions. Using the >47,200 landslides of Xu et al. (2018), we study landslides with areas >500 m2 and lengths and widths longer than 20 m (totally 22,914 landslides) to make an exhaustive analysis of their geometry, including the H, L, W, H/L ratio and aspect ratio. According to their aspect ratios, they are classified into three categories to statistically study their spatial distribution patterns with control factors, including terrain, geology, seismicity, streams, roads, and rainfalls. Our analysis helps in understanding the movement mechanisms of seismic landslides with different geomorphometric characteristics and it is essential to assess geologic hazard in the affected area better, and for similar tectonically active mountain regions.
Tectonic Setting and Study Area
Since the collision with Eurasia plate in the Cenozoic, the Indian plate has continuously moved northward, resulting in the 2,500 km-long Himalayan orogen and creating one of the most tectonically active regions on Earth. Many great earthquakes have shaken the region during the last few centuries, including the 1833 Mw ∼ 7.6 Kathmandu, 1905 Mw ∼ 7.8 Kangra, 1934 Mw ∼ 8.2 Nepal-Bihar, 1950 Mw 8.4 Assam-Tibet, and the 2005 Mw 7.6 Kashmir earthquakes (Berthet et al., 2014; Liu et al., 2015; Elliott et al., 2016; Owen 2017). From north to south, the orogen consists of the Tethyan Himalaya, High/Greater Himalaya, Lesser Himalaya, and sub-Himalaya which are bounded by South Tibetan Detachment System (STDS), Main Central Thrust (MCT), Main Boundary Thrust (MBT), and Main Frontal Thrust (MFT), respectively (Yin and Harrison, 2000; Moss et al., 2015). Amongst these continental-scale structures, the MCT, MBT, and Main Frontal Thrust are the three outcropping branch faults of the basal decollement zone, i.e., Main Himalaya Thrust (MHT), between the Indian and Eurasia continental lithospheric plates within the deep crust (Lavé and Avouac, 2000; Wobus et al., 2006; Liu et al., 2015). The April 25, 2015 Mw 7.8 mainshock and the May 12 Mw 7.3 aftershock were focused on the MHT that dips to the north at an angle of ∼10° (Figure 1B). The mainshock rupture propagated eastwards for ∼140 km and did not reach the topographic surface; there were no identified surface ruptures (Avouac et al., 2015; Hayes et al., 2015; Elliott et al., 2016; Gallen et al., 2017).
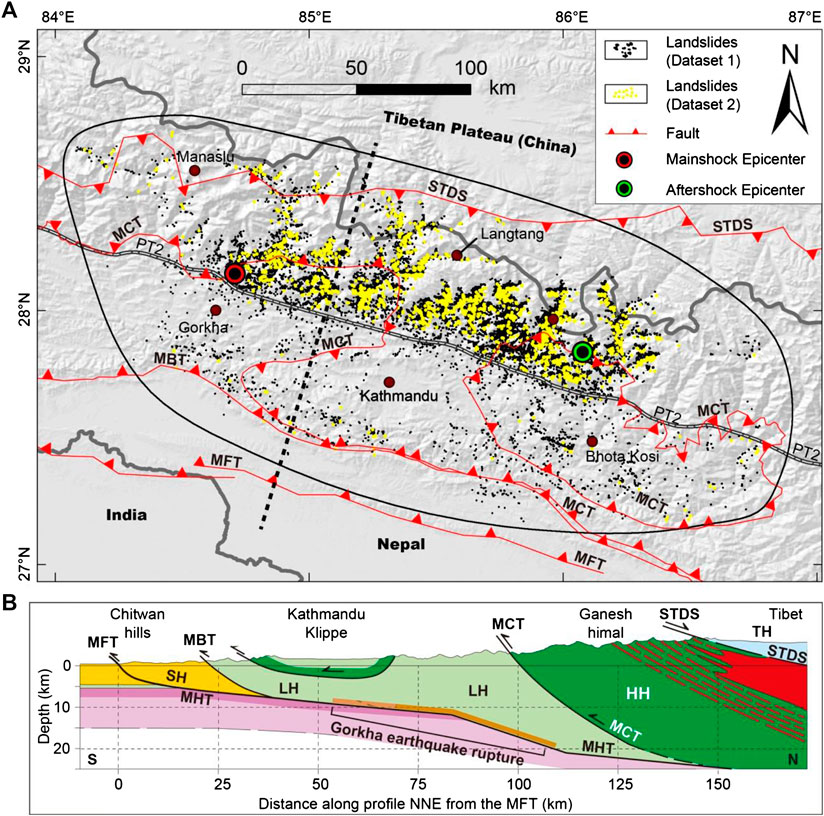
FIGURE 1. (A) Digital elevation model that highlights the main tectonic structures that traverse the study area (outlined by the quasi-ellipse by the thin black line) and distribution of the 2015 earthquake-triggered landslides and the Gorkha earthquake and its Mw 7.3 aftershock. (B) Simplified cross-section across the Ganesh-Langtang Himalaya [from Elliott et al. (2016)], its approximate location is shown as a black dashed line in (A). TH: Tethyan Himalaya, HH: High Himalaya; LH: Lesser Himalaya; SH: sub-Himalaya; STDS: South Tibetan Detachment System; MCT: Main Central Thrust; MBT: Main Boundary Thrust; PT2: Physiographic Transition [digitalized from Whipple et al. (2016)]. Dataset 1 (22,914 landslides that are >500 m2 and have L and W both >20 m) and Dataset 2 (2,059 landslides, which are >10,000 m2) are from Xu et al. (2018).
Our study area is a mountainous region with deep gorges in central and eastern Nepal and part of southern Tibet covering ∼35,664 km2 (Figure 1A). The transition between Lesser and Higher Himalaya is known as physiographic transition 2 (PT2), and it reflects an abrupt elevation change, which marks the significant northward increase in rock-uplift rate (Hodges et al., 2004; Whipple et al., 2016). The PT2 runs from west to east along an elevation profile of ∼2,000 m asl across the study area (Figure 1A). The study area rises northwards from ∼150 to 8,135 m asl with an average of 2,600 m asl. The areas with elevations exceeding 3,500 m account for 33% of the total study area. Hill slope angles range up to 87° (mainly concentrated in the regions higher than 6,000 m asl) with an average of 27°; 27% of the entire region has hill slopes >35°. The climate is tropical-subtropical monsoonal, with the rainy season from June to September, and the mean annual rainfall varying from 500 to 3,500 mm, and the northern Himalaya is relatively dry (the average rainfall is <1,000 mm; Dahal and Hasegawa, 2008).
Data and Method
Definition of Landslide Geometry
We define the height (H) of a landslide as the elevation difference between the crown and toe along the movement direction (Figure 2). The 10 m-resolution DEM originated from the 30 m-resolution SRTM DEM was applied to estimate the heights for the 22,914 landslides. The length (L) and width (W) of a landslide are the corresponding values of the landslide minimum bounding geometry along the sliding direction (Tian et al., 2017). We separately created the convex hulls (the smallest convex polygon) and the minimum bounding rectangles (we used the rectangle with the smallest width), which enclose each landslide. Then, we calculated and checked the angle between the orientations of the geometries (solid green lines in Figure 2) and the line directions linking the highest and lowest points (dash green lines in Figure 2) for every landslide. For significant differences, we manually measured (using the measure tool) or chose the most approximate values as landslide L and W (Figures 2A,D); and for the smaller differences, we adapted the L and W of the minimum bounding rectangles (Figures 2B,C and 2E,F). All the analysis was conducted using the tools available in ArcGIS 10.5.
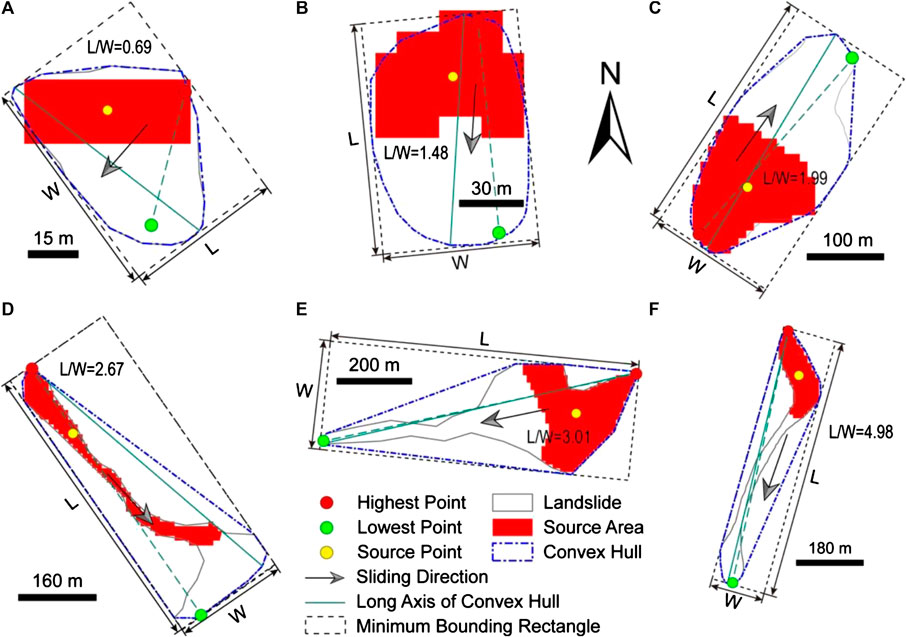
FIGURE 2. Sketches of landslide length (L) and width (W). Landslide boundaries are real examples selected from the dataset. “L/W” is the aspect ratio/length-width ratio.
Calculating the landslide volume is challenging, and most of the existing methods to calculate the landslide volume use empirical “Area-Volume” relationships (Guzzetti et al., 2009; Larsen et al., 2010; Parker et al., 2011; Xu et al., 2016a). Therefore, in this study, we do not include the landslide volume while talking about landslide geometry.
The reach angle is the arctan value of the height-length ratio (H/L), and the aspect ratio is the length-width ratio (L/W). We use the largest landslide (Langtang landslide) as an example to illustrate the definitions for each geometrical parameter. For the Langtang landslide, its runout is ∼3,652 m, and the height is 1,832 m; the H/L ratio, the reach angle, and L/W ratio are ∼0.5, 27° and 4.3, respectively (Figure 3).
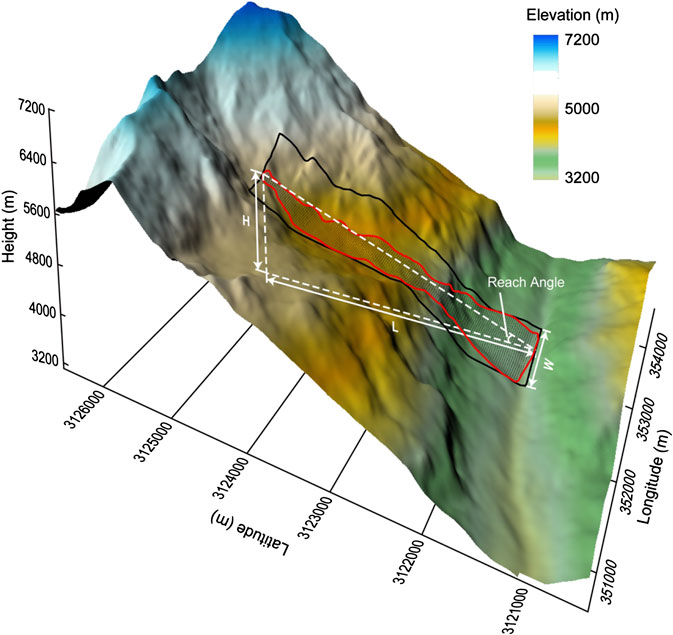
FIGURE 3. Geometrical parameters illustrated on the Langtang landslide.
Landslides Triggered by the 2015 Gorkha Earthquake
Combining with field investigations (Tian et al., 2020), Xu et al. (2018) prepared an inventory containing ∼47,200 landslides in an area of 35,664 km2 based on pre- and post-seismic remote sensing images from the Google Earth and the Chinese Gaofen and Ziyuan satellites. The DEM in our research has 10 m-resolution pixels, and aids in identifying 22,914 landslides that are each >500 m2 in area and have L and W >20 m; each landslide has at least one pixel in its narrowest profile. The Langtang landslide covers an area of ∼1,610,957 m2, while the average landslide area is ∼4,435 m2. Of the >500 m2 in area landslides, 3,850 landslides (accounting for 16.8% of the total number of landslides) are of 500–1,000 m2, 10,568 (46.1%) are 1,000–3,000 m2, 6,437 (28.1%) are 3,000–10,000 m2, and 2,059 (9%) that are >10,000 m2 (Figure 4A). In the chosen slope failures, 20,238 landslides (accounting for 88.3% of the total) occur on the northern side of the PT2 line (Figure 1A) with high altitude and steep terrain.
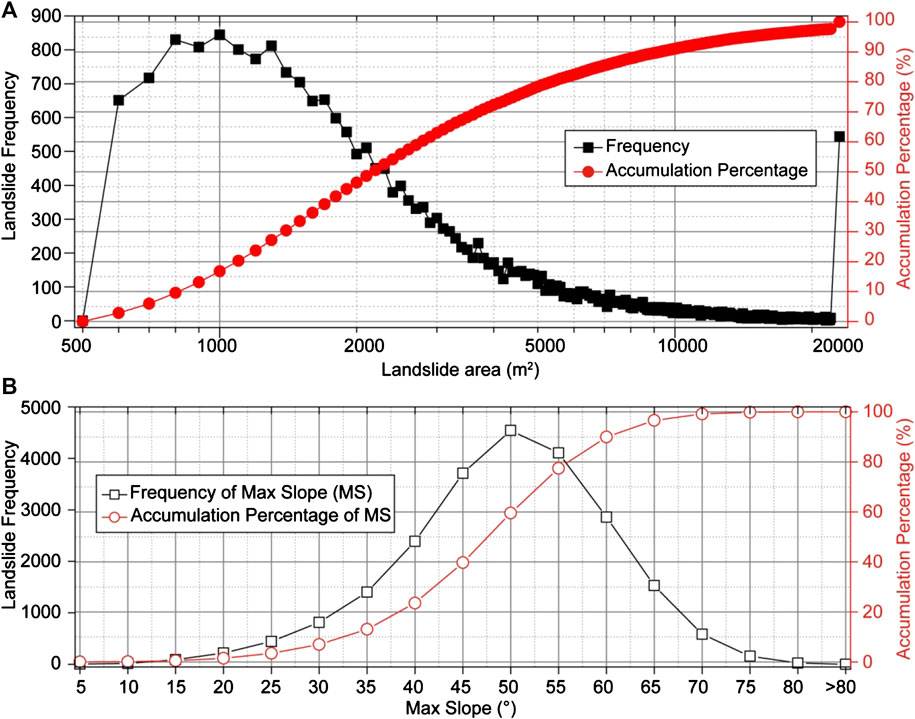
FIGURE 4. Landslide area (A) and maximum slope (B) vs. number and accumulation percentage.
The maximum slope within each landslide was calculated by obtaining the slope raster derived from the 10 m-resolution DEM to examine the relationships between topography, and landslide size and planar shape. The smallest value of the maximum slopes is ∼3°, the steepest slope is ∼79°, and the mean value is ∼47°. The maximum slopes of ∼54% of the chosen landslides concentrate in the range of 45–55° (Figure 4B).
The shape of a landslide gives insights into its initial geo-environment and movement process (Niculita, 2016; Taylor et al., 2018). To explore the failure mechanism of landslides in different shapes, other than combined with the landslide 2-D shape, we considered the statistical meaning of each classification by balancing the landslide frequency distribution in each aspect ratio range and classified the landslides into three geomorphometric categories: LS1 (L/W ≤ 2), LS2 (2 < L/W ≤ 4), and LS3 (L/W > 4) (Figure 6A). Two datasets that include 22,914 landslides that are >500 m2 in area with lengths and widths >20 m (named as Dataset 1) and 2,059 large-scale landslides that are >10,000 m2 from Dataset 1 (named as Dataset 2) (Figure 1A) were considered in this study. The landslide source area is where the rupture occurred as well as the majority sliding material from, thus knowing its features is vital for identifying potential landslides and susceptibility mapping (Keefer, 1984; Dai and Lee, 2002; Lee et al., 2008). The source area of a landslide is the grid cells with elevation larger than the median elevation value within each landslide (red areas in Figure 2) (Jibson et al., 2000; Wang and Rathje, 2013; Shao et al., 2019). Thus, the source area of each landslide was separated, and its center point (yellow points in Figure 2), which links with the control factors. For each geomorphometric type, the number percentage, which equals to the ratio of the landslide numbers in each sub-classification of the setting factors to the total landslide number of this type, is the index being used to explore the distribution characteristics and size effect of landslides with different geomorphometric features.
Control Factors of Landslides
We consider the setting factors, involving terrain (elevation, slope angle, curvature, slope positions, and slope aspect), lithology, streams, roads, and seismology (faults, peak ground acceleration, and small earthquakes before the mainshock) as well as rainfalls in our study. The elevation, slope angle, slope aspect, and curvature derive from the 10 m-resolution DEM mentioned above. The slope position was resampled to 10 m from 90 m-resolution Topographic Position Index (TPI) data downloaded from Geospatial Data Cloud site, Computer Network Information Center, Chinese Academy of Sciences (http://www.gscloud.cn). According to Weiss (2001) and Jenness et al. (2013), hill slope position is divided into six categories based on DEM and slope angles: ridges (TPI > 1 SD), upper slopes (0.5 SD < TPI ≤ 1 SD), middle slopes (−0.5 SD < TPI < 0.5 SD, Slope > 5°), flat slopes (−0.5 SD < TPI < 0.5 SD, Slope ≤ 5°), lower slopes (1 SD < TPI ≤ −0.5 SD) and valleys (TPI < −1.0 SD). TPI refers to the elevation difference between a cell and the average value of its neighborhood around the cell, and the SD is the standard deviation of elevation. The geology bedrock and faults of the region in Nepal were digitalized from geological maps of Yin and Harrison (2000), Dhital (2015), Kargel et al. (2016), and Tiwari et al. (2017), and combined with the digital geology mapping of the rest of the region in China from a geological map on a scale of 1:2,500,000 from the National Geological Data Museum of China (2013). Rock types were classified into 16 categories, as shown in Figure 5.
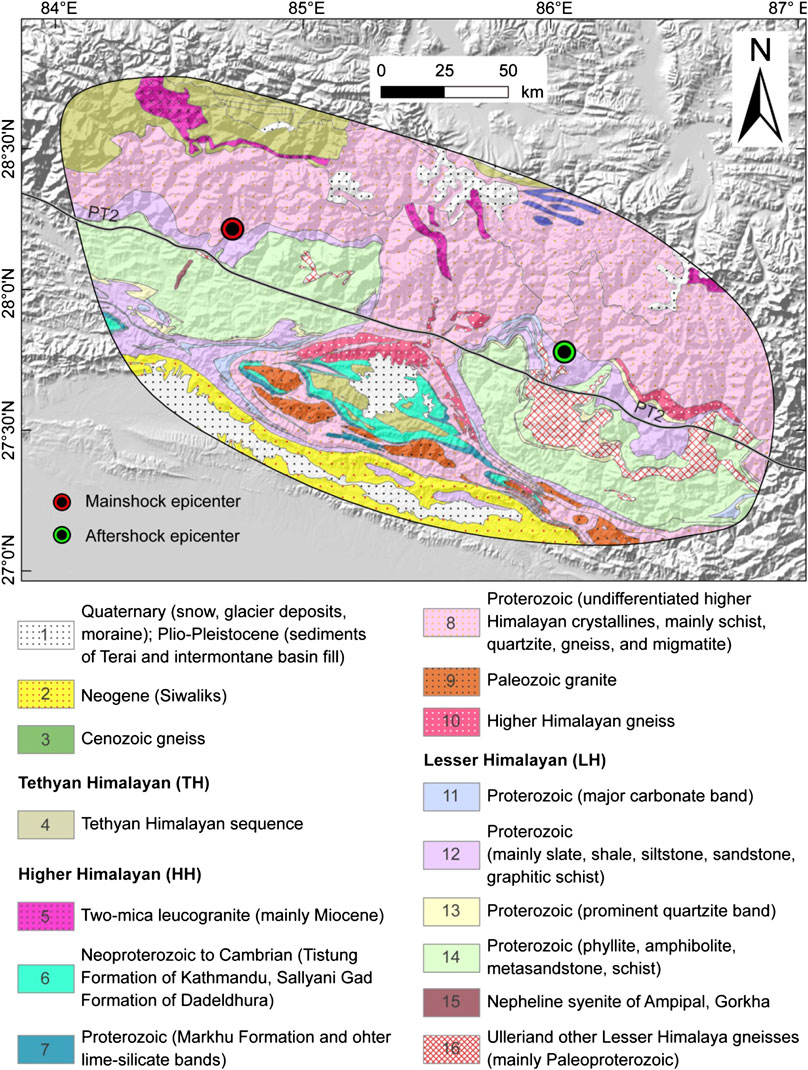
FIGURE 5. Geology of the study area. The part in Nepal is from Dhital (2015), Kargel et al. (2016), and Tiwari et al. (2017); the area in China is from National Geological Data Museum of China (2013).
Road data was downloaded from the DIVA-GIS (http://diva-gis.org/download). The river channels were mapped using the 30 m-resolution DEM and hydrology module of the ArcGIS with a grid threshold of flow accumulation >50,000 cells. The 10 m-resolution buffer raster layers were built along the roads and streams in the study area. We built buffers for the streams and roads using the interval of 200 m within the first 1 km-buffer and an interval of 1 km outside to examine the effect of the drainages and roads on different types of landslides.
Peak ground acceleration (PGA), as a seismic factor, was downloaded from United States Geological Survey (USGS), according to the USGS ShakeMap and local sparse macroseismic reports or measurements (“did you feel it” shake reports) because of few available ground motion stations that were available in Nepal when the earthquake shock the region (USGS, 2015; Kargel et al., 2016).
All the vector layers, including lithology, PGA, and the buffer layers around the faults, roads, and streams, were rasterized into corresponding 10 m-resolution raster layers with reclassified factor information. Then the raster layers were applied to examine the landslide distribution as well as other raster layers of elevation, slope angle, slope aspect, curvature, and slope position.
Rainfall is another triggering factor of landslides. Global Precipitation Measurement data (NASA Earth Observatory, 2019), with a temporal resolution of 1 day and spatial resolution 0.1°, were used to check the relationships among the landslide distribution and antecedent accumulative precipitations (the total rainfalls received before the April 25 Gorkha earthquake at 06:11 UTC and its May 12 aftershock at 07:05 UTC) in varied periods. We considered and mapped the antecedent accumulative precipitations (mm) in the following different periods: for the mainshock, they are 1 day (04/24/2015), 3 days (04/22/2015–04/24/2015), 1 week (04/18/2015–04/24/2015), and 2 weeks (04/11/2015–04/24/2015); for the aftershock, they are 1 day (05/11/2015), 3 days (05/09/2015–05/11/2015), 1 week (05/05/2015–05/11/2015), and 2 weeks (04/28/2015–05/11/2015).
We analyze the effects posed by the regional seismicity before and after the two main 2015 earthquakes from January 2012 through June 2015. The seismicity data for our study area was downloaded from USGS (2019) and was used to explore the potential relationships between the regional seismicity distribution and location of coseismic landslides.
Results and Analyses
Geometrical Parameters
The H, L, and W are 1–1,947 m with an average of 103 m, 20–3,652 m with an average of 132 m and 20–856 m with an average of 43 m, respectively. The aspect ratios range from 0.3 to 15.4, with an average of 3.2, mainly 1.6–3.6 (Figure 6A). H/L are 0.03–2.7 with an average of 0.7, and the reach angles range from 2 to 69° with an average of 34° (∼55% of the landslides are in the range of 35–45°; Figure 6B).
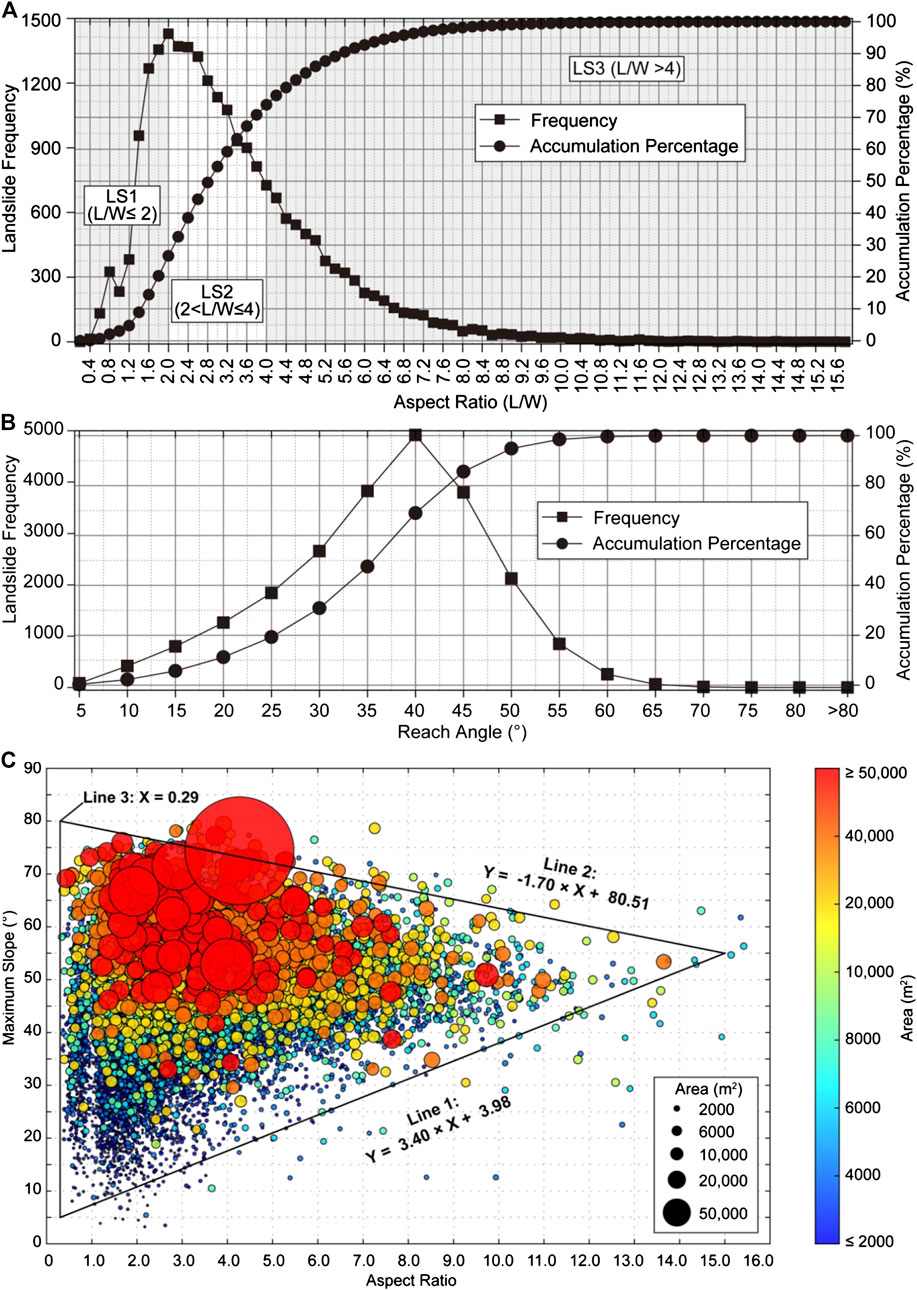
FIGURE 6. Relationships for aspect ratio (A) and reach angle (B) vs. landslide number; and (C) for the landslide aspect ratio, maximum slope, and area.
A plot using circles of different sizes and colors depicting the landslide size examines the correlations of landslide aspect ratio with terrain (maximum slope) and landslide size (Figure 6C). This plot shows that although there is no explicit relationship, most of the landslides are distributed in the enclosed triangle area—above Line 1 (y = 3.40x + 3.98), below Line 2 (y = -1.70x + 80.51), and on the right side of Line 3 (x = 0.29). The smaller landslides have larger ranges for the maximum slope and aspect ratio; however, the larger landslides tend to concentrate in the upper-left corner of the triangle, which means they are likely to develop on the steeper slopes and their main aspect ratios range from 1.0 to 7.0. Specifically, the maximum slopes and aspect ratios for the landslides with an area >8,000 m2 are generally 40–70° and 1.0–8.5, respectively. The lower limit for the maximum slope range gradually decreases to ∼10° for landslides <8,000 m2. Approximately 700 large landslides have aspect ratios <1.0.
The fitting relationship of H and L for the 22,914 landslides triggered by the 2015 Gorkha earthquake is:
After excluding the largest Langtang landslide, the relationship becomes:
For the landslides with areas >10,000 m2 (excluding the Langtang landslide), the H and L have a relationship of
The corresponding average values of the reach angles for curve I, I′, and II in Figure 11 are 41°, 42°, and 37°, respectively.
Planar Geometry
In Dataset 1, 27% are LS1-type, 47% are LS2-type, and 26% are LS3-type landslides (Table 1; Figure 6A), which we call LS1-1, LS2-1, and LS3-1 (where “-1” denotes Dataset 1) in the following analyses. For landslides >10,000 m2 in Dataset 2, these three classes have 16, 47, and 37% for each landslide type. These are called LS1-2, LS2-2, and LS3-2 (where “-2” denotes Dataset 2).
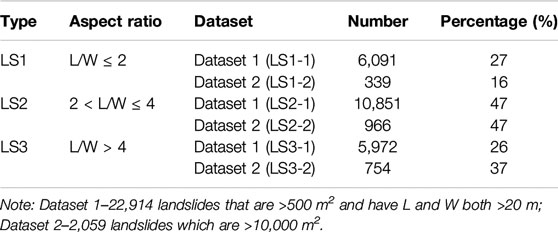
TABLE 1. Classifications of the plane morphology of landslides.
For Dataset 1, ∼93% of the LS3-type landslides, 89% of the LS2-type landslides, and 86% of the LS1-type landslides lie in the steep areas north of PT2; for Dataset 2, the percentages of the landslides in the northern part of PT2 are 97, 96, and 97%, respectively. The dominant occurrence of all landslide types distributing in the north of PT2 suggests that the long and large landslides are more prone to developing in the steep higher area.
Spatial Distribution of Landslides and Control Factors
Elevation
The elevation range with the largest area is the 500–1,000 m asl, followed by 1,000–1,500 and 1,500–2,000 m asl (grey columns in Figure 7A). The landslide number percentages for all the landslide types are much larger in the elevation ranges of 1,000–3,500 m asl (Figure 7A). For the landslides in Dataset 1, LS1-1 and LS2-1 peak in 1,500–2,000 m asl, with percentages ∼26 and ∼24%, respectively, followed by 1,000–1,500 m asl. Landslides of type LS3-1 mainly concentrate on elevations of 1,500–3,500 m asl. For Dataset 2, the peak percentage (∼22%) of LS1-2 is in 1,500–2,500 m asl; for LS2-2 and LS3-2, they (22 and 25%, respectively) are in 2,500–3,000 m asl. Since the percentages on the left-hand side of the peak elevation ranges are much greater than the right-hand side for the LS1-type and LS2-type landslides, we deduced that these 2 kinds of landslides are likely to develop on the lower slopes (such as the free surfaces of the river banks). In comparison, the LS3-type landslides are more common at the higher elevation slopes reflecting by larger percentages on the right-hand side of the peak ranges, and it implies that the narrow landslides tend to form at higher altitudes. Besides, the elevation ranges of the peak percentages for Dataset 2 are much higher than those for Dataset 1. This difference in ranges is possibly because the larger-scale landslides are prone to slopes with much high elevation, which could provide larger gravitational potential energy and long-runout space, as stated by Roback et al. (2018).
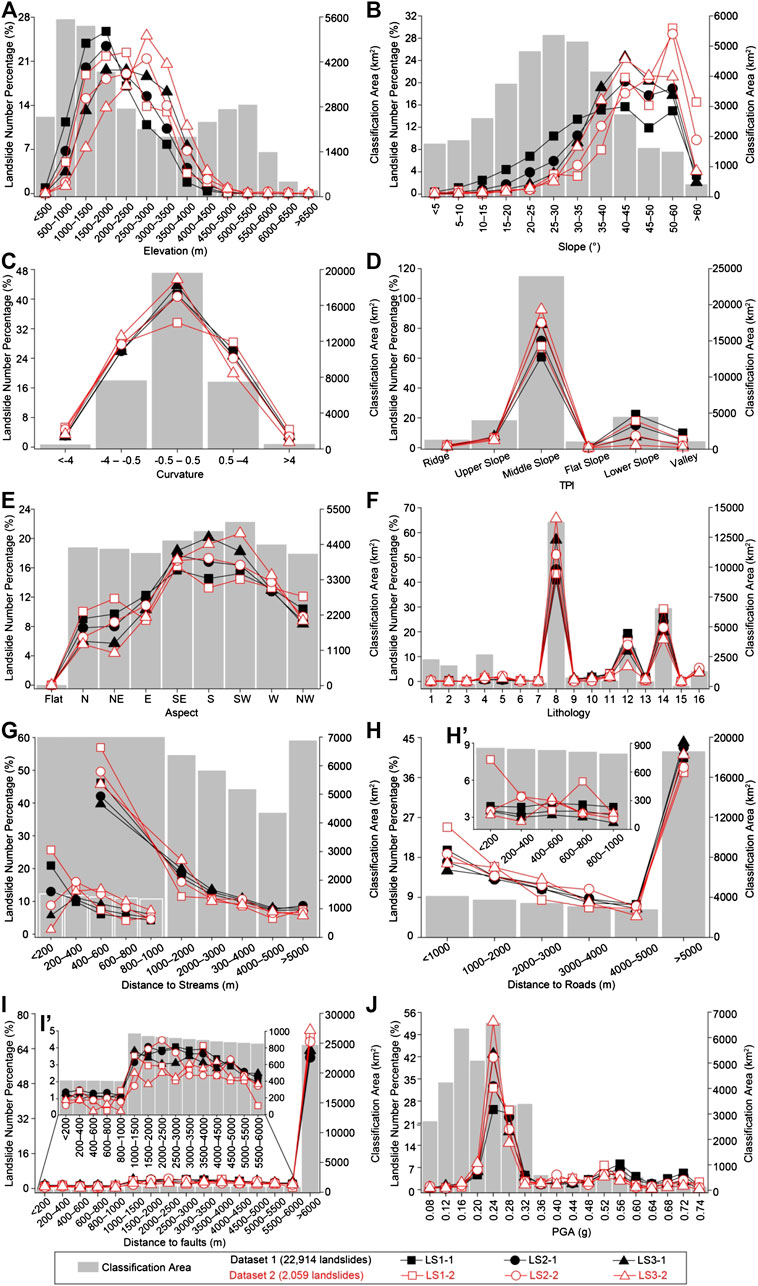
FIGURE 7. Analyses of the three geomorphometric types of landslides vs. control factors: (A) elevation; (B) slope; (C) curvature; (D) slope position/TPI; (E) aspect; (F) lithology; (G) distance from streams; (H) distance from roads and (H’) shows the landslide distribution within 1 km from the roads; (I) distance from faults and (I’) shows the enlarge statistical plot of the distance from faults; and (J) PGA. Figure 5 shows the distribution of bedrock and provides descriptions. LS1-1 (L/W ≤ 2), LS2-1 (2 < L/W ≤ 4), and LS3-1 (L/W > 4) are geometry-based types of landslides for Dataset 1 which includes 22,914 landslides; LS1-2 (L/W ≤ 2), LS2-2 (2 < L/W ≤ 4), and LS3-2 (L/W > 4) are for Dataset 2 which includes 2,059 landslides.
Hill Slope Angle
The regions with hill slope angles ranging from 20 to 35° have relatively larger classification areas. The steeper hill slopes are more prone to sliding though their classification areas are relatively small (Figure 7B). All of the percentage curves have larger values for slopes of 40–60°. The percentage curve of type LS3-1 firstly increases, then peaks at 40–45° with a percentage of 25% and falls in the slope class of >60°, while the curves for the types LS1-1 and LS2-1 are relatively smoother, especially for the LS1-1, and they both have two peaks in the ranges of 40–45° and 50–60°. The percentage curves of landslides in Dataset 2 have similar trends as those in Dataset 1. However, few landslides in Dataset 2 are present in the area with slope angles <30°. Approximately 30% of the landslides of types LS1-2 and LS2-2 have slope angles of 50–60°, and the maximum percentage for LS3-2 has slope angles of 40–45°. Generally, the slopes with an angle >35° are much more prone to developing longitudinal and elongated landslides, and the large landslides are more common to the steeper slopes than the smaller landslides. This relationship implies that the steep slopes are much easier to slide during shaking, and the stripped debris is more likely to run a long way downward rather than spreading transversely.
Curvature
The curvature range of the study area is −431 to 238. We applied the breakpoints of −4, −0.5, 0.5, and 4 to identify the slope shapes—concave hill slopes (−4 to −0.5), straight hill slopes (−0.5 to 0.5), and convex hill slopes (0.5–4). The regions with curvature ranging from −0.5 to 0.5, hosting the largest classification area are much vulnerable to slide for all the landslide classes, followed by the concave and convex hill slopes (Figure 7C). The percentage curve of the LS1-2 type of landslides has similar percentages in the ranges of −4 to −0.5, −0.5 to 0.5, and 0.5–4, which suggests that the possibility for slope failure related to the large-scale landslides with L/W <2 are similar for the straight, concave and convex hill slopes. According to the slope aspect classifications in Figure 7E, few areas are horizontal straight and therefore debris does not stay long on inclined straight slopes.
Slope Position
The percentage curves in Figure 7D show that the landslides, no matter what planar shape or size, concentrate on the widespread middle slopes. Moreover, in this classification, the percentages of the elongated landslides (LS3), which are ∼83% for Dataset 1 and ∼93% for Dataset 2, respectively, are particularly larger than the other two types (LS1 and LS2). Besides, few landslides distributed on the flat slopes and the LS1-type landslides are relatively widespread on the lower slopes as well.
Slope Aspect
Figure 7E shows that the SE-, S-, and SW-facing hill slopes are landslide-prone for all types of landslides. The percentages of the LS3-type landslides are notably higher in these aspects, which means that they are much sensitive to the S-facing hill slopes than LS1 and LS2. The southern aspect is consistent with the thrust direction of the hanging wall of MHT, and the rock mass in the thrusting front is relatively fractured. Also, the sunlight and southwest monsoon likely make the south-facing slopes easier to weather.
Lithology
Analysis of landslide number percentages of different geomorphometric types and lithology (Figure 7F) shows that the eighth class of the High Himalaya Sequence (Proterozoic: undifferentiated higher Himalayan crystalline rocks, mainly schist, quartzite, gneiss, and migmatite) has the largest classification area and has most of the landslides, followed by the fourteenth (Proterozoic: phyllite, amphibolite, metasandstone, schist) and twelfth (Proterozoic: mainly slate, shale, siltstone, sandstone, graphitic schist) classes of the Lesser Himalaya sequence. In the area covering by the Proterozoic High Himalaya Sequence (class 8), LS3-type landslides are most common, then the LS2-type and the LS1-type landslides, but the trend is opposite in the Less Himalaya sequence area.
Distance From Streams
Of all the landslide types, ≥40% of the landslides are within the 1 km-swath area along the streams (Figure 7G). The percentage curves show that the landslide numbers generally decrease with the increasing distance, which indicates that the streams pose much influence on the nearby slopes. However, within the 1 km-swath along the streams, different shapes of landslides show different spatial distribution trends. LS1-type landslides show an evident decrease in numbers as the distance increases from the streams and the percentage curves peak in the area which is <200 m to the streams with the largest percentage of 21% for LS1-1 and 27% for LS1-2; LS3-type landslides are less in the area within 200 m of the streams and more in the 200–400 m-buffer and the peak percentages for LS3-1 and LS3-2 are 11 and 13%, respectively. The curve for LS2-1 decreases directly from 13 to 5%; and LS2-2, it first increases, and peaks with a percentage of 16% then decreases. This pattern suggests that the elongated landslides (LS3) occurred much farther from the stream channels that provide them more space to extend. The oblate or transverse landslides (LS1) are much more susceptible to the influence of the streams, and the locations of the longitudinal landslides (LS2) depends on the landslide size—large landslides are prone to developing farther from the streams while the small ones close to the streams.
Distance from Roads
Other than the largest and farthest class that is >5 km away from the roads, there is a negative relationship between landslide number percentages and the distances from roads, which suggests that the road excavation plays a vital role in triggering landslides (Figure 7H). However, the landslide spatial distributions for Dataset 1, within 1 km of the roads, do not correlate with the distances to roads (Figure 7H’). For Dataset 2 which contains large landslides, the percentage curves show complex trends—the LS1-2 type of landslides peak in distance ranges of <200 m (number percentage of ∼8%) and 600–800 m (number percentage of ∼6%) from the roads; LS2-2 and LS3-2 peak in distance ranges of 200–400 and 400–600 m from the roads, respectively. Most roads in the mountainous area are along rivers, and therefore the influence of the streams may mask the effect posed by roads on landsliding.
Distance from Faults
We chose three large-scale exposed faults (STDS, MCT, and MBT), instead of the deep buried MHT, to which these fault root, to study the effect of the faults posed on the spatial distribution of landslides in different shapes. The 200 or 500 m intervals were used to build buffers along these faults. Statistics (Figure 7I,I’) show that there is no relationship between landslide distribution and the distance to the STDS, MCT, and MBT.
Peak Ground Acceleration
The PGA values of the study area range from 0.08 to 0.74 g from the Gorkha earthquake. In general, the larger the PGA is, the stronger the ground shaking (assuming other factors such as substrate conditions and topography are the same). However, the landslide distribution does not have a positive relationship with the PGA in the study area. The largest areas of LS1, LS2, and LS3 are all in the class of 0.24 g, followed by the 0.28 g class (Figure 7J). The reason may be the uncertainty resulted from the estimation of ground shaking by GMPEs (Ground Motion Prediction Equations), lacking enough real-time measurements of seismic stations (Kargel et al., 2016). On the other hand, this may suggest that the PGA is a triggering factor rather than the predominant factor in controlling the distribution of the earthquake-triggered landslides.
Antecedent Accumulative Rainfalls
Figure 8 shows the contours of the antecedent accumulative precipitations for 1 day, 3 days, 1 week, and 2 weeks before the April 25 Gorkha earthquake and its May 12 aftershock. The landslide density is considerably greater in the northern part of the PT2 line, while the rainfall was less on the north side than the south side. The weather was relatively dry before the mainshock—the 7-day-accumulative precipitation in the area had the densest landslide clusters, was <10 mm, and the 14-day-accumulative rainfall was <40 mm (Figures 8A–D). Besides, the rainfall is almost even in the northern part where developed dense landslides. Generally, the distribution of the precipitation before the mainshock does not correlate with the location of the dense landslide clusters. Though the study area received more rainfall during the mainshock and aftershock, and the largest total rainfall was ∼170 mm, the places where most of the dense landslide clusters developed received a total rainfall <70 mm (Figures 8E–H). Therefore, the antecedent accumulative precipitation might influence the landslide frequency and location, but it is not the primary control factor for the coseismic landslides related to the 2015 Gorkha earthquakes.
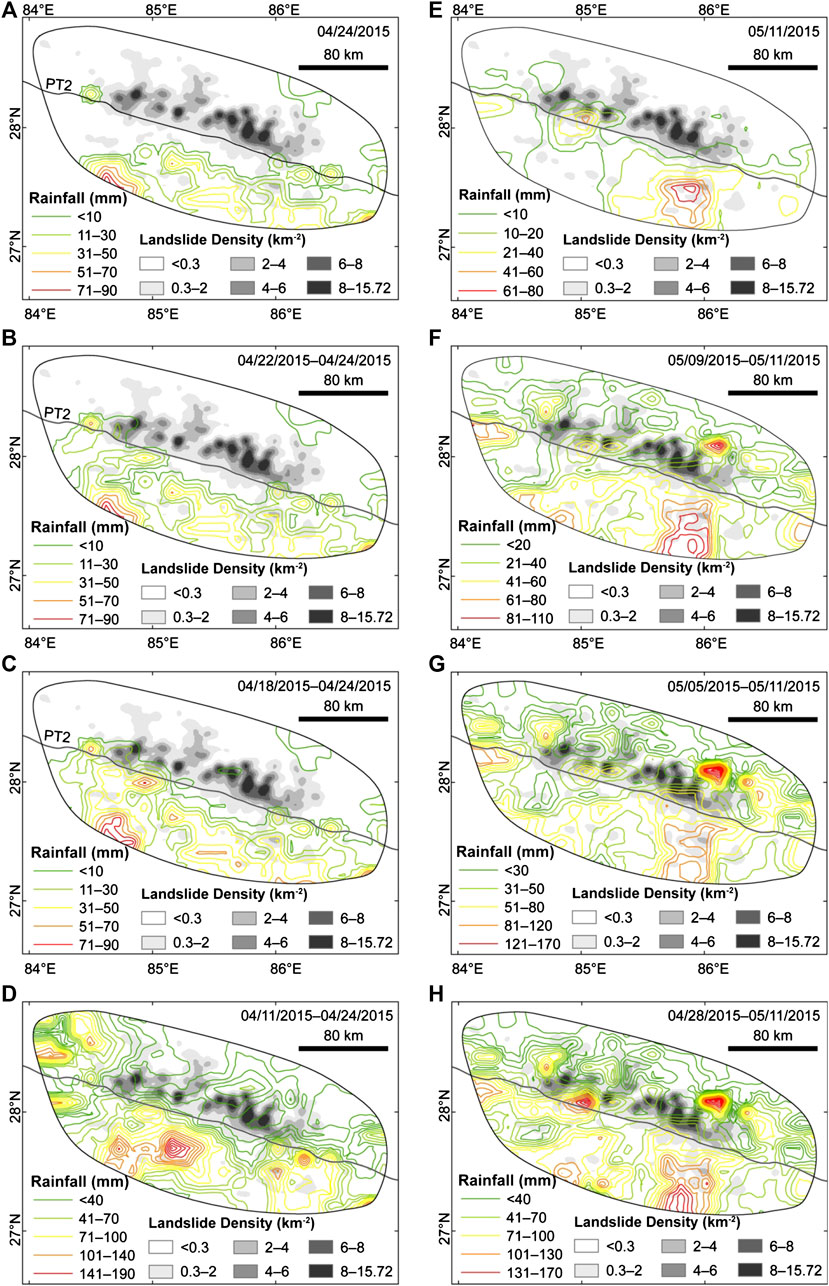
FIGURE 8. Landslide density vs. antecedent accumulative precipitations (mm) of 1 day, 3 days, 1 week, and 2 weeks before the April 25 mainshock (A–D) and 1 day, 3 days, 1 week, and 2 weeks before the May 12 aftershock (E–H). PT2: physiographic transition.
The May 12 aftershock occurred 18 days later than the April 25 mainshock. In comparison with the mainshock, the antecedent accumulative precipitation before the aftershock is greater in different corresponding time spans in the north of PT2 (Figure 8). Differentiating the landslides triggered by the mainshock or the aftershock is necessary to examine the influence posed by the rainfalls on landslides triggered by the strong aftershock.
Small Earthquakes Before and After the Mainshock
Totally 267 earthquakes recorded in the area are shown in Figure 9. There were 5 of them (Mw ≤ 5.0) occurred before the main Mw 7.8 event, 80 (including the mainshock) occurred on April 25, and 182 aftershocks occurred after April 25, 2015 Gorkha earthquake, respectively. The majority of the aftershocks were distributed between the locations of the mainshock and the Mw 7.3 strong aftershock, so are the majority of the coseismic landslides. Despite the majority of the aftershocks are located closer to the Mw 7.3 aftershock, they are almost evenly distributed on both sides of the PT2. At the same time, the landslides are mainly located on the northern side of the PT2 and along river channels (Figure 9). Even though there is a higher number of coseismic landslides toward the SE, which is coinciding with the location of the aftershocks occurred before the Mw 7.3 strong aftershock, the same is not recognized in the NW, or with the aftershocks after the Mw 7.3. For these reasons, we found no clear correlation between the aftershocks and landslides distributions. Therefore, we deduce that shaking resulted from the earthquakes occurred before the mainshock and the aftershocks have no apparent dominant effects on the distribution of all three geomorphometric types of landslides.
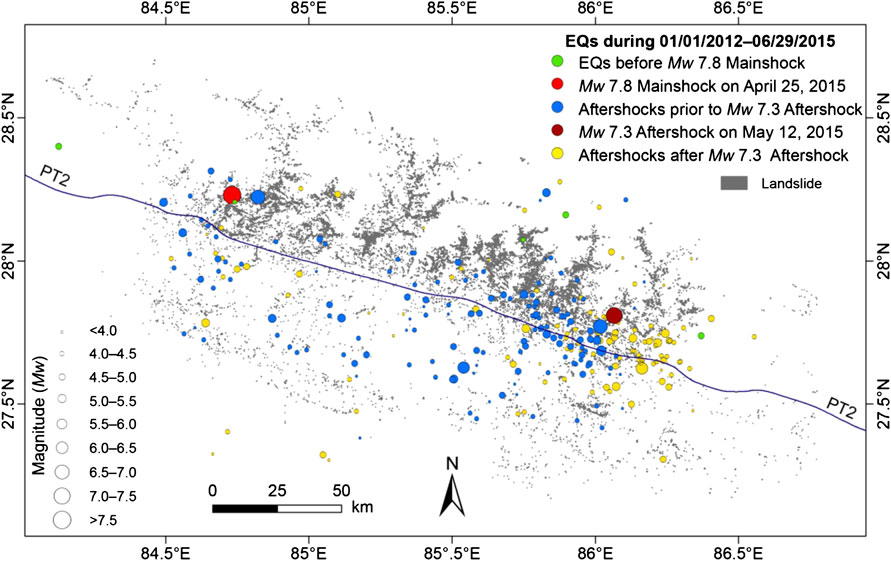
FIGURE 9. Earthquake-triggered landslides and small magnitude earthquakes that occurred before the April 25 Mw 7.8 mainshock as well as the aftershocks in the seismic area of the 2015 Gorkha earthquakes. EQ is short for earthquakes. Earthquake data are from USGS (2019). Landslide data are from Xu et al. (2018).
Discussions
Landslide Size and the Distribution of Different Shapes of Landslides
The above statistical analyses of landslides with different scales and planar geomorphometric features show that, in general, the large-scale landslides with an area >10,000 m2 in Dataset 2 have similar failure-prone conditions concerning the predisposing factors with the landslides in Dataset 1. The vulnerable ranges are common in an elevation ranges of 1,000–3,500 m asl, slopes of 40–60°, curvature of −0.5 to 0.5, middle slopes, south-facing slopes, PGA of 0.24 g, and areas covering by the lithology of High Himalaya Sequence and closing to streams and roads (Figure 7). Even so, for the landslides with L/W ≤ 2 (LS1 type), the larger-scale landslides have a slightly high elevation (1,500–3,000 m asl, Figure 7A) and steeper slope (50–60°, Figure 7B) ranges and they are less sensitive to slope curvature (Figure 7C). While for LS2 and LS3 types, the large landslides tend to develop in a larger space, so they are more common on the higher elevation (2,500–3,000 m asl, Figure 7A) and relatively farther (200–400 m, Figure 7G) from the streams.
Comparing With Other Studies
Of the 22,914 landslides, 1,856 landslides were mapped in an area of 465 km2 in the Trishuli Valley of central Nepal, which is the scope of the study by Tsou et al. (2018). In our study, the L for these landslides range from 20 to 1,119 m with an average L of 165 m, and the W/L values are in 0.07–2.7 (L/W in 0.4–15.4) (Figure 10). Despite the similar W/L values, L for the 912 landslides mapped by Tsou et al. (2018) were 7–1,145 m with an average L of 174 m in this region. Also, according to Tsou et al. (2018), landslides with W/L < 0.6 account for 90%, close to 1,614 landslides in our work constituting up 87% of our sample; whereas those of W/L smaller than 0.2 account for 60% of the total according to Tsou et al. (2018), much larger than 398 landslides accounting for 21% of the total as shown by our study. These differences probably result from the landslide sampling rule of our research, i.e., we only considered the landslide with areas >500 m2 and L and W both >20 m. Another possible reason for the differences is due to the different methods for computing landslide L and W. Tsou et al. (2018) approximated W using the ratio of the landslide area to L. When L is defined, W may be underestimated, resulting in a smaller W/L. While in our method, L and W of the minimum boundary rectangle of the landslide along the slide direction are the effective L and W, which may be closer to real values.
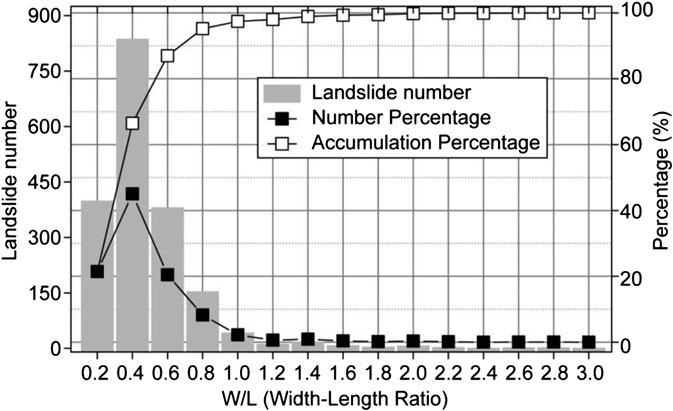
FIGURE 10. Percentage curves for landslide width-length ratio of this research in the study area of Tsou et al. (2018).
An earthquake of larger magnitude generally produces stronger ground shaking, and the resultant landslides usually have longer runouts and larger aspect ratios (Tian et al., 2017). Thus, the landslides triggered by the 1994 Mw 6.7 Northridge, USA, and the 2013 Mw 5.9 Minxian, China earthquakes, both moderate in magnitude, have relatively smaller average aspect ratios of 2.6 and 2.11, respectively, (Table 2). However, the mean aspect ratio (3.2) for the 2015 Mw 7.8 Gorkha earthquake, even the value (3.7) for the landslides >10,000 m2, is smaller than ratios of the 2010 Mw 7.0 Haiti (3.76) (Xu et al., 2014) and the 2010 Mw 6.9 Yushu (4.15) (Xu and Xu, 2014) earthquakes. Firstly, the larger aspect ratio (L/W) for the Haiti and Yushu cases might as well resulted from underestimating W by defining it as the ratio of landslide area to L (Xu and Xu, 2014; Xu et al., 2014). Also, the topography is a crucial factor in determining the landslide geomorphometry and runout in addition to the triggering factor of the ground shaking. The V-shape steep topography in Nepal likely blocks landslide masses from running for a long distance, and the sliding debris accumulates in the valley, which would lead to a larger W. Thus, although these landslides have larger lengths, their aspect ratios are relatively small (mainly in 1.6–3.6). However, just as the Yushu earthquake, the earthquake-affected region is an area of gentle slopes (most <30°) on a plateau with sparse vegetation which provides a favorable condition (the longer slope surfaces with few obstacles) for unstable slope masses to run for long distances (Xu et al., 2013). Therefore, although they have a small size, L, and W, the landslides ran a long distance and have large aspect ratios as well as longitudinal shapes (Table 2). Another possible reason might be that in our study, the landslide sampling size (account for 49% of the total) is smaller, and we did not examine the landslides with an area of <500 m2 and L and W > 20 m.
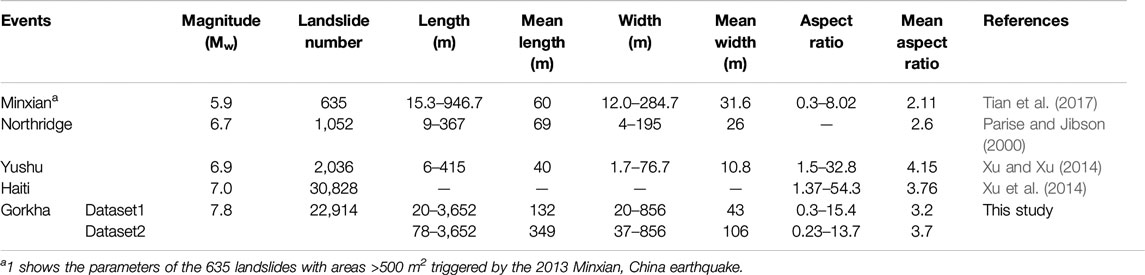
TABLE 2. Landslide’s lengths, widths and aspect ratios of five earthquake cases.
The reach angle of landslides triggered by the 2015 Gorkha earthquake is ∼40° (Figure 11), which is steeper than those determined from other studies, which include ∼32° for the landslides >500 m2 induced by the 2013 minxian, Gansu, China earthquake (Tian et al., 2017), 31° for landslides triggered by the 2010 Haiti earthquake (Xu et al., 2014), 28° for the rainfall-induced landslides in Lantau Island, Hong Kong (Dai and Lee, 2002), and 15° for the long-runout rock avalanches triggered by the 2008 Wenchuan, Sichuan, China earthquake (Qi et al., 2011) (Table 3). The reason for this difference is probably due to the V-shape valleys, high mountains, and gorges in this study area that blocked the landslide masses from advancing long distances.
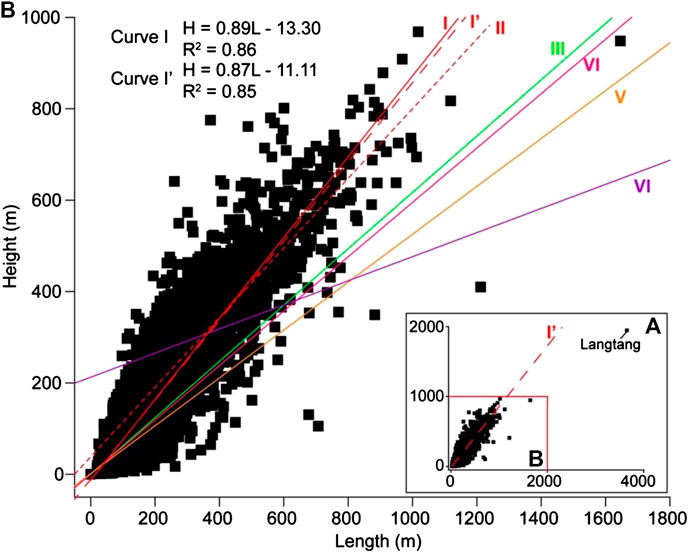
FIGURE 11. Fitting relationships of landslide length and height. (A) Fitting plot with the 22,914 landslides. (B) Fitting plots for the 2015 Gorkha earthquake (curve I for landslides (22,913) in Dataset 1 without the Langtang avalanche, curve I’ for all landslides (22,914) in Dataset 1 and curve II for landslides (2,059) in Dataset 2) and other existing research (curves III–VI are for landslides in areas related to Minxian, Haiti, Hongkong and Wenchuan cases). Table 3 provides further details.
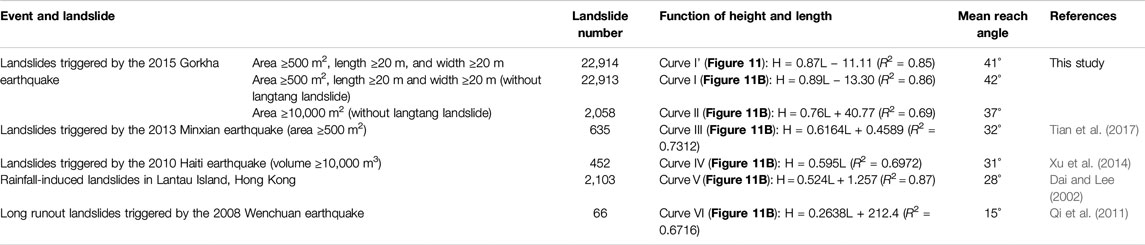
TABLE 3. Fitting relationships of landslide height and length for five study cases.
Conclusions
We described the geomorphometry of the 22,914 landslides triggered by the 2015 Gorkha earthquake sequence, which have areas ≥500 m2 and L and W ≥20 m, in an extensive area affected by the earthquakes. Results show that the ranges of L, W, and H are 20–3,652, 20–856, and 1–1,947 m, respectively. The reach angle (arctan H/L) ranges from 2 to 69°, with an average of 34°, and the aspect ratio ranges from 0.3 to 15.4, with an average of 3.2. The height and length have a relationship of H = 0.87L – 11.11 (R2 = 0.85), and the fitting average reach angle is ∼41°. This average reach angle is much larger than existing studies in other regions. The mean aspect ratio is smaller than those for earthquakes that have smaller magnitude (e.g., Yushu and Haiti earthquakes). One probable reason is that the steep gorges could block the landslide masses from moving long distances, thus resulting in smaller L and larger W as well as a smaller aspect ratio.
The landslides are classified into three geomorphometric types based on their 2-D shape and ratio distributions: LS1 (L/W ≤ 2), LS2 (2 < L/W ≤ 4), and LS3 (L/W > 4). Dataset 1 containing the total 22,914 landslides and Dataset 2 (from Dataset 1 but only includes 2,059 landslides with areas >10,000 m2) enable the examination of the spatial distributions of the three types of landslides. Results show that, regardless of the size, all the three geomorphometric types of the landslides have similar susceptible ranges including curvature, slope position, lithology, and PGA—they all can occur on straight hill slopes, middle slopes, areas underlain by High Himalayan Proterozoic rocks (undifferentiated higher Himalayan crystalline rocks, mainly schist, quartzite, gneiss, and migmatite), and PGA of 0.24 g. However, the effects posed by elevation, hill slope angle, slope aspect, and streams are different. The LS3-type landslides are more abundant in areas that are more prone to failure and can provide ample space to extend, which include those with a higher elevation of 1,500–3,000 m asl, hill slopes of 40–45°, and the areas within 200–400 m from the streams. While areas with the highest concentration of LS1-type and LS2-type landslides are at elevations of 1,000–2,000 m asl, slopes of 40–45° and 50–60°, southeast-facing slopes, and within 200 m from the streams. Moreover, the distributions of landslides in Dataset 2 suggest that the large landslides are more likely to occur on much higher and steeper slopes than the small landslides. The roads, three large-scale faults, antecedent precipitations, and the small earthquakes before and after the mainshock do not have dominant impacts on the landslide distribution. In sum, the terrain factors and streams are the major factors controlling the spatial distributions of landslides with various shapes and sizes. Therefore, geometric features of coseismic landslides provide a new view to understand the landslide extent characteristics and mechanism.
One urgent problem is that there is no generally agreed definition for the geomorphometric parameters for earthquake-triggered landslides. Aspect ratios differ because the methods to approximate the L and W for landslides vary. There is a need for a standard method and more case studies to contrast the geomorphometric shapes of earthquake-triggered landslides.
Data Availability Statement
The raw data supporting the conclusions of this article will be made available by the authors, without undue reservation.
Author Contributions
CX proposed and participated in designing the study; YT designed the study, analyzed the data and wrote the manuscript; LO participated in designing the study and improved the paper; LS worked on the rainfall data processing; QZ participated in designing the study; PF polished the paper. All authors approved the final version of the manuscript.
Funding
This work was supported by the National Natural Science Foundation of China (grant number 41661144037).
Conflict of Interest
The authors declare that the research was conducted in the absence of any commercial or financial relationships that could be construed as a potential conflict of interest.
The reviewer (JC) declared a past co-authorship with one of the authors (CX) to the handling editor.
References
Avouac, J.-P., Meng, L., Wei, S., Wang, T., and Ampuero, J.-P. (2015). Lower edge of locked main Himalayan thrust unzipped by the 2015 Gorkha earthquake. Nat. Geosci. 8, 708–711. doi:10.1038/ngeo2518
Berthet, T., Ritz, J.-F., Ferry, M., Pelgay, P., Cattin, R., Drukpa, D., et al. (2014). Active tectonics of the eastern Himalaya: new constraints from the first tectonic geomorphology study in southern Bhutan. Geology 42, 427–430. doi:10.1130/G35162.1
Collins, B. D., and Jibson, R. W. (2015). Report No.: 2015-1142. Assessment of existing and potential landslide hazards resulting from the April 25, 2015 Gorkha, Nepal earthquake sequence. Available at: https://www.preventionweb.net/go/47697 (Accessed April 25, 2015)
Corominas, J. (1996). The angle of reach as a mobility index for small and large landslides. Can. Geotech. J. 33, 260–271. doi:10.1139/t96-005
Corominas, J., Copons, R., Vilaplana, J. M., Altimir, J., and Amigó, J. (2003). Integrated landslide susceptibility analysis and hazard assessment in the principality of Andorra. Nat. Hazards 30, 421–435. doi:10.1023/B:NHAZ.0000007094.74878.d3
Dahal, R. K., and Hasegawa, S. (2008). Representative rainfall thresholds for landslides in the Nepal Himalaya. Geomorphology 100, 429–443. doi:10.1016/j.geomorph.2008.01.014
Dai, F. C., and Lee, C. F. (2002). Landslide characteristics and slope instability modeling using GIS, Lantau Island, Hong Kong. Geomorphology 42, 213–228. doi:10.1016/S0169-555X(01)00087-3
Dhital, M. R. (2015). Geology of the Nepal Himalaya–regional perspective of the classic collided Orogen. Cham, Switzerland: Springer.
Elliott, J. R., Jolivet, R., González, P. J., Avouac, J.-P., Hollingsworth, J., Searle, M. P., et al. (2016). Himalayan megathrust geometry and relation to topography revealed by the Gorkha earthquake. Nat. Geosci. 9, 174–180. doi:10.1038/ngeo2623
Gallen, S. F., Clark, M. K., Godt, J. W., Roback, K., and Niemi, N. A. (2017). Application and evaluation of a rapid response earthquake-triggered landslide model to the 25 April 2015 Mw 7.8 Gorkha earthquake, Nepal. Tectonophysics 714–715, 173–187. doi:10.1016/j.tecto.2016.10.031
Guzzetti, F., Ardizzone, F., Cardinali, M., Rossi, M., and Valigi, D. (2009). Landslide volumes and landslide mobilization rates in Umbria, central Italy. Earth Planet Sci. Lett. 279, 222–229. doi:10.1016/j.epsl.2009.01.005
Hayes, G. P., Briggs, R. W., Barnhart, W. D., Yeck, W. L., McNamara, D. E., Wald, D. J., et al. (2015). Rapid characterization of the 2015Mw 7.8 Gorkha, Nepal, earthquake sequence and its seismotectonic context. Seismol Res. Lett. 86, 1557–1567. doi:10.1785/0220150145
Heim, A. (1932). Bergsturz und Menschenleben (landslides and human lives). Vancouver, BC, Canada: BiTech Publishers.
Hodges, K. V., Wobus, C., Ruhl, K., Schildgen, T., and Whipple, K. (2004). Quaternary deformation, river steepening, and heavy precipitation at the front of the higher Himalayan ranges. Earth Planet Sci. Lett. 220, 379–389. doi:10.1016/s0012-821x(04)00063-9
Hsü, K. J. (1975). Catastrophic debris streams (sturzstroms) generated by rockfalls. Geol. Soc. Am. Bull. 86, 129–140. doi:10.1130/0016-7606(1975)86<129:cdssgb>2.0.co;2
Jenness, J., Brost, B., and Beier, P. (2013). Land facet corridor designer: extension for ArcGIS. Available at: http://www.jennessent.com/arcgis/land_facets.htm (Accessed 8 31, 2019).
Jibson, R. W., Harp, E. L., and Michael, J. A. (2000). A method for producing digital probabilistic seismic landslide hazard maps. Eng. Geol. 58, 271–289. doi:10.1016/s0013-7952(00)00039-9
Kargel, J. S., Leonard, G. J., Shugar, D. H., Haritashya, U. K., Bevington, A., Fielding, E. J., et al. (2016). Geomorphic and geologic controls of geohazards induced by Nepal’s 2015 Gorkha earthquake. Science 351, aac8353. doi:10.1126/science.aac8353
Keefer, D. K. (1984). Rock avalanches caused by earthquakes: source characteristics. Science 223, 1288–1290. doi:10.1126/science.223.4642.1288
Larsen, I. J., Montgomery, D. R., and Korup, O. (2010). Landslide erosion controlled by hillslope material. Nat. Geosci. 3, 247–251. doi:10.1038/ngeo776
Lavé, J., and Avouac, J. P. (2000). Active folding of fluvial terraces across the Siwaliks hills, Himalayas of central Nepal. J. Geophys. Res. Solid Earth 105, 5735–5770. doi:10.1029/1999JB900292
Lee, C.-T., Huang, C.-C., Lee, J.-F., Pan, K.-L., Lin, M.-L., and Dong, J.-J. (2008). Statistical approach to earthquake-induced landslide susceptibility. Eng. Geol. 100, 43–58. doi:10.1016/j.enggeo.2008.03.004
Li, Z., Liu, J., Wang, W., Ji, C., Zeng, L., Zhang, P., et al. (2015). Tectonic setting and general features of coseismic rupture of the 25 April, 2015Mw 7.8 Gorkha, Nepal earthquake. Chin. Sci. Bull. 60, 2640–2655. doi:10.1360/N972015-00559 (in Chinese)
Martha, T. R., Roy, P., Mazumdar, R., Govindharaj, K. B., and Kumar, K. V. (2016). Spatial characteristics of landslides triggered by the 2015 Mw 7.8 (Gorkha) and Mw 7.3 (Dolakha) earthquakes in Nepal. Landslides 14, 697–704. doi:10.1007/s10346-016-0763-x
Moss, R. E. S., Thompson, E. M., Scott Kieffer, D., Tiwari, B., Hashash, Y. M. A., Acharya, I., et al. (2015). Geotechnical effects of the 2015 magnitude 7.8 Gorkha, Nepal, earthquake and aftershocks. Seismol Res. Lett. 86, 1514–1523. doi:10.1785/0220150158
NASA Earth Observatory (2019). GPM data downloads. Available at: https://pmm.nasa.gov/data-access/downloads/gpm# (Accessed Aug 31, 2019).
National Geological Data Museum of China (2013). Geology map of China with scale of 1:2,500,000. Available at: http://www.ngac.org.cn/Document/Map.aspx?MapId=EC7E1A7A7CF81954E0430100007F182E (Accessed Aug 31, 2019).
Nicoletti, P. G., and Sorriso-Valvo, M. (1991). Geomorphic controls of the shape and mobility of rock avalanches. Geol. Soc. Am. Bull. 103, 1365–1373. doi:10.1130/0016-7606(1991)103<1365:gcotsa>2.3.co;2
Niculita, M. (2016). Automatic landslide length and width estimation based on the geometric processing of the bounding box and the geomorphometric analysis of DEMs. Nat. Hazards Earth Syst. Sci. 16, 2021–2030. doi:10.5194/nhess-16-2021-2016
Owen, L. A. (2017). Earth surface processes and landscape evolution in the Himalaya: a framework for sustainable development and geohazard mitigation. Geol. Soc. Spec. Publ. 462, SP462.9. doi:10.1144/sp462.9
Parise, M., and Jibson, R. W. (2000). A seismic landslide susceptibility rating of geologic units based on analysis of characteristics of landslides triggered by the 17 January, 1994 Northridge, California earthquake. Eng. Geol. 58, 251–270. doi:10.1016/S0013-7952(00)00038-7
Parker, R. N., Densmore, A. L., Rosser, N. J., de Michele, M., Li, Y., Huang, R., et al. (2011). Mass wasting triggered by the 2008 Wenchuan earthquake is greater than orogenic growth. Nat. Geosci. 4, 449–452. doi:10.1038/ngeo1154
Qi, S., Xu, Q., Zhang, B., Zhou, Y., Lan, H., and Li, L. (2011). Source characteristics of long runout rock avalanches triggered by the 2008 Wenchuan earthquake, China. J. Asian Earth Sci. 40, 896–906. doi:10.1016/j.jseaes.2010.05.010
Regmi, A. D., Dhital, M. R., Zhang, J.-q., Su, L.-j., and Chen, X.-q. (2016). Landslide susceptibility assessment of the region affected by the 25 April 2015 Gorkha earthquake of Nepal. J. Mt. Sci. 13, 1941–1957. doi:10.1007/s11629-015-3688-2
Roback, K., Clark, M. K., West, A. J., Zekkos, D., Li, G., Gallen, S. F., et al. (2018). The size, distribution, and mobility of landslides caused by the 2015 Mw 7.8 Gorkha earthquake, Nepal. Geomorphology 301, 121–138. doi:10.1016/j.geomorph.2017.01.030
Scheidegger, A. E. (1973). On the prediction of the reach and velocity of catastrophic landslides. Rock Mech. 5, 231–236. doi:10.1007/BF01301796
Shao, X., Ma, S., Xu, C., Zhang, P., Wen, B., Tian, Y., et al. (2019). Planet image-based inventorying and machine learning-based susceptibility mapping for the landslides triggered by the 2018 Mw6.6 Tomakomai, Japan earthquake. Remote Sens. 11, 978, doi:10.3390/rs11080978
Taylor, F. E., Malamud, B. D., Witt, A., and Guzzetti, F. (2018). Landslide shape, ellipticity and length-to-width ratios. Earth Surf. Process. Landf. 43, 3164–3189. doi:10.1002/esp.4479
Tian, Y., Owen, L. A., Xu, C., Ma, S., Li, K., Xu, X., et al. (2020). Landslide development within 3 years after the 2015 Mw 7.8 Gorkha earthquake, Nepal. Landslides 17, 1251–1267. doi:10.1007/s10346-020-01366-x
Tian, Y., Xu, C., Chen, J., Zhou, Q., and Shen, L. (2017). Geometrical characteristics of earthquake-induced landslides and correlations with control factors: a case study of the 2013 minxian, Gansu, China, Mw 5.9 event. Landslides 14, 1915–1927. doi:10.1007/s10346-017-0835-6
Tiwari, B., Ajmera, B., and Dhital, S. (2017). Characteristics of moderate- to large-scale landslides triggered by the Mw 7.8 2015 Gorkha earthquake and its aftershocks. Landslides 14, 1297–1318. doi:10.1007/s10346-016-0789-0
Tsou, C.-Y., Chigira, M., Higaki, D., Sato, G., Yagi, H., Sato, H. P., et al. (2018). Topographic and geologic controls on landslides induced by the 2015 Gorkha earthquake and its aftershocks: an example from the Trishuli Valley, central Nepal. Landslides 15, 953–965. doi:10.1007/s10346-017-0913-9
USGS (2015). Mw 7.8–36 km E of Khudi, Nepal. Available at: https://earthquake.usgs.gov/earthquakes/eventpage/us20002926/executive#executive (Accessed Aug 21, 2019).
USGS (2019). Search earthquake catalog. Available at: https://earthquake.usgs.gov/earthquakes/search/ (Accessed Oct 10, 2019).
Wang, Y., and Rathje, E. M. (2013). “Regional predictions of earthquake-induced landslides a study of the Niigata-ken Chuestu earthquake.” in: 10th international conference on urban earthquake engineering, Tokyo, Japan, March 1–2, 2013.
Weiss, A. (2001). “Topographic position and landforms analysis.” in: Poster presentation, ESRI user conference, San Diego, CA, 200, 2001. Available at: http://www.jennessent.com/downloads/tpi-poster-tnc_18x22.pdf.
Whipple, K. X., Shirzaei, M., Hodges, K. V., and Ramon Arrowsmith, J. (2016). Active shortening within the Himalayan orogenic wedge implied by the 2015 Gorkha earthquake. Nat. Geosci. 9, 711–716. doi:10.1038/ngeo2797
Wobus, C. W., Whipple, K. X., and Hodges, K. V. (2006). Neotectonics of the central Nepalese Himalaya: constraints from geomorphology, detrital40Ar/39Ar thermochronology, and thermal modeling. Tectonics 25. doi:10.1029/2005TC001935
Xu, C., Tian, Y., Shen, L., Ma, S., Xu, X.-w., Zhou, B., et al. (2018). Database of landslides triggered by 2015 Gorkha (Nepal) Mw 7.8 earthquake. Seismol. Geol. 40, 1115–1128. (in Chinese)
Xu, C., Tian, Y., Zhou, B., Ran, H., and Lyu, G. (2017). Landslide damage along Araniko highway and Pasang Lhamu highway and regional assessment of landslide hazard related to the Gorkha, Nepal earthquake of 25 April 2015. Geoenviron Disasters 4, 14. doi:10.1186/s40677-017-0078-9
Xu, C., Xu, X., Shen, L., Yao, Q., Tan, X., Kang, W., et al. (2016a). Optimized volume models of earthquake-triggered landslides. Sci. Rep. 6, 29797. doi:10.1038/srep29797
Xu, C., and Xu, X. (2014). Statistical analysis of landslides caused by the Mw 6.9 Yushu, China, earthquake of April 14, 2010. Nat. Hazards 72, 871–893. doi:10.1007/s11069-014-1038-2
Xu, C., Xu, X., Tian, Y., Shen, L., Yao, Q., Huang, X., et al. (2016b). Two comparable earthquakes produced greatly different coseismic landslides: the 2015 Gorkha, Nepal and 2008 Wenchuan, China events. J. Earth Sci. 27, 1008–1015. doi:10.1007/s12583-016-0684-6
Xu, C., Xu, X., and Xu, X. W. (2014). Statistical analysis of landslides caused by the Mw 6.9 Yushu, China, earthquake of April 14, 2010. Nat. Hazards 72, 871–1818. doi:10.1007/s11069-014-1038-2
Xu, C., Xu, X., and Yu, G. (2013). Landslides triggered by slipping-fault-generated earthquake on a plateau: an example of the 14 April 2010, Ms 7.1, Yushu, China earthquake. Landslides 10, 421–431. doi:10.1007/s10346-012-0340-x
Yin, A., and Harrison, T. M. (2000). Geologic evolution of the Himalayan-Tibetan Orogen. Annu. Rev. Earth Planet. Sci. 28, 211–280. doi:10.1146/annurev.earth.28.1.211
Yun, S.-H., Hudnut, K., Owen, S., Webb, F., Simons, M., Sacco, P., et al. (2015). Rapid damage mapping for the 2015Mw 7.8 Gorkha earthquake using synthetic aperture radar data from COSMO-SkyMed and ALOS-2 Satellites. Seismol Res. Lett. 86, 1549–1556. doi:10.1785/0220150152
Keywords: 2015 Gorkha earthquake, landslides, Himalaya, geometry, planar geomorphometric shapes, spatial distribution
Citation: Tian Y, Owen LA, Xu C, Shen L, Zhou Q and Figueiredo PM (2020) Geomorphometry and Statistical Analyses of Landslides Triggered by the 2015 Mw 7.8 Gorkha Earthquake and the Mw 7.3 Aftershock, Nepal. Front. Earth Sci. 8:572449. doi: 10.3389/feart.2020.572449
Received: 14 June 2020; Accepted: 26 August 2020;
Published: 18 September 2020.
Edited by:
Juergen Pilz, Alpen-Adria-Universität Klagenfurt, AustriaReviewed by:
Jian Chen, China University of Geosciences, ChinaSaumitra Mukherjee, Jawaharlal Nehru University, India
Copyright © 2020 Tian, Owen, Xu, Shen, Zhou and Figueiredo. This is an open-access article distributed under the terms of the Creative Commons Attribution License (CC BY). The use, distribution or reproduction in other forums is permitted, provided the original author(s) and the copyright owner(s) are credited and that the original publication in this journal is cited, in accordance with accepted academic practice. No use, distribution or reproduction is permitted which does not comply with these terms.
*Correspondence: Chong Xu, eGMxMTExMTExMUAxMjYuY29t