 Xiaohang Wen1*
 Wenqi Pan1Xiaoguang Sun2Maoshan Li1
 Siqiong Luo3Bangjun Cao1Shaobo Zhang1Chao Wang1Zihan Zhang1Linxi Meng1Yuqing Ruan1Bin Xie1
- 1Plateau Atmosphere and Environment Key Laboratory of Sichuan Province, School of Atmospheric Sciences, Chengdu University of Information Technology, Chengdu, China
- 2Chamdo Meteorological Bureau, Chamdo, Tibet, China
- 3Key Laboratory of Land Surface Process and Climate Change in Cold and Arid Regions, Northwest Institute of Eco-Environment and Resources, Chinese Academy of Sciences, Lanzhou, China
To study the variation trend of potential evapotranspiration (PET) in the Three-River Headwaters (TRH) region of the Qinghai-Tibet Plateau in China, we use 2-m temperature and surface pressure observation data from 14 meteorological weather stations in the TRH region, and the surface PET is calculated by the Penman-Monteith formula. The global land surface data assimilation system from 2000 to 2018 were used to compare and verify the accuracy and applicability of the calculated PET in the THR region. The results show that in the past 20 years, the PET of 14 weather stations in the TRH region has shown an increasing trend, with annual averaged growth rate of 1.4 ± 1.2 mm·a−1, and the spatial distribution of the annual variation rate of PET has obvious difference. PET is higher in the eastern area of TRH region, and lower in the western area. The drought in this area increased from southeast to northwest, which was consistent with the spatial distribution of precipitation. The aridity index K has fluctuated and increased before 2015, but there was a sudden change in 2018, and the aridity index K in the TRH began to decline after 2018, and the climate changed from dry to wet.
Introduction
The Qinghai-Tibetan Plateau (QTP) and the adjacent high mountain regions of the Himalayas play an important role in the global climate dynamic through its impact on the Asian monsoon system, which in turn is impacting the water resources of this extremely vulnerable region (Krause et al., 2010). The QTP is in southwest China, which is known as the “roof of the world.” The unique regional combination of water and heat makes it change from dry and cold in the northwest to warm and wet in the southeast (Li et al., 2010). In the past 50 years, the annual averaged temperature in the QTP has increased significantly higher than that of the whole country, and the phenomenon of ecological degradation and reduction of water resources has become more serious (Ding et al., 2019), which has caused an inestimable impact on local and even the country’s economic and social development. A series of changes have taken place in the ecological environment of the plateau in recent years. The surrounding glacier mountain of the QTP has shrunk by 15% and the permafrost has decreased by 16%; the number of lakes larger than 1 km2 has increased from 1,081 to 1,236, and the lake area has increased from 40,000 km2 to 47,400 km2, and all the runoffs show an increasing pattern (Liu et al., 2019).
As the “Asian Water Tower,” the Three-River Headwaters (TRH), which contains 25% water of the Yangtze River, 49% of the Yellow River, and 15% of the Lancang River, is an important water source for China and east Asia. The exchange of energy and water between the atmosphere and the land surface plays an important role in regional water resources dynamics and climate change (Xu et al., 2008a). The topography of the TRH region is complex, with a wide variety of underlying surfaces, including glaciers, lakes, frozen soil, and vegetation (Kang et al., 2010). Global warming changes the energy and water cycle of the underlying surface through evaporation, precipitation, and changing soil moisture, and the changes of energy and water cycles on different underlying surfaces are very sensitive to the response of global climate change (Liu and Chen, 2000). Wang et al. (2020) combined meteorological and satellite data to explore the average evaporation of 75 lakes on the QTP from 2003 to 2016. The lakes evaporation showed great variation in spatial distribution, and the evaporation was higher in the south of the plateau. Changes in the spatial distribution of precipitation play an important role in determining the response of runoffs to precipitation in the source area (Zhou and Huang, 2012). Gravity Recovery and Climate Experiment data shows that the water storage in the TRH area increased by an average of 0.5 mm per month from 2003 to 2008, indicating that the water storage capacity of the source area has increased significantly, but the overall water utilization rate has shown a downward trend (Xu et al., 2013). At the same time, under future climate scenarios, total precipitation and extreme precipitation values in the TRH will also increase with interannual changes (Team, 2007; Hu et al., 2013a).
Potential evapotranspiration (PET) refers to the maximum evapotranspiration that can be achieved on the land surface under certain meteorological conditions when the water supply is not restricted (Milly and Dunne, 2016; Valipour, 2017). As an important part of hydrological cycle and energy cycle, together with precipitation, it determines the regional dry and wet conditions (Gu et al., 2017), which plays an important role in the global water cycle and climate evolution. The wind may have weakened water vapor exchange between the Asia monsoon region and the Plateau and thus led to less precipitation in the monsoon-impacted southern and eastern Plateau, but the warming enhanced land evaporation. Their overlap resulted in runoff reduction in the southern and eastern Plateau regions (Yang et al., 2014). The simulation results of Coupled Model Intercomparison Project 5 indicate rising temperature to cause the ablation of ice (or snow) cover and increasing leaf area index, with reduced snowfall, together with a series of other changes, resulting in increasing upward and downward long-wave radiation and changes in soil moisture, evaporation, latent heat flux, and water vapor in the air (Li et al., 2014). Chen et al. (2006) has analyzed Penman-Monteith PET estimates for 101 stations on the QTP and surrounding areas from 1961 to 2000, and found that the PET has decreased in all seasons in the whole QTP. The average annual evapotranspiration rate decreased by 13.1 mm·decade−1 or 2.0% of the annual total. In recent years, many researchers focus on the characteristics of climate change in the TRH Region, and found that the near surface temperature from meteorological stations has gradually increased in recent decades. Under the global warming background, affected by greenhouse gases, the warming trend of the TRH Region will continue in the future (Lan et al., 2010; Hu et al., 2013b). The spatial distribution characteristics of temperature in this region is: the temperature gradually increase from west to east and from south to north, and the precipitation in the TRH region Will increase (Hu et al., 2013a).
At present, there are nearly 50 methods or models used to estimate PET in the world, which can be divided into the following four categories (Singh and Xu, 1997): 1) temperature method; 2) mass transfer method; 3) radiation method; 4) comprehensive method. Since the 1990s, many studies have been carried out on the applicability of PET, focusing on more than a dozen commonly used methods for estimating PET. In practical applications, less than ten kind of methods for estimating PET (Shi et al., 2008; Valipour, 2014). Tabari et al. (2013) and Valipour et al. (2017) evaluated the estimation effects of the three types of PET estimation methods including mass transfer method, radiation method and temperature method. They found that the radiation method has the best estimation, followed by the temperature method, and the mass transfer method is inferior, which is consistent with the conclusions of most studies.
In this paper, the Food and Agriculture Organization (FAO) Penman-Monteith method was chosen as the standard method to estimate PET because it was very close to PET of short grass (Allen et al., 1989; Pereira et al., 2002; Xing et al., 2008). This method is physics-based and explicitly combines physiological and aerodynamic parameters. In some cases, the lack of input variables limits the use of this methods. On this point, Allen et al. (1989) was developed procedures for estimating missing climate parameters such as net radiation, vapor pressure deficit and wind speed and these procedures need to be evaluated in different countries and regions to test their feasibility (Stöckle et al., 2004; Popova et al., 2006; Jabloun and Sahli, 2008). Li et al. (2012) used the evapotranspiration model to evaluate the annual average PET in alpine regions, analyzed the response of annual evapotranspiration to land use changes, and used the Vegetation Temperature Condition Index to modify the plant effective water coefficient (w). The results show that the relative error between the simulated ET and calculated by using water balance equation is 3.81%, and the consistency index is 0.69. Zhang et al. (2007b) examined Penman-Monteith evapotranspiration and 20-cm pan evaporation using 75 meteorological stations data on the Qinghai-Tibet Plateau from 1966 to 2003, and found that during the period 1966 to 2001, the reference evapotranspiration and pan evaporation decreased by 47% and 38%, respectively. Although the temperature in most stations increased significantly (P < 0.05), wind speed and sunshine hours were significantly reduced (P < 0.05). Gu et al. (2008) used the vorticity covariance method to analyze the evapotranspiration of meadows on the Qinghai-Tibet Plateau from 2002 to 2004. The annual precipitation changed greatly, with 554, 706, and 666 mm·a−1 in three consecutive calendar years. The annual ET is 341, 407, and 426 mm·a−1. The annual ET is constant at about 60% of the annual precipitation. During the growing season from May to September, about 85% of ET occurs, and the average ET during this period was 1.90, 2.23, and 2.22 mm·d−1 for three consecutive years. However, during the non-growing season from October to April, the average ET is very low (<0.40 mm·d−1).
Many studies have pointed out that since the 1990s, the climate of the TRH region in the QTP has been warming, and the dry and wet conditions have changed significantly, these characteristics are more prominent after the 21st century (Jin et al., 2004; Liu et al., 2008; Xu et al., 2008b; Zhang et al., 2011). However, most of the current research has focused on the beginning of the 21st century, and there are few analyses on the changes over the past decade. Therefore, it is necessary and urgent to study the characteristics of energy and water cycle changes in the TRH region.
Overview of the Study Area
The TRH region is in the southern part of Qinghai Province, the hinterland of the QTP, which generally refers to the area between 89°–103°E and 31°–36°N, with a total area of 325,000 km2 (Li et al., 2012). Most areas are at least 4,000 m above mean sea level, with the high terrain and the cold climate. The average annual temperature is between −5.4 and 4.2°C. The annual precipitation gradually decreases from 770 mm·a−1 in the southeast to 260 mm·a−1 in the northwest, so the climatic showed significant regional differences (Xiong et al., 2019). Alpine meadows and alpine grasslands are the main vegetation types in TRH region (Liu et al., 2008). TRH region is a typical ecological and climatic transition zone, with surface vegetation sensitive to climate change and responsive rapidly (Zhang et al., 2007a).
Date and Analysis Methods
Global Land Data Assimilation System (GLDAS) is a global land surface data assimilation system jointly developed by National Aeronautics and Space Administration and National Oceanic and Atmospheric Administration. GLDAS is unique in that it is a global, high-resolution, offline modeling system that combines land surface and satellite observations. GLDAS includes five land surface models: The Community Land Model, NOAH, Mosaic, Variable Infiltration Capacity, and Catchment land surface models (Rodell et al., 2004; Reichle and Koster, 2005). GLDAS data is used in this paper because it has advantages. Firstly, GLDAS is a global land assimilation data system with a higher spatial and temporal resolution (0.25° × 0.25° and 3 h). Secondly, GLDAS is a grid data generated by the offline land surface models, which are driven by observational data. The biases in atmospheric model-based forcing can be avoided and by employing data assimilation techniques, observations of land surface states can be used to curb unrealistic model states (Rodell et al., 2004). The GLDAS output including soil temperature, moisture, latent heat flux, sensible heat flux, ground heat flux, and upward/downward radiation. The assimilation results of land surface data generated by surface variables such as precipitation and latent heat flux may be more applicable in the QTP. GLDAS can provide effective and efficient support to various types of continuous high resolution data sets and has accordingly gained wide applications in numerous fields, such as climate change research (Trenberth and Guillemot, 1998). In this paper, the GLDAS derived monthly products with 0.25° spatial resolution with NOAH models are used to compare with observations in this paper. The GLDAS gridded results is interpolated from the grid scale to the point scale to match the in-situ observations. The bilinear interpolation method has been used to interpolate from a rectilinear grid to an unstructured grid (https://www.ncl.ucar.edu/Document/Functions/Built-in/linint2_points.shtml). This interpolation method has been proved to be reliable and wildly used to simulate the QTP climate (Gao et al., 2015), the Heihe River Basin (Pan et al., 2012), India (Kumar et al., 2017), in Europe (Giannaros et al., 2013) and other parts of the world. More details about this gridded data can be found at https://ldas.gsfc.nasa.gov/gldas/gldas-get-data.
In order to study the spatial and temporal distribution characteristics of the energy-water cycle of the TRH, the observation data used are “Surface Daily Climate Data in China” from the China Meteorological Administration. The observation data used in this study include daily near surface 2-m temperature (°C), surface pressure (hPa), relative humidity (%), wind speed (m·s−1) of 14 weather stations [Wudaoliang (WDL) and Tuotuohe (TTH), Qumalai (QML), Zhiduo (ZD), Nangqian (NQ), Qingshuihe (QSH), Yushu (YS), Maduo (MD), Xinghai (XH), Dari (DR), Henan (HN), Jiuzhi (JZ) and Guoluo (GL)] from January 2000 to December 2018. The locations of these weather stations are shown in Figure 1. These data are subjected to quality control and inspection by the China Meteorological Administration prior to use (Zhao et al., 2014).

FIGURE 1. Scope of the source regions of Three-River Headwaters (TRH) and location of weather stations (unit: m).
At present, there are dozens of drought indexes commonly used all over the world, such as Standardized precipitation index (SPI) (Zarch et al., 2015), Reconnaissance drought index, Palmer Drought Severity Index (Vicente-Serrano et al., 2010b), Z index (Karl, 1986), meteorological comprehensive drought index (Jia et al., 2018), etc. Standardized precipitation index has a wide range of applications due to its multiple time scales, and has become one of the operational drought monitoring indicators in many countries and regions. Palmer Drought Severity Index comprehensively considers rainfall, soil moisture, evapotranspiration, runoff and other information, and combining surface dry and wet conditions and moisture abnormalities to monitor drought (Vicente-Serrano et al., 2010a). The common feature of these comprehensive drought indexes is that they require more data and are complicated to calculate. The drought index K is defined as the ratio of evaporation to precipitation (Ghulam et al., 2007), which has been recommended by the FAO (Fu and Feng, 2014) and has seen widespread used by the United Nations educational, scientific and cultural organization, Global environment monitor system , Global resource information database and Desert cure and prevention activity center. When there is less precipitation and more evaporation, the K value is higher, indicating more arid, and vice versa. Since the K is a univariate drought index, the advantage is that it requires less data to calculate, and has a clear meaning. In order to simply represent the relationship between precipitation and evaporation in TRH region, aridity index K is adopted in this paper.
Firstly, we use the Penman-Monteith method (Allen et al., 1998) to calculate the PET in the TRH area from 2000 to 2018, and compare with GLDAS products. Secondly, the PET variation trend in four seasons of 14 weather stations in the TRH region has been analyzed. Finally, we use the precipitation and latent heat flux data of GLDAS to analyze the regional distribution characteristics of precipitation and PET in the TRH region from 2000 to 2018, and use the Manner-Kendall non-parametric test method (Libiseller and Grimvall, 2002; Yue and Wang, 2004) to evaluate the variation trend of PET, precipitation, and aridity index K.
The following FAO Penman–Monteith method have been chosen for this research because of their wide acceptance for estimating PET in many regions (Cai et al., 2007):
where PET is the daily potential evapotranspiration (mm·d−1), Δ is the slope of the water vapor curve (kPa·°C−1), Rn is the net solar radiation at the surface (MJ·m−2), G is the soil heat flux density (MJ·m−2), γ is the thermometer constant (0.66 kPa·°C−1), T is 2-m air temperature (°C), U2 is the 2-m wind speed, es is the saturated water vapor (kPa), and ea is the actual water vapor (kPa). The Rn is calculated as follow:
Ra is the incoming solar radiation (MJ·m−2·d−1), a and b are empirical coefficients (a = 0.4 and b = 0.5). Since the empirical coefficient recommended by FAO has a large error from the measured value, Zhou et al. (2014) to fit the a and b values using the observed radiation data from Qinghai Province. In this paper, we use this empirical coefficient making the calculation results more applicable in the TRH region. n is the actual sunshine duration (h), and N is the maximum possible sunshine duration (h). σ is Stefan-Boltzmann constant for a day (4.903 × 10⁻⁹ MJ·K−4·m−2·d−1), Tmax,K and Tmin,K are the maximum and minimum 2-m air temperature (K).
Result
Temporal and Spatial Variation Characteristics of Potential Evapotranspiration in the Three-River Headwaters Region
Since the 21st century, the calculated PET of 14 weather stations in the TRH region has shown an increasing trend, with annual average growth rate of 1.4 ± 1.2 mm·a−1. Chi-square (χ2) test (McHugh, 2013) was used to test the increasing trend of PET from 2000 to 2018, and it was found that the PET shows a statistically significant upward trend in QML (Z = 4.07, p = 0.043) and GL (Z = 7.05, p = 0.008), respectively, and the growing rate in GL, reaching 3.4 ± 1.0 mm·a−1, and the following 2.3 ± 1.0 mm·a−1 in QML, respectively. The PET shows a decrease trend in XH and YS, and the annual average descent rate of −1.5 ± 1.4 and −0.6 ± 1.6 mm·a−1, respectively. In the other weather stations, the increasing trend of PET had no statistical significance, and not passed the significance chi-squared-test (p > 0.05). Many studies have indicated that the change of PET is positively correlated with temperature (Taconet et al., 1986; Trajkovic, 2005). The increasing trend of PET in the TRH region may be related to the significant increase in temperature in recent decades, and the increase rate of temperature in the TRH region is obviously higher than the global averaged increase rate (Duan et al., 2006) (Figure 2).
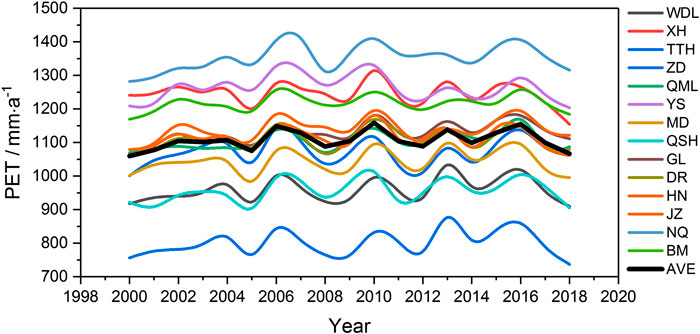
FIGURE 2. The annual variation of potential evapotranspiration (PET) with 14 weather stations in the TRH from 2000 to 2018.
Figure 3 shows the spatial distribution of PET based on the observation data of 14 weather stations in different seasons and annual averaged values in TRH region. The value of PET in all weather stations is higher in spring and summer, but lower in autumn and winter. The PET has obvious regional difference with seasonal change. The PET in the eastern area of the TRH is higher, while in the western area is lower in all seasons. In spring and summer, the XH and GL weather station, located in the eastern part of TRH region, has a higher value of PET over 350 mm·m−1, and less than 150 mm·m−1 in winter. In the western part of TRH region, the value of PET in WDL and TTH is lower all over the year, reaching about 200 to 300 mm·m−1 in summer and below 100 mm·m−1 in winter.
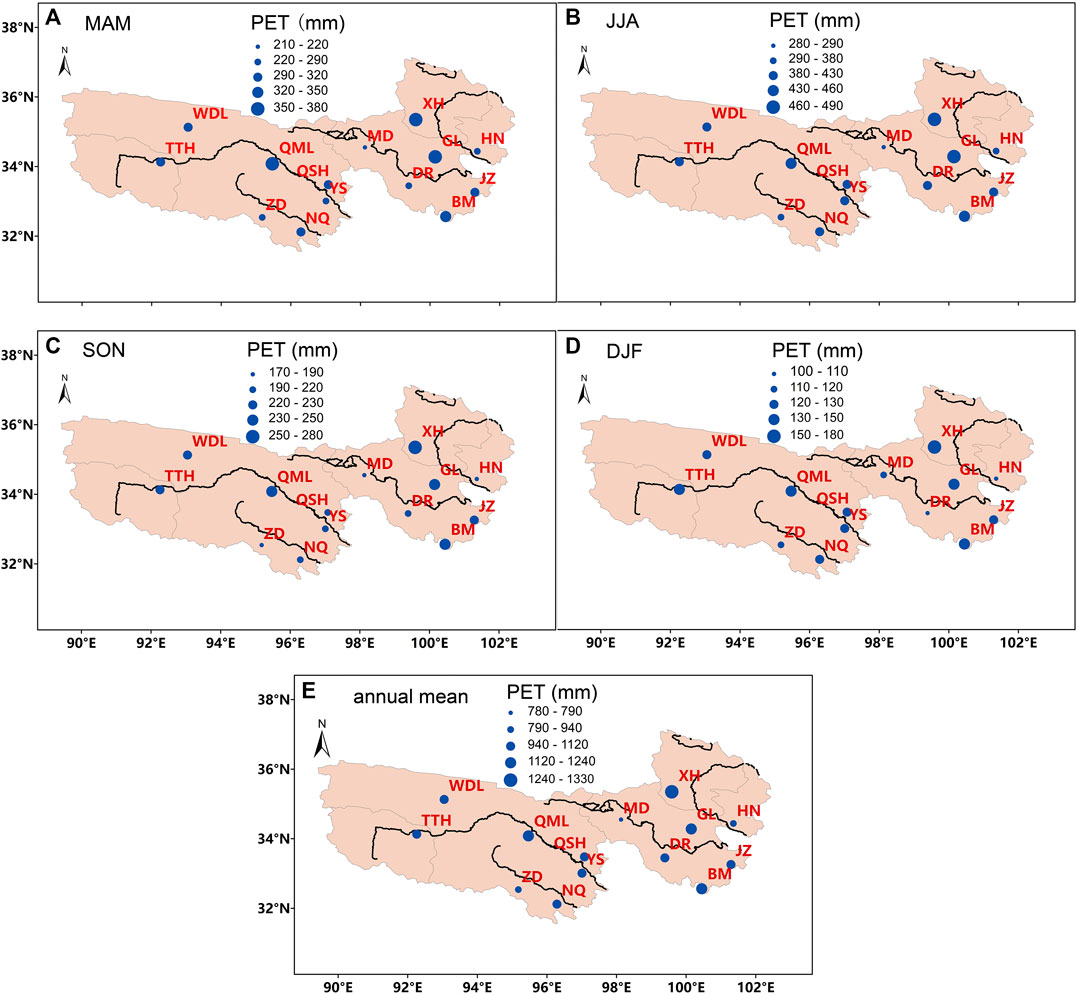
FIGURE 3. PET variation trend in four seasons and annual mean of 14 weather stations in the TRH region. (A) MAM, (B) JJA, (C) SON, (D) DJF, and (E) annual mean.
In general, in the TRH region, the local climate is a typical plateau mountain climate, which is also a typical plateau continental climate, showing seasonal alternating cold-hot and dry-wet alternating (Cheng and Wu, 2007). We use the Penman-Monteith method to estimate the average annual PET is 1,107.1 mm·a−1 in TRH region, and the spatial distribution has obvious regional differences. PET is higher in the eastern area of the TRH region, while lower in the western and southern area. PET ranges from 799.9 mm·a−1 (ZD) to 1,352.6 mm·a−1 (NQ) throughout the year. The areas with higher PET are in XH, YS, NQ and BM with annual mean value above 1,200 mm·a−1, and in the western area, the PET is approximately 960 mm·a−1 in WDL. The PET reaches the highest value in summer, while in winter is the lowest throughout the year. The multi-year averaged PET and its spatial distribution characteristics are consistent with the results calculated by Zhou et al. (2014).
Comparison and Verification of Potential Evapotranspiration With Global land Surface Data Assimilation System Output
Due to the sparse weather stations in the QTP, it is difficult to analyze the PET accurately in the entire TRH region. Therefore, it is necessary to use the high spatial and temporal resolution numerical model data to analyze the PET in this region. We have compared and verified the calculated monthly PET of the 14 weather stations with the GLDAS simulations in the TRH region, and the error statistics is listed in Table 1. Based on verifying the applicability of GLDAS data, the precipitation, evaporation, and the aridity index K in TRH region are analyzed and discussed in detail by using the high spatial resolution GLDAS data.
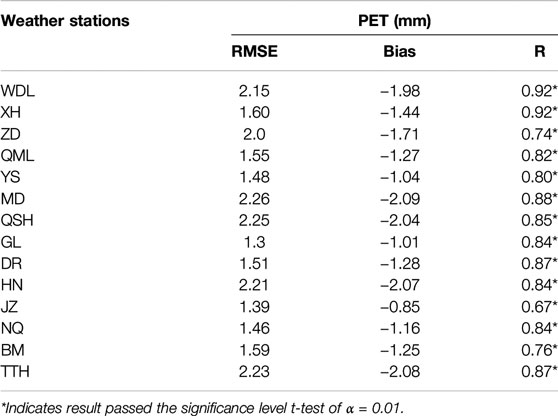
TABLE 1. RMSE, bias and correlation coefficient (r) of PET between calculated monthly averaged value and GLDAS simulations in the TRH region.
Figure 4 shows the comparison between calculated PET using the Penman-Monteith method and GLDAS products from 2000 to 2018. Four weather stations of XH, QML, YS, and GL were selected to represent the eastern and central area of the TRH region. It can be seen from Figure 4 that the calculated PET is in good agreement with simulated GLDAS values, which can reflect the annual change trend. The peak value of calculated PET in summer is about 6 mm·d−1, while the peak value of GLDAS products can exceed 8 mm·d−1 at most, and it is below 1 mm·d−1 in winter. This indicates that the evaporation on the underlying surface is intense in summer, the water vapor exchange between land and atmosphere is sufficient, and the atmosphere-land interaction is obvious. However, due to the low temperature in winter, the saturated water pressure in the atmosphere is low, and the water vapor content is less in the atmosphere, which lead to a lower PET. It can be seen from the scatter plots that the value of PET in GLDAS simulations is almost higher than the calculated throughout the year, and most of the scattered points are distributed on the upper left of the 1:1 line, indicating that the results of GLDAS are higher throughout the year.
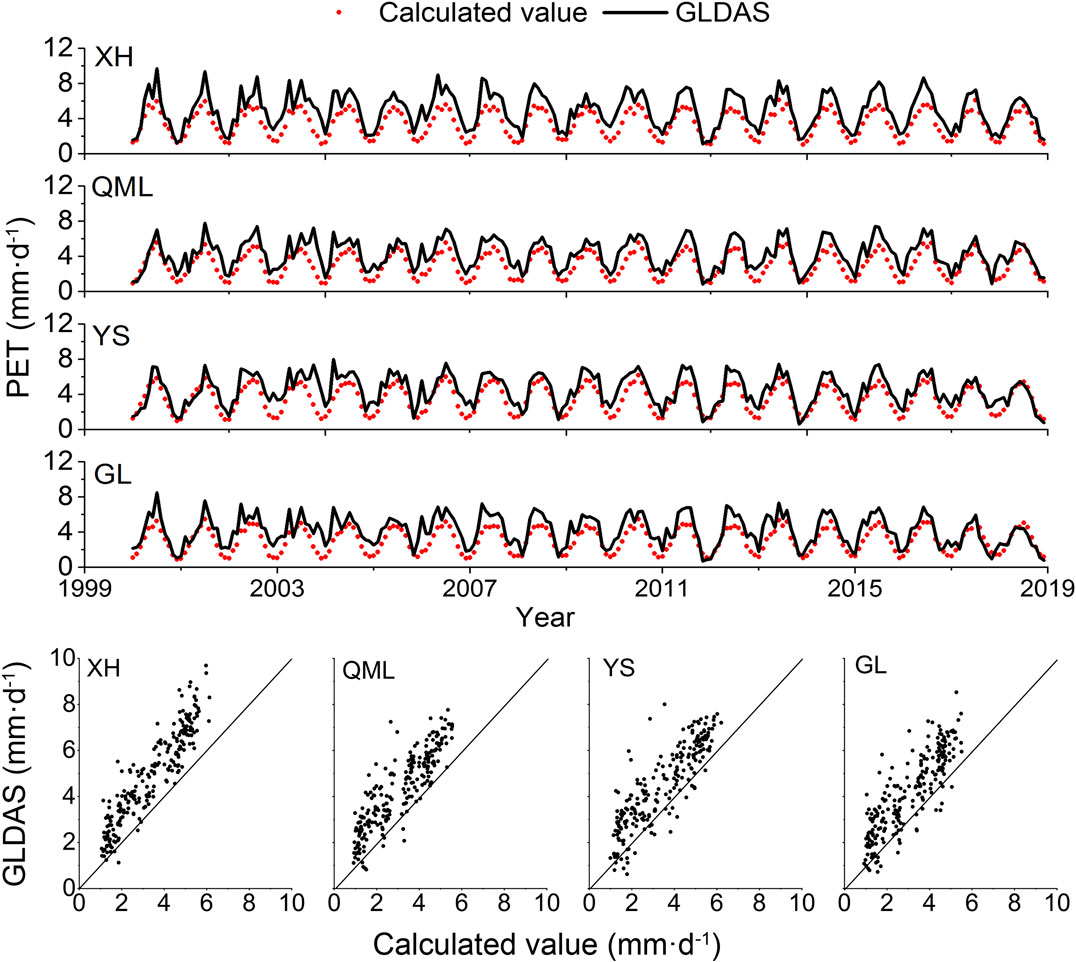
FIGURE 4. Comparison of calculated daily average PET and Global Land Data Assimilation System (GLDAS) simulations from four weather stations in TRH region during 2000–2018.
The root mean square error (RMSE), bias and correlation coefficient (r) of PET between calculated monthly averaged value and GLDAS simulations in the TRH region is show in Table1. The calculated PET from the 14 stations is less than the result of GLDAS, and the Bias is between −0.85 mm·d−1 in JZ and −2.09 mm·d−1 in MD, respectively. The RMSE is between 1.3 mm·d−1 in GL and 2.26 mm·d−1 in MD, respectively. The correlation coefficient ranges between 0.67 and 0.92, and it passes the significance level test of α = 0.05. In general, the calculated PET has a good correlation with GLDAS, but the calculated values are lower than the simulated values of GLDAS, and the entire Bias is negative. The average Bais of 14 stations is −1.5 mm·d−1 and RMSE is 1.8 mm·d−1. The calculated PET annual change trend is basically consistent with GLDAS, and GLDAS data can be used for evapotranspiration analysis in TRH region.
Studies have shown that the annual averaged PET of China from 1971 to 2008 showed a downward trend, mainly due to changes in wind speed and sunshine hours, while variation of relative humidity and temperature contributed little to PET (Zhou et al., 2014). The decrease in wind speed is the main reason for the decrease of annual PET in the northern temperate zone and the Tibetan Plateau (Yin et al., 2010). The reduction of wind speed and the shortening of sunshine time, resulting in an overall decrease in PET. The significant decrease in wind speed corresponds to the decreasing trend of upper-altitude zonal wind and the decrease of pressure gradient (Zhang et al., 2009). We compared and analyzed the monthly averaged wind speed of 14 meteorological stations and GLDAS output in the TRH region from 2000 to 2018, and found that the observation of wind speed at all stations were less than GLDAS output. The wind speed of GLDAS is above 4 m·s−1 in all stations, while the most observation of wind speed is below 2.5 m·s−1, except WDL, XH, TTH, and MD (4.1, 3.6, 3.6, and 2.9 m·s−1, respectively). This may be the main reason why calculated PET is less than GLDAS output in this paper. Due to the lack of observed solar radiation data, it is difficult to analyze the changes of PET caused by the radiation changes in the TRH region. This will be considered to analyze in the future work.
Spatial Distribution of Annual Averaged Precipitation, Potential Evapotranspiration and Aridity Index K of Global Land Surface Data Assimilation System Simulations
The energy-water cycle of the underlying surface is closely related to the atmospheric water cycle and precipitation (Xu et al., 2008a). Based on the evaluation and verification of the GLDAS data in the previous section, the latent heat flux (W·m−2) in the GLDAS output was used to calculate the PET, and then the aridity index K (K is the ratio of PET to precipitation) was calculated from the precipitation. It can be seen from Figure 5 that the distribution of precipitation in the TRH region decreases from southeast to northwest. The southeast area is affected by warm and moist flow. The annual precipitation is about 1,000 mm·a−1, up to 1,236 mm·a−1, and the annual precipitation in the northwest is about 200 mm·a−1. This is related to the influence of the thermal and dynamic effects caused by the terrain height of the atmospheric circulation (Guo et al., 2012). The multi-year averaged trend of the PET is higher in the east and west area (above 1,800 mm·a−1) and lower in the central area (below 1,200 mm·a−1), which is consistent with the distribution of PET calculated by the 14 weather stations in this region using the Penman-Monteith method. The distribution characteristics of aridity index K are: the areas with more annual average precipitation have lower PET, and the index K is inversely related to precipitation. In general, from 2000 to 2018, the northwestern area of the TRH region was dry (K range from 6 to 8), while the southern and eastern area were moist (K below 4). Table 2 shows the annual averaged precipitation, PET, and the aridity index K in GLDAS output and interpolated to 14 weather stations in the TRH region.
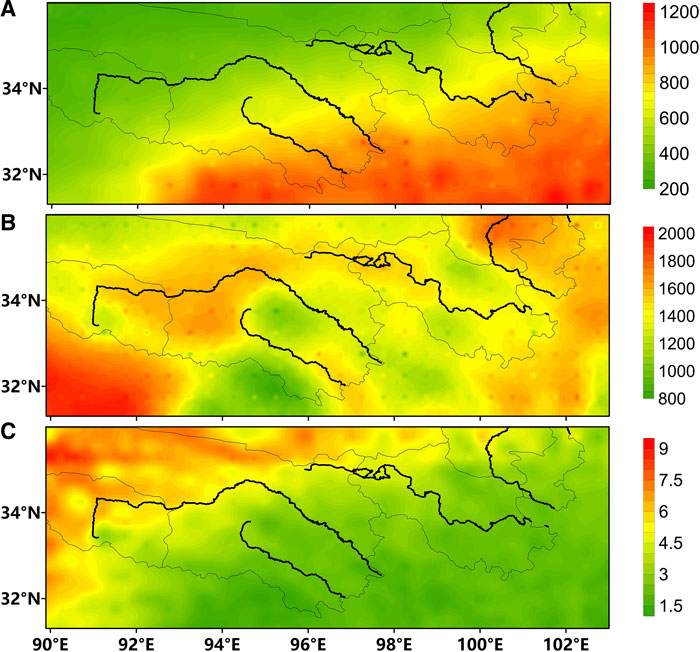
FIGURE 5. Spatial distribution of annual averaged (A) precipitation (unit: mm), (B) PET (unit: mm) and (C) aridity index K (dimensionless) in the TRH region from 2000 to 2018.
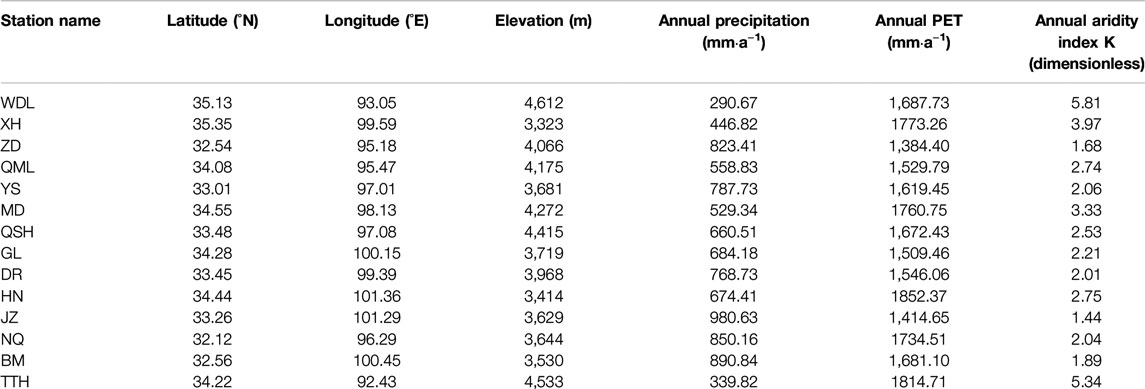
TABLE 2. Annual precipitation, PET and aridity index K from GLDAS output in each weather station.
It can be seen from Table 2 that the precipitation can reach 980 mm·a−1 in JZ, which is the highest value in the area. The precipitation is only 290 mm·a−1 in WDL. However, the PET have little difference in the TRH region, between 1,384 and 1,852 mm·a−1. the index K of different stations is inversely related to the precipitation. The K value of WDL is 5.8 and that of JZ is 1.4. This shows that the area with more precipitation have lower PET, while the western area with sparse precipitation have higher aridity index K and higher PET.
Variation Trend of the Annual Precipitation, Potential Evapotranspiration and Aridity Index K of Global Land Surface Data Assimilation System Products
It can be seen from Figure 6A that the average annual precipitation in the TRH entire region shows an upward trend with a higher increase range. This is mainly due to the sharp increase in precipitation in 2018, which is1.5 times of the yearly averaged precipitation. It can also be seen from the non-parametric Mann–Kendall method (M-K) test sequence of precipitation in Figure 6D that the annual precipitation has increased from 2003 to the intersection of the two sequence lines in 2018, that is, mutation occurs. Before 2018, the two sequence lines were within the significance level of α = 0.05. After 2018, the precipitation in the TRH region began to shows an obvious upward trend. As the QTP is significantly affected by climate change, and climate change will lead to changes in the precipitation in the TRH region. Tong et al. (2014) found that after 1990, the climate over the TRH region turned from “Warm-Dry” to “Warm-Wet,” and the average temperature and precipitation increased by 0.91°C and 102 mm, respectively. From 1990 to 2012, the average humidity index increased by 0.06 and showing an upward trend. We can see that these findings are consistent with our results. The PET in the entire TRH region was abrupt around 2001 (Figure 6B), and the statistic symbol (UF) line reached a significant level of α = 0.05 in 2003, and thereafter all showed an upward trend, and reached a significant increase in 2006, 2010, and 2015, respectively, which indicating that the PET has the more obvious increase trend (Figure 6E). From 2000 to 2018, precipitation and PET showed an upward trend, and precipitation increases more significantly, resulting in a downward trend in aridity index K (Figure 6C). The statistic symbol (UF and UB) lines of the index K showed fluctuations before 2010, and abrupt changes occurred around 2018. Since then, the aridity index K in the TRH region has begun to decline (Figure 6F).
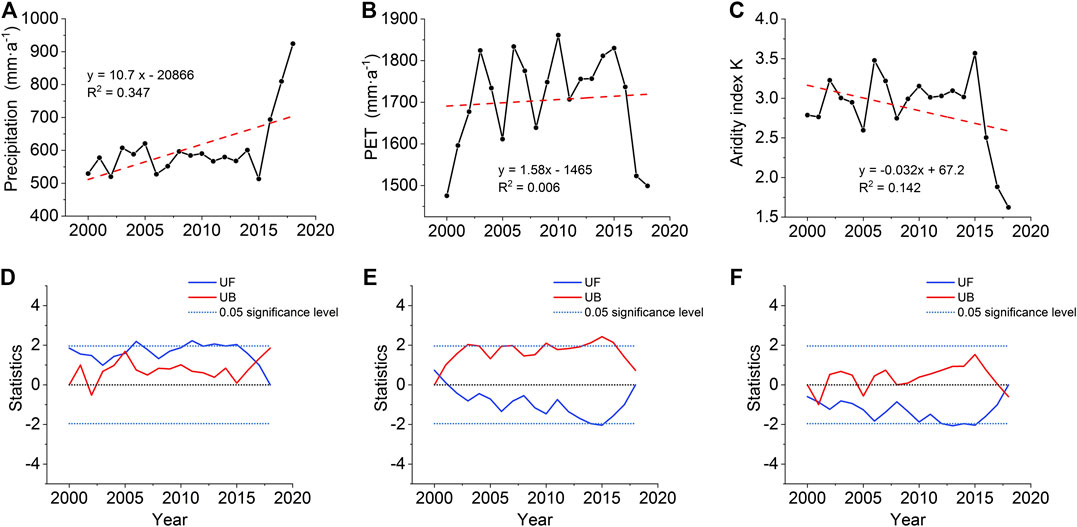
FIGURE 6. Variation trend and the Mann-Kendall test of annual precipitation (A,D), PET (B,E) and aridity index K (C,F) in the TRH region from 2000 to 2018.
Conclusion and Discussion
It is found that the calculated PET is significantly lower than the GLDAS output in the TRH region, and the wind speed observation data of meteorological stations is significantly lower than the wind speed of GLDAS, which may be the main reason why PET is lower than GLDAS. Zhang et al. (2009) studied the annual and seasonal trends of climatic factors of temperature, solar radiation, relative humidity, and wind speed at the Qinghai-Tibet Plateau meteorological station during 1971 to 2004 to determine the PET trend changes. It is found that there is a significant increase in temperature and a significant decrease in wind speed in almost the entire plateau all over the year. In JJA, SON, and MAM, the sunshine duration time decreases significantly in the south of 33°N latitude, and the relative humidity increases significantly in the south of 33°N latitude. The decrease of wind speed is the main reason for the decrease in PET in the northern plateau. Radiation reduction is the main factor in the reduction of summer PET at most sites in the southeastern plateau, which is consistent with the reduction in evaporation in the northern hemisphere, and due to the increase in cloud cover and aerosol concentration in the past 50 years (Roderick and Farquhar, 2002). From 1973 to 2007, the presence of aerosols reduced the visibility of clear sky, leading to global net dimming (Wang et al., 2009). Liu et al. (2004) found that the decrease in solar irradiance (sunshine time) caused by aerosols is most likely the driving force for the decrease in regional evaporation, which is consistent with the research of Ren and Guo (2006). So far, due to the lack of observation data of aerosols in the Tibetan Plateau, it is still difficult to determine the impact of atmospheric aerosols on sunshine duration. However, a recent study showed that in South Asia, the burning of fossil fuels and biomass produces a large number of brown clouds that are a mixture of aerosols (Ramanathan et al., 2007), it may be transported to the Qinghai-Tibet Plateau by the summer monsoon, which has led to a decrease in sunshine time in recent years. Due to the lack of observed solar radiation data, it is difficult to analyze the changes of PET caused by the radiation changes in the TRH region. This will be considered to analyze in the future work.
In this paper, we use the FAO-Penman-Monteith method to calculate the PET in the TRH area from 2000 to 2018, and use the observed surface pressure and 2-m temperature and the calculated PET in the TRH area compare with GLDAS products. Finally, the regional distribution characteristics of precipitation, PET and aridity index K in the TRH area has been analyzed. The main conclusions can be summarized as follows:
(1) From 2000 to 2018, the average annual PET of 14 weather stations in TRH region showed an upward trend, with the annual growth rate of 1.4 ± 1.2 mm·a−1, the upward trend of GL and QML passed the significance chi-squared-test (p > 0.05). The higher increase rate of PET in GL and QML reached 3.4 ± 1.0 and 2.3 ± 1.0 mm·a−1, respectively. The PET shows a decrease trend in XH and YS, and the annual average descent rate of −1.5 ± 1.4 mm·a−1 and −0.6 ± 1.6 mm·a−1, respectively. The annual mean value of PET calculated by the Penman-Monteith method is 1,107.1 mm·a−1 of 14 weather stations in the TRH region, and the spatial distribution has showed regional differences.
(2) PET is higher in spring and summer, but lower in autumn and winter. PET is higher in the eastern area of the TRH region, while lower in the western area. PET ranges from 799.9 mm·a−1 in ZD to 1,352.6 mm·a−1 in NQ. The areas with higher PET are in XH, YS, NQ and BM with annual mean value above 1,200 mm·a−1. The PET reaches the highest value in summer, while in winter is the lowest throughout the year.
(3) The observation of wind speed at all stations were less than GLDAS output. The wind speed of GLDAS is above 4 m·s−1 in all stations, while the most observation of wind speed is below 2.5 m·s−1, except WDL, XH, TTH, and MD (4.1, 3.6, 3.6, and 2.9 m·s−1, respectively). This may be the main reason why calculated PET is less than GLDAS output.
(4) High-resolution GLDAS data were used to analyze the precipitation, PET and aridity index K in TRH. It was found that PET was lower in the southern part of TRH where precipitation exceeded 1,000 mm·a−1. The spatial distribution of aridity index K of the whole area is consistent with the spatial distribution of precipitation. From 2000 to 2018, the index K of the TRH region increased from southeast to northwest gradually. The annual average precipitation and ET showed an upward trend from 2000 to 2018, and the precipitation showed an obvious upward trend after 2018, leading to a downward trend in the aridity index K of the whole region. The M-K test was carried out on precipitation, PET and aridity index K. It is found that after 2003, the average annual precipitation increased gradually, and the abrupt change occurred in 2018. The precipitation has abrupt increase in 2018, which is 1.5 times of the yearly averaged precipitation and the aridity index K also changed abruptly around 2018.
Data Availability Statement
Publicly available datasets were analyzed in this study. This data can be found here: https://ldas.gsfc.nasa.gov/gldas/gldas-get-data.
Author contribution
WX and PW wrote the manuscript. SX, LM, LS, CB, ZS and WC reviewing and editing. ZZ, ML, RY, and XB collected the data.
Funding
This research was supported by the Second Tibetan Plateau Scientific Expedition and Research (STEP) program (Grant No. 2019QZKK0103), National Natural Science Foundation of China (Grant No. 41975096), and Sichuan Science and Technology Program (Grant No. 2019YJ0360).
Conflict of Interest
The authors declare that the research was conducted in the absence of any commercial or financial relationships that could be construed as a potential conflict of interest.
Acknowledgments
We thank the editor and reviewers for their valuable comments leading to improvements of this manuscript. The meteorological dataset was provided by the China Meteorological Data Sharing Service System (http://cdc.cma.gov.cn), and the GLDAS data were acquired from the website of NASA (https://disc.gsfc.nasa.gov/datasets?keywords=GLDAS).
References
Allen, R. G., Pereira, L. S., Raes, D., and Smith, M. (1998). Crop evapotranspiration-Guidelines for computing crop water requirements. Rome: FAO, FAO Irrigation and Drainage Paper 56, Vol. 300, D05109.
Allen, R. G., Jensen, M. E., Wright, J. L., and Burman, R. D. (1989). Operational estimates of reference evapotranspiration. Agron. J. 81, 650–662. doi:10.2134/agronj1989.00021962008100040019x
Cai, J., Liu, Y., Lei, T., and Pereira, L. S. (2007). Estimating reference evapotranspiration with the FAO Penman-Monteith equation using daily weather forecast messages. Agric. For. Meteorol. 145, 22–35. doi:10.1016/j.agrformet.2007.04.012
Chen, S. B., Liu, Y. F., and Thomas, A. (2006). Climatic change on the Tibetan Plateau: potential evapotranspiration trends from 1961–2000. Climatic Change. 76, 291–319. doi:10.1007/s10584-006-9080-z
Cheng, G., and Wu, T. (2007). Responses of permafrost to climate change and their environmental significance, Qinghai‐Tibet Plateau. J. Geophys. Res. 112, F2. doi:10.1029/2006jf000631
Ding, Y., Zhang, S., Zhao, L., Li, Z., and Kang, S. (2019). Global warming weakening the inherent stability of glaciers and permafrost. Sci. Bull. 64, 245–253. doi:10.1016/j.scib.2018.12.028
Duan, A., Wu, G., Zhang, Q., and Liue, Y. (2006). New proofs of the recent climate warming over the Tibetan Plateau as a result of the increasing greenhouse gases emissions. Chin. Sci. Bull. 51, 1396–1400. doi:10.1007/s11434-006-1396-6
Fu, Q., and Feng, S. (2014). Responses of terrestrial aridity to global warming. J. Geophys. Res. Atmos. 119, 7863–7875. doi:10.1002/2014jd021608
Gao, Y., Xu, J., and Chen, D. (2015). Evaluation of WRF mesoscale climate simulations over the Tibetan Plateau during 1979–2011. J. Clim. 28, 2823–2841. doi:10.1175/jcli-d-14-00300.1
Ghulam, A., Qin, Q., and Zhan, Z. (2007). Designing of the perpendicular drought index. Environ. Geol. 52, 1045–1052. doi:10.1007/s00254-006-0544-2
Giannaros, T. M., Melas, D., Keramitsoglou, I., Daglis, I. A., and Kourtidis, K. (2013). Development of a modeling system for urban heat islands: an application to Athens and Thessaloniki, Greece. Atmos. Environ. 73, 103–108. doi:10.1016/j.atmosenv.2013.02.055
Gu, L., Hu, Z., Yao, J., and Sun, G. (2017). Actual and reference evapotranspiration in a cornfield in the Zhangye oasis, northwestern China. Water 9, 499. doi:10.3390/w9070499
Gu, S., Tang, Y., Cui, X., Du, M., Zhao, L., Li, Y., et al. (2008). Characterizing evapotranspiration over a meadow ecosystem on the Qinghai‐Tibetan Plateau. J. Geophys. Res. 113, D08118. doi:10.1029/2007jd009173
Guo, D., Wang, P., Zhou, X., Liu, Y., and Li, W. (2012). Dynamic effects of the South Asian high on the ozone valley over the Tibetan Plateau. Acta Meteorol. Sin. 26, 216–228. doi:10.1007/s13351-012-0207-2
Hu, Y., Maskey, S., and Uhlenbrook, S. (2013a). Downscaling daily precipitation over the Yellow River source region in China: a comparison of three statistical downscaling methods. Theor. Appl. Climatol. 112, 447–460. doi:10.1007/s00704-012-0745-4
Hu, Y., Maskey, S., and Uhlenbrook, S. (2013b). Expected changes in future temperature extremes and their elevation dependency over the Yellow River source region. Hydrol. Earth Syst. Sci. 17, 2501. doi:10.5194/hess-17-2501-2013
Jabloun, M., and Sahli, A. (2008). Evaluation of FAO-56 methodology for estimating reference evapotranspiration using limited climatic data. Agric. Water Manag. 95, 707–715. doi:10.1016/j.agwat.2008.01.009
Jia, M., Mei-juan, Q., Yu, G., Jing-quan, R., and Yang, L. (2018). Applicability of five drought indices for agricultural drought evaluation in Jilin Province, China. Yingyong Shengtai Xuebao. 29, 2624–2632. doi:10.13287/j.1001-9332.201808.014
Jin, L., Li, J., Wang, X., and Chen, F. (2004). The temporal and spatial distribution of surface dry-wet conditions over northwestern China in recent 50 years. Acta Geograph. Sin. 59, 847–854. doi:10.11821/xb200406006
Kang, S., Xu, Y., You, Q., Flügel, W.-A., Pepin, N., and Yao, T. (2010). Review of climate and cryospheric change in the Tibetan Plateau. Environ. Res. Lett. 5, 015101. doi:10.1088/1748-9326/5/1/015101
Karl, T. R. (1986). The sensitivity of the Palmer Drought Severity Index and Palmer's Z-index to their calibration coefficients including potential evapotranspiration. J. Clim. Appl. Meteorol. 25, 77–86. doi:10.1175/1520-0450(1986)025<0077:tsotpd>2.0.co;2
Krause, P., Biskop, S., Helmschrot, J., Flügel, W.-A., Kang, S., and Gao, T. (2010). Hydrological system analysis and modelling of the Nam Co basin in Tibet. Adv. Geosci. 27, 29–36. doi:10.5194/adgeo-27-29-2010
Kumar, P., Kishtawal, C. M., and Pal, P. K. (2017). Impact of ECMWF, NCEP, and NCMRWF global model analysis on the WRF model forecast over Indian Region. Theor. Appl. Climatol. 127, 143–151. doi:10.1007/s00704-015-1629-1
Lan, Y., Zhao, G., Zhang, Y., Wen, J., Liu, J., and Hu, X. (2010). Response of runoff in the source region of the Yellow River to climate warming. Quat. Int. 226, 60–65. doi:10.1016/j.quaint.2010.03.006
Li, H., Liu, G., and Fu, B. (2012). Estimation of regional evapotranspiration in alpine area and its response to land use change: a case study in Three-River Headwaters region of Qinghai-Tibet Plateau, China. Chin. Geogr. Sci. 22, 437–449. doi:10.1007/s11769-012-0550-0
Li, L., Yang, S., Wang, Z., Zhu, X., and Tang, H. (2010). Evidence of warming and wetting climate over the Qinghai-Tibet Plateau. Arctic Antarct. Alpine Res. 42, 449–457. doi:10.1657/1938-4246-42.4.449
Li, Z.-c., Wei, Z.-g., Lv, S.-h., Dong, W.-j., Gao, Y.-h., Wei, H., et al. (2014). Effect of land surface processes on the Tibetan Plateau’s past and its predicted response to global warming: an analytical investigation based on simulation results from the CMIP5 model. Environ. Earth Sci. 72, 1155–1166. doi:10.1007/s12665-013-3034-3
Libiseller, C., and Grimvall, A. (2002). Performance of partial Mann-Kendall tests for trend detection in the presence of covariates. Environmetrics 13, 71–84. doi:10.1002/env.507
Liu, B., Xu, M., Henderson, M., and Gong, W. (2004). A spatial analysis of pan evaporation trends in China, 1955–2000. J. Geophys. Res. 109, D15102. doi:10.1029/2004JD004511
Liu, J., Xu, X., and Shao, Q. (2008). Grassland degradation in the “three-river headwaters” region, Qinghai province. J. Geogr. Sci. 18, 259–273. doi:10.1007/s11442-008-0259-2
Liu, X., and Chen, B. (2000). Climatic warming in the Tibetan Plateau during recent decades. Int. J. Climatol. 20, 1729–1742. doi:10.1002/1097-0088(20001130)20:14<1729::aid-joc556>3.0.co;2-y
Liu, Y., Chen, H., Zhang, G., Sun, J., and Wang, H. (2019). The advanced South Asian monsoon onset accelerates lake expansion over the Tibetan Plateau. Sci. Bull. 64, 1486–1489. doi:10.1016/j.scib.2019.08.011
McHugh, M. L. (2013). The chi-square test of independence. Biochem. Med. 23, 143–149. doi:10.11613/bm.2013.018
Milly, P. C. D., and Dunne, K. A. (2016). Potential evapotranspiration and continental drying. Nat. Clim. Change. 6, 946–949. doi:10.1038/nclimate3046
Pan, X., Li, X., Shi, X., Han, X., Luo, L., and Wang, L. (2012). Dynamic downscaling of near-surface air temperature at the basin scale using WRF-a case study in the Heihe River Basin, China. Front. Earth Sci. 6, 314–323. doi:10.1007/s11707-012-0306-2
Pereira, A., Sentelhas, P., Folegatti, M., Villa Nova, N., Maggiotto, S., and Pereira, F. (2002). Substantiation of the daily FAO-56 reference evapotranspiration with data from automatic and conventional weather stations. Revista Brasileira de Agrometeorologia. 10, 251. doi:10.1016/j.agwat.2009.12.001
Popova, Z., Kercheva, M., and Pereira, L. S. (2006). Validation of the FAO methodology for computing ETo with limited data. Application to South Bulgaria. Irrigat. Drain. 55, 201–215. doi:10.1002/ird.228
Ramanathan, V., Ramana, M. V., Roberts, G., Kim, D., Corrigan, C., Chung, C., et al. (2007). Warming trends in Asia amplified by brown cloud solar absorption. Nature 448, 575–578. doi:10.1038/nature06019
Reichle, R. H., and Koster, R. D. (2005). Global assimilation of satellite surface soil moisture retrievals into the NASA catchment land surface model. Geophys. Res. Lett. 32, L15403. doi:10.1029/2004gl021700
Ren, G., and Guo, J. (2006). Change in pan evaporation and the influential factors over China: 1956–2000. J. Nat. Resour. 21, 31–44. doi:1000-3037(2006)01-0031-14
Rodell, M., Houser, P. R., Jambor, U., Gottschalck, J., Mitchell, K., Meng, C.-J., et al. (2004). The global land data assimilation system. Bull. Am. Meteorol. Soc. 85, 381–394. doi:10.1175/bams-85-3-381
Roderick, M. L., and Farquhar, G. D. (2002). The cause of decreased pan evaporation over the past 50 years. Science 298, 1410–1411. doi:10.1126/science.1075390
Shi, T., Guan, D., Wang, A., Wu, J., Jin, C., and Han, S. (2008). Comparison of three models to estimate evapotranspiration for a temperate mixed forest. Hydrol. Process. 22, 3431–3443. doi:10.1002/hyp.6922
Singh, V. P., and Xu, C.-Y. (1997). Evaluation and generalization of 13 mass‐transfer equations for determining free water evaporation. Hydrol. Process. 11, 311–323. doi:10.1002/(sici)1099-1085(19970315)11:3<311::aid-hyp446>3.0.co;2-y
Stöckle, C. O., Kjelgaard, J., and Bellocchi, G. (2004). Evaluation of estimated weather data for calculating Penman-Monteith reference crop evapotranspiration. Irrigat. Sci. 23, 39–46. doi:10.1007/s00271-004-0091-0
Tabari, H., Grismer, M. E., and Trajkovic, S. (2013). Comparative analysis of 31 reference evapotranspiration methods under humid conditions. Irrigat. Sci. 31, 107–117. doi:10.1007/s00271-011-0295-z
Taconet, O., Bernard, R., and Vidal-Madjar, D. (1986). Evapotranspiration over an agricultural region using a surface flux/temperature model based on NOAA-AVHRR data. J. Clim. Appl. Meteorol. 25, 284–307. doi:10.1175/1520-0450(1986)025<0284:eoaaru>2.0.co;2
Team, C. W. (2007). Contribution of working groups I, II and III to the fourth assessment report of the intergovernmental panel on climate change. IPCC 2007: climate change 2007, IPCC Synthesis Report, 104
Tong, L., Xu, X., Fu, Y., and Li, S. (2014). Wetland changes and their responses to climate change in the “three-river headwaters” region of China since the 1990s. Energies 7, 2515–2534. doi:10.3390/en7042515
Trajkovic, S. (2005). Temperature-based approaches for estimating reference evapotranspiration. J. Irrigat. Drain. Eng. 131, 316–323. doi:10.1061/(asce)0733-9437(2005)131:4(316)
Trenberth, K. E., and Guillemot, C. J. (1998). Evaluation of the atmospheric moisture and hydrological cycle in the NCEP/NCAR reanalyses. Clim. Dynam. 14, 213–231. doi:10.1007/s003820050219
Valipour, M. (2017). Analysis of potential evapotranspiration using limited weather data. Appl. Water Sci. 7, 187–197. doi:10.1007/s13201-014-0234-2
Valipour, M., Gholami Sefidkouhi, M. A., and Raeini−Sarjaz, M. (2017). Selecting the best model to estimate potential evapotranspiration with respect to climate change and magnitudes of extreme events. Agric. Water Manag. 180, 50–60. doi:10.1016/j.agwat.2016.08.025
Valipour, M. (2014). Use of average data of 181 synoptic stations for estimation of reference crop evapotranspiration by temperature-based methods. Water Resour. Manag. 28, 4237–4255. doi:10.1007/s11269-014-0741-9
Vicente-Serrano, S. M., Beguería, S., and López-Moreno, J. I. (2010a). A multiscalar drought index sensitive to global warming: the standardized precipitation evapotranspiration index. J. Clim. 23, 1696–1718. doi:10.1175/2009jcli2909.1
Vicente-Serrano, S. M., Beguería, S., López-Moreno, J. I., Angulo, M., and El Kenawy, A. (2010b). A new global 0.5 gridded dataset (1901–2006) of a multiscalar drought index: comparison with current drought index datasets based on the Palmer Drought Severity Index. J. Hydrometeorol. 11, 1033–1043. doi:10.1175/2010jhm1224.1
Wang, B., Ma, Y., Su, Z., Wang, Y., and Ma, W. (2020). Quantifying the evaporation amounts of 75 high-elevation large dimictic lakes on the Tibetan Plateau. Science Advances. 6, eaay8558. doi:10.1126/sciadv.aay8558
Wang, K., Dickinson, R. E., and Liang, S. (2009). Clear sky visibility has decreased over land globally from 1973 to 2007. Science 323, 1468–1470. doi:10.1126/science.1167549
Xing, Z., Chow, L., Meng, F.-R., Rees, H., Steve, L., and Monteith, J. (2008). Validating evapotranspiraiton equations using bowen ratio in New Brunswick, Maritime, Canada. Sensors 8, 412–428. doi:10.3390/s8010412
Xiong, Q., Xiao, Y., Halmy, M. W. A., Dakhil, M. A., Liang, P., Liu, C., et al. (2019). Monitoring the impact of climate change and human activities on grassland vegetation dynamics in the northeastern Qinghai-Tibet Plateau of China during 2000–2015. J. Arid Land. 11, 637–651. doi:10.1007/s40333-019-0061-2
Xu, X., Lu, C., Shi, X., and Gao, S. (2008a). World water tower: an atmospheric perspective. Geophys. Res. Lett. 35, L20815. doi:10.1029/2008gl035867
Xu, X. L., Liu, J. Y., Shao, Q. Q., and Fan, J. W. (2008b). The dynamic changes of ecosystem spatial pattern and structure in the Three-River Headwaters region in Qinghai Province during recent 30 years. Geogr. Res. 27, 829–839. doi:10.11821/yj2008040011
Xu, M., Ye, B., Zhao, Q., Zhang, S., and Wang, J. (2013). Estimation of water balance in the source region of the Yellow River based on GRACE satellite data. J. Arid Land. 5, 384–395. doi:10.1007/s40333-013-0169-8
Yang, K., Wu, H., Qin, J., Lin, C., Tang, W., and Chen, Y. (2014). Recent climate changes over the Tibetan Plateau and their impacts on energy and water cycle: a review. Global Planet. Change. 112, 79–91. doi:10.1016/j.gloplacha.2013.12.001
Yin, Y., Wu, S., and Dai, E. (2010). Determining factors in potential evapotranspiration changes over China in the period 1971–2008. Chin. Sci. Bull. 55, 3329–3337. doi:10.1007/s11434-010-3289-y
Yue, S., and Wang, C. (2004). The Mann-Kendall test modified by effective sample size to detect trend in serially correlated hydrological series. Water Resources Manage. 18, 201–218. doi:10.1023/b:warm.0000043140.61082.60
Zarch, M. A. A., Sivakumar, B., and Sharma, A. (2015). Droughts in a warming climate: a global assessment of Standardized precipitation index (SPI) and Reconnaissance drought index (RDI). J. Hydrol. 526, 183–195. doi:10.1016/j.jhydrol.2014.09.071
Zhang, J., Yao, F., Zheng, L., and Yang, L. (2007a). Evaluation of grassland dynamics in the Northern-Tibet Plateau of China using remote sensing and climate data. Sensors 7, 3312–3328. doi:10.3390/s7123312
Zhang, S., Hua, D., Meng, X., and Zhang, Y. (2011). Climate change and its driving effect on the runoff in the “Three-River Headwaters” region. J. Geogr. Sci. 21, 963. doi:10.1007/s11442-011-0893-y
Zhang, X., Ren, Y., Yin, Z. Y., Lin, Z., and Zheng, D. (2009). Spatial and temporal variation patterns of reference evapotranspiration across the Qinghai‐Tibetan Plateau during 1971–2004. J. Geophys. Res. Atmos. 114, D15105. doi:10.1029/2009jd011753
Zhang, Y., Liu, C., Tang, Y., and Yang, Y. (2007b). Trends in pan evaporation and reference and actual evapotranspiration across the Tibetan Plateau. J. Geophys. Res. Atmos. 112, D12110. doi:10.1029/2006jd008161
Zhao, Y., Zhu, J., Yan, X. U., and Center, N. M. (2014). Establishment and assessment of the grid precipitation datasets in China for recent 50 years. J. Meteorol. Sci. 34, 414–420. doi:10.3969/2013jms.0008
Zhou, B., Li, F., Xiao, H., Hu, A., and Yan, L. (2014). Characteristics and climate explanation of spatial distribution and temporal variation of potential evapotranspiration in Headwaters of the Three Rivers. J. Nat. Resour. 29, 2068–2077. (in Chinese). doi:10.11849/zrzyxb.2014.12.008
Keywords: Three-River Headwaters, global land surface data assimilation system, potential evapotranspiration, aridity index K, precipitation, Penman-Monteith method
Citation: Wen X, Pan W, Sun X, Li M, Luo S, Cao B, Zhang S, Wang C, Zhang Z, Meng L, Ruan Y and Xie B (2020) Study on the Variation Trend of Potential Evapotranspiration in the Three-River Headwaters Region in China Over the Past 20 years. Front. Earth Sci. 8:582742. doi: 10.3389/feart.2020.582742
Received: 13 July 2020; Accepted: 14 September 2020;
Published: 05 October 2020.
Edited by:
Zhiwei Zhu, Nanjing University of Information Science and Technology, ChinaReviewed by:
Xianjie Cao, Lanzhou University, ChinaXian Zhu, Sun Yat-sen University, China
Bo Huang, Norwegian University of Science and Technology, Norway
Copyright © 2020 Wen, Pan, Li, Luo, Wang, Zhang, Meng, Ruan and Xie. This is an open-access article distributed under the terms of the Creative Commons Attribution License (CC BY). The use, distribution or reproduction in other forums is permitted, provided the original author(s) and the copyright owner(s) are credited and that the original publication in this journal is cited, in accordance with accepted academic practice. No use, distribution or reproduction is permitted which does not comply with these terms.
*Correspondence: Xiaohang Wen, d2VuemVyZ0AxMjYuY29t