 Baptiste Vandecrux
 William Colgan
 Anne M. Solgaard1
 Nanna B. Karlsson
- 1Department of Glaciology and Climate, Geological Survey of Denmark and Greenland, Copenhagen, Denmark
- 2Physics of Ice, Climate and Earth, Niels Bohr Institute, University of Copenhagen, Copenhagen, Denmark
Camp Century is an American military base built in 1959 under the surface of the Greenland ice sheet and decommissioned in 1967. Here, we use outputs from RACMO2.3p2 and CanESM2 climate models, adjusted to meteorological observations, and a firn model to simulate the firn density and temperature at Camp Century between 1966 and 2100. The model output is evaluated against an extensive set of firn 3observations and three Representative Concentration Pathways (RCP2.6, 4.5 and 8.5) are considered as future scenarios. Our model suggests that the upper horizon of the Camp Century debris field – observed at a depth of 32 m in 2017 – will continue to be buried by persistent net accumulation over the next eighty years under all RCP scenarios. This horizon depth will be between 58 and 64 m in 2100, depending on the RCP scenario. We estimate a maximum meltwater percolation depth of 1.1 m under all RCP scenarios. We therefore find it extremely unlikely that surface meltwater interacts with the subsurface debris field at Camp Century before 2100 under all RCP scenarios. Camp Century’s future is representative of the firn area in northwestern Greenland, bound to shift from dry snow to a percolation regime. Our model suggests that 10 m firn temperatures at Camp Century will increase from −24.0°C in 1966 to −21.3, −20.0 and −18.6°C in 2100 under the RCP2.6, 4.5 and 8.5 scenarios, respectively. We reveal a previously unknown warm bias in air temperatures simulated at Camp Century by both RACMO2.3p2 and CanESM2 climate models which needs to be accounted for when using these models to predict melt, firn evolution and sea-level contribution of the Greenland ice sheet. We also present novel in situ measurements of firn compaction rates, which indicate that about 25% of firn compaction of the top 62 m of firn occurs below 20 m depth. This highlights the importance of deep-firn compaction measurements for model evaluation and correction of altimetry products.
1 Introduction
Camp Century is located in the northwest corner of Greenland’s high-elevation firn plateau, at an elevation of 1886 m, approximately 200 km east of Thule Air base (Figure 1). Camp Century was constructed in 1959 by the United States Army Corps of Engineers as a cut-and-cover trench network within the relatively soft and porous firn (Clark, 1965; Mellor, 1969). The base operated year-round until 1964, and then seasonally for an additional three summers, before being permanently abandoned with minimal decommissioning in 1967. Persistent snowfall has now buried the base entirely, leaving nothing visible at the ice-sheet surface. Under the downward advection associated with each year’s snow accumulation, the tunnel network has descended through the firn. An ice-penetrating radar survey of Camp Century showed that from an initial depth of 8 m in 1959 the tunnel network was between 45 m and 55 m depth in 2017 (Karlsson et al., 2019). The data suggest that 95% of the subsurface debris field is now located at depths greater than 32 m. This subsurface debris field is approximately circular with a radius of less than 1 km.
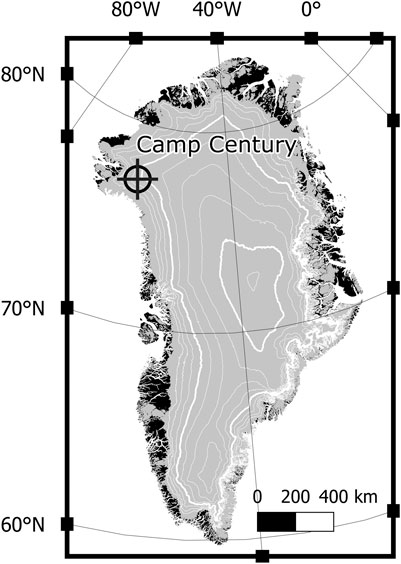
FIGURE 1. Location of Camp Century. Ice sheet is represented by the gray area, 1000 m elevation contours by thick white lines and 250 m contours by thin white lines.
Camp Century represents a crucial site for two reasons. First of all, surface mass balance at the site has been projected to shift from net accumulation to net ablation by 2100 under a high-end greenhouse gas emission scenario (Fettweis et al., 2013; Colgan et al., 2016). Consequently, the Government of Greenland raised concerns regarding the potential remobilization of contaminants at Camp Century via meltwater percolation. As a response, the Government of Denmark established the Camp Century Climate Monitoring Program in 2017, led by the Geological Survey of Denmark and Greenland (GEUS), with a goal “to regularly update annual likelihoods of meltwater interacting with abandoned materials at the Camp Century site over the next century” (Colgan et al., 2017). Secondly, Camp Century is located in the accumulation area of the Greenland ice sheet where surface melt has recently increased in frequency and magnitude due to anthropogenic climate change (van den Broeke et al., 2016; Fettweis et al., 2017). In these regions, the firn can refreeze and retain the meltwater generated at the surface each summer and buffer the ice sheet’s mass loss and sea-level contribution (Benson, 1962; Pfeffer et al., 1991, Harper et al., 2012). The Greenland firn responds to increased meltwater through either a deeper percolation and refreezing of meltwater (Humphrey et al., 2012), the formation of impermeable near-surface ice layers, with subsequent increased local meltwater runoff (de la Peña et al., 2015; Machguth et al., 2010; MacFerrin et al., 2019), or, in the case where the excess meltwater neither refreezes or runs off, the development of perennial firn aquifers where meltwater remains liquid (Forster et al., 2014; Miège et al., 2016). Due to a long history of meteorological and glaciological observations, Camp Century represents a reference site to document the past, current and future evolution of the firn layer in northwestern Greenland. This study therefore aims at describing the evolution of the firn at Camp Century from 1966 to 2100.
For this purpose, three domains need to be described: 1) the near-surface atmosphere, that can be characterized by standard meteorological variables; 2) the snow surface where energy and mass exchanges take place; and 3) the firn itself. All three domains interact and adapt to each other continuously. The near-surface atmospheric conditions can be monitored by Automatic Weather Stations (AWS) or simulated by climate models. While AWSs give the best estimation of the local weather, they are limited in time, they are subject to frequent malfunctions, and cannot be used for future climate projections. Climate models do not suffer gaps and can be run using scenarios for future climate but are known to deviate from observed weather conditions due to their coarse resolution and inherent simplifications. We consequently adjust four outputs from two climate models to the observations from two AWSs enabling us to describe the present and future meteorology at Camp Century. We use two AWSs covering discontinuously the 1996–2019 period: the GITS station from the Greenland Climate Network (GC-Net, Steffen et al., 1996) and CEN station from the Camp Century Climate Monitoring Program (Colgan et al., 2018).
For climate model outputs, we first use, over the 1966–2019 period, the regional climate model RACMO2.3p2 (Noël et al., 2019) forced by re-analyzed climate data, which is based on meteorological observations. These climate data represent our best knowledge of the surface conditions at Camp Century when AWS data are not available. Secondly, the output of an Earth System Model (ESM), CanESM2 (Chylek et al., 2011), is used over the 1966–2100 period. ESMs simulate the entire Earth’s climate evolution and, under certain assumptions about planetary evolution, can estimate future climate. As future scenarios, CanESM2 use the Representative Concentration Pathways (RCPs) employed by the United Nation’s Intergovernmental Panel on Climate Change (IPCC) in their Fifth Assessment Report (van Vuuren et al., 2011; Myhre et al., 2013). We here use the RCP2.6, RCP4.5 and RCP8.5 scenarios. They project a radiative forcing, enhanced by greenhouse effect, rising to +2.6, +4.5 and +8.5 W/m2 by 2100, respectively, and associated global mean temperature changes of +1.5, +2.9 and +4.6°C in 2081–2100 relative to the pre-industrial period (Rogelj et al., 2012). Studies of sea-level budget in each scenario estimated that RCP2.6, 4.5 and 8.5 respectively lead to a global mean sea-level rise of 0.4, 0.47, and 0.63 m by 2100 (Church et al., 2013).
The atmosphere interacts with the firn through mass exchange such as snowfall, sublimation or deposition and through the surface energy budget. The surface energy budget describes all the energy fluxes occurring, through the surface, between the atmosphere and the firn: the radiation received and emitted by the surface, the sensible heat flux due to the temperature difference between the air and the surface, the latent heat flux due to the phase change of water vapor at the surface and lastly the energy transferred from the firn to the surface. Various calculation schemes exist to convert meteorological information into surface energy fluxes (e.g., Box and Steffen, 2001; Radić et al., 2017). We here use the surface energy budget model from van As et al. (2005) as used in Vandecrux et al. (2018), Vandecrux et al. (2020a).
Given the surface mass and energy fluxes, the firn model simulates the evolution of firn density and temperature through time. This is done by discretizing the firn into many vertical layers and solving equations for thermomechanical continuity as mass and energy transfer between these layers. Several different firn models are in use around the world today, differing slightly in their formulations of physical firn processes, or in their numerical methods (see reviews from e.g., Steger et al., 2017 or Vandecrux et al., 2020b). Most of these models include the meltwater infiltration, refreezing and runoff, the diffusion of heat, the release of latent heat during meltwater refreezing, and the densification of snow into ice. We here use the GEUS multi-layer firn model, which was presented and evaluated at various sites in Vandecrux et al. (2018), Vandecrux et al. (2020a), Vandecrux et al. (2020b).
This study therefore evaluates and adjusts four climate model outputs (one deemed most reliable for the historical period and three providing predictions until 2100) to AWS data, calculates for each of them the surface mass and energy budget and uses them as input to a firn model. The firn model outputs for the four forcing datasets is evaluated against a suite of firn measurements and used to describe the recent evolution of the firn from 1966 to 2019. Eventually, the firn model forced by the three future climate predictions is used to describe the potential evolution of the firn to 2100 and assess whether the military waste will interact with meltwater in the next decades.
2 Data and Methods
2.1 Historical Review: Firn and Weather Observations at Camp Century
Unique archives of historical firn density and temperature measurements have been collected at Camp Century. The earliest historical measurements date to a 1952 SPIRE (United States Snow, Permafrost and Ice Research Establishment) traverse expedition with joint reconnaissance and scientific mandates that passed the site where Camp Century would eventually be located (Benson, 1960). While this glaciological traverse was repeated annually until 1955, only the 1954 data is readily available today. This dataset includes measurements of firn density and temperature to depths of 8.8 m at “Station 2–20” (Benson, 1962). The next known survey is from a subsequent 1956 SIPRE polar glaciology course. This expedition also measured firn density and temperature at several sites along the over-snow trail originating at Thule, including “Mile 120”, but the original data is not readily available today (Roch, 1956; Ragle, 1958).
The United States Army Corps of Engineers (USACE) began drilling a deep ice core at Camp Century in 1964. After two unsuccessful attempts, drilling on the ultimate deep core was started in 1964 and finished in 1966 (Ueda and Garfield, 1968). The near-surface density profile of this core record therefore pertains to 1964, while the borehole temperature profile was measured after drilling in 1966. While original ice temperature measurements are available, these measurements were made at 50-m down-borehole depth increments (Weertman, 1968; Gundestrup et al., 1993). This limits the utility of the 1966 ice temperature profile in examining near-surface firn. While Camp Century was active, the USACE conducted intensive research to characterize firn density and temperature-dependent strength (McCoy and Waterhouse, 1960; Mellor, 1969). The vast majority of these engineering studies, however, applied to the disturbed firn of gallery walls and are therefore not useful for this study.
In 1969, a joint USACE-KU (University of Copenhagen) expedition to the recently abandoned Camp Century site measured firn density to a depth of 15.0 m (Kovacs, 1970; Dansgaard et al., 1973). No temperature measurements appear to have been collected on this expedition. KU returned to re-survey the Camp Century borehole three more times, in 1977, 1986 and 1989. In 1977, firn density was measured to a depth of 100.0 m, and firn temperature was measured at 10 m depth (Clausen and Hammer, 1988). In 1986, firn density was measured to a depth of 12.0 m, and the 10 m firn temperature was again measured (Gundestrup et al., 1987). In 1989, the borehole temperature profile was measured from between 70 m and 270 m depth (Gundestrup et al., 1993). The upper depth at which this temperature profile was started (70 m in 1989) was taken as equivalent to the upper depth of the original temperature profile (50 m in 1966). Firn densities from these three KU resurveys (1977, 1986 and 1989) are not readily available at present, as the handwritten logbooks are currently in long-term storage (personal communication, Jørgen Peder Steffensen).
The NASA Program for Arctic Regional Climate Assessment renewed United States glaciological research at Camp Century. In 1995, the University of Colorado established an automatic weather station at “GITS”, 5.2 km SE of Camp Century (Steffen et al., 1996). This automatic weather station logged hourly firn temperature measurements with thermocouples installed to a variety of depths up to 10.0 m (Sampson, 2009). Unfortunately, these instruments only operated from May 1996 to January 1997, April 2001 to June 2002, and March 2006 to April 2007. These measurements are subject to significant noise (Sampson, 2009; Vandecrux et al., 2020a). We remove the most prominent peaks using variance filters as detailed in Vandecrux et al. (2020a). Residual noise (within ±1°C) remains but measurements can nevertheless be used to evaluate the general performance of our firn model. Snow density has been periodically measured in annual snow pits during service visits to the GITS station (1998, 2006, 2008 and 2012). In 1996, the Ohio State University measured two firn density profiles, to depths of 21.8 and 120.5 m, at GITS (Mosely-Thompson et al., 2001). Firn temperature measurements do not appear to be readily available from the expedition. Annual vertical strain over the 0–21 m depth interval was measured by Ohio State University at GITS between June 1995 and May 1996 (Hamilton and Whillans, 2000). These vertical strain rate data, which was used to correct GPS-observed vertical velocity, unfortunately no longer appear readily available.
In 2008, the United States National Science Foundation (NSF), in collaboration with the USACE, initiated a series of overland traverses from Thule as a more cost-effective way of re-supplying Summit Station with fuel and other heavy cargo (Lever et al., 2016). The NSF overland traverse route transits some distance south of Camp Century. NSF overland traverses were undertaken in 2008, 2010, 2011, 2012, 2014 and 2016 (personal communication, Jennifer Mercer). USACE researchers have participated in some of these traverses to undertake opportunistic glaciological observations. Annual snow density was measured at sites “B” and “I”, approximately 6 km south of Camp Century, on the 2011 traverse (Hawley et al., 2014; Wong et al., 2015). No firn temperature measurements are readily available from these traverses. A temperature of −23°C was measured at 9.5 m depth at Camp Century during the 2013 traverse (Polashenski et al., 2014). Firn density was measured to a depth of 10 m on the 2013 traverse, and to 2 m depth on the 2014 traverse (Polashenski et al., 2014), but these data do not appear readily available. In 2010, KU returned to Camp Century and measured firn density to a depth of 35.0 m (Buchardt et al., 2012). No firn temperature measurements were conducted during that expedition.
In 2017, the Geological Survey of Denmark and Greenland (GEUS) installed an AWS at Camp Century (“CEN”), with a similar design as the PROMICE AWS (Ahlstrøm et al., 2008) and that continuously measures a variety of climate variables, including firn temperatures to an installed depth of 10.0 m. This station is supplemented by a deeper thermistor station (“CEN-THM”), which continuously measures firn temperatures to installed depths of 62.0 and 73.0 m (Colgan et al., 2018). These deeper thermistors provide the first complete depth profile of firn temperatures within the uppermost 50 m of firn at Camp Century; above the upper limit of the original and re-surveyed borehole temperature profiles (Weertman, 1968; Gundestrup et al., 1993). GEUS also measured firn density to 73.0 m depth at Camp Century proper, within the debris field of the main tunnel network, as well as to a depth of 63.0 m at site 1.5 km upwind to the Southeast, where the firn density profile was undisturbed (Karlsson et al., 2019).
Finally, GEUS installed vertical strain gauges to measure daily firn compaction over the 0–5 m, 0–20 m and 1.4–62.3 m depth ranges from August 2017 (“CEN-COM”; Colgan et al., 2018). The firn compaction stations are designed after Arthern et al. (2010). Each instrument consists of a line which is, on one end weighted and lowered into a vertical borehole and on the other end connected to a spring-loaded reel equipped with a potentiometer. As the snow and firn surrounding the borehole compact vertically, the borehole shortens, and the line is reeled gradually. This system allows to track the thickness of a firn portion through time. The daily compaction rates are calculated from borehole length change on daily resolution. The borehole remains “open” – or air filled – around the potentiometer wire during these measurements. After approximately 2 years, however, deformational closure of the borehole, and/or exceeding the draw limit of the potentiometer, puts an end to the measurement. Due to the slow change rate of borehole length and the capacity of the datalogger to transmit borehole length at a ∼2 mm resolution, the compaction rates present spikes that are smoothed using a one-week moving window mean.
While we have endeavored to be comprehensive in this compilation of historical firn observations at Camp Century, we invite ongoing correspondence regarding any corrections or omissions, in order to improve the readily available in situ data for subsequent simulations of the firn at Camp Century (Table 1).
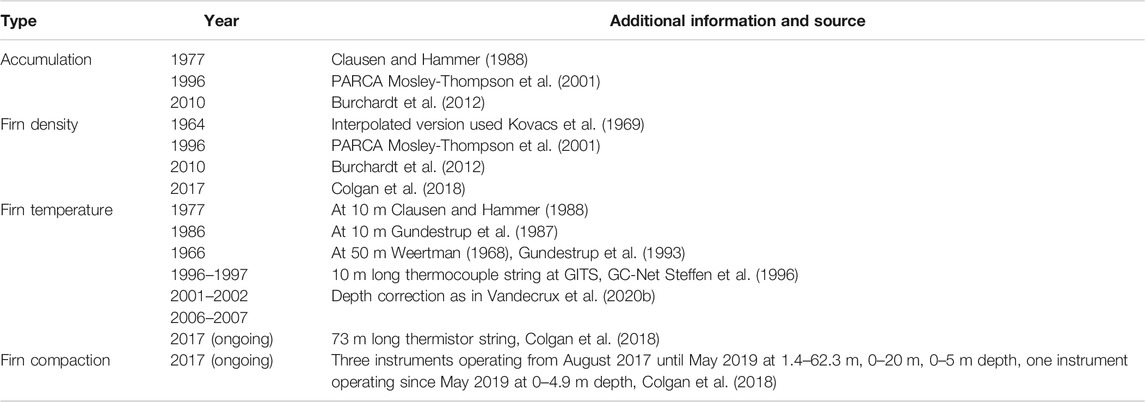
TABLE 1. Overview of the firn measurements at Camp Century used for the evaluation of our firn model.
2.2 Climate Forcing (1966–2100)
To describe the surface climate at Camp Century from 1966 to 2100, we use simulations from the RACMO2.3p2 regional climate model (Noël et al., 2019) and the CanESM2 earth system model (Chylek et al., 2011). The Regional Atmospheric Climate Model (RACMO2.3p2) is a high resolution (5.5 km) model forced by three different reanalysis dataset: ERA-40 over the period 1958–1978 (Uppala et al., 2005), ERA-Interim over 1979–2018 (Dee et al., 2011) and ERA5 during 2019 (Hersbach et al., 2020). The Canadian Earth System Model (CanESM2) combines the CanAM4 atmosphere models, CanOM4 ocean model, CanSIM1 sea-ice model and couples them to terrestrial and ocean carbon models (CTEM1 and CMOC1.2). Here, we use the model output produced for the CMIP5 experiment (Taylor et al., 2012) where atmospheric composition (including CO2 concentration), solar forcing, aerosols and land use are prescribed. Over the 1966–2012 period, the historical CanESM2 output is used while for the 2013–2100 period, three CanESM2 simulations corresponding to RCP2.6, RCP4.5 and RCP8.5 are employed. CanESM2 produces five ensemble members (r1i1p1, r2i1p1, r3i1p1, r4i1p1 and r5i1p1) under each RCP scenario to explore the climatic variability within a given scenario. As our interest is in exploring variability between scenarios, we only use the r1i1p1 member of each scenario. We henceforth refer to both RACMO2.3p2 and CanESM2 as “climate models”.
The temporal resolution of climate model simulations can present challenges. Firn models best simulate melt and meltwater dynamics when using an hourly time step. Daily data from CanESM2 are consequently downscaled into hourly time steps using the following approach. For air temperature, relative humidity and wind speed, daily mean, maximum and minimum values are used to scale a daily sinusoidal function. This sinusoidal function oscillates around the daily mean given by CanESM2 and is prescribed to reach maximum value at 2:30 pm local time for air temperature, and at 4:30 pm local time for relative humidity and wind speed. Conversely, these functions reach their corresponding minima at 2:30 am and 4:30 am, respectively, local time. Illustration of these functions, as well as an assessment of their capacity to reproduce hourly values from daily values are available in Supplementary Figure S1. RACMO2.3p2 data comes at a three-hourly temporal resolution and is linearly interpolated to hourly time steps.
Due to an imperfect representation of reality, climate model simulations differ from in situ observations. We therefore adjust climate model outputs to match in situ observations from the GITS and CEN stations. Both stations monitor on hourly intervals the air temperature, wind speed and humidity above the surface, as well as air pressure, downwelling and upwelling shortwave radiative fluxes. The GITS station monitors air temperature, humidity and wind speed at two heights above the surface. We preferably use the upper level, which is less prone to burial under accumulating snow, unless unavailable. The CEN station measures downwelling and upwelling longwave radiative fluxes unlike the GITS station. The GITS station provides data from 1995 to 2016 while CEN station covers 2017 to 2019. Air temperature, humidity, downward shortwave radiations, air pressure, wind speed and downward longwave radiation from the climate models are adjusted on a monthly basis so that the monthly mean and standard deviation of the adjusted values match the monthly means and standard deviations observed at GITS and CEN. A total of 8 years of observational data are available for air temperature, 9 years for shortwave radiation, 7 years for humidity, wind speed and air pressure, and about 2 years of measurements are available to adjust downward longwave radiation. We acknowledge that these are limited observations for the adjustment of our 54–135 yearlong climate model outputs. Nevertheless, the available weather observations span over a large range of values due to seasonal variations (Figure 2). These variations allow us to evaluate and adjust the climate model outputs for various climatic settings, which are, to a large extent, also representative of past and future climatic conditions at the site. The comparison of the adjusted simulations with observations are given in Figure 2. The comparison of the unadjusted climate model outputs to observations is presented in the Supplementary Figure S2. Different statistics apply for each RCP scenario because CanESM2 outputs differ after 2012.
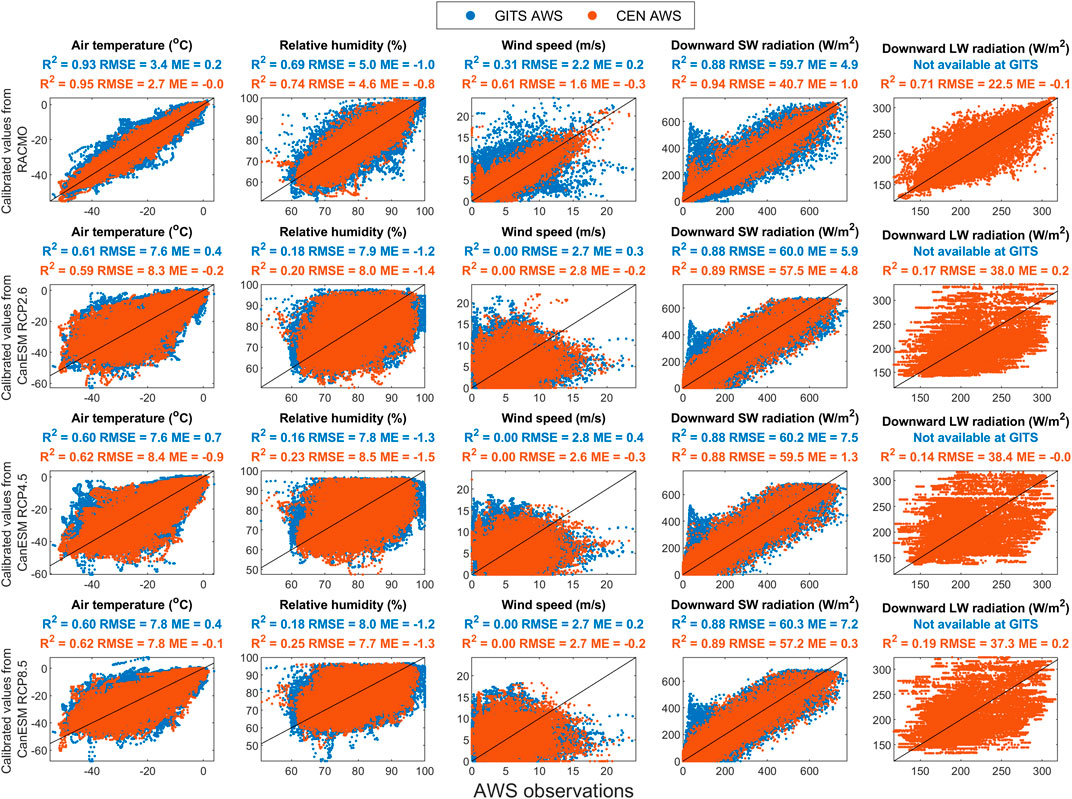
FIGURE 2. Comparison of hourly meteorological fields from adjusted climate models with automatic weather station observations.
For the upward shortwave radiative flux, we need an estimation of the surface albedo that can be extended into the future scenarios. Following previous work using local air temperature as a proxy for surface albedo (van As et al., 2013), we build an air-temperature- and solar-zenith-angle-dependent parameterization of surface albedo,
Snowfall is a critical variable in firn simulations, as the vertical advection of mass within the model domain is ultimately controlled by long-term average snowfall rate. We also adjust the snowfall of climate model simulations to in situ, firn-core-derived accumulation records: two cores covering 1966–1974 (Clausen and Hammer, 1988), two cores describing 1966–1998 (Mosley-Thompson et al., 2001) and one core covering 1966–2006 (Buchardt et al., 2012). To minimize the squared difference from the median of these multiple annual accumulation observations, the hourly snowfall values are increased by 7.7% for RACMO2.3p2 and by 12.8, 10.7 and 11.1% for the RCP2.6, 4.5 and 8.5 CanESM2 simulations, respectively. After the adjustment of air temperatures in the climate models, we reclassify the precipitation phase in each of the four datasets with a liquid-to-solid temperature threshold at 0oC.
2.3 Surface Energy Budget, Mass Balance and Firn Model
For each adjusted climate model dataset, the surface energy budget is calculated for every hourly time step as the sum of the downward and upward shortwave radiation, downward and upward longwave radiation, latent and sensible turbulent heat fluxes, and conductive heat flux through the top layer of snow. For each time step, we find iteratively the surface temperature that satisfies the closure of the surface energy balance. When the sum of energy fluxes is positive and the surface snow is at melting point, the surface temperature remains at 0°C and the excess energy from the surface energy budget is allocated to the melting of snow and ice. Downward shortwave and longwave radiative fluxes are directly taken from the adjusted climate model data. Upward shortwave radiation is calculated using our parametrization for albedo (Section 2.2) and upward longwave radiation is calculated from the surface temperature using the Stefan-Boltzmann law and a surface emissivity of 0.98. The latent and sensible heat fluxes are calculated from air and surface temperatures, humidity and wind speed after van As et al. (2005) as implemented in Vandecrux et al. (2018), Vandecrux et al. (2020a). The sensible and latent heat fluxes calculation is based on the Monin-Obukhov similarity theory and accounts for the boundary layer stratification (stable: Holtslag and Bruin, 1988; unstable: Paulson, 1970; Dyer, 1974) and using the surface roughness length parametrizations of Andreas (1987) and Lefebre et al. (2003). The conductive heat flux is calculated by our firn model.
The GEUS firn model is a multilayer snow and firn model (Langen et al., 2017; Vandecrux et al., 2018; 2020a) where each of the 100 layers is composed of snow, ice and water compartments. During snowfall, new snow is added to the top of the model column with a density of 315 kg m−3 after Fausto et al. (2018). When melting is prescribed at the surface, snow and ice are shifted to the liquid water compartment of the first layer. The meltwater is then able to move vertically according to the parametrization of Darcy’s law developed by Hirashima et al. (2010). If liquid water percolates into a subfreezing layer, the cold content of the layer is used to refreeze the percolating water and the mass of refrozen water is added to the ice compartment of that layer. The model accounts for thermal diffusion using the thermal conductivity and the heat capacity of snow from Yen (1981). Each hourly time step, the firn density is updated for compaction according to the weight of overlying snow and firn (Vionnet et al., 2012). The grain size is also calculated using the formulation from Brun (1989). The snow and firn model is initiated with the observed density profile from 1966. In the absence of an observed temperature profile from 1966, we use the temperature profile from Site 2, surveyed in 1957, located 130 km away from Camp Century but presenting identical average accumulation and temperature as Camp Century (Spencer et al., 2001). The model is used to track the burial of the upper limit of the debris field as detected at 32 m depth in 2017 by Karlsson et al. (2019) as well as to track the maximal meltwater percolation depth each year.
3 Results and Discussion
3.1 Climatology, Surface Energy and Mass Budget
Following the adjustment of climate model outputs, we obtain an overview of both past and future climate at Camp Century over the 1966–2100 period. This adjusted climate forcing, which is used to force the GEUS firn model, are displayed in Figure 3 and their mean, standard deviation and decadal trends over the 1966–2019 and 2020–2100 periods are reported in the Supplementary Table S1. Clear positive trends in air temperature, 0.38–0.54°C decade−1, are simulated by all models for the 1966–2019 period. This warming is predicted to accelerate in the RCP8.5 scenario, to reach a plateau in RCP4.5 and to slow down in RCP2.6, with trends of 0.76, 0.33 and 0.17°C decade−1 over the 2020–2100 period. These trends correspond to increases in mean annual air temperature of 6.0, 2.6 and 1.4°C over the next 80 years. Other positive trends in relative humidity and downward longwave radiative fluxes indicate a warmer, more humid atmosphere at Camp Century in the future. These trends are more pronounced in the RCP8.5 scenario but rarely reach statistical significance (p-value < 0.01) due to high interannual variation (Supplementary Table S1). Wind speed exhibits no statistically significant trends over the whole period. Downward shortwave radiative fluxes are relatively stable over the historical period and decrease slightly during 2020–2100. The temperature-dependent parametrization of surface albedo predicts a perceptible decrease in surface albedo in the CanESM2 RCP8.5 simulation after 2050.
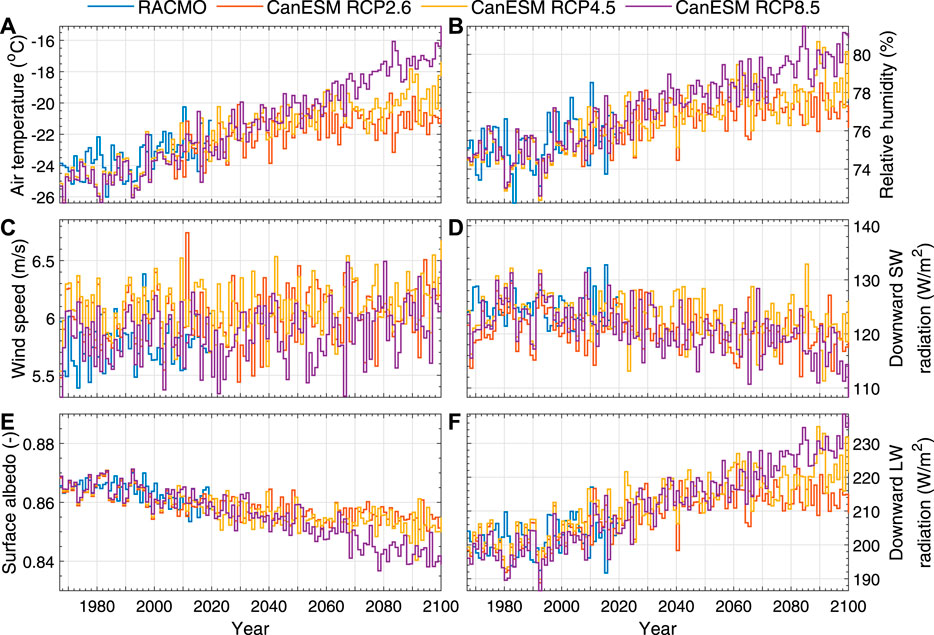
FIGURE 3. Yearly averages of the adjusted climate forcing variables at Camp Century between 1966 and 2100: Air temperature (A), relative humidity (B), wind speed (C), downward shortwave radiation (D), surface albedo (E), downward longwave radiation (F).
We use the adjusted climate variables to calculate the surface energy budget at Camp Century during the 1966–2100 period (Figure 4). For each energy flux, the mean, standard deviation and decadal trend over the 1966–2019 and 2020–2100 periods are reported in the Supplementary Table S1. The sensible heat flux decreases slightly but remains positive in the four model runs over the 1966–2019 period. This decrease of sensible heat flux indicates that in spite of warming temperatures in all scenarios (Figure 3), the temperature gradient between the air and the surface decreased over the entire study period. Indeed, the surface temperature rose by ∼2.5°C between 1966 and 2019 and by another 2–6°C, depending on the scenario, between 2020 and 2100 (Figure 4). The annual average latent heat flux is negative and decreasing for all model outputs indicating an increasing sublimation, also due to increasing surface temperatures (Figure 4). The mean conductive heat flux from the surface to the deeper firn remains stable with lowest mean value in the RCP8.5 scenario. This is due to the simultaneous warming of the surface and underlying firn, which combined, lower the temperature gradients in the near surface firn and reduce heat transfer from the surface to the firn. Rain is absent from the adjusted model runs in the 20th century and appears only in the RCP4.5 and RCP8.5 scenarios after ∼2065. The magnitude of these events and the energy that they bring to the surface remain marginal (Figure 4). The net shortwave radiative flux is the dominant source of energy for the surface. It increases most in the RCP8.5 scenario due to a stronger decline of albedo in that model output. The net longwave radiation is the main energy sink for the snow surface. Its magnitude decreases through the entire study period, indicating that the increasing emitted longwave radiation does not compensate for the increasing incoming longwave radiation. The sum of these fluxes results either in a change of the snow temperature or, in the summer, to snow melt. Melt increases at a rate of 1.7–3.8 mm water equivalent (w.e.) per decade during the historical period. Over the 2020–2100 period, this increase either continues at similar rates in RCP2.6 and RCP4.5 scenarios or even steepens to 10.6 mm w. e. decade −1 in RCP8.5. We note that the adjusted RACMO2.3p2 output captures melt peaks in 2010 and 2012 while the adjusted CanESM2 data do not.
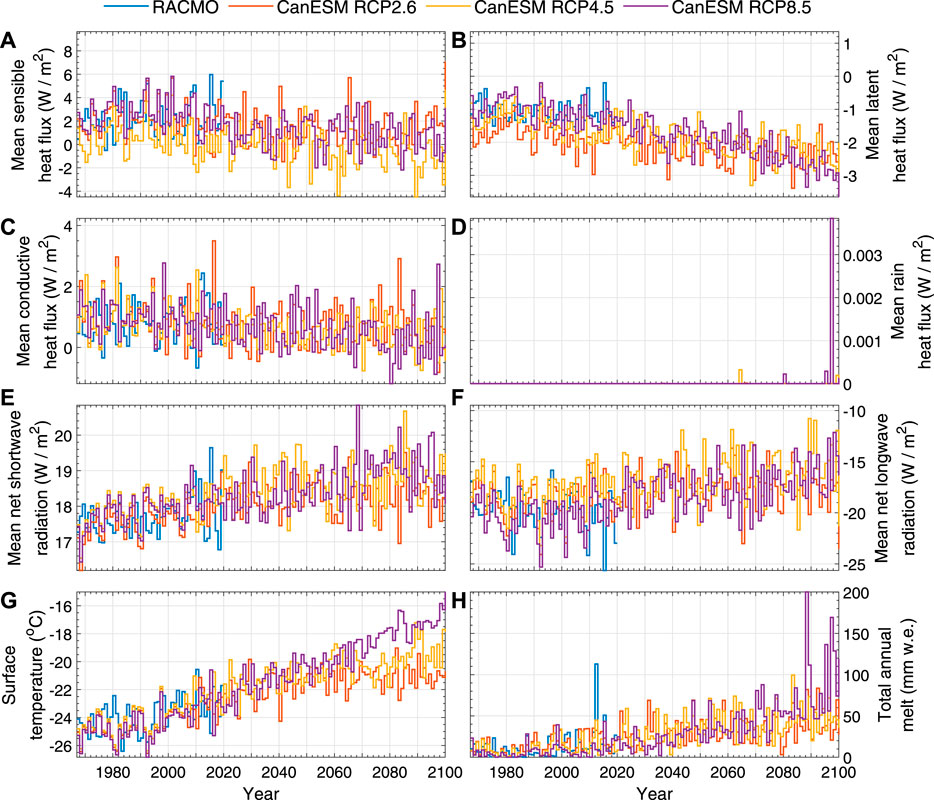
FIGURE 4. Yearly averages of the heat fluxes contributing to the surface energy budget (positive when warming the surface) at Camp Century over the 1966–2100 period: Sensible heat flux (A), latent heat flux (B), conductive heat flux from subsurface (C), rain heat flux (D), net shortwave (E) and longwave (F) radiative fluxes and the resulting surface temperature (G), and total annual meltwater production (H).
The firn model, in combination with any of the four forcing datasets, do not calculate meltwater runoff in either the historical or future period. Consequently, sublimation is the only negative component of the surface mass budget. Following the increase of surface temperature, sublimation is expected to remove increasing amounts of mass from the surface (Figure 5B) and will represent ∼10% of snowfall by the end of the century. Snowfall is relatively stable in all the adjusted model outputs apart from RCP8.5 which shows a slight decrease (Figure 5A). These mass fluxes result in a surface mass balance that does not show any statistically significant trend apart for the RCP8.5 scenario where surface mass balance decreases by 7 mm w. e. decade−1 over the 1966–2100 period.
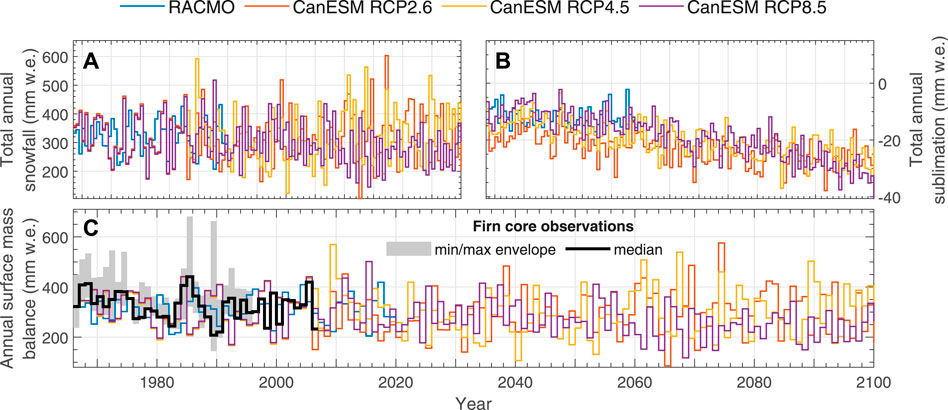
FIGURE 5. Yearly total of the surface mass balance components at Camp Century over the 1966–2100 period: snowfall (A) and net sublimation (B). Note that negative values for sublimation indicate mass removal from the surface. No runoff was calculated. Surface mass balance (C) in the adjusted models and observed of five firn cores.
The last estimation of surface mass balance at Camp Century dates back to Colgan et al. (2016) (Figure 6). Colgan et al. (2016) used MAR regional climate model forced by the same CanESM2 outputs as here, but without adjusting any climate variable other than snowfall for potential biases. Snowfall rates employed by both studies are therefore very similar (Figure 6). In contrast, melt rates presented by Colgan et al. (2016) during the historical period are up to an order of magnitude greater than the melt rates calculated in our study. We attribute this melt-rate discrepancy to the positive mean bias of unadjusted CanESM2 air temperatures at Camp Century: between +3.7°C and +5.1°C depending on the RCP scenario and evaluation AWS (see Supplementary Figure S2). While our present study corrects this air temperatures bias based on observations, this correction was not performed for the MAR-derived melt rates employed by Colgan et al. (2016). Unadjusted CanESM2 air temperatures depict a melt season at Camp Century that is longer, and warmer, than is realistic. Differences in melt rates also explain the sharp contrast in runoff components between the studies: none here, while Colgan et al. (2016) predicted that runoff would exceed annual snowfall by the end of the century (Figure 6). We also note that different runoff parameterizations are used in the two studies, resulting in differing fractional runoffs for a given melt rate.
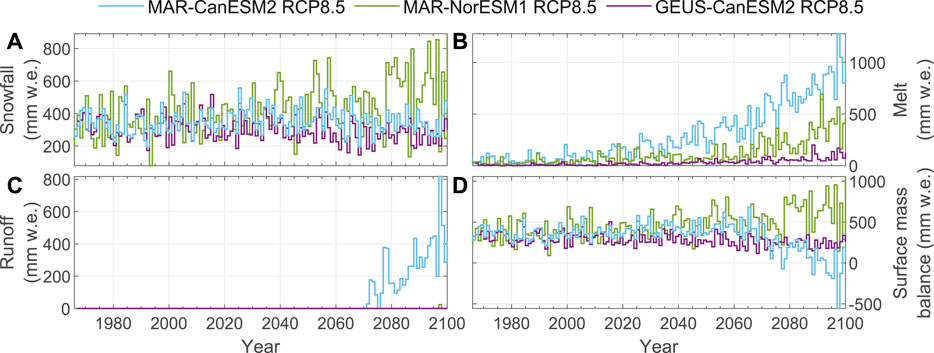
FIGURE 6. Snowfall (A), surface melt (B), runoff (C) and surface mass balance (D) used in Colgan et al. (2016): calculated by MAR when forced by unadjusted CanESM2 (blue lines), or NorESM1 (green line) outputs; and in this study: calculated by the GEUS model forced by adjusted CanESM2.
3.2 Evolution and Evaluation of Firn Temperature
The capacity of the model to simulate the meltwater percolation and the firn density greatly depends on how accurately it can simulate firn temperature (Figure 7). While all models reproduce the warming trend visible in 10 m firn temperature observations, they underestimate punctual measurements by up to 0.5°C. Following the increased air temperature and downward longwave radiation present in the surface forcing dataset, the firn undergoes warming during the 21st century at a rate of 0.2–0.3°C decade−1 over 1966–2019. During 2020–2100, the 10 m firn temperature increases at a rate of 0.2, 0.3, 0.5°C decade−1 and reaches −21.3, −20.0 and −18.6°C by 2100 in the RCP2.6, 4.5 and 8.5 scenarios respectively. The comparison on hourly time steps against GITS and CEN_THM firn temperature observations confirms the cold bias of all models with an average bias of −0.2°C at GITS and up to −0.9°C at CEN_THM. Yet the RMSE is within one degree at CEN_THM, with a R2 above 0.95 while it reaches 2.5°C at GITS, with R2 of about 0.4 for all models, probably due to low signal-to-noize ratio within the GITS dataset. The cold bias is nevertheless less pronounced during summer season.
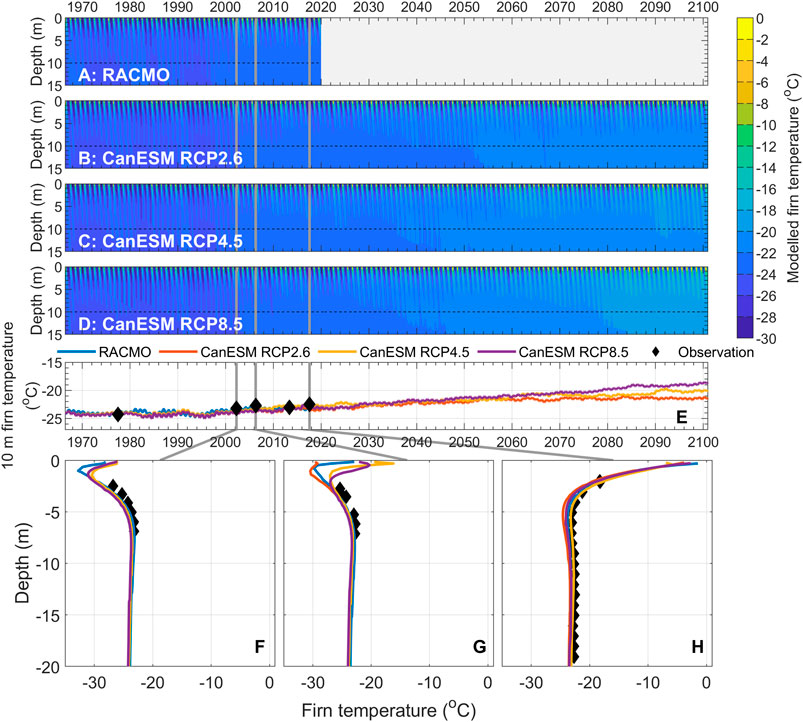
FIGURE 7. (A–D) Simulated firn temperatures. (E) Firn temperature at 10 m depth in the four simulations (colored lines) and measured (black diamonds) in boreholes (1976, 2011) and by thermistor strings (2002, 2006, 2017). (F–H) Punctual comparison of the simulated (colored line) and observed (black diamonds) temperature profile.
3.3 Evolution and Evaluation of Firn Density
In spite of a firn warming at a rate of 0.2–0.3°C decade−1 during the historical period confirmed by punctual firn temperature observations (Figure 7), the firn density has remained relatively stable. Indeed, the observed firn densities in 1966, 1996, 2010 and 2017 all fall within 40 kg m−3 of each other (Supplementary Figure S5). This stability of firn densities indicate that the densification rates are insensitive to changes in firn temperatures for these specific firn conditions. This is captured accurately by the firn model since these punctual observations match simulated firn density profiles down to 30 m depth (Figure 8). Nevertheless, although our simulations match relatively well the observed firn density in 1996, they all underestimate the firn densities below 30 m in 2011 and 2017 (Figures 8F–H). We attribute this discrepancy to the use of the compaction parametrization from Vionnet et al. (2012), that was designed for seasonal snow and may underestimate compaction rates below 30 m. We also note that single firn density profile observations are affected by the spatial heterogeneity of the firn (e.g., Steffensen et al., 1996), which was not evaluated at Camp Century.
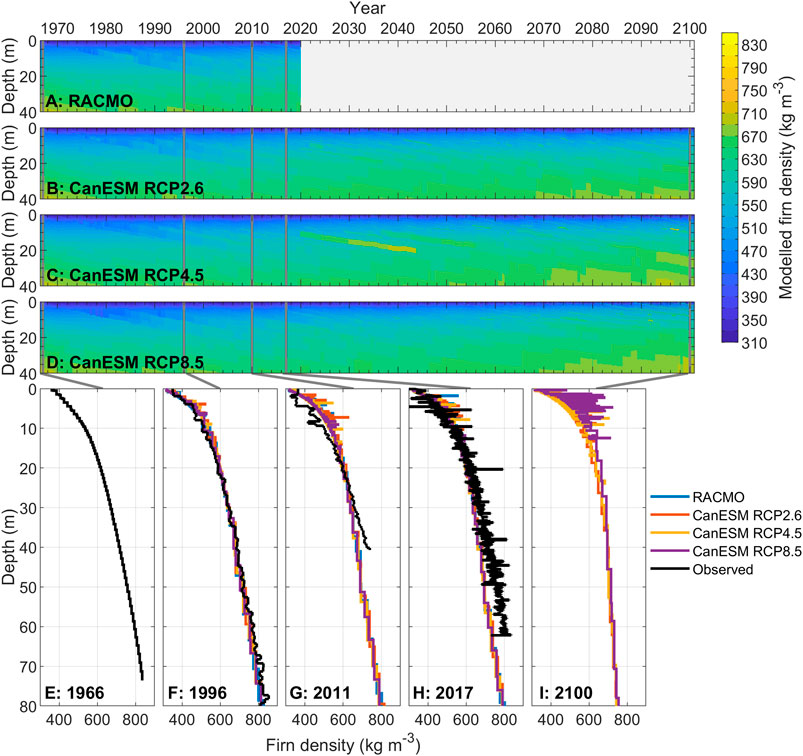
FIGURE 8. (A–D) Simulated density in the top 40 m of firn. (E–I) Punctual comparison of simulated (colored line) and observed (black line) firn density.
3.4 Evaluation of Firn Compaction Rates
Another key process that determines the burial rate of the military waste at Camp Century is the gradual compaction of the firn. A model that overestimates firn compaction rates will underestimate the depth of the debris field. The simulated compaction rates depend on simulated surface accumulation (Figure 5C), firn temperatures and densities (Figures 7, 8) but also on the choice of the compaction formulation (Vionnet et al., 2012). They are evaluated using the CEN-COM instrument, for which the top and bottom depth of the boreholes are also tracked within the firn model (Figure 9). The deepest borehole, spanning over 1.4–62.3 m depth, shortens slower in the simulations compared to the observations (Figure 9A). Consequently the simulated compaction rates are 24–38% lower in the simulations compared to the observation (Figure 9E). When compared to the instruments installed over 0–20 m and 0–5 m depth (Figures 9B,C), models show more differences in performance. The models have mean biases ranging from 2 to 25% at the 0–20 m instruments (Figures 9B,F) and from −30 to 7% for the 0–5 m instrument (Figures 9C,G). Lastly, the models have a mean bias within ±9% when evaluated at the shortest boreholes, installed at 0–4.9 m depth (Figures 9D,H). The larger mean bias at the longest instrument and smaller mean bias at the shortest instrument support the hypothesis that the compaction scheme from Vionnet et al. (2012) is more accurate at describing the near-surface snow and less accurate for deeper firn. Nevertheless, the R2 between simulated and observed compaction rates ranges between 0.65 and 0.93 depending on the instrument-model combination. This confirms that the model captures the seasonal variations of the firn densification for all the instruments. The spread between models and the high temporal variability in the three shorter instruments also reveal the effect of snowfall, which magnitude and timing are different in each simulation.
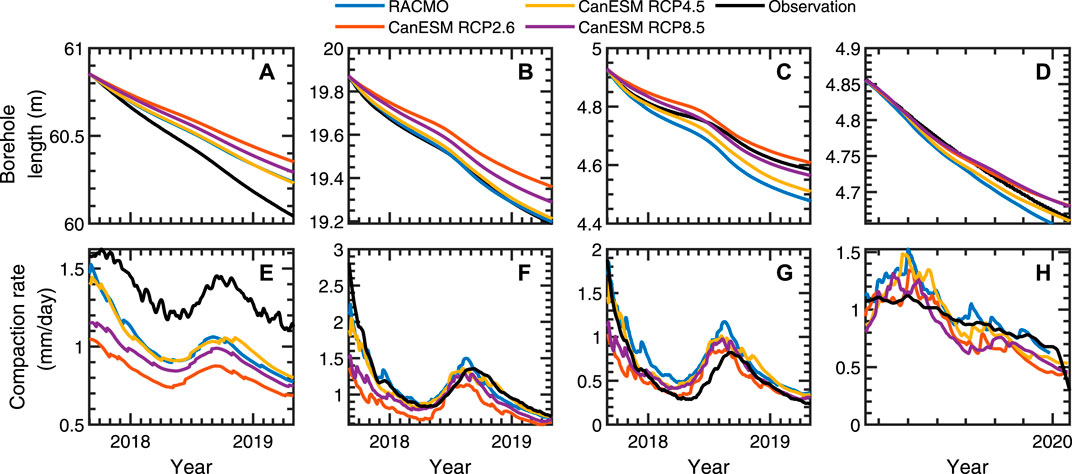
FIGURE 9. (A–D) Observed (black line) and simulated (colored lines) borehole length evolution. (E–H) Observed (black line) and simulated (colored lines) daily firn compaction rate in each borehole.
Beyond the simple evaluation of our model’s capacity to simulate firn compaction and burial rates, our in situ compaction observations highlight that the relevant depth range for in situ monitoring of firn compaction is significantly deeper than typically assumed. Previous studies seeking to measure firn compaction – in order to constrain local mass balance – have only measured firn compaction within the top c. 20 m of the firn column (Hamilton and Whillans, 2000; Burgess and Sharp, 2008). Our in situ measurements show that, at least in 2018, the average compaction rate was 25% higher in the 62.3 m deep borehole (−1.31 mm day−1) than in the 20 m deep borehole (−1.05 mm day−1). This highlights that significant compaction occurs below the typical 20 m monitoring depth. While this is consistent with theory, our firn model simulates the seasonality of compaction rates in the 62.3 m borehole but underestimates their magnitude. This further underlines the value of the deep firn compaction observations for calibrating firn compaction models and assessing local mass balance via in situ or remote sensing approaches. To our knowledge, the CEN_COM instrument is the deepest installation of a compaction instrument to date on the Greenland ice sheet.
3.5 Depth of the 1966 and 2012 Horizons and Meltwater Percolation
Considering the satisfactory performance of the firn model in terms of firn temperature, density and compaction rates we track the 1966 and 2012 summer surfaces in the model outputs as they get buried under new snow accumulating at the surface and compacting with time. The depth of these horizons can be checked in 2017 when a radar campaign located the 1966 summer surface at 32 ± 2 m depth and the 2012 summer surface at 7 ± 0.5 m depth. Simulations tend to underestimate the depth of these horizons: respectively 28 ± 1 m and 4 ± 0.5 m depth. Nevertheless we consider these results encouraging and indicative of the suitability of the surface forcing and firn model set up for the tracking of the horizons in the future.
When tracking the top of the debris layer, observed at 32 m in 2017, over the next decades, the three RCP scenarios are consistent until the 2060s when they start departing from each other (Figure 10A). In comparison to the low and medium emission scenarios (RCP 2.6 and 4.5) the RCP8.5 model run keeps the debris layer closest to the surface and its burial rate slows down but does not revert by the end of the simulation in 2100. The firn model suggests that the debris field upper horizon will continue to be buried by persistent net accumulation over the next eighty years under all RCP scenarios. The RCP2.6 scenario suggests that the debris field upper horizon will be located at 64 m depth in 2100, while the RCP8.5 scenario suggests an analogous depth of 58 m. This persistent burial reflects projections of positive surface mass balance – despite increasing melt – under all RCP scenarios to 2100. This estimate remains of the same order as the one from Colgan et al. (2016) who estimated main trench depth as 67 m in 2090 using unadjusted climate model outputs under RCP8.5 scenario. The maximum simulated depth of meltwater percolation by 2100 is about 1.1 m in RCP8.5 and 0.6 in RCP2.6 and RCP4.5 (Figure 10B). This is almost two orders of magnitude less than the depth of the debris field upper horizon projected in any scenario at that time. We therefore find extremely unlikely that meltwater would interact with the subsurface debris field at Camp Century before 2100 under all RCP scenarios.
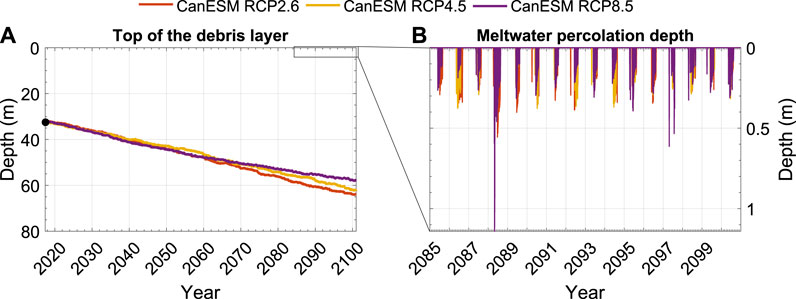
FIGURE 10. (A) Simulated depth of the top of the debris layer, from its detection in 2017–2100. (B) Simulated meltwater percolation depth during 2080–2100. Note different vertical scales.
This conclusion is dependent on assumptions embedded in the parameterization of physical processes within the GEUS firn model, as well as assumptions in prescribed climate forcing. For instance, the GEUS firn model parameterizes the vertical percolation of meltwater with a Darcy flow formulation. The firn meltwater Retention Model InterComparison Project (RetMIP) suggests that other parameterizations (e.g., bucket schemes or models including heterogenous percolation) can result into meltwater percolation as much as five time deeper than the GEUS firn model under the same climate forcing (Vandecrux et al., 2020b). Yet a five-fold increase in meltwater infiltration depth would still be insufficient to bring meltwater at the depth of the debris field. The impact of the choice of forcing is visible when comparing our results with the ones from Colgan et al. (2016). Indeed their unadjusted CanESM2 forcing predicted net ablation, and therefore upward movement of the debris field by the end of the century. Additionally, we note that although the adjusted CanESM2 and RACMO2.3p2 forcing datasets presented similar melt rates over the historical period, the percolation depth in the RACMO2.3p2-forced model output reaches 0.9 m in 2012, twice as much as the maximum depth of simulated by CanESM2-driven models that same year. We hypothesize that the RACMO2.3p2 output (available at three-hourly values) is able to capture more intense melt rates, and therefore meltwater percolation events, than the daily CanESM2 output, even after our temporal downscaling. Nevertheless, we consider this difference between models insufficient to influence the possibility of meltwater interaction with the debris field before the end of the century.
4 Summary Remarks
This study explores past and future evolution of the firn at Camp Century in order to assess the possibility of meltwater interacting with the subsurface debris field. We employ the GEUS firn model to simulate firn density and temperature within the uppermost 80 m of firn over the 1966 to 2100 period. The model is forced by regional and global climate model simulations that were adjusted to automatic weather station data and to net accumulation reconstructed from five firn cores. Under this prescribed climate forcing, the GEUS firn model reproduces, within acceptable uncertainty and biases, a variety of in situ observations: firn density measured in three firn cores, firn temperature measured at depths ranging from 0 to 73 m, firn compaction rate measured over multiple depth ranges, and depth of the 1966 horizon as observed in 2017. This robust evaluation of firn model performance during the historical period (1966–2019) lends confidence to the firn model output during the future period (2020–2100).
The firn model suggests that firn temperatures will continue to warm at Camp Century under the full range of IPCC Representative Concentration Pathways (RCPs). Under the RCP2.6 scenario (respectively RCP8.5), the firn at 10 m depth will warm from −24.0°C in 1966 to −21.3°C (resp. −18.6°C) in 2100. Under these scenarios, Camp Century will transition from a dry snow zone, where negligible melting occurs, to a percolation zone, where melt occurs and refreezes within the annual snowpack. This will be accompanied by the emergence of discrete annual ice layers within the firn. As a result of persistent positive mass balance, the debris field is predicted to be below 58 m of firn and still being further buried at the end of the century in all RCP scenarios. In combination with the absence of meltwater percolation below 1.1 m in all simulations, it is therefore extremely unlikely that meltwater interacts with military waste within this century.
While the groundbreaking glaciology and climatology research undertaken at Camp Century in the 1960s provides an almost unparalleled scientific heritage amongst Greenland ice sheet research sites, the military history of Camp Century now gives the site unanticipated social significance in light of climate change. Our study represents the first assessment from the Camp Century Climate Monitoring Program on the possibility of meltwater interacting with the subsurface debris field at Camp Century over the next eighty years.
Data Availability Statement
The following datasets are available for download:
– adjusted weather data and firn model output: https://doi.org/10.22008/FK2/QDND53 (Vandecrux, 2021a),
– surface energy budget model and GEUS firn model code: https://doi.org/10.5281/zenodo.4542767 (Vandecrux, 2021b),
– firn compaction measurements (CEN-COM): https://doi.org/10.22008/FK2/CQSKLK (Vandecrux, 2021c),
– firn density measurements: https://doi.org/10.22008/FK2/UFGONU (Colgan, 2021),
– firn temperature measurements (CEN-THM): https://doi.org/10.22008/FK2/SR3O4F (Vandecrux, 2021d),
– automatic weather station data from CEN: https://doi.org/10.22008/promice/data/aws (Fausto and van As, 2019),
– automatic weather station data from GITS: http://cires1.colorado.edu/steffen/gcnet/.
– The CanESM2 data is available at https://climate-modelling.canada.ca/climatemodeldata/cgcm4/CanESM2/index.shtml and the RACMO2.3p2 is available upon request to Brice Noël: Yi5wLnkubm9lbEB1dS5ubC4=
Author Contributions
BV prepared the forcing data, ran the surface energy balance and firn model, conducted the analysis. WC designed the study, secured funding, organized fieldwork and gathered the historical data at Camp Century with the support of JS. AS participated to field data collection and NK mapped the present extent of the camp debris. All authored discussed and contributed to the manuscript.
Funding
The Camp Century Climate Monitoring Program is jointly funded by the Geological Survey of Denmark and Greenland (GEUS) and the Danish Cooperation for Environment in the Arctic (DANCEA) within the Danish Ministry for Climate, Energy and Utilities. Support during fieldwork was also received from the Greenlandic Ministry of Independence, Foreign Affairs and Agriculture.
Conflict of Interest
The authors declare that the research was conducted in the absence of any commercial or financial relationships that could be construed as a potential conflict of interest.
Acknowledgments
We thank Karina Hansen for her efforts in digitizing part of the debris field layer. We warmly thank Allan Ø. Pedersen, Signe B. Andersen, Robert S. Fausto and Mike Jayred for assistance installing and maintaining ice-sheet instrumentation at Camp Century. We also warmly thank Danish Liaison Officers Kim Marchuard Mikkelsen and Jens Alsing for logistical assistance at Thule Air base for fieldwork. We thank our scientific editor Alun Hubbard for his support and three reviewers for their constructive comments on the manuscript.
Supplementary Material
The Supplementary Material for this article can be found online at: https://www.frontiersin.org/articles/10.3389/feart.2021.578978/full#supplementary-material.
References
Ahlstrøm, A. P., Gravesen, P., Andersen, S. B., van As, D., Citterio, M., Fausto, R. S., et al. (2008). A new programme for monitoring the mass loss of the Greenland ice sheet. Geol. Surv. Denmark Greenl. Bull. (15), 61–64. [online] Available from: http://www.geus.dk/DK/publications/geol-survey-dk-gl-bull/15/Documents/nr15_p61-64.pdf.
Andreas, E. L. (1987). A theory for the scalar roughness and the scalar transfer coefficients over snow and sea ice. Boundary-layer Meteorol. 38, 159. doi:10.1007/BF00121562
Arthern, R. J., Vaughan, D. G., Rankin, A. M., Mulvaney, R., and Thomas, E. R. (2010). In situ measurements of Antarctic snow compaction compared with predictions of models. J. Geophys. Res. 115, F03011. doi:10.1029/2009JF001306
Benson, C. (1960). Physical investigations of the snow and firn of northwest Greenland 1952, 1953 and 1954. U.S. Snow Ice and Permafrost Research Establishment. Res. Rep. 26, 62.
Benson, C. (1962). Stratigraphic studies in the snow and firn of the Greenland ice sheet. U.S. Snow Ice and Permafrost research establishment. Res. Rep. 70, 32.
Box, J. E., and Steffen, K. (2001). Sublimation on the Greenland Ice Sheet from automated weather station observations. J. Geophys. Res. 106(D24), 33965–33981. doi:10.1029/2001JD900219
Box, J. E., van As, D., and Steffen, K.PROMICE project team (2017). Greenland, Canadian and Icelandic land-ice albedo grids (2000-2016). GEUS Bull. 38, 53–56. Retrieved from http://www.geus.dk/DK/publications/geol-survey-dk-gl-bull/38/Sider/default.aspx. doi:10.34194/geusb.v38.4414
Brun, E. (1989). Investigation on wet-snow metamorphism in respect of liquid-water content. Ann. Glaciol.
Buchardt, S. L., Clausen, H. B., Vinther, B. M., and Dahl-Jensen, D. (2012). Investigating the past and recent δ18O-accumulation relationship seen in Greenland ice cores. Clim. Past 8, 2053–2059. doi:10.5194/cp-8-2053-2012
Burgess, D., and Sharp, M. J. (2008). Recent changes in thickness of the Devon Island ice cap, Canada. J. Geophys. Res. 113, B07204. doi:10.1029/2007JB005238
Church, J. A., Clark, P. U, Cazenave, A, Gregory, J, Milne, G. A., Merrifield, A. M., et al. (2013). “sea level change climate change 2013: the physical science basis,” in Contribution of working group I to the Fifth assessment Report of the intergovernmental Panel on climate change. Editors T. F. Stocker, D. Qin, G.-K. Plattner, M. Tignor, S. K. Allen, J. Boschunget al. (Cambridge: Cambridge University Press).
Chylek, P., Li, J., Dubey, M. K., Wang, M., and Lesins, G. (2011). Observed and model simulated 20th century arctic temperature variability: Canadian earth system model CanESM2. Atmos. Chem. Phys. Discuss. 11, 22893–22907. doi:10.5194/acpd-11-22893-2011
Clark, E. (1965). Camp Century evolution of concept and history of design construction and performance. U.S. Cold Regions Research and Engineering Laboratory. Technical Report 174. 68 pages.
Clausen, H., and Hammer, C. (1988). The laki and tambora eruptions as revealed in Greenland ice cores from 11 locations. J. Glaciology 10, 16–22. doi:10.1017/s0260305500004092
Colgan, W. (2021). Camp Century: Firn density measurements in cores B73 and B62, Available at: https://doi.org/10.22008/FK2/UFGONU, GEUS Dataverse, V1.
Colgan, W., Andersen, S. B., van As, D., Box, J. E., and Gregersen, S. (2017). New programme for climate monitoring at Camp Century, Greenland. Geol. Surv. Denmark Greenland Bull. 2017, 57–60. doi:10.34194/geusb.v38.4415
Colgan, W., Machguth, H., MacFerrin, M., Colgan, J., van As, D., and MacGregor, J. (2016). The abandoned ice sheet base at Camp Century, Greenland, in a warming climate. Geophys. Res. Lett. 43, 8091–8096. doi:10.1002/2016gl069688
Colgan, W., Pedersen, A., Binder, D., Machguth, H., Abermann, J., and Jayred, M. (2018). Initial field activities of the camp century climate monitoring programme in Greenland. Geol. Surv. of Denmark Greenland Bull. 41, 75–78. doi:10.34194/geusb.v41.4347
Dansgaard, W., Johnsen, S., Clausen, H., and Gundestrup, N. (1973). Stable isotope glaciology. Meddelelser om Grønland 197 (2).
de la Peña, S., Howat, I., Nienow, P., Van den Broeke, M., Mosley-Thompson, E., Price, S., et al. (2015). Changes in the firn structure of the western Greenland Ice Sheet caused by recent warming. Cryosphere 9, 1203–1211. doi:10.5194/tc-9-1203-2015
Dee, D. P., Uppala, S. M., Simmons, A. J., Berrisford, P., Poli, P., Kobayashi, S., et al. (2011). TheERA-Interim reanalysis: configuration and performance of the data assimilation system. Q. J. Roy. Meteorol. Soc. 137, 553–597. doi:10.1002/qj.828
Dyer, A. J. (1974). A review of flux-profile relationships. Boundary-layer Meteorol. 7, 363–372. doi:10.1007/bf00240838
Fausto, R. S., Box, E. J., Vandecrux, B. R. M., van As, D., Steffen, K., et al. (2018). A snow density dataset for improving surface boundary conditions in Greenland ice sheet firn modeling. Front. in Earth Sci. 6, 51. doi:10.3389/feart.2018.00051
Fausto, R. S., and van As, D. (2019). Programme for monitoring of the Greenland ice sheet (PROMICE): Automatic weather station data. Version: v03, Dataset published via Geological Survey of Denmark and Greenland. doi:10.22008/promice/data/aws
Fettweis, X., Box, J., Agosta, C., Amory, C., Kittel, C., Lang, C., et al. (2017). Reconstructions of the 1900–2015 Greenland ice sheet surface mass balance using the regional climate MAR model. Cryosphere 11, 1015–1033. doi:10.5194/tc-11-1015-2017
Fettweis, X., Franco, B., Tedesco, M., van Angelen, J., Lenaerts, J., van den Broeke, M., et al. (2013). Estimating the Greenland ice sheet surface mass balance contribution to future sea level rise using the regional atmospheric climate model. MAR. Cryosphere. 7, 469–489. doi:10.5194/tc-7-469-2013
Forster, R. R., Box, J. E., Van Den Broeke, M. R., Miège, C., Burgess, E. W., Van Angelen, J. H., et al. (2014). Extensive liquid meltwater storage in firn within the Greenland ice sheet. Nat. Geosci. 7 (2), 95–98. doi:10.1038/ngeo2043
Gundestrup, N., Clausen, H., Hansen, B., and Rand, J. (1987). Camp century survey 1986. Cold Regions Sci. Technology 14, 281–288. doi:10.1016/0165-232x(87)90020-6
Gundestrup, N., Dahl-Jensen, D., Hansen, B., and Kelty, J. (1993). Bore-hole survey at camp century, 1989. Cold Regions Sci. Technology 21, 187–193. doi:10.1016/0165-232x(93)90006-t
Hamilton, G., and Whillans, I. (2000). Point measurements of mass balance of the Greenland Ice Sheet using precision vertical Global Positioning System (GPS) surveys. J. Geophys. Res. 105 (16), 295–316. doi:10.1029/2000jb900102
Harper, J., Humphrey, N., Pfeffer, W., et al. (2012). Greenland ice-sheet contribution to sea-level rise buffered by meltwater storage in firn. Nature 491, 240–243. doi:10.1038/nature11566
Hawley, R., Courville, Z., Kehrl, L., Lutz, E., Osterberg, E., Overly, T., et al. (2014). Recent accumulation variability in northwest Greenland from ground-penetrating radar and shallow cores along the Greenland Inland Traverse. J. Glaciology 60, 375–382. doi:10.3189/2014jog13j141
Hersbach, H., Bell, B., Berrisford, P., et al. (2020). The ERA5 global reanalysis. Q. J. R. Meteorol. Soc. 146, 1999–2049. doi:10.1002/qj.3803
Hirashima, H., Yamaguchi, S., Sato, A., and Lehning, M. (2010). Numerical modeling of liquid water movement through layered snow based on new measurements of the water retention curve. Cold Reg. Sci. Technol. 64, 94–103. doi:10.1016/j.coldregions.2010.09.003
Holtslag, A. A. M., and De Bruin, H. A. R. (1988). Applied modelling of the night-time surface energy balance over land. J. Appl. Meteorol. 27, 689–704. doi:10.1175/1520-0450(1988)027<0689:amotns>2.0.co;2
Humphrey, N., Harper, J., and Pfeffer, W. (2012). Thermal tracking of meltwater retention in Greenland’s accumulation area. J. Geophys. Res. 117, F01010. doi:10.1029/2011jf002083
Karlsson, N., Colgan, W., Binder, D., Machguth, H., Abermann, J., Hansen, K., et al. (2019). Ice-penetrating radar survey of the subsurface debris field at Camp Century, Greenland. Cold Regions Sci. and Technology 165, 102788. doi:10.1016/j.coldregions.2019.102788
Kovacs, A. (1970). Camp century a pictorial overview June 1969. U.S. Cold Regions Research and Engineering Laboratory, 48. Special Report 150.
Kovacs, A., Weeks, W., and Michitti, F. (1969). Variation of some mechanical properties of polar snow, Camp Century, Greenland, U.S. Cold Regions Research and Engineering Laboratory. Research Report276. 35.
Langen, P., Fausto, R., Vandecrux, B., Mottram, R., and Box, J. (2017). Liquid water flow and retention on the Greenland ice sheet in the regional climate model HIRHAM5: local and large-scale impacts. Front. in Earth Sci. 4, 110. doi:10.3389/feart.2016.00110
Lefebre, F., Hubert, G., Jean-Pascal, V, Y., and Wouter, G. (2003). Modeling of snow and ice melt at ETH Camp (West Greenland): a study of surface albedo. J. Geophys. Res. 108 (D8), 4231. doi:10.1029/2001JD001160
Lever, J., Phillips, G., and Burnside, J. (2016). Economic analysis of the Greenland inland traverse (GrIT). US army U.S. Engineer Research and development center. Special report. ERDC/CRREL. SR-16-2. 52 pages.
MacFerrin, M., Machguth, H., As, D., Charalampidis, C., Stevens, C., Heilig, A., et al. (2019). Rapid expansion of Greenland's low-permeability ice slabs. Nature 573, 403–407. doi:10.1038/s41586-019-1550-3
Machguth, H., MacFerrin, M., van As, D., Box, J., Charalampidis, C., Colgan, W., et al. (2010). Greenland meltwater storage in firn limited by near-surface ice formation. Nat. Clim. Change 6, 390–393.
McCoy, J., and Waterhouse, R. (1960). Effects of a shockwave on a peter snow arch. U.S. Snow Ice and Permafrost research establishment. Spec. Rep. 39, 8.
Mellor, M. (1969). Foundations and subsurface structures in snow. U.S. Cold Regions Science and Engineering Laboratory. Monograph III-A2c. 54 pages.
Miège, C., Forster, R. R., Brucker, L., Koenig, L. S., Solomon, D. K., Paden, J. D., et al. (2016). Spatial extent and temporal variability of Greenland firn aquifers detected by ground and airborne radars. J. of Geophys. Res. Earth Surf. 121 (12), 2381–2398. doi:10.1002/2016jf003869
Mosley-Thompson, E., McConnell, J., Bales, R., Li, Z., Lin, P., Steffen, K., et al. (2001). Local to regional-scale variability of annual net accumulation on the Greenland ice sheet from PARCA cores. J. of Geophys. Res. 106 (33), 839–933. doi:10.1029/2001jd900067
Myhre, G., Shindell, D., Bréon, F., Collins, W., Fuglestvedt, J., Huang, J., et al. (2013). “Anthropogenic and natural radiative forcing,” in Climate change 2013: the physical science basis. Contribution of working group I to the Fifth assessment report of the intergovernmental Panel on climate change (Cambridge University Press).
Noël, B., van de Berg, W. J., Lhermitte, S., and van den Broeke, M. R. (2019). Rapid ablation zone expansion amplifies north Greenland mass loss. Sci. Adv. 5 (9), eaaw0123. doi:10.1126/sciadv.aaw0123
Paulson, C. A. (1970). The mathematical representation of wind speed and temperature profiles in the unstable Atmospheric surface layer. J. Appl. Meteorol. 9, 857–861. doi:10.1175/1520-0450(1970)009<0857:tmrows>2.0.co;2
Pfeffer, W., Meier, M., and Illangasekare, T. (1991). Retention of Greenland runoff by refreezing: implication for projected future sea level change. J. of Geophys. Res. 96 (22), 117–122. doi:10.1029/91jc02502
Polashenski, C., Courville, Z., Benson, C., Wagner, A., Chen, J., Wong, G., et al. (2014). Observations of pronounced Greenland ice sheet firn warming and implications for runoff production. Geophys. Res. Lett. 41. doi:10.1002/2014GL059806
Radić, V., Menounos, B., Shea, J., Fitzpatrick, N., Tessema, M. A., and Déry, S. J. (2017). Evaluation of different methods to model near-surface turbulent fluxes for a mountain glacier in the Cariboo Mountains, BC, Canada. Cryosphere 11, 2897–2918. doi:10.5194/tc-11-2897-2017
Ragle, R. (1958). Polar glaciology study course. U.S. Snow Ice and Permafrost research establishment. Spec. Rep. 26, 14.
Roch, A. (1956). Rapport sur le cours de glaciologie polaire organise par SIPRE. Davos, Switzerland: Suisse Institut Fédéral pour l'Étude de la Neige et des Avalanches, 17.
Rogelj, J., Meinshausen, M., and Knutti, R. (2012). Global warming under old and new scenarios using IPCC climate sensitivity range estimates. Nat. Clim Change 2, 248–253. doi:10.1038/nclimate1385
Sampson, K. (2009). Shallow firn layer climatology derived from Greenland climate network automatic weather station data. PhD Thesis. Boulder, USA: University of Colorado.
Spencer, M. K., Alley, R. B., and Creyts, T. T. (2001). Preliminary firn-densification model with 38-site dataset. J. Glaciol. 47 (159), 671–676. doi:10.3189/172756501781831765
Steffen, K., Box, J. E., and Abdalati, W. (1996). Greenland climate network: GC-net. US army cold regions reattach and engineering (CRREL), CRREL special report, 98–103.
Steffensen, J. P., Clausen, H. B., and Christensen, J. M. (1996). On the spatial variability of impurity content and stable isotopic composition in recent Summit snow. Chemical exchange between the atmosphere and polar snow. Berlin, Heidelberg: Springer, 607–615.
Steger, C. R., Reijmer, C. H., Van Den Broeke, M. R., Wever, N., Forster, R. R., Koenig, L. S., et al. (2017). Firn meltwater retention on the Greenland ice sheet: a model comparison. Front. in earth Sci. 5, 3. doi:10.3389/feart.2017.00003
Taylor, K. E., Stouffer, R. J., and Meehl, G. A. (2012). An overview of CMIP5 and the experiment design, bulletin of the American meteorological society. 93 (4), 485–498. Available at https://journals.ametsoc.org/view/journals/bams/93/4/bams-d-11-00094.1.xml (Accessed February 15, 2021).
Ueda, H., and Garfield, D. (1968). Drilling through the Greenland ice sheet. U.S. Cold regions Research and engineering laboratory. Spec. Rep. 126, 14.
Uppala, S. M., Kållberg, P. W., Simmons, A. J., Andrae, U., Bech-told, V. D. C., Fiorino, M., et al. (2005). The ERA-40 re-analysis. Q. J. Roy. Meteorol. Soc. 131, 2961–3012. doi:10.1256/qj.04.176
Van As, D., Van Den Broeke, M., Reijmer, C., and Van De Wal, R. (2005). The summer surface energy balance of the high Antarctic plateau. Boundary-Layer Meteorology 115 (2), 289–317. doi:10.1007/s10546-004-4631-1
van As, D., Fausto, R. S., Colgan, W. T., Box, J. E., Ahlstrøm, A. P., Andersen, S. B., et al. (2013). Darkening of the Greenland ice sheet due to the melt-albedo feedback observed at PROMICE weather stations. Geol. Surv. of Denmark Greenland Bull. (28), 69–72.
van den Broeke, M., Enderlin, E., Howat, I., Munneke, P., Noël, B., van de Berg, W., et al. (2016). On the recent contribution of the Greenland ice sheet to sea level change. The Cryosphere 10, 1933–1946. doi:10.5194/tc-10-1933-2016
van Vuuren, D., Edmonds, J., Kainuma, M., Riahi, K., Thomson, A., Hibbard, K., et al. (2011). The representative concentration pathways: an overview. Climatic change 109, 5. doi:10.1007/s10584-011-0148-z
Vandecrux, B. (2021a). Camp Century: Simulations of firn evolution 1966-2100, Available at: https://doi.org/10.22008/FK2/QDND53, GEUS Dataverse, V1.
Vandecrux, B. (2021b). GEUS surface energy balance and firn model (Version v0.3). Zenodo. doi:10.5281/zenodo.4178985
Vandecrux, B. (2021c). Camp Century: Firn compaction measurements (CEN-COM), Available at: https://doi.org/10.22008/FK2/CQSKLK, GEUS Dataverse, V1.
Vandecrux, B. (2021d). Camp Century: Firn temperature measurements (CEN-THM), Available at: https://doi.org/10.22008/FK2/SR3O4F, GEUS Dataverse, V1.
Vandecrux, B., Fausto, R. S., Van As, D., Colgan, W., Langen, P. L., Haubner, K., et al. (2020). Firn cold content evolution at nine sites on the Greenland ice sheet between 1998 and 2017. J. of Glaciology 66 (258), 591–602. doi:10.1017/jog.2020.30
Vandecrux, B., Fausto, R., Langen, P., van As, D., MacFerrin, M., Colgan, W., et al. (2018). Drivers of firn density on the Greenland ice sheet revealed by weather station observations and modeling. J. of Geophys. Res. 123. doi:10.1029/2017JF004597
Vandecrux, B., Mottram, R., Langen, P. L., Fausto, R. S., Olesen, M., Stevens, C. M., et al. (2020). The firn meltwater Retention Model Intercomparison Project (RetMIP): evaluation of nine firn models at four weather station sites on the Greenland ice sheet. Cryosphere. doi:10.5194/tc-2019-331
Vionnet, V., Brun, E., Morin, S., Boone, A., Faroux, S., Le Moigne, P., et al. (2012). The detailed snowpack scheme Crocus and its implementation in SURFEX v7.2, Geosci. Model. Dev. 5 (3), 773–791. doi:10.5194/gmd-5-773-2012
Weertman, J. (1968). Comparison between measured and theoretical temperature profiles of the camp century, Greenland, borehole. J. Geophys. Res. 73, 2691–2700. doi:10.1029/jb073i008p02691
Wong, G., Osterberg, E., Hawley, R., Courville, Z., Ferris, D., and Howley, J. (2015). Coast-to-interior gradient in recent northwest Greenland precipitation trends (1952–2012). Environ. Res. Lett. 10, 114008. doi:10.1088/1748-9326/10/11/114008
Yen, Y.-C. (1981). Review of thermal properties of snow, ice and sea ice. CRREL Rep. 81-10, 1–27. Available at: http://acwc.sdp.sirsi.net/client/search/asset/1005644.
Keywords: greenland ice sheet, firn, surface mass balance, accumulation, camp century, future climate
Citation: Vandecrux B, Colgan W, Solgaard AM, Steffensen JP and Karlsson NB (2021) Firn Evolution at Camp Century, Greenland: 1966–2100. Front. Earth Sci. 9:578978. doi: 10.3389/feart.2021.578978
Received: 01 July 2020; Accepted: 25 January 2021;
Published: 22 March 2021.
Edited by:
Alun Hubbard, Arctic University of Norway, NorwayReviewed by:
Michael John MacFerrin, University of Colorado Boulder, United StatesAsa Kristina Rennermalm, Rutgers University, Newark, United States
Copyright © 2021 Vandecrux, Colgan, Solgaard, Steffensen and Karlsson. This is an open-access article distributed under the terms of the Creative Commons Attribution License (CC BY). The use, distribution or reproduction in other forums is permitted, provided the original author(s) and the copyright owner(s) are credited and that the original publication in this journal is cited, in accordance with accepted academic practice. No use, distribution or reproduction is permitted which does not comply with these terms.
*Correspondence: Baptiste Vandecrux, YmF2QGdldXMuZGs=