 Mauricio González1*
 José A. Álvarez-Gómez2
 Íñigo Aniel-Quiroga1
 Luis Otero3
 Maitane Olabarrieta4
 Rachid Omira5,6
 Alberto Luceño7
 Robert Jelinek8
 Elisabeth Krausmann9
 Joern Birkman10
 Maria A. Baptista5,11Miguel Miranda5,6
 Ignacio Aguirre-Ayerbe1
- 1IHCantabria - Instituto de Hidráulica Ambiental de la Universidad de Cantabria, Santander, Spain
- 2Department of Geodynamics, Stratigraphy and Paleontology, Faculty of Geology, Complutense University of Madrid, Madrid, Spain
- 3Departamento de Física, Universidad del Norte, Colombia, Barranquilla, Colombia
- 4Department of Coastal Engineering, Engineering School of Sustainable Infrastructure and Environment, University of Florida, Gainesville, FL, United States
- 5Instituto Dom Luiz, University of Lisbon, IDL-FCUL, Lisbon, Portugal
- 6Instituto Português do Mar e da Atmosfera, Lisbon, Portugal
- 7Department of Applied Mathematics and Sciences of Computation, Universidad de Cantabria, Santander, Spain
- 8State Geological Institute of Dionýz Štúr, Bratislava, Slovakia
- 9European Commission, Joint Research Centre, Ispra, Italy
- 10Institute of Spatial and Regional Planning, University of Stuttgart, Stuttgart, Germany
- 11Instituto Superior de Engenharia de Lisboa, IPL, Lisbon, Portugal
Tsunami hazard can be analyzed from both deterministic and probabilistic points of view. The deterministic approach is based on a “credible” worst case tsunami, which is often selected from historical events in the region of study. Within the probabilistic approach (PTHA, Probabilistic Tsunami Hazard Analysis), statistical analysis can be carried out in particular regions where historical records of tsunami heights and runup are available. In areas where these historical records are scarce, synthetic series of events are usually generated using Monte Carlo approaches. Commonly, the sea level variation and the currents forced by the tidal motion are either disregarded or considered and treated as aleatory uncertainties in the numerical models. However, in zones with a macro and meso tidal regime, the effect of the tides on the probability distribution of tsunami hazard can be highly important. In this work, we present a PTHA methodology based on the generation of synthetic seismic catalogs and the incorporation of the sea level variation into a Monte Carlo simulation. We applied this methodology to the Bay of Cádiz area in Spain, a zone that was greatly damaged by the 1755 earthquake and tsunami. We build a database of tsunami numerical simulations for different variables: faults, earthquake magnitudes, epicenter locations and sea levels. From this database we generate a set of scenarios from the synthetic seismic catalogs and tidal conditions based on the probabilistic distribution of the involved variables. These scenarios cover the entire range of possible tsunami events in the synthetic catalog (earthquakes and sea levels). Each tsunami scenario is propagated using the tsunami numerical model C3, from the source region to the target coast (Cádiz Bay). Finally, we map the maximum values for a given probability of the selected variables (tsunami intensity measures) producing a set of thematic hazard maps. 1000 different time series of combined tsunamigenic earthquakes and tidal levels were synthetically generated using the Monte Carlo technique. Each time series had a 10000-year duration. The tsunami characteristics were statistically analyzed to derive different thematic maps for the return periods of 500, 1000, 5000, and 10000 years, including the maximum wave elevation, the maximum current speed, the maximum Froude number, and the maximum total forces.
Introduction
The mitigation of marine hazards on threaten coasts is a challenging scientific and engineering topic. Addressing such a challenge requires extensive preparation through the development of hazard and risk assessment methods. Tsunami is one of these marine hazards, for which the assessment methods have significantly progressed over the past 2-3 decades. However, as the tsunami historical catalogs are often inherently incomplete, obtaining a purely empirical hazard assessment remains difficult to achieve (Davies et al., 2018). Alternatively, methods combining data and numerical modeling have been developed (Geist and Lynett, 2014), gaining increasing improvement in the aftermath of the 2004 Indian Ocean tsunami (Grezio et al., 2017).
Existing tsunami hazard assessment methods for earthquake sources are basically developed in an analogous way to the seismic hazard assessment. They include the deterministic tsunami hazard assessment (DTHA) and the probabilistic tsunami hazard assessment (PTHA, or SPTHA from seismic probabilistic tsunami hazard assessment). Prior to the 2004 Indian Ocean tsunami, the DTHA method was the widely used among the tsunami scientific community (e.g., Tinti and Armigliato, 2003). Nevertheless, some few PTHA studies could also be found in the literature (Lin and Tung, 1982; Rikitake and Aida, 1988). The DTHA employs particular source scenarios (i.e., worst-case scenario) to numerically predict and map selected tsunami intensity measures (e.g., maximum wave height, flow depth, current velocity) (Tinti et al., 2005; Lorito et al., 2008). Although the DTHA is considered simple to conduct and provides easily interpreted results, it is very sensitive to the selection of the source scenario (Geist and Lynett, 2014). The PTHA, on the other hand, determines the likelihood of exceeding a tsunami intensity measure (e.g., wave height, runup height) at a particular location within a given time period by integrating the modeled hazard from all considered events (Geist and Parsons, 2006; Power et al., 2007; Grezio et al., 2017). In comparison to DTHA, PTHA is relatively complex and computationally demanding. The complexity of PTHA relies on the treatment of uncertainties that often leads to generate a large number of possible events. Annaka et al. (2007) distinguished two categories of PTHA uncertainties: aleatoric referring to the random nature of tsunami generation and its effects, and epistemic related to the insufficient knowledge on data and modeling accuracy. Covering all sources of uncertainties in PTHA remains highly challenging being the incorporation of uncertainties on the tsunami source one of the main difficulties (Basili et al., 2013; Lorito et al., 2015; Lorito et al., 2015; Sepúlveda et al., 2019; Behrens et al., 2021).
A framework for modern PTHA was first presented in the pioneering work of Geist and Parsons (2006). This framework formed the basis for developing numerous PTHA research works (e.g., Burbidge et al., 2008; Otero, 2008; Taubenböck et al., 2008; Suppasri et al., 2012; Yadav et al., 2013; Horspool et al., 2014; Omira et al., 2015; Shin et al., 2015; El-Hussain et al., 2016; Griffin et al., 2016; Hoechner et al., 2016; Zamora and Babeyko, 2020). 7 years after the 2004 event, the massive 2011 Japan tsunami raised the need to consider the complexity of the earthquake rupture in the PTHA. Subsequently, PTHA studies incorporating heterogeneous slip distribution on the earthquake fault (Li et al., 2016; Sepúlveda et al., 2019) or rigidity depth-dependence (Davies and Griffin, 2019) have been conducted.
Probabilistic tsunami hazard analysis applies to different geographic scales. These scales include global-scale PTHA (Davies et al., 2018), regional-scale PTHA (Thio et al., 2007; Sorensen et al., 2012; Power et al., 2013; Lorito et al., 2015; Omira et al., 2015; Li et al., 2016; Zamora and Babeyko, 2020; Basili et al., 2021), national-scale PTHA (Grezio et al., 2012; Suppasri et al., 2012; Horspool et al., 2014; De Risi and Goda, 2016; El-Hussain et al., 2016; Davies and Griffin, 2019; Kotani et al., 2020), and local-scale PTHA (González et al., 2009; Omira et al., 2016; Volpe et al., 2019). Detailed PTHA of a specific coastal segment community (local-scale) often involves high-resolution inundation modeling and treatment of uncertainties from local effects, such as the tidal stage (Omira et al., 2016). Commonly, the sea level variation and the currents forced by the tidal motion are either disregarded or considered and treated as aleatory uncertainties in the numerical models (González et al., 2010; Omira et al., 2016). In some other cases, tidal elevations are added linearly to the maximum tsunami heights, without considering the non-linear shoaling and topo-bathymetry local effects. However, in zones with a macro and meso tidal regime, the effect of the tides on the probability distribution of tsunami hazard can be very important.
In this study, a PTHA methodology and its application to a costal site of the NE Atlantic, Cádiz Bay in Spain, is presented. Cádiz is characterized by a meso tidal regime (higher than 2 m and lower than 4 m, as defined in Davis et al., 1972) and, therefore, the study considers a combined statistical treatment of both tsunami hazard and sea level variation improving the existing mentioned approaches (sea level add linearly or a constant sea level). As a result, inundation maps expressing the likelihood of exceeding tsunami intensity measures (maximum wave elevation, maximum current speed and maximum wave forces) are derived at given return periods.
Test Site Selection
The November 1st, 1755 Lisbon event is probably the earliest well documented tsunami, with references to all over the Atlantic basin, and one of the largest in European historical times. The tsunami was possibly generated by one of the many faults present in the area of the Gulf of Cádiz (Medialdea et al., 2004; Terrinha et al., 2009; Zitellini et al., 2009). This area is tectonically deformed by a slow (3.5 - 4 mm/year) ESE-WNW oblique convergence between the African and Eurasian lithospheric plates (Argus et al., 1989; Stich et al., 2006), which is translated into a relatively low seismic activity distributed over a wide deformation area. Although there are several seismic sources capable of generating major earthquakes, the slow strain rate causes a low frequency of large earthquakes. The historical record of tsunamis, therefore, is very limited in the area, although there are records of paleotsunamis with similar characteristics to that of 1755 (Luque et al., 2001, 2002; Ruiz et al., 2005; Morales et al., 2008; Baptista and Miranda, 2009).
The Bay of Cádiz is geographically located between the longitudes 6° W and 6° 25′ W and latitudes 36° 20′ N and 36° 40′ N, in the Southwest of Iberian Peninsula (Figure 1). It faces West to the Gulf of Cádiz and is landlocked around its Southwestern, Southern and Eastern margins by the mainland. This area is a natural protection zone with large tidal flats, tidal channels (mean spring tidal range ∼ 3.7 m) and several beaches. Cádiz city constitutes the municipality with the highest population in this area, with approximately 130 000 inhabitants. This city (Figure 1) occupies a small peninsula connected by a tombolo (a sandy isthmus or spit that connects the island to the mainland or to another island) to the Leon Island, where the San Fernando municipality is located. The main economic activities in Cádiz are related to tourism, naval construction and harbor activities. Due to its long and nice beaches, the warm weather and its historic heritage, tourism has increased considerably in the last decades.
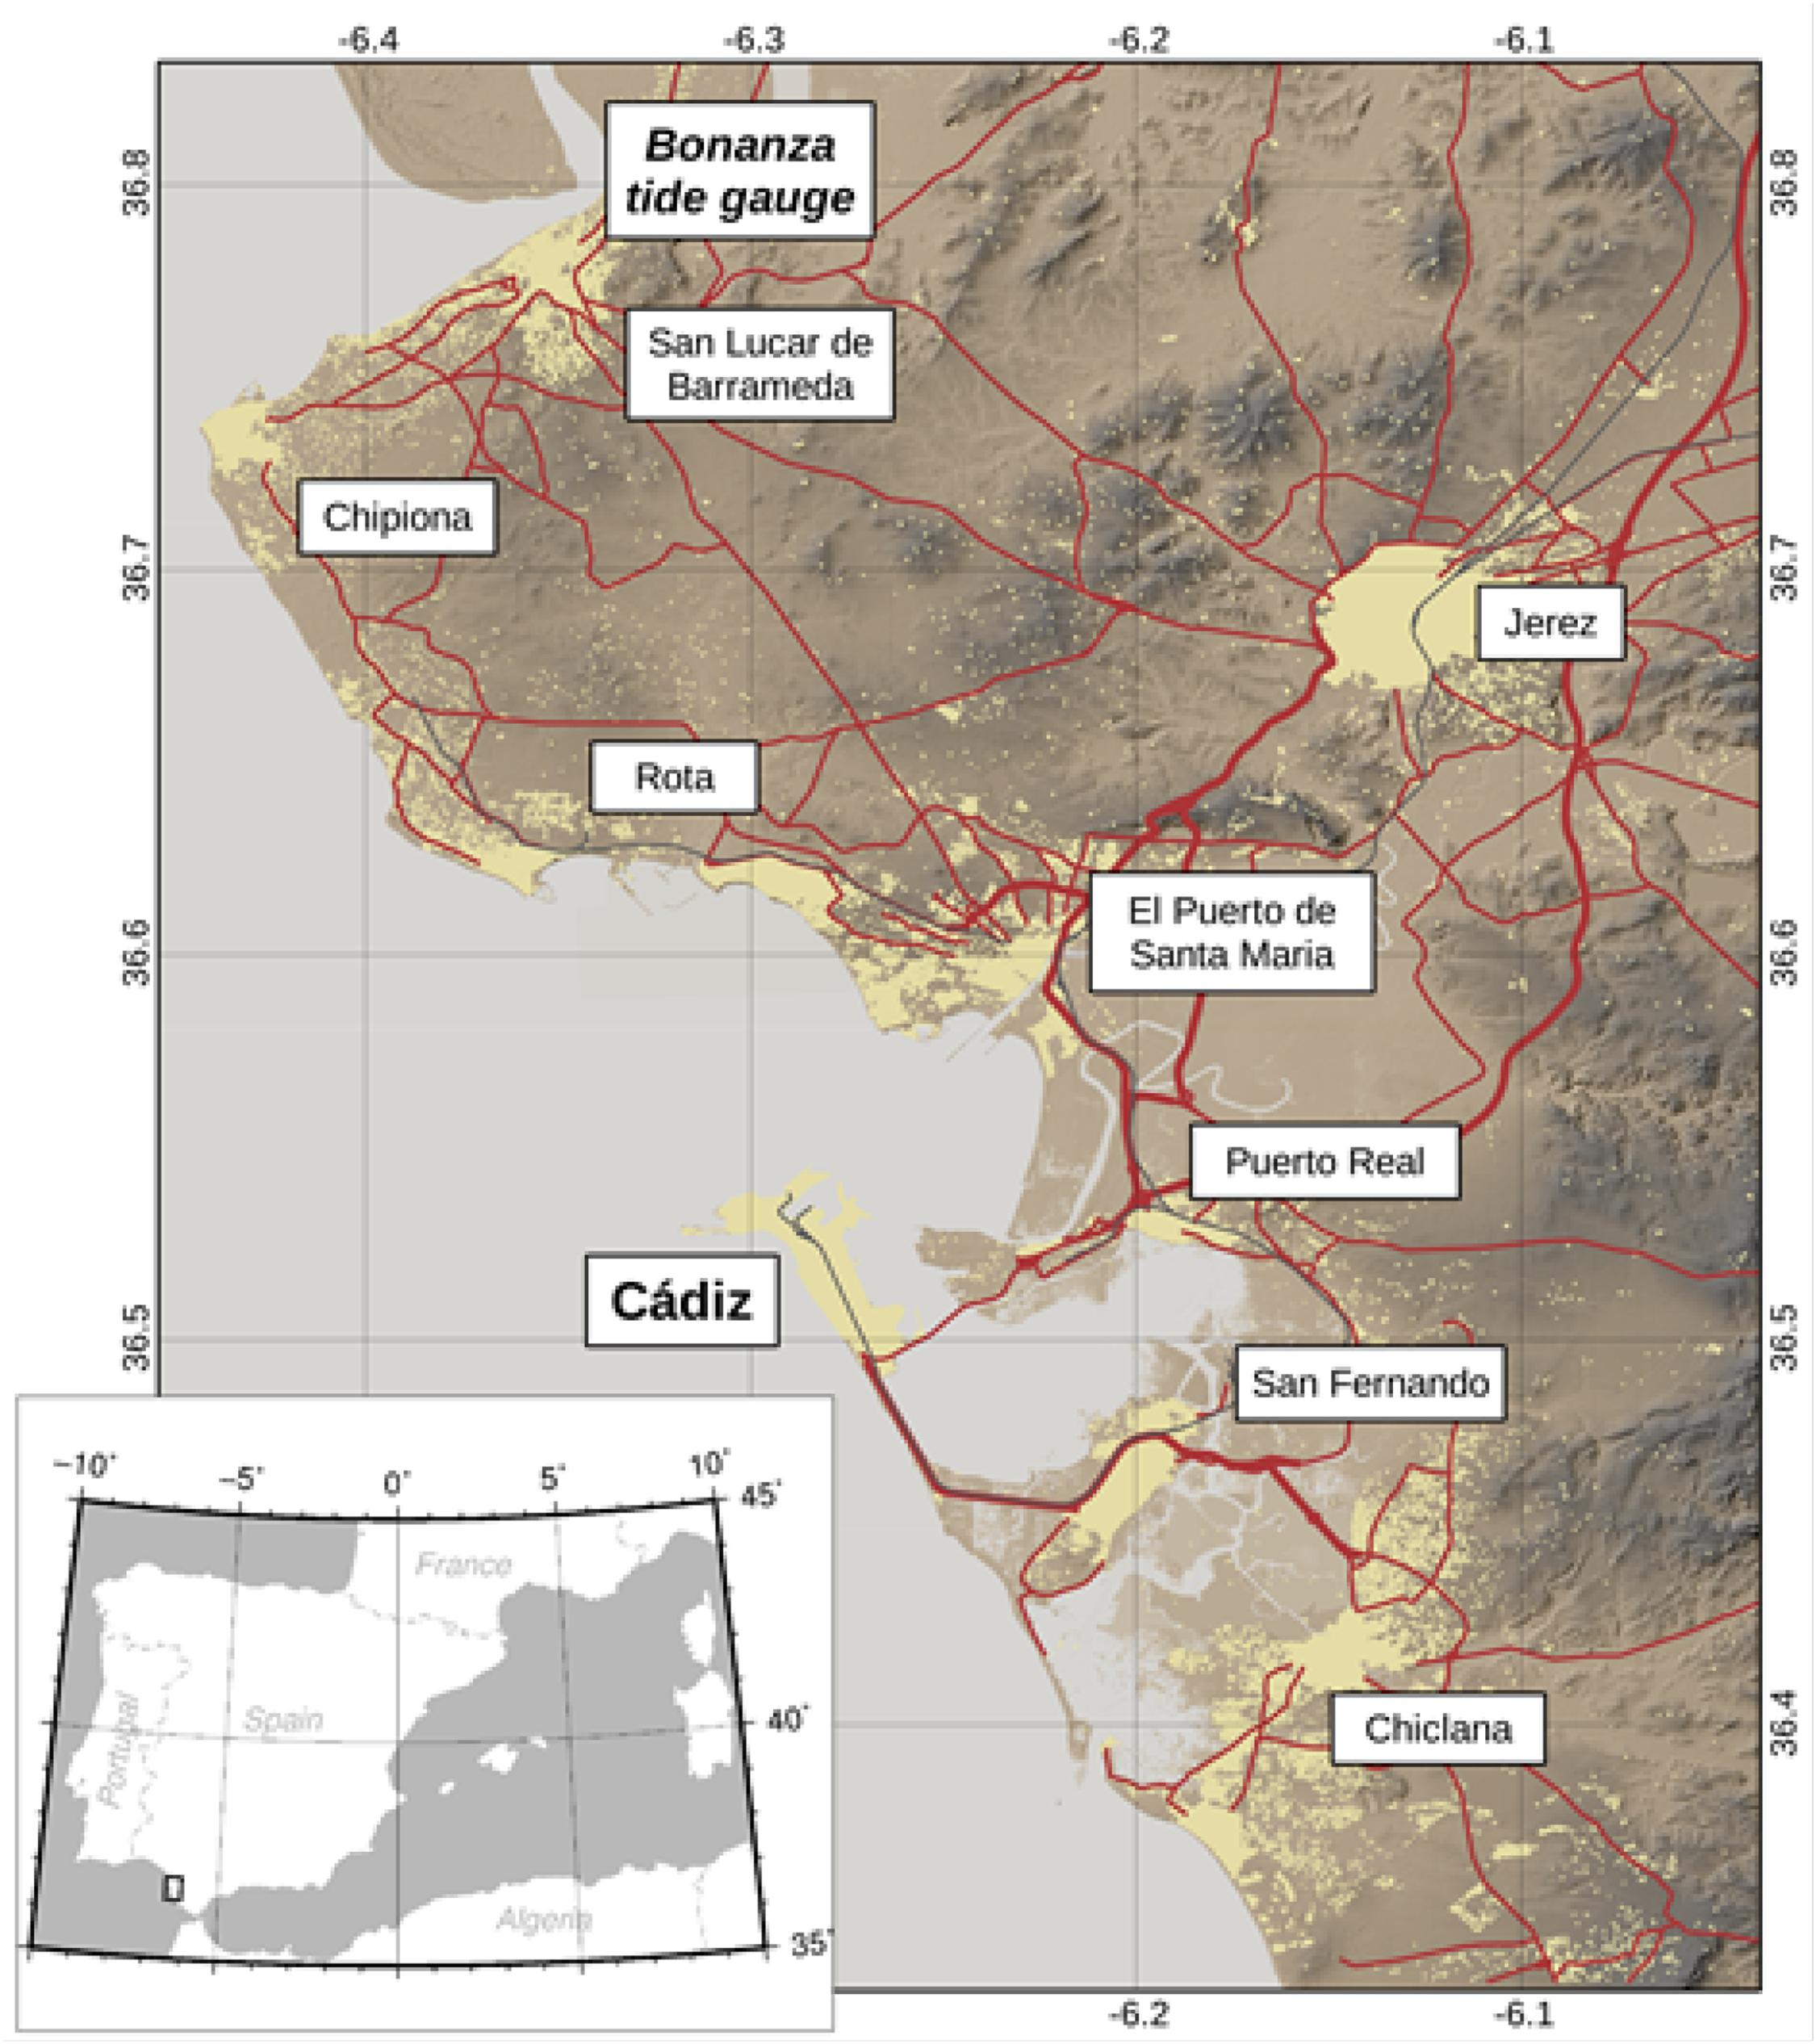
Figure 1. Geographical localization of the Cádiz Bay and its main municipalities. Pale yellow polygons represent urban areas; red lines are the main roads and the gray line is the railroad.
Probabilistic Methodology
Probabilistic tsunami hazard analysis methods generally follow the PSHA (Probabilistic Seismic Hazard Analysis) method, originally developed by Cornell (1968). The PSHA is a widely used method for assessing the seismic hazard and has been described and extensively reviewed, as stated in various reports and documents (National Research Council, 1988, 1997; Senior Seismic Hazard Analysis Comittee, 1997), and several authors have discussed various aspects of it, such as the distinction between aleatory and epistemic uncertainties, the use of synthetic earthquake catalogs (Ward, 1991, 1996, 2000), the Monte Carlo methods (Savage, 1991, 1992; Cramer et al., 1996; Ebel and Kafka, 1999), and the use of Logic Trees (Coppersmith and Youngs, 1986).
Since the seismicity, and consequently the seismic generation of the tsunami is a stochastic phenomenon, it is necessary to use probabilistic analysis to estimate the hazard of these phenomena and their impact on the coast. The approach we used here is based on Monte Carlo techniques, which comprises the following steps:
• Building a database of numerical simulations of tsunamis for different variables: faults, seismic magnitudes, epicenter locations and sea levels.
• Generating a set of scenarios from synthetic seismic catalogs and tidal conditions based on the probabilistic distributions of the involved variables.
• Mapping the maximum values of the selected tsunami intensity measures to assess the hazard for a given probability.
Methods based on Monte Carlo techniques allow the processing of the work variables and their respective uncertainties in a robust way. The variables are treated by their probability density functions (PDF) and different values can be sampled from the distribution function for each simulation.
In the framework of the European FP6 TRANSFER project1, we developed a PTHA methodology based on the generation of synthetic seismic catalogs and the incorporation of the sea level variation into a Monte Carlo simulation. In this work, we present the application of this methodology step-by-step to one of the project test-sites, the Bay of Cádiz area in Spain. The main novelty of the work is the combined statistical treatment of both tsunami hazard and tidal variation by incorporating the tidal state into the PTHA. The tide is included using a discrete set of constant sea level elevations, and the tsunami tidal current interaction is neglected.
This paper is structured as follows: first, the characterization of the seismic sources and the statistical analysis are presented. Second, the sea level characterization and statistical analysis are performed. Third, the methodology based on the Monte Carlo approach, which has been applied to obtain the synthetic seismic catalog, is described in detail. Fourth, the numerical database and the methodology to generate the probabilistic thematic maps are presented. Finally, the probabilistic thematic maps for the Bay of Cádiz area are derived from the application of the developed methodology.
Tsunamigenic Sources Characterization
The tsunami origin accounts for a major source of uncertainty in PTHA. The importance of the seismic source characteristics into tsunami hazard has been shown in a number of works (Okal and Synolakis, 2004; Gica et al., 2007; Basili et al., 2013; Knighton and Bastidas, 2015; Davies and Griffin, 2019) and some approximations to deal with them from a probabilistic point of view have been proposed (e.g., Sørensen et al., 2012; Knighton and Bastidas, 2015; Lorito et al., 2015). The incorporation of variable or stochastic slip distribution functions (e.g., Goda et al., 2015; Li et al., 2016), as well as improved 3D geological rupture models (e.g., Yamada et al., 2013), into probabilistic analysis are part of the current development of the PTHA methodology.
Here, the characterization of tsunamigenic sources basically consists of identifying the seismic faults that can affect the studied region, and the probabilistic analysis of their parameters. This analysis is based on the historical earthquake data in the zone and can be divided into the following elements:
(1) Seismic zonation and identification of the main tectonic structures based on historic seismicity and geology. This zoning can include far-field and local sources.
(2) Determination of statistical parameters based on the Gutenberg-Richter Law.
(3) Determination of the geometrical parameters for the main fault ruptures and of the scaling relationships between the seismic moment and the source parameters.
Tectonic Structures
Tectonically, the study area can be defined as a diffuse plate boundary (Sartori et al., 1994), where the deformation is taking place by means of different structures distributed along a broad area. This area comprises the eastern edge of the Gloria and Tydeman transforms (where the deformation is mainly concentrated in these shear corridors), the Gorringe Bank, the Horseshoe Abyssal plain, the Portimao and Guadalquivir banks, and the western termination of the arcuated Gibraltar Arc (Medialdea et al., 2004; Zitellini et al., 2009). This deformation zone is the eastern edge of the Azores – Gibraltar seismic zone, being the present-day boundary between the Eurasian and African plates. Here, the strain is mainly compressive or transpressive, and changes to almost pure strike-slip along the Gloria Fault (Laughton and Whitmarsh, 1974; Borges et al., 2001). The relative motion between the two plates in this area is of the order of 3.5 - 4 mm/year (Argus et al., 1989; Stich et al., 2006).
Most damaging earthquakes and tsunamis that affected the coasts of Portugal, Morocco and Spain were probably generated in the SWIT (SW Iberian Transpressive Domain) zone, being the main active tectonic zone and plate boundary in the area (Zitellini et al., 2009; Martínez-Loriente et al., 2013), including the November 1st, 1755 massive tsunami. In the present study only the tsunamigenic areas in the SWIT region have been considered. This area of tectonic deformation is responsible for the offshore seismicity of Southwestern Iberia (Figure 2). The largest instrumental earthquake was the February 28th, 1969 Horseshoe Ms 8.0 (Mw 7.8) event (Fukao, 1973; Grandin et al., 2007) and the respective tsunami was recorded all over the North Atlantic (Gjevik et al., 1997; Baptista, 2019). Moreover, the SWIT was the place of several moderate size events that have been recorded in the last decades. Focal mechanisms and slip vectors show the coexistence of two different processes of deformation, on one hand the presence of mainly reverse and reverse-oblique faulting with N-S to NNW-SSE compression and on the other hand the occurrence of mainly strike-slip faulting with an associated direction of compression approximately NW-SE (Geissler et al., 2010; Stich et al., 2010). These characteristics are explained by the occurrence of strain partitioning in this area of diffuse deformation (Rosas et al., 2009; Terrinha et al., 2009).
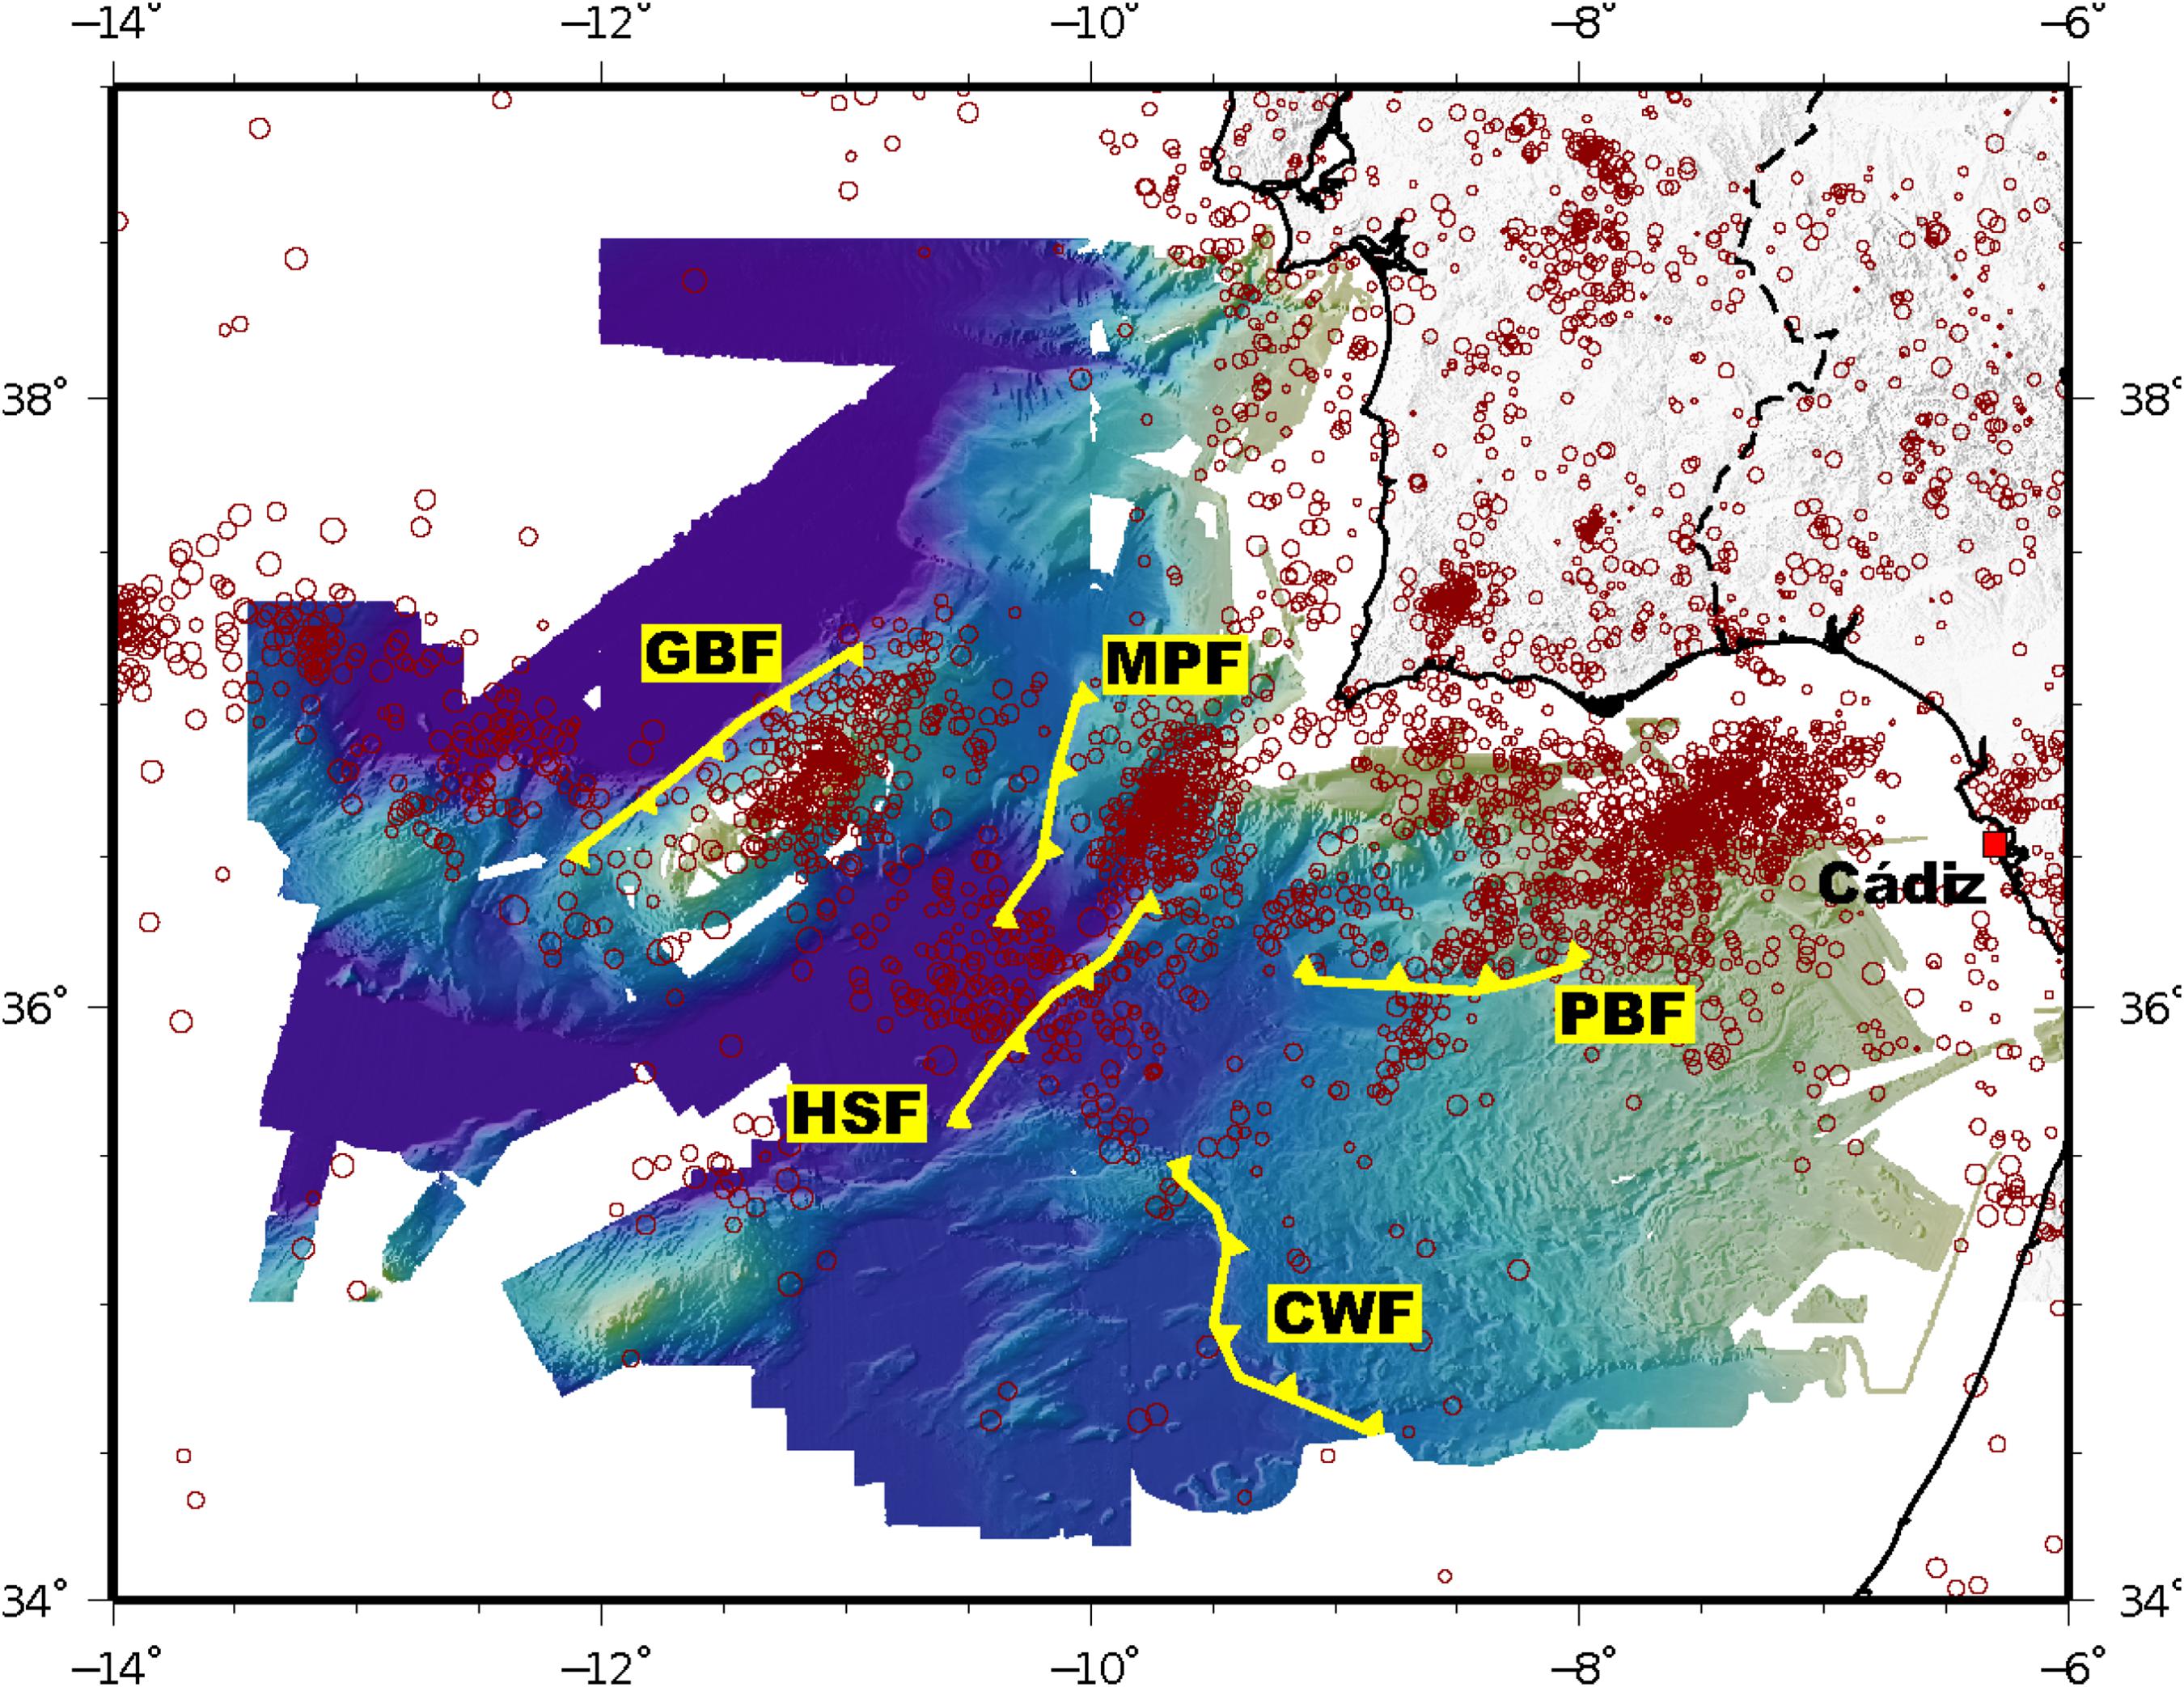
Figure 2. Map of seismicity and geological structures used as sources in the present study. GBF, Gorringe Bank Fault; MPF, Marques de Pombal Fault; HSF, Horseshoe Fault; PBF, Portimao Bank Fault; CWF, Cádiz Wedge Fault. Circles show the epicenters of the Spanish National Seismic Network instrumental catalog, with the size proportional to the event magnitude. The colormap shows the SWIM high resolution bathymetry (Zitellini et al., 2009).
As depicted in Figure 2, the seismicity can be grouped in clusters associated with the main geological structures. These structures are the main tsunamigenic sources in the Gulf of Cádiz and they are used in this work as maximum earthquake ruptures. These fault traces are parameterized in Álvarez-Gómez et al. (2008); Omira et al. (2009), Lima et al. (2010) and are described in greater detail in Zitellini et al. (2009). The seismicity associated with these structures is used to define its statistical parameters, basically the Gutenberg-Richter Law, as shown in the next section.
Statistical Analysis of the Seismicity
The Gutenberg-Richter Law relates the earthquake magnitude with its frequency:
where N represents the accumulated frequency of the earthquakes with a magnitude higher or equal to Mw. The a coefficient establishes the seismic activity in the zone, while the parameter b is related with the difference between the frequency of small and big earthquakes. The annual rate of earthquakes with a magnitude higher or equal to Mw (λMW (N/T), where T refers to the time),
is given by the following equation:
where α = a ln(10) and β = b ln(10).
From the Gutenberg-Richter Law the following distribution function FM0 (M0) can be derived for the seismic moment M0:
The associated density function fM0 (M0) is the following:
where m0l represents the lower limit of the considered earthquake seismic moment and m0u represents the upper limit of the considered earthquake seismic moment. For each fault m0u should be equal to the worst-case scenario seismic moment.
We have selected the time period between 1900 and 2002 in the IGN seismic catalog IGN (2011). In this interval the used magnitude mb Lg (Mezcua and Martínez-Solares, 1983) is homogeneous. After 2002, the method to obtain the magnitude in the Spanish seismic network changed, and no direct relationship between them has been calculated. This magnitude has been transformed to Mw using the relationship published by Rueda and Mezcua (2002) for Iberian earthquakes:
The number of events increases exponentially with time, denoting the increase in sensitivity of the seismographs. To avoid this effect on the statistical framework, we have calculated the magnitude of completeness evolution through time using Gutenberg-Richter fits with a mobile window of 200 events. We obtained a magnitude of completeness of MW > 3.2 since 1975, which was tested analyzing the cumulative distribution of events. To compute a synthetic catalog assuming a Poissonian model, all the “non-independent” events must be eliminated. We have used the declustering methodology of Gardner and Knopoff (1974), with time and space windows predefined as function of the event magnitude to eliminate the aftershocks. With the catalog filtered and declustered, we calculated the values a and b by means of a maximum likelihood method. The obtained values were b = 1.05 ± 0.07, and a = 4.31 (Figure 3A). We used the software ZMAP (Wiemer, 2001) to perform these statistical analyses.
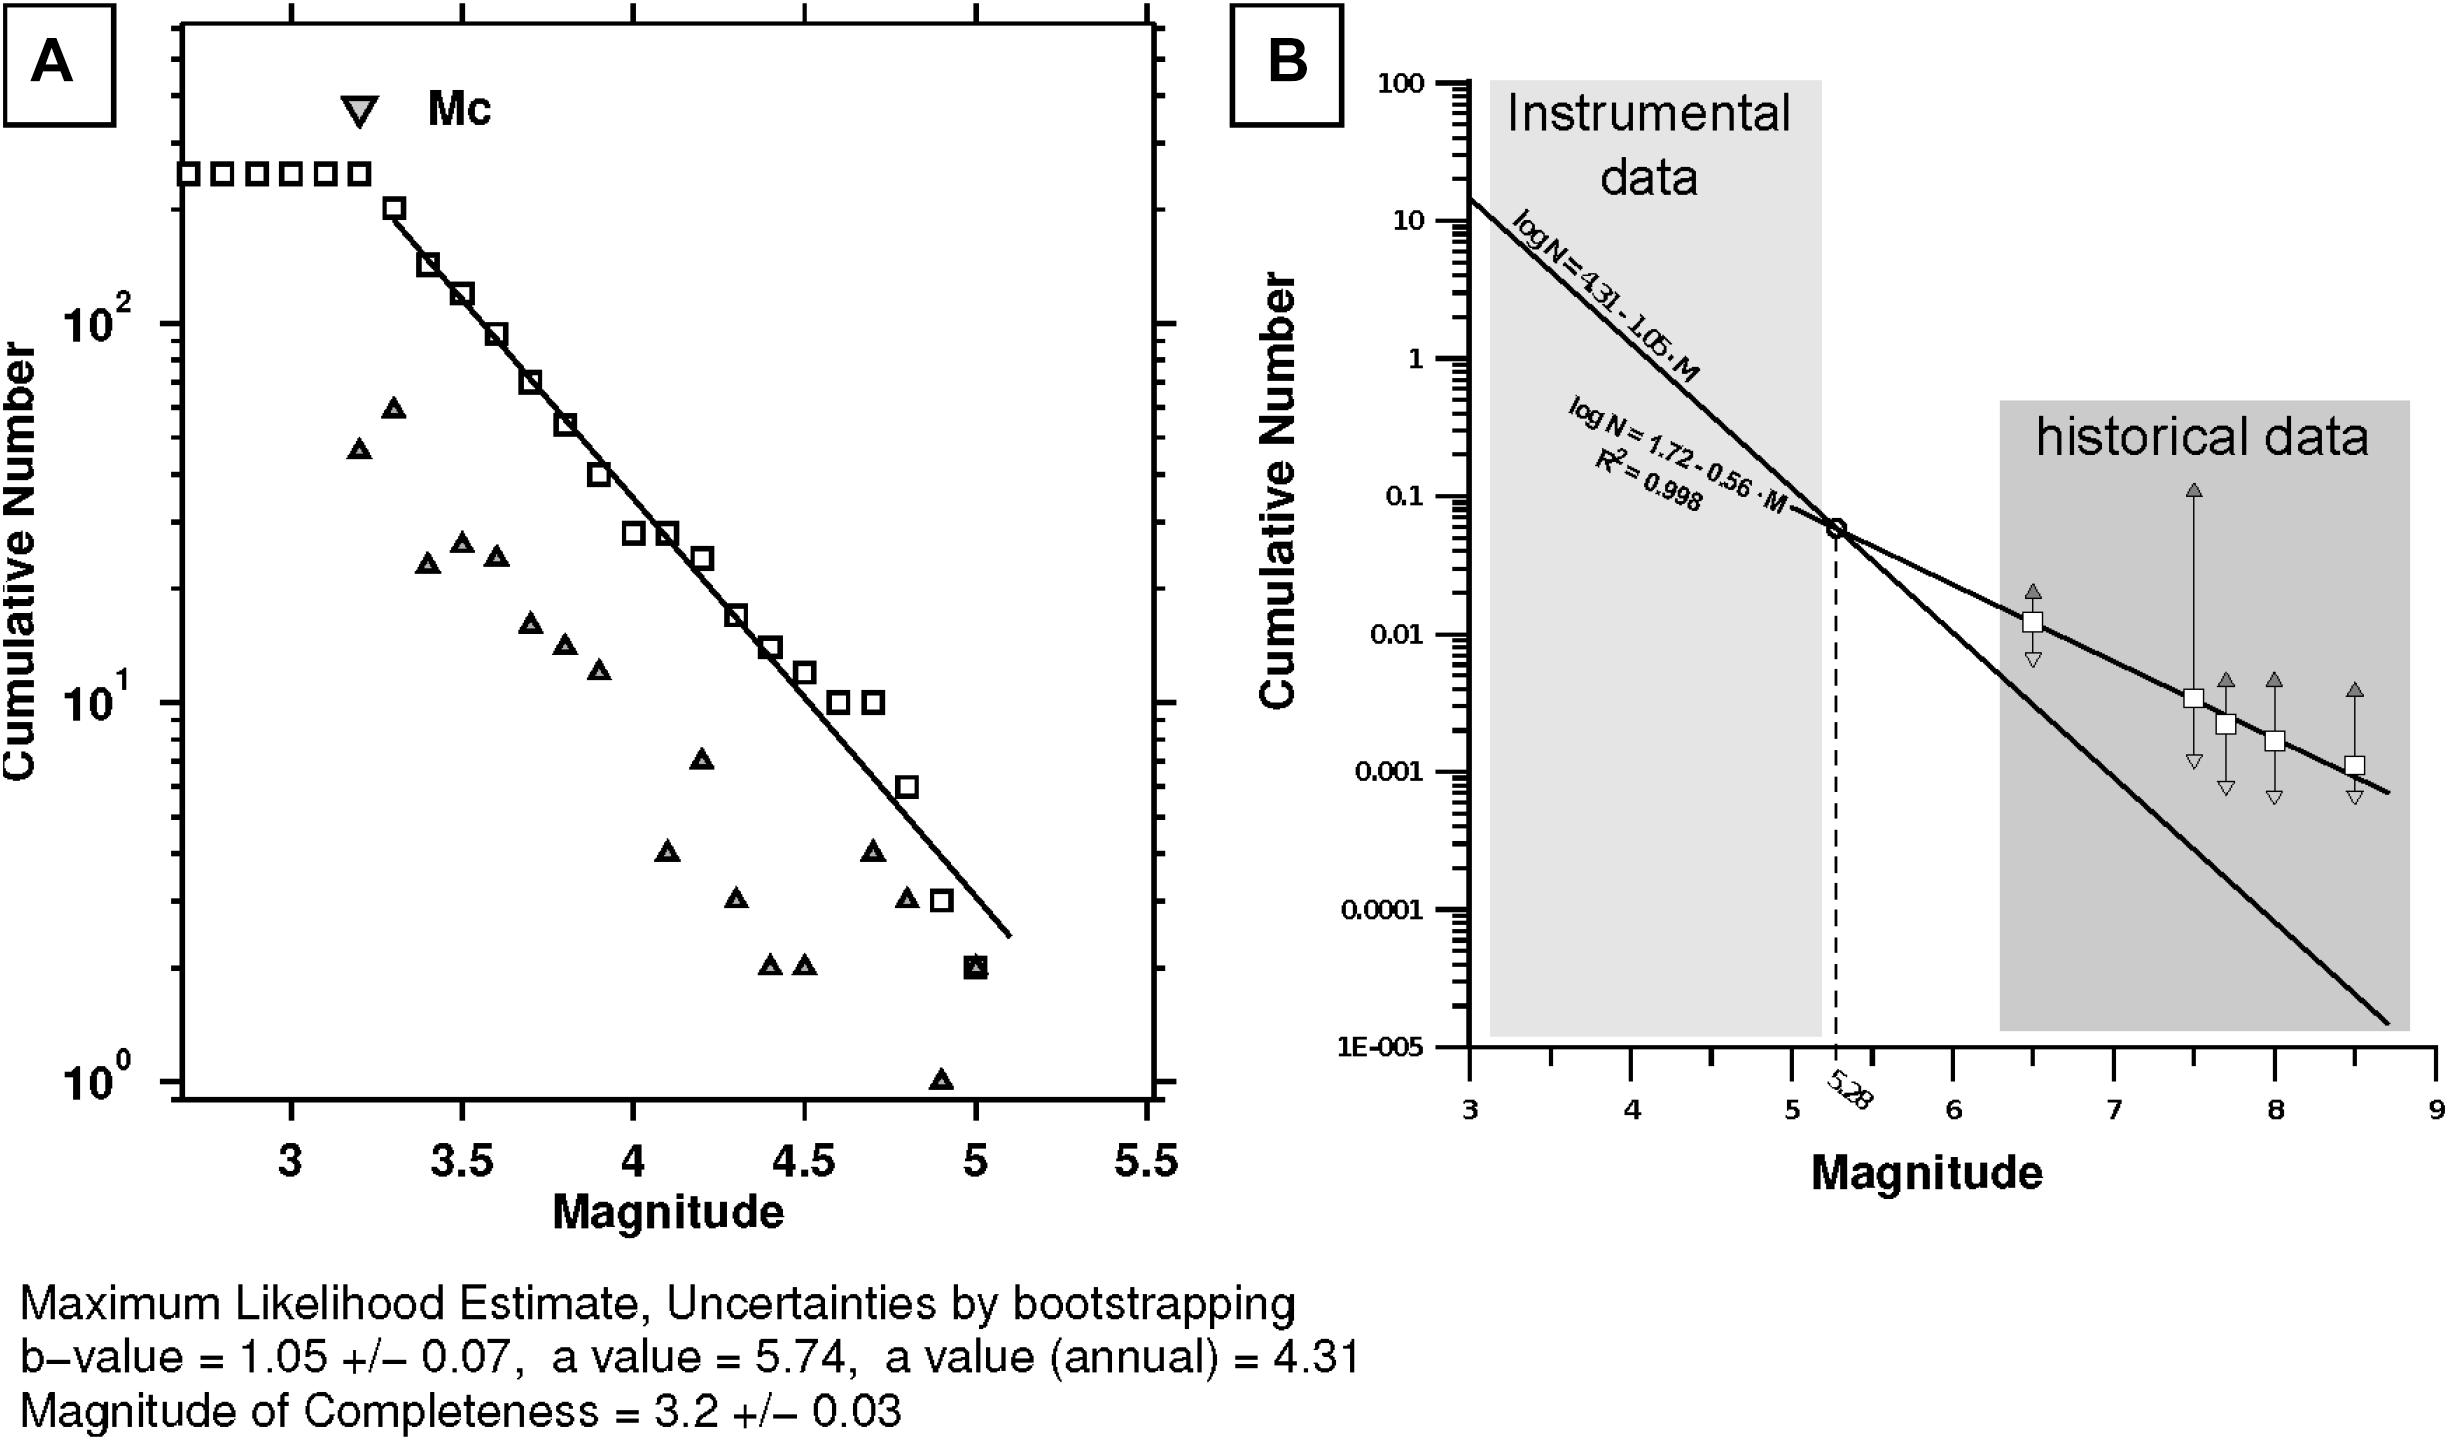
Figure 3. (A) Gutenberg-Richter fit of the instrumental catalog after declustering of the catalog shown in Figure 2 (see details in the text). Triangles show discrete frequencies while the squares show the cumulative distribution. (B) Plot comparing the Gutenberg-Richter Law fitted with instrumental data (thin line) and the historical data. Squares are the mean annual frequencies, light-gray downward triangles are minimum frequencies and dark-gray upward triangles are maximum frequencies. The fitted Gutenberg-Richter Law to the historical data is shown as a thick line. The intersection between both fits takes place on the magnitude value MW = 5.28.
Although the fit is quite good, the magnitude interval in which the values are computed is very limited and we have no control over the fit for bigger earthquakes. To evaluate the validity of this relation for tsunamigenic earthquakes, we have estimated the annual frequency of great earthquakes from the historical data. We have used magnitudes estimated from the bibliography (Luque et al., 2001, 2002; Ruiz et al., 2005; Garcia-Orellana et al., 2006; IGN, 2009, 2011) and the minimum, maximum and mean annual frequencies have been computed.
In Figure 3B historical data are plotted over the previously calculated Gutenberg-Richter fit. As can be seen, the distribution of the mean frequencies can be fitted confidently by a Gutenberg-Richter Law (R2 = 0.998) with values: a = 1.72, b = 0.56; intersecting the instrumental fit in the magnitude MW = 5.28. This type of two-branch distribution has been proposed in different environments regarding the distribution of great earthquakes and implying for some authors a characteristic earthquake model (Schwartz and Coppersmith, 1984; Davison and Scholz, 1985; Wesnousky, 1994; Main, 2000; Zielke and Arrowsmith, 2008). In our approximation to the PTHA we are interested in earthquakes capable of generating tsunamis, in big and great earthquakes; and in our case, the second branch better describes the occurrence of the tsunamigenic earthquakes in the Gulf of Cádiz.
Once these parameters are known, the annual rate of earthquakes greater or equal to a given value can be obtained from the Gutenberg-Richter Law. For the SWIT zone we are constraining the minimum seismic moment magnitude for tsunamigenic earthquakes to 6.5. Therefore, earthquakes with smaller magnitudes have not been considered.
Geometrical Parameters and Scaling Relations
To define a set of potential earthquake ruptures with different magnitudes on the same fault, we have obtained first the aspect ratio of the largest rupture scenario in the synthetic catalog for each source and from its characteristics and the scaling relations we have derived those of the smaller events. The worst cases, as well as the fault traces that we used for the Cádiz Bay area, are similar to the ones described in Lima et al. (2010); but accounting for maximum earthquake magnitudes of Mw = 8.6 in the Cadiz accretionary Wedge Fault (Figure 2). For the rest of the events, we have maintained constant the strike, dip and rake of the fault, as well as the length (L) - width (W) relation in order to have enough constraints to define the rest of the parameters from the event magnitude (Mw).
The scalar seismic moment equation (Aki, 1966) relates the size of the earthquake with the elastic properties of the media where the event is taking place, the dimensions of the rupture and the amount of slip on the fault plane:
where μ is the shear modulus of the upper lithosphere involved in the fault rupture, S is the area of the rupture that generates the earthquake, and D is the average displacement over the fault surface. In this study we have used a shear modulus of 3 × 10¹⁰ Pa, which is widely used for this area in the literature (Grandin et al., 2007; Gutscher et al., 2009; Omira et al., 2011; Roger et al., 2011), although higher values have also been proposed. To obtain the seismic moment we used the Kanamori (1977) relation:
To obtain the source dimensions from the earthquake magnitude the common practice is the use of an empirical relation adequate for the tectonic environment (Stirling et al., 2013). Some of the most commonly used empirical relationships are mainly developed for earthquakes occurred in continental lithosphere (e.g., Wells and Coppersmith, 1994; Leonard, 2010) or subduction context (Blaser et al., 2010; Strasser et al., 2010; Murotani et al., 2013), while for oceanic lithosphere the empirical relations are scarce and related to normal faulting events (Strasser et al., 2010; Álvarez-Gómez et al., 2012). Scholz (2002) proposed a relation between the length of the fault (L) and the average slip of the rupture (D) as a function of the ratio L/W and the tectonic environment. We have maintained this ratio constant for each fault and assumed an oceanic intraplate environment, which is coherent for a distributed deformation boundary. The relation proposed by Scholz (2002) takes the form:
The average displacement for the maximum magnitude event is obtained once the length of the fault is defined. The maximum length of the fault is constrained from the sea bottom mapping (Figure 2) while the width is limited by the maximum seismogenic depth. This depth varies from 50 km in the western area of the Gulf of Cádiz, where the oceanic lithosphere is coupled (Stich et al., 2005; Cunha et al., 2010; Geissler et al., 2010), to 25 km on its eastern edge where detachment levels exist at shallower depths in transitional or continental lithosphere (Medialdea et al., 2004; Pereira et al., 2011; Silva et al., 2017).
Once the L/W ratio is defined for each fault, combining eq. 8, L/W = constant for a fault and S = W.L in eq. 6, W can be obtained. All the parameters scales in relation with the source area defined from the earthquake magnitude (eq. 6).
Sea Level Statistical Analysis
In this study the statistical treatment of the tidal variation is incorporated towards a PTHA. Based on the data measured by the tidal gauge closest to the study zone, the sea level probability distribution function is obtained. The net sea level variation is due to atmospheric processes, such as atmospheric pressure changes, the effect of wind and due to the astronomical effects. The former contribution has a random nature, while the astronomical tides are deterministic. Therefore, from the tide gauge data, conducting a harmonic analysis both contributions can be separated and treated as different processes.
The astronomical tide is characterized once the main tidal components are identified and their amplitudes and phases are known. The longest frequency that we are able to consider is the one corresponding to the nodal cycle, which has a period of 18.6 years. With the information derived from the harmonic analysis, 18.6 years of astronomical tide elevations (covering a nodal cycle) with a 1 h resolution are reconstructed.
The 20-year sea level data to perform the statistical analysis has been obtained from a tidal gauge located in Bonanza (Figure 1). The Bonanza tidal gage is part of the REDMAR network from Puertos del Estado, it is located just at the end of harbor breakwater in the mouth of the Guadalquivir river. The Bonanza station is selected for several reasons: (1) it is the closest station to Cadiz (30 km away), it has records of more than 25 years, it is a high-quality station taking measurements of sea level every 1 minute, it is a station included in the Spanish Tsunami Early Warning System in the IGN for tsunami detection, this is why its high temporal sampling in taking sea level data. The other two nearest tide stations are the one in Huelva, 90 km away from Cádiz, located also in a mouth of the Odiel river, just in the directional dike, and the Tarifa station at 85 km located in the Strait of Gibraltar, where it is already affected by the tidal wave of the Mediterranean and the Atlantic; (2) Given the large scale of spatial and temporal variation of the tidal wave, the tide is almost the same in Huelva as in Bonanza, there is only a slight temporal lag; (3) In regards the meteorological tide (storm surge) slight variations in the storm surge regime was obtained between the three gauges; and (4) The effect of Guadalquivir river floods in the sea level is really small, the river is being regulated by upstream dams, the average flow discharge is less than 5 m^3/s, and in floods in rain storms the flow discharge is controlled with maximal 40 m^3/s, being the effect on the sea level very small at the mouth. Therefore, the collected sea level records at the Bonanza station have high quality to characterize the harmonics of the tidal wave and the storm surge regime.
The main components arising from the harmonic analysis, after applying the Tide software, are shown in Table 1.
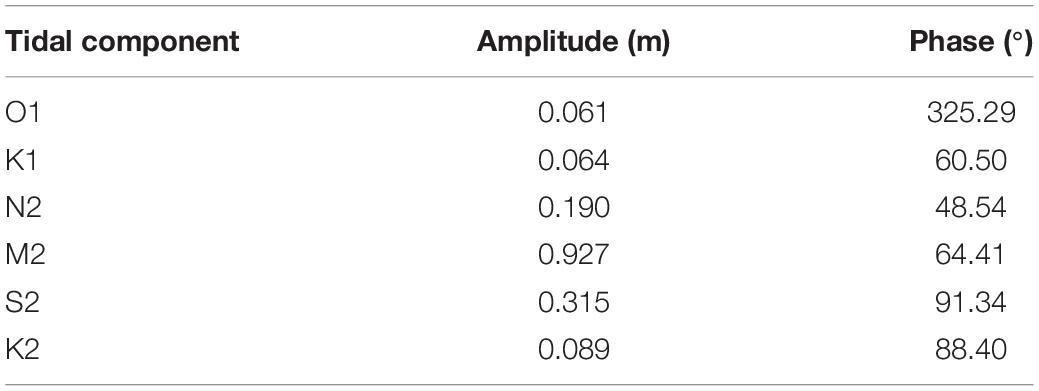
Table 1. Main components (amplitude and phase) in Bonanza.
On the other hand, the meteorological tide needs a statistical treatment in order to apply this information in a Monte Carlo method. The distribution function of the meteorological tide can be fitted to different theoretical distribution functions, such as the Gumbel distribution, given by the following expression:
where Fp represents the exceedance probability of a given meteorological tide Smm, Λ represents the localization parameter and Δ the scale parameter.
Once the localization and scale parameters of the selected distribution function are obtained, all the information needed in the Monte Carlo simulations is known.
To derive the meteorological tide, the astronomical tide has been reconstructed along the same tidal gauge data series period. Reconstructed data has been subtracted from the total sea level variation measured by the tidal gauge. The residue corresponds to the meteorological tide. The distribution function of the meteorological tide and the fit to a Gumbel distribution function is shown in Figure 4. As can be seen, two different tendencies are apparent in the meteorological distribution function. Because of that, two different Gumbel distribution functions have been fitted, one in the upper part representing the extremal regime and the other in the mean and lower part, representing the mean regime. In Table 2, the values corresponding to the location parameters and to the scale parameters for both regimes are shown.
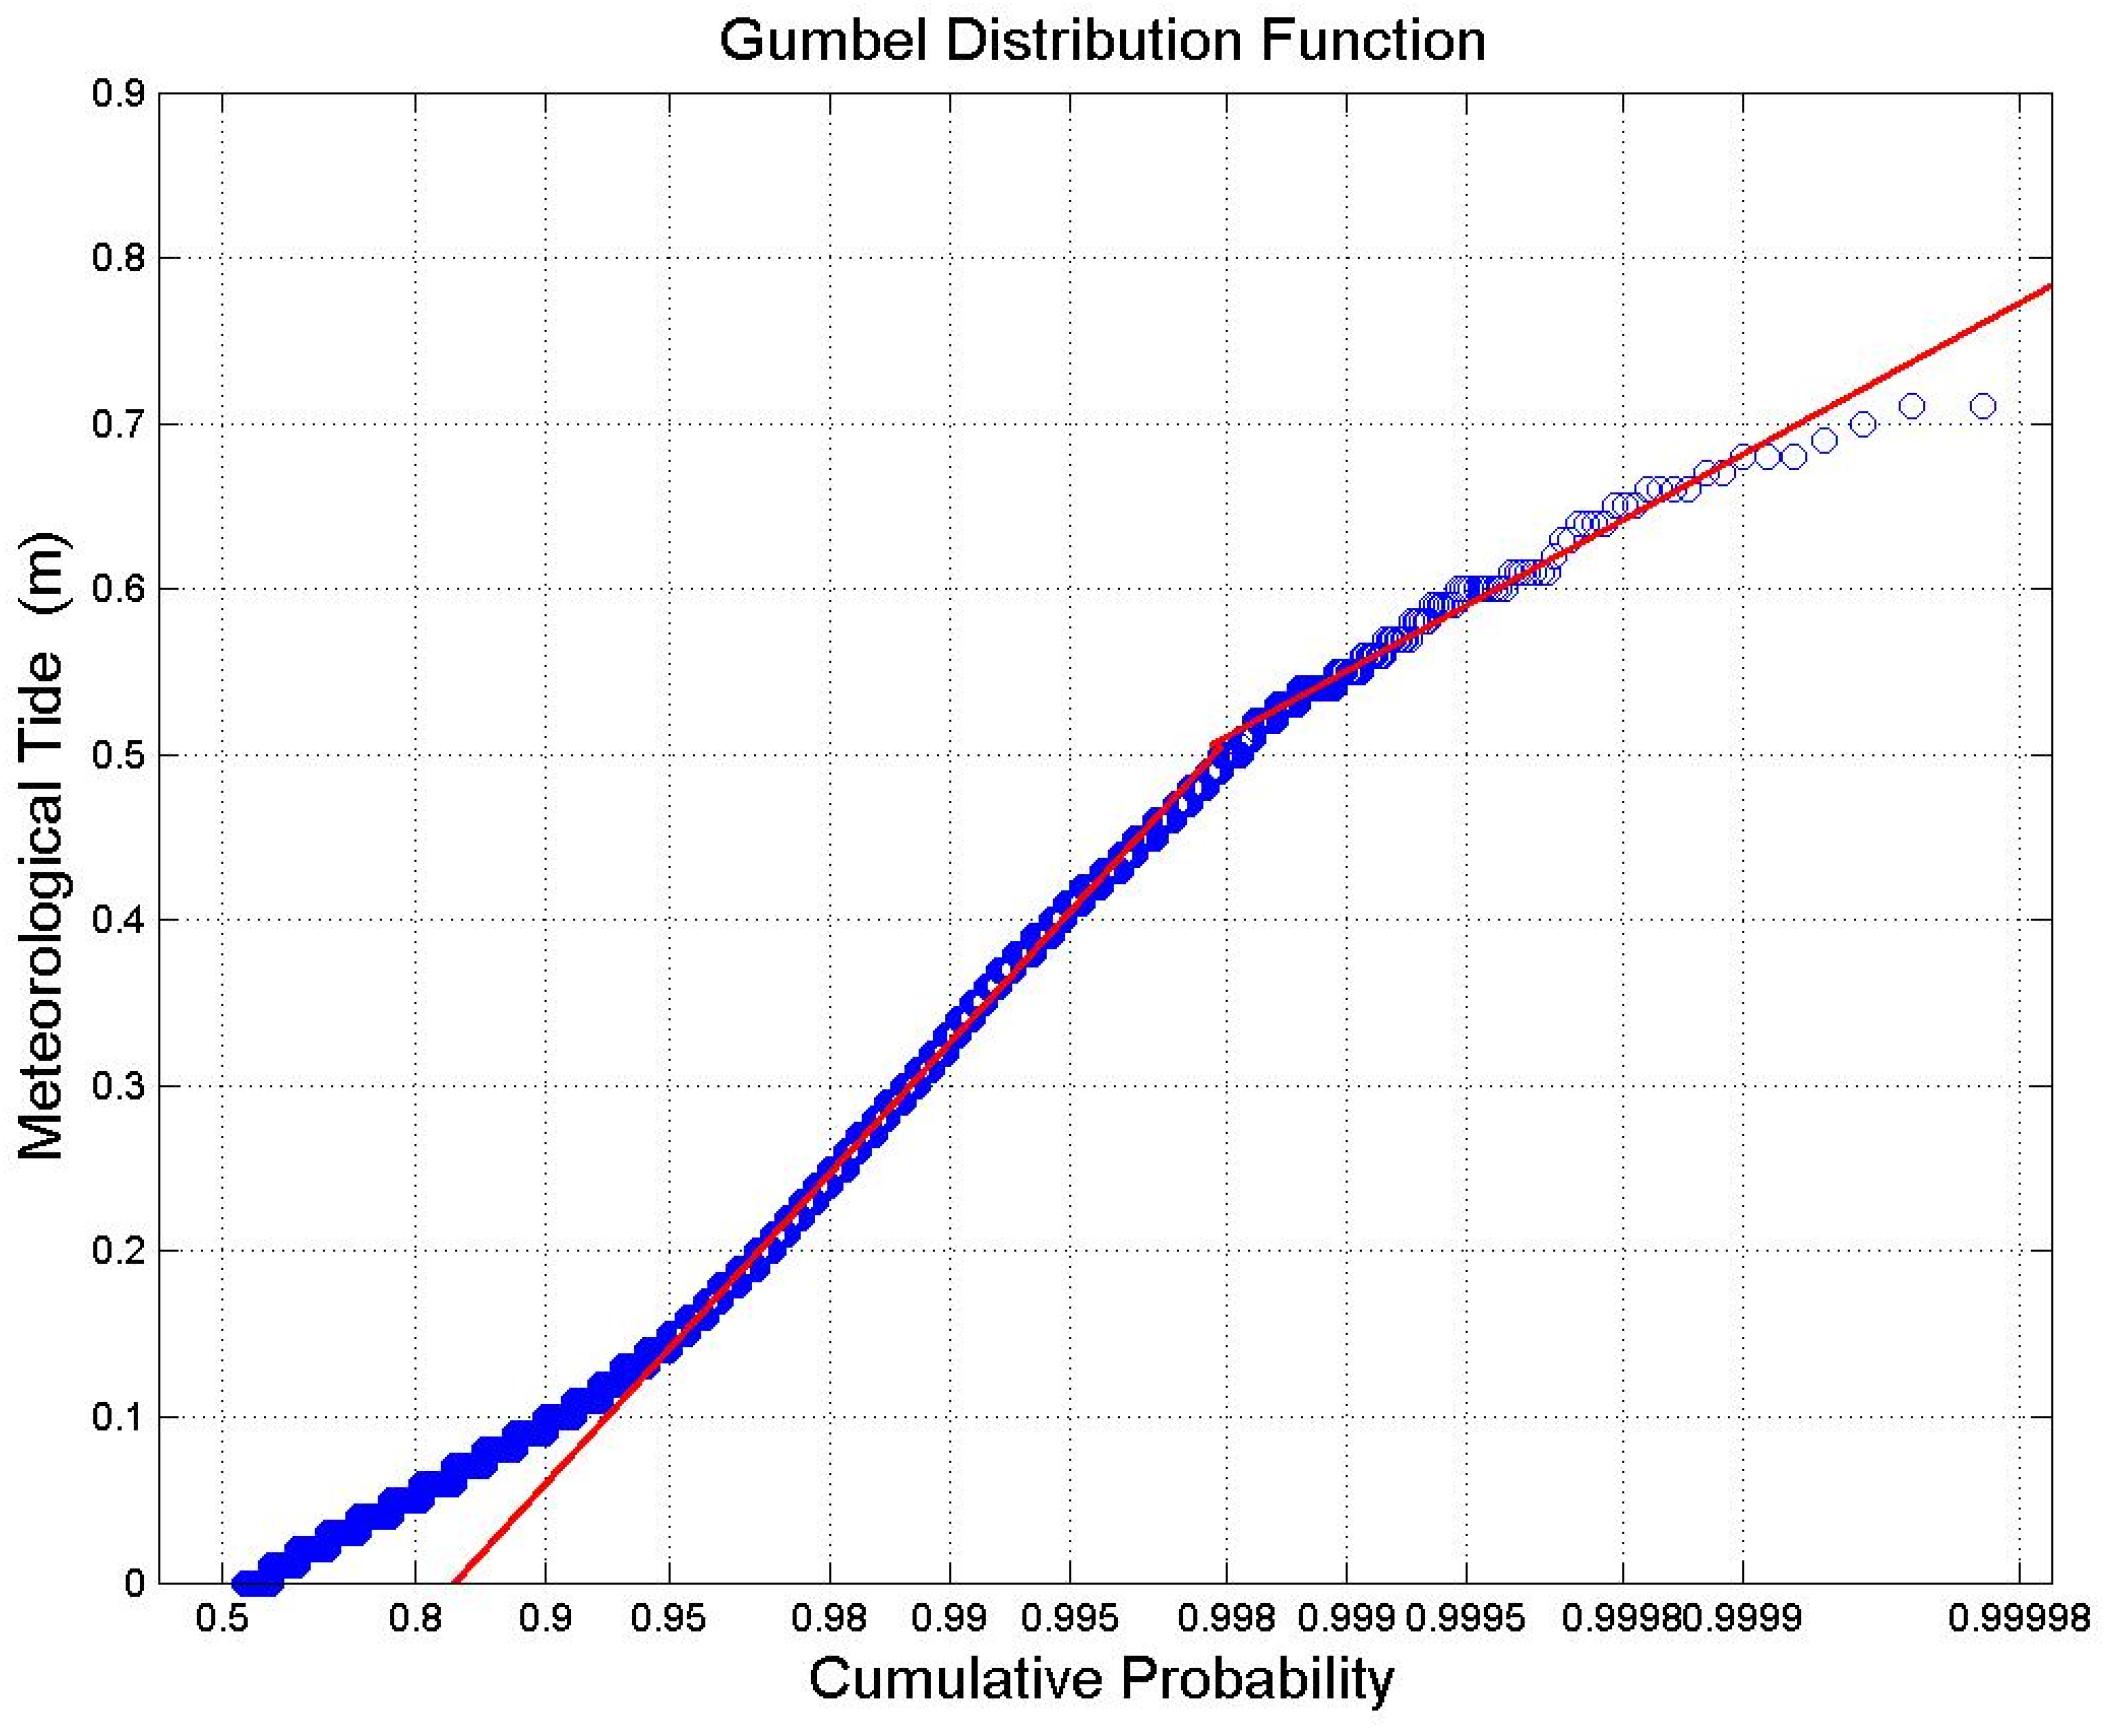
Figure 4. Meteorological tide distribution function and its fit to a Gumbel distribution function. Open circles indicate the empirical distribution function of the meteorological tide and straight lines represent the two fitted Gumbel distribution functions.
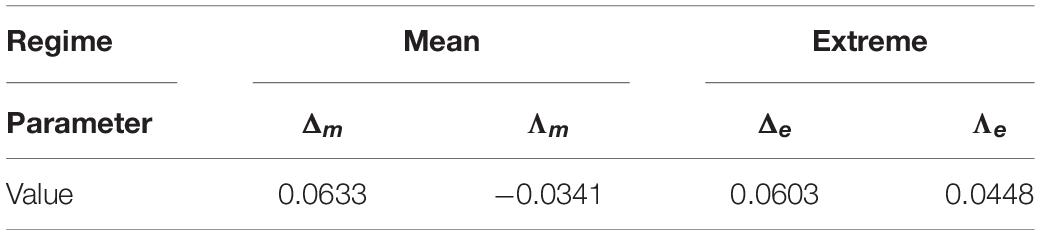
Table 2. Gumbel distribution function, localization, and scale parameters.
Monte Carlo Simulation Procedure
Based on the probabilistic characteristics of the sources, and by applying the Monte Carlo method, synthetic earthquake series are obtained for each of the considered faults. The time series corresponding to each fault are integrated to generate a global tsunamigenic earthquake and sea level catalog for the study region. The length of the time series in the present study was selected to 10000 years. To derive confidence bands, for each thematic map, we performed 1000 Monte Carlo simulations for each fault.
The steps followed in the Monte Carlo simulation for each fault (i) are the following (Figure 5):
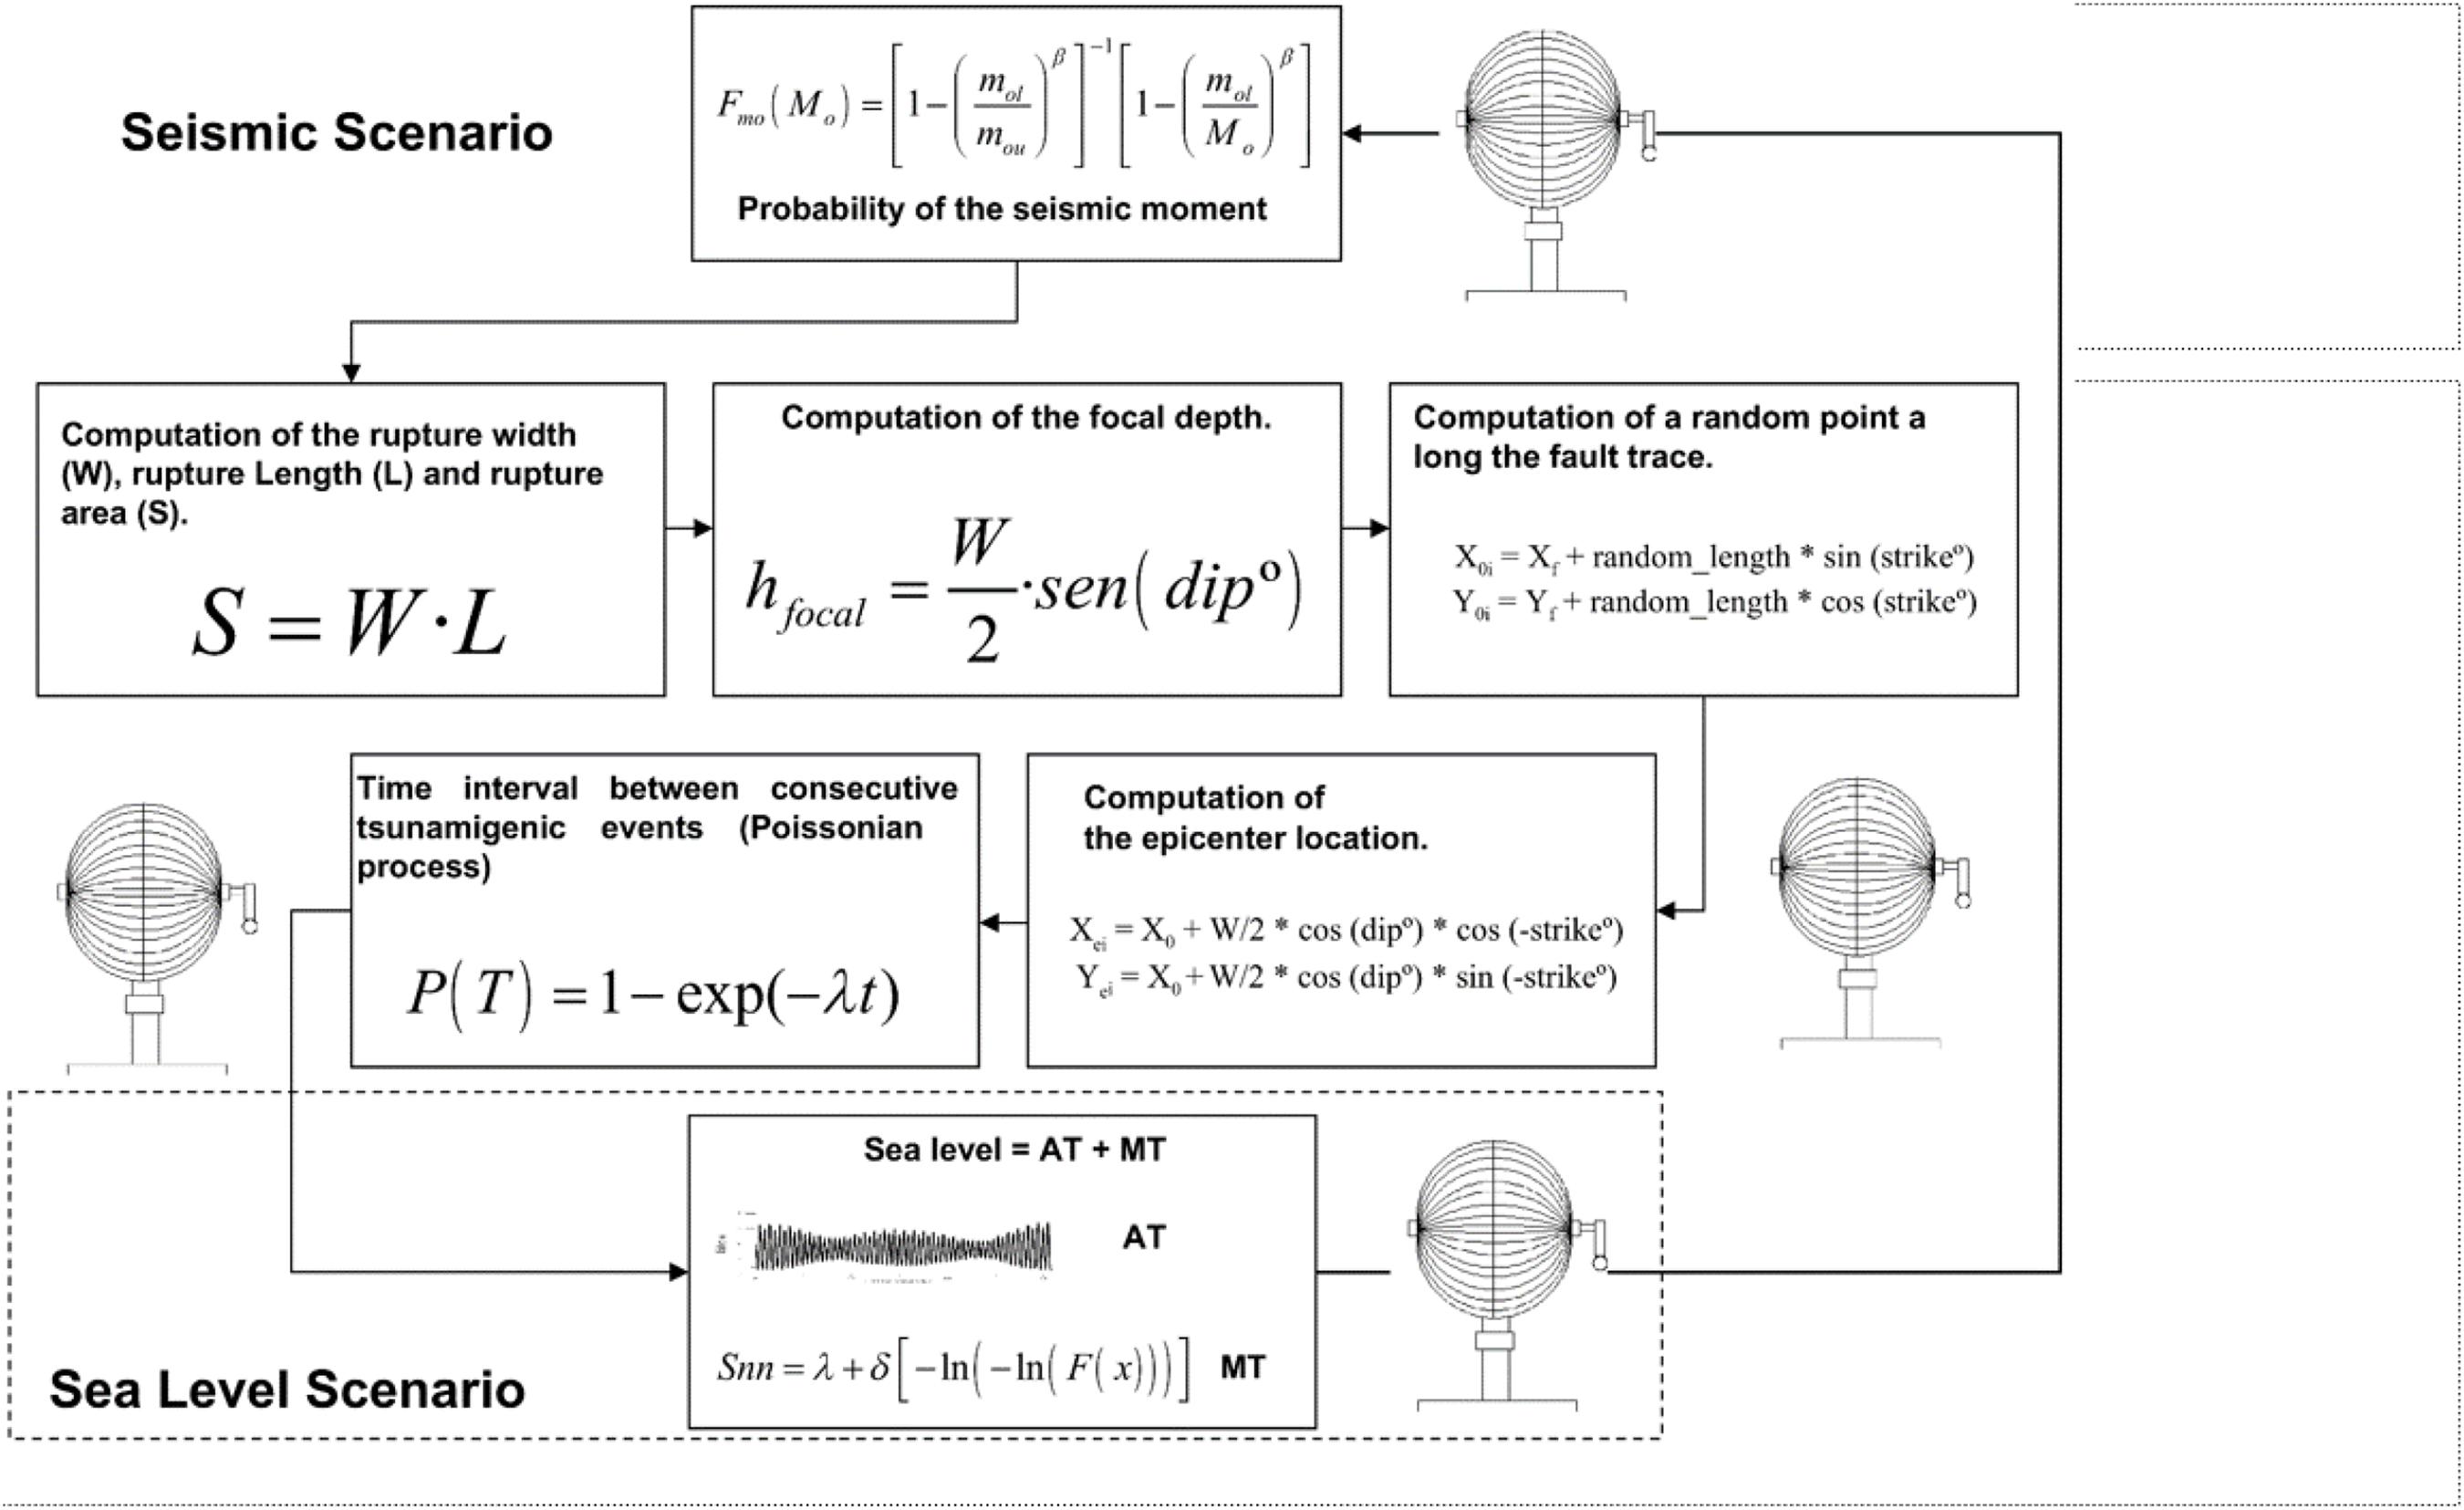
Figure 5. Summary of the algorithm used to generate the synthetic catalog of tsunamis.
(a) Generation of a random number for the probability of the seismic moment and computation of M0 (Eq. 3).
(b) Computation of the fault dimensions, rupture width (Wi), length (Li) and Area (Si = WixLi) using the selected scaling relations (Eqs. 6, 7, 8).
(c) Computation of the focal depth (hf) assuming surface rupture:
where δ is the fault dip and Wi the rupture width.
(d) Computation of the epicenter. For a given rupture length Li a random number of locations is generated along the rupture zone, leaving a distance of Li /2 on both sides of the rupture (Figure 6). Once the point along the rupture zone has been generated, and assuming that the rupture reaches the surface, the location of the epicenter is computed with the following equations:
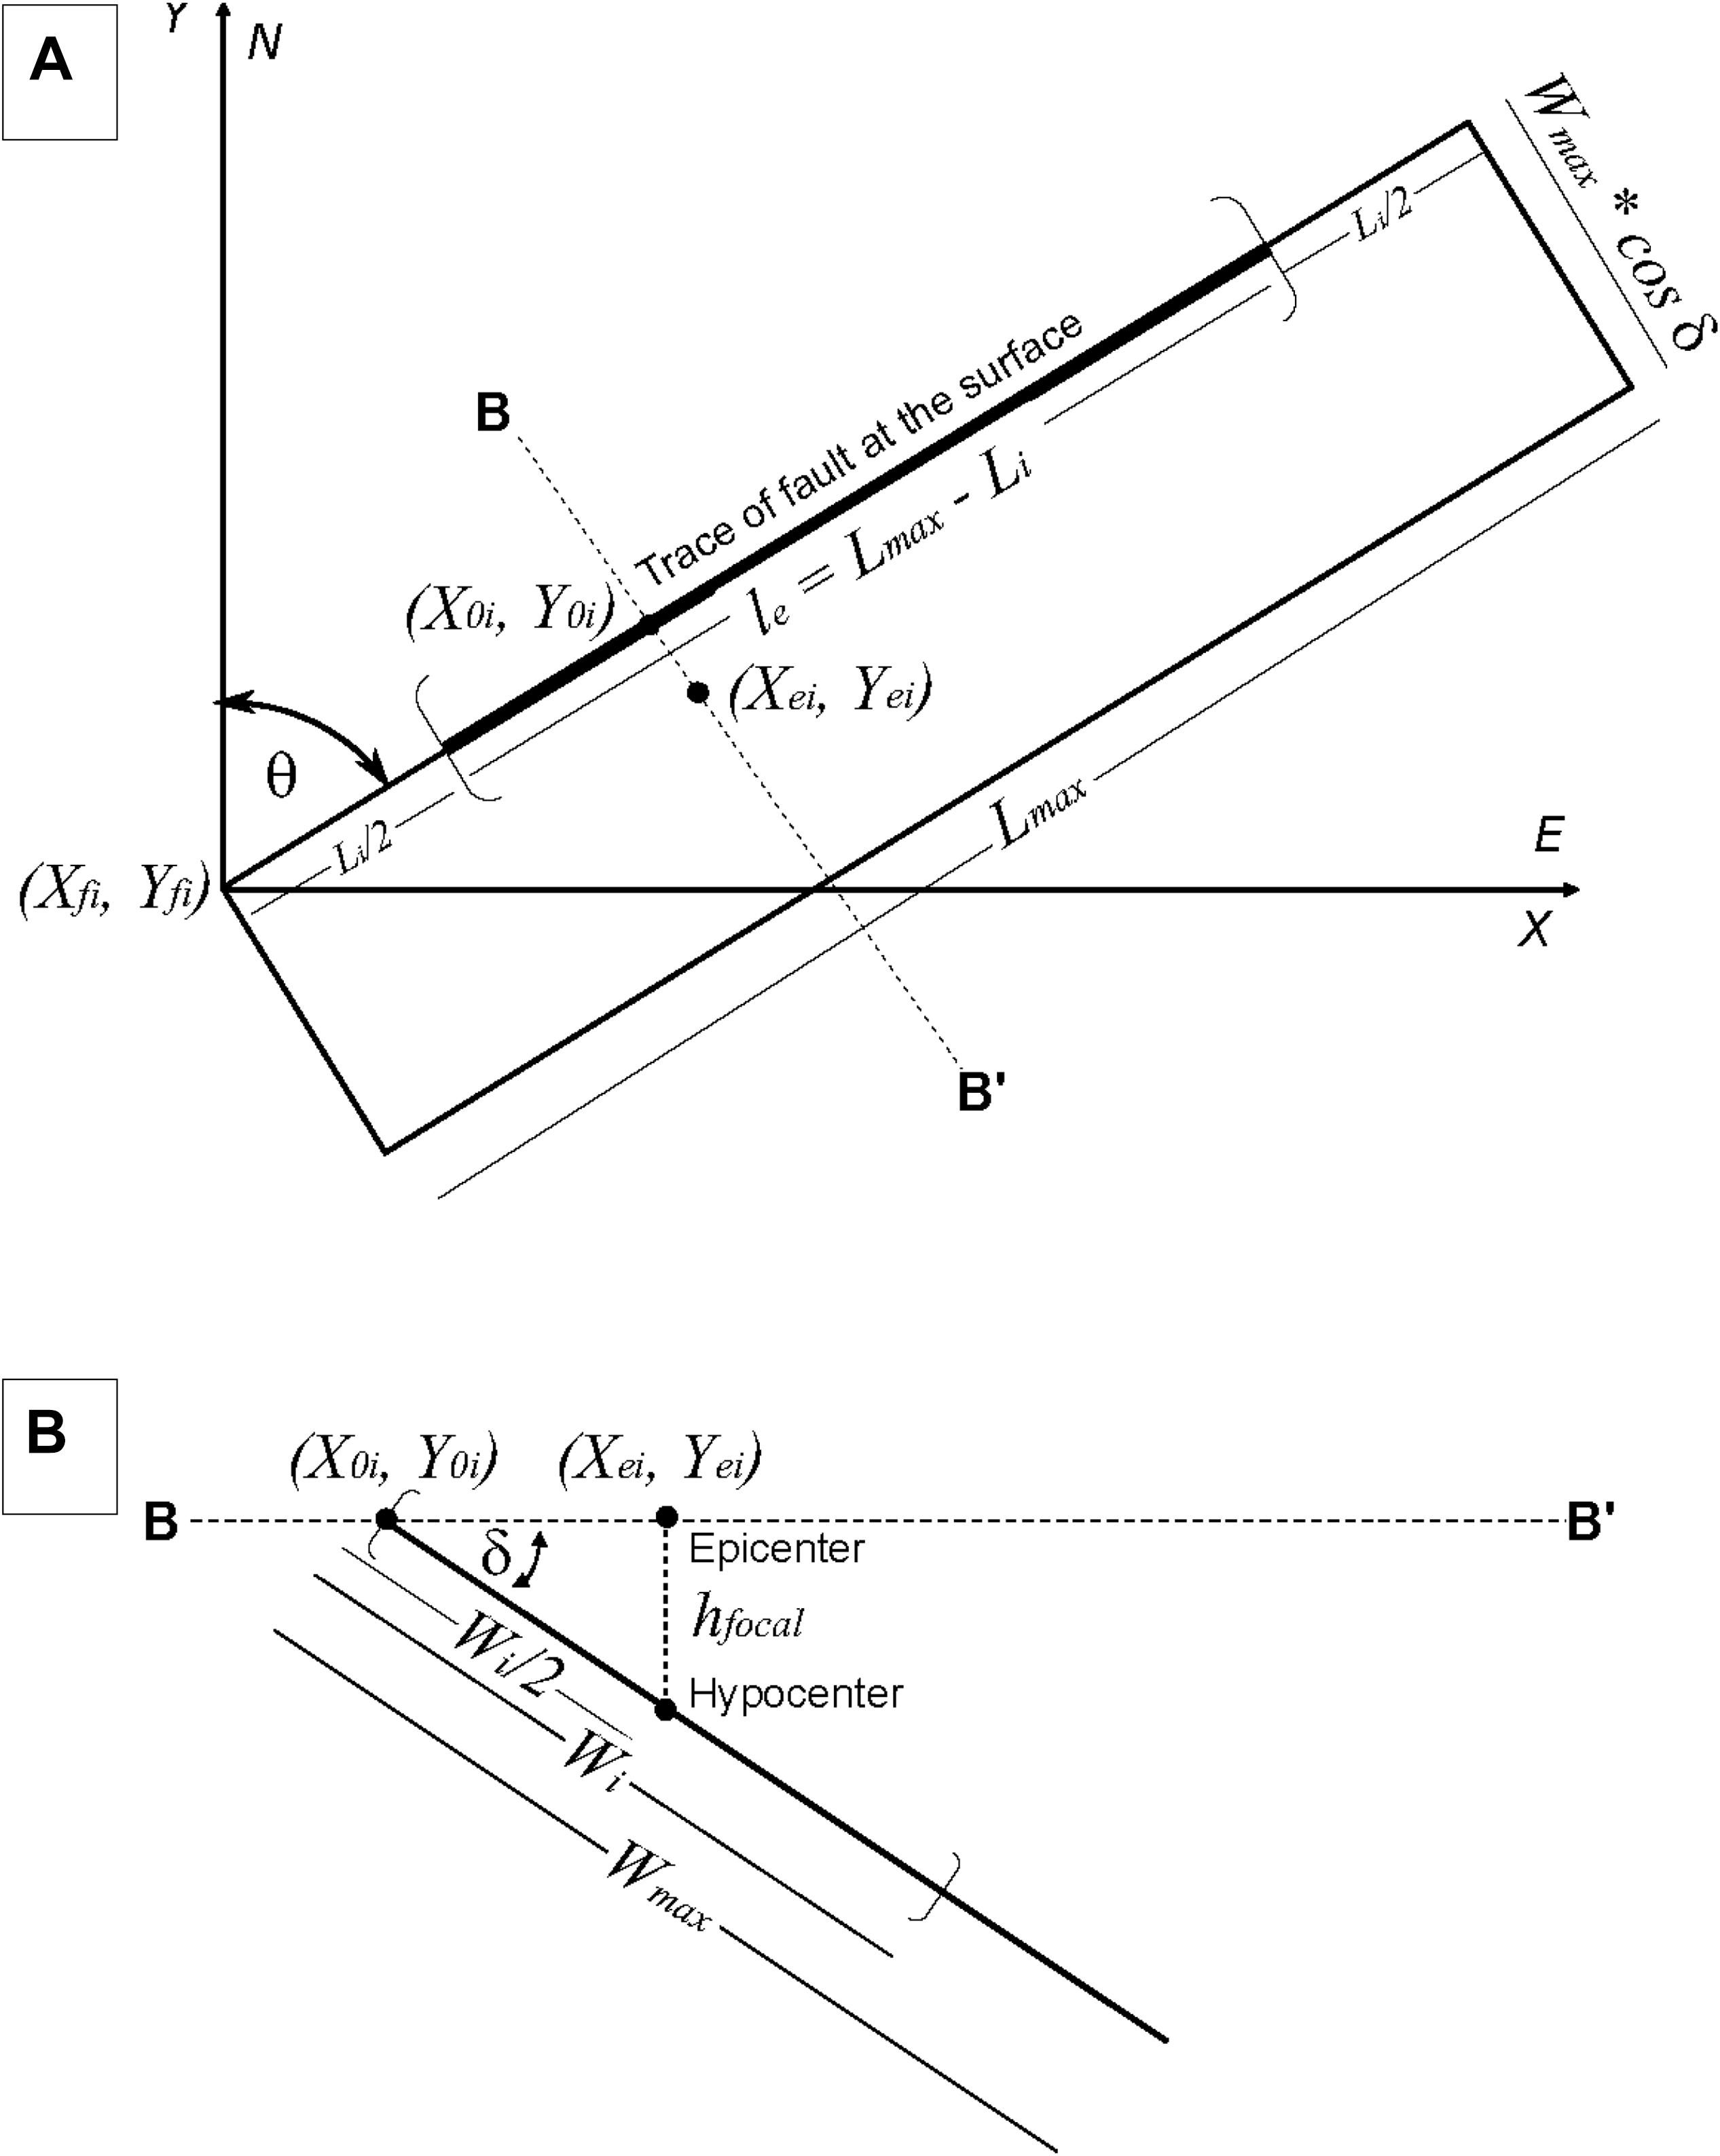
Figure 6. Fault parameters. (A) Map view; (B) Cross section B - B′.
where X0i and Y0i represent the longitude and the latitude of the middle point along the fault trace with length Li; Xei; and Yei represent the longitude and latitude of the epicenter for an earthquake with seismic moment Moi (Figure 6); σ is a random number between 0 and 1 (with uniform distribution); δ is the dip angle and θ is the strike angle and Lmax is the maximum rupture length for the fault. Thus, le (le = Lmax - Li) is the effective distance along the trace (see Figure 6), where the point (X0i,Y0i) associated to the epicenter can be located in a random way, for a given rupture length (Li). If the fault length Li = Lmax then only one point in the fault trace is possible and therefore only one epicenter location.
(e) Computation of the time interval from the last tsunamigenic earthquake event to the next. In the present methodology, earthquakes are assumed to be Poissonian processes; therefore, the probability P(T) of having the next earthquake in a time interval of t or higher is given by the following equation:
Generating a random number for the probability, the time of the interval between two consecutive earthquakes can be obtained. λ is the annual rate of tsunamigenic earthquakes of magnitude MWi or higher. Eq. 13 can be expressed as a function of P(T) to obtain the time t between two consecutive events:
(f) Generation of a random number for the time along a period of the 18.6 year astronomical sea level series. The astronomical tidal level corresponding to this random moment is considered as the tidal level coinciding with this earthquake event.
(g) Generation of a random number between 0 and 1 for the probability of the storm surge. With this random number, the storm surge Smm can be derived according to the following expression (see Eq. 9):
where F(x) is the cumulative probability.
(h) Computation of the net tidal level. In this step, the astronomic tidal level and the storm surge are linearly added.
We believe that the assumption of rupture to the surface in steps (c) and (d) concerns magnitudes higher than 6.5 is reasonable taking into account the mechanics of fracture of the schizosphere (the elasto-frictional upper layer of the crust). It is well recognized that major earthquakes nucleate at depth, where the strength of the rocks is higher due to thermo-mechanical conditions (Sibson, 1982). When an earthquake ruptures at depth, overcoming the high frictional strength of the faults, the amount of energy liberated during the earthquake is enough to allow the lateral and vertical propagation of the rupture, reaching the surface and propagating laterally (Scholz, 1998, 2002). Nevertheless, some of the modeled events, especially those with smaller magnitudes, where the surface rupture assumption could be more arguable, do not necessarily reach the surface in nature. Consequently this assumption could be a conservative bias in these cases. Nevertheless, being these events the smaller ones, and as we are using average uniform slip over the fault, this potential bias is reduced and is counterbalanced by the threat posed by the bigger events.
Steps “a” to “h” are repeated for each fault until a simulation of an established number of years is obtained (10000 years in our simulations). Once the synthetic earthquake series are derived for each fault, they all are joined in a single global synthetic catalog.
1000 different 10000-year long tsunamigenic seismic catalogs have been created for each fault. As an example, Figure 7A shows the evolution of one time series (10000-year) of the earthquakes (seismic moment magnitude) considering all the source regions. In Figure 7B, the sea levels corresponding to each of the simulated earthquake scenarios are represented. This figure shows that there are earthquakes that coincide with high sea levels, while others occur during the mean or low tide. These scenarios can create very different impacts on the coastal region.
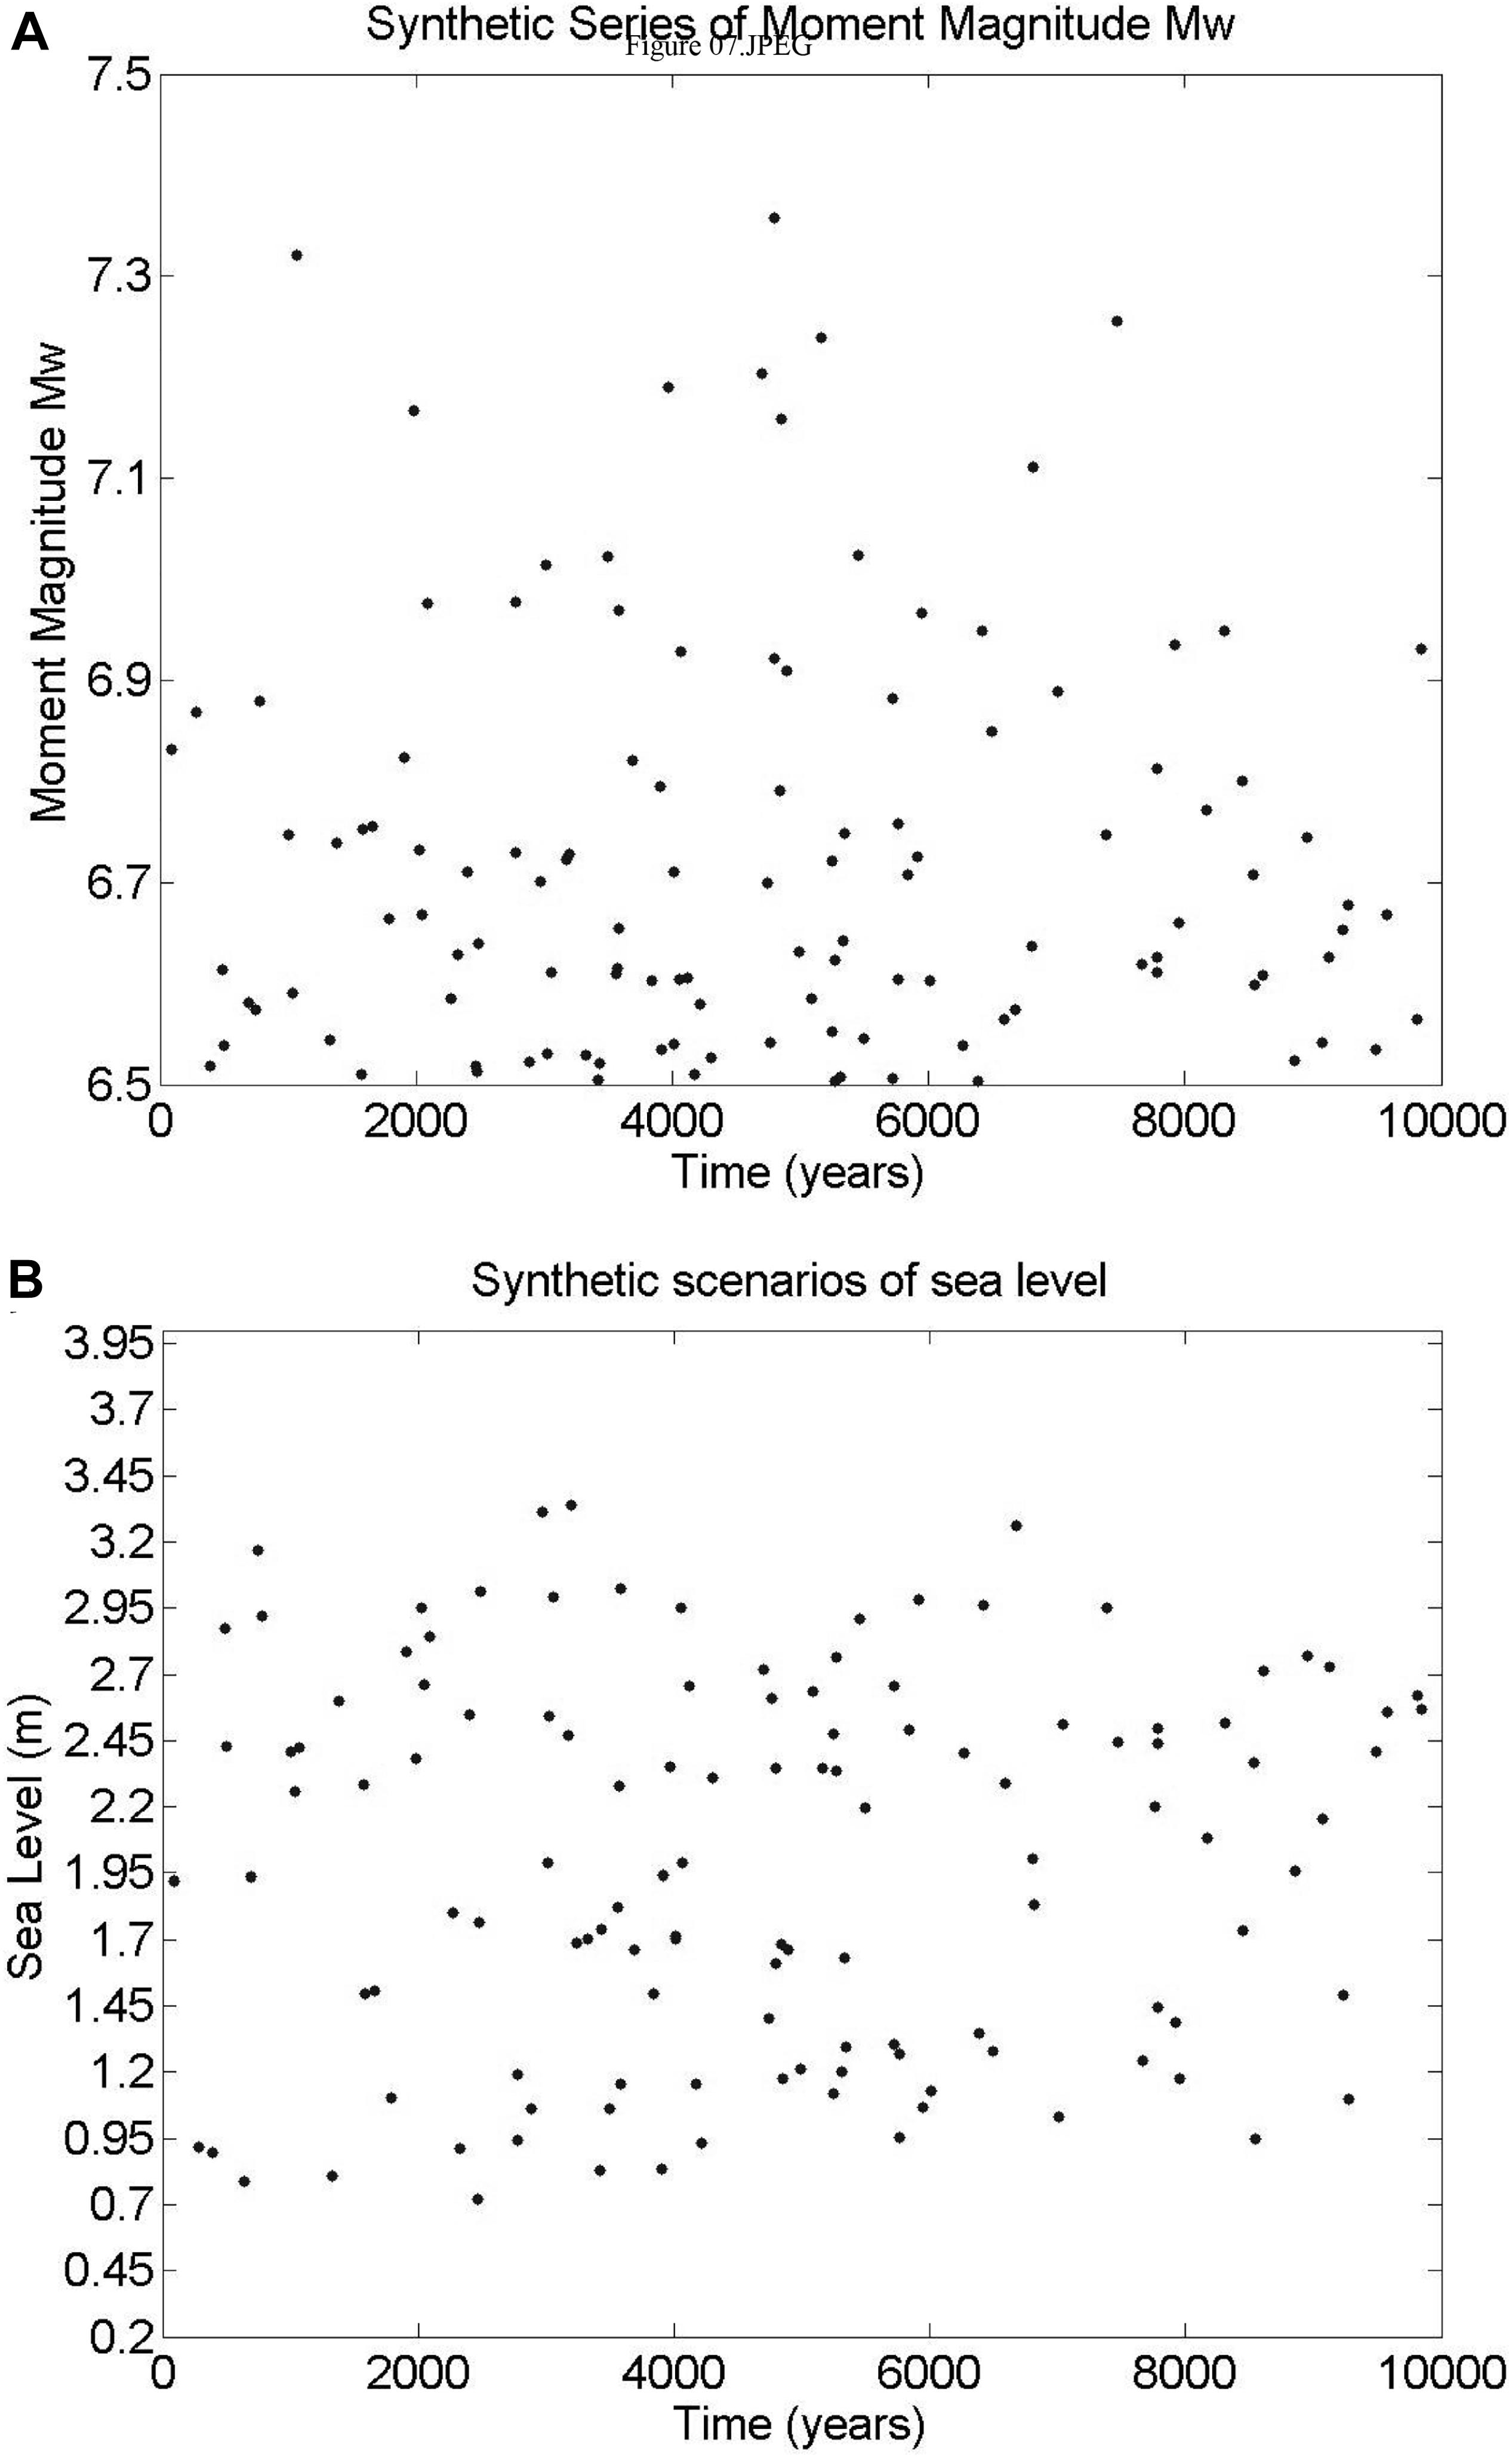
Figure 7. Example of one time series of Moment magnitude (10000 years) for seismic events greater than 6.5 in all source regions (A) and associated sea levels (B).
The distribution of the total number of synthetic events from all sources, in the 1000-year series is shown in Figure 8A; it is worth noting the maximum generated magnitude MW = 8.55. The epicenter location for each scenario is represented in Figure 8B.
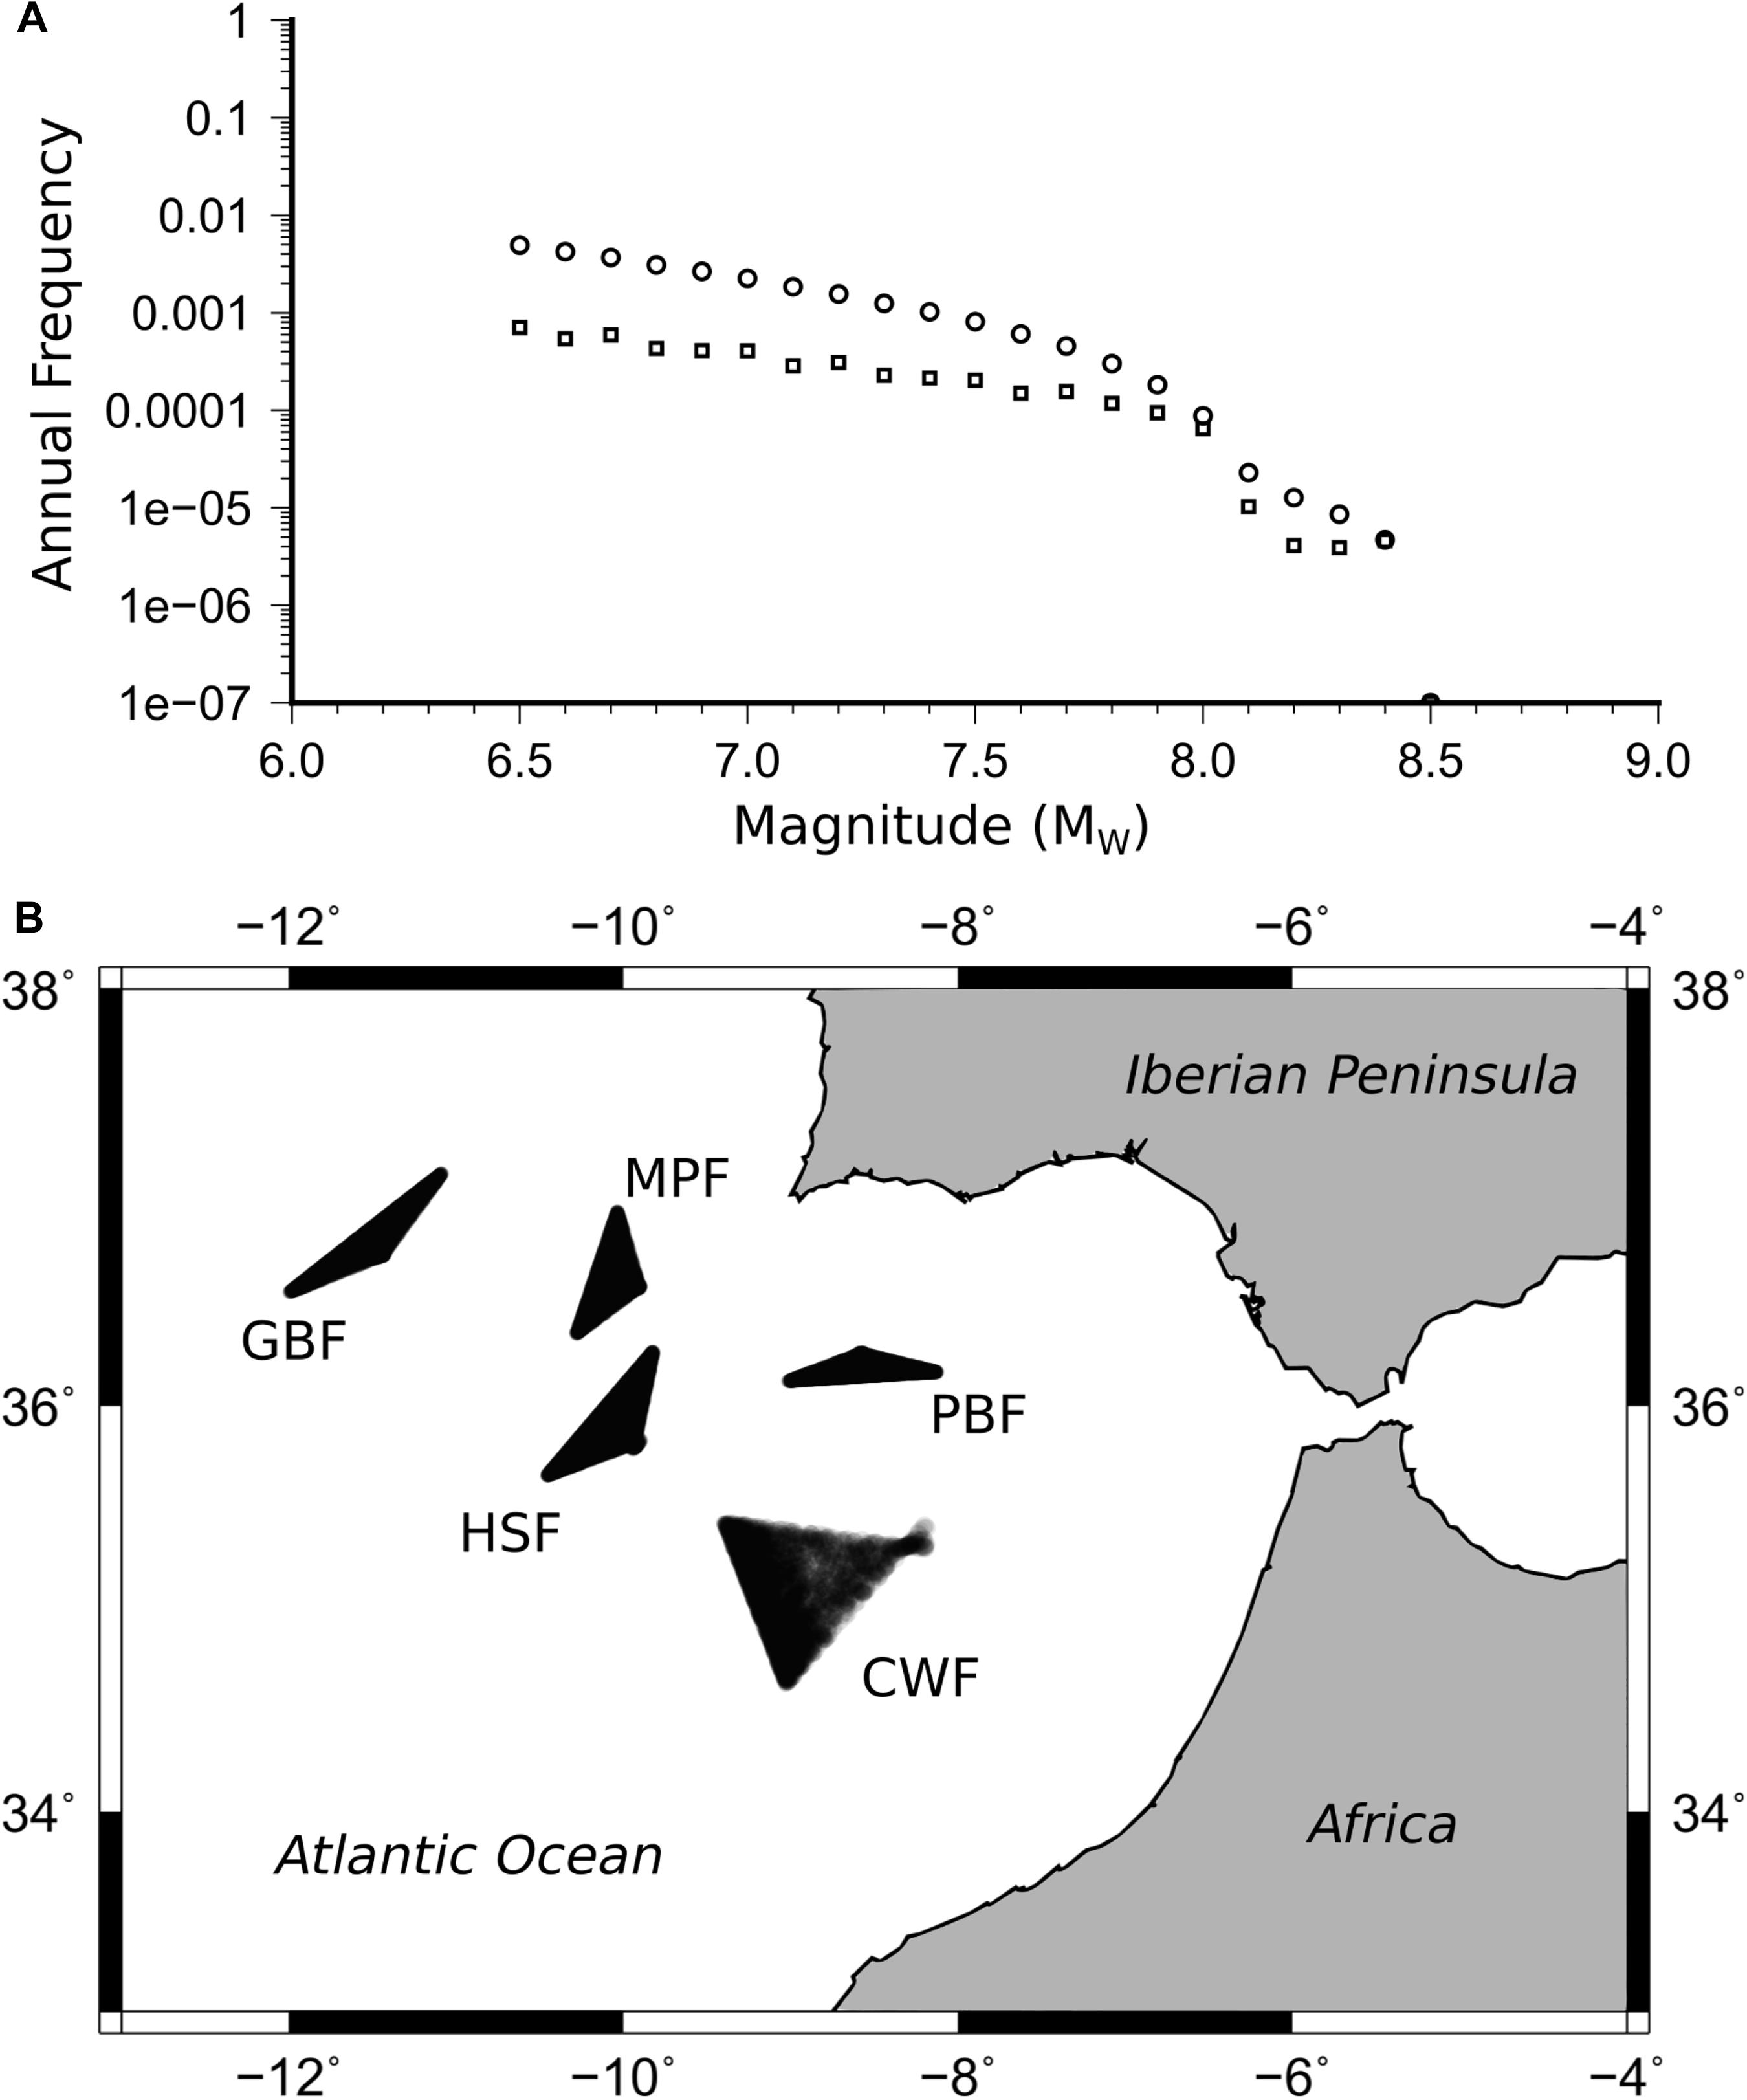
Figure 8. (A) Distribution of all synthetic generated magnitudes Mw in discrete (squares) and cumulative(circles) form, and (B) location of the synthetically generated epicenters for all the tsunamigenic earthquake scenarios.
Numerical Database
Once a synthetic catalog is generated (magnitude and epicenter location) based on (1) the synthetic earthquake series (magnitude and epicenter location) for each of the considered faults; and (2) the synthetic sea level series, it is necessary to assign for each synthetic tsunamigenic event in the catalog a flooding scenario on the coast. Thus, a numerical database of scenarios is needed. These scenarios should cover the entire range of possible tsunami events in the synthetic catalog (earthquakes and sea levels). Each tsunami scenario is propagated using a tsunami numerical model, from the source region to the coast (study zone). In this section the numerical model and the simulated scenarios are described.
Numerical Model
We used the C3 (Cantabria-Comcot-Tsunami-Claw) numerical model to simulate the wave generation, propagation and coastal flooding (Olabarrieta et al., 2011). This model integrates finite difference and finite volumes model schemes, and solves the conservative form of the Non-Linear Shallow Water equations (NLSW), considering a Cartesian coordinate system.
These equations constitute a hyperbolic system that can be expressed by the following general conservation equation:
where q represents the vector of the conserved variables, f and g are the numerical flux vectors and s represents the source terms. These vectors are expressed in function of variables such as the water depth H = (h + ξ) and the vertically integrated flow velocities (u, v)
where ξ is the free surface elevation; x, y represent both components of the Cartesian coordinate system; g is the gravitational acceleration; ρ is the water density; h is the water depth at rest and τx, τy are the terms that represent the bottom shear stress.
The model solves the differential form of the mass and momentum conservation equations, applying a leap-frog scheme, based on the COMCOT numerical model of Liu et al. (1995). In the inner (detailed) nested grids a finite volume method (George and LeVeque, 2006) is applied to solve the integral form of the conservative equations. The C3 model (Olabarrieta et al., 2011) has been validated in the framework of the European Project TRANSFER using the standards and guidelines proposed by Synolakis et al. (2007).
The datasets used for the bathymetry and topography reconstruction are the Weatherall et al. (2015) database for the regional grids improved with the SWIM database (Zitellini et al., 2009). For the internal, more detailed bathymetric grids, we digitized the nautical charts of the Navy Hydrographic Institute of Spain. The topography and the geographical data used is from the National Geographic Institute of Spain (Figure 9).
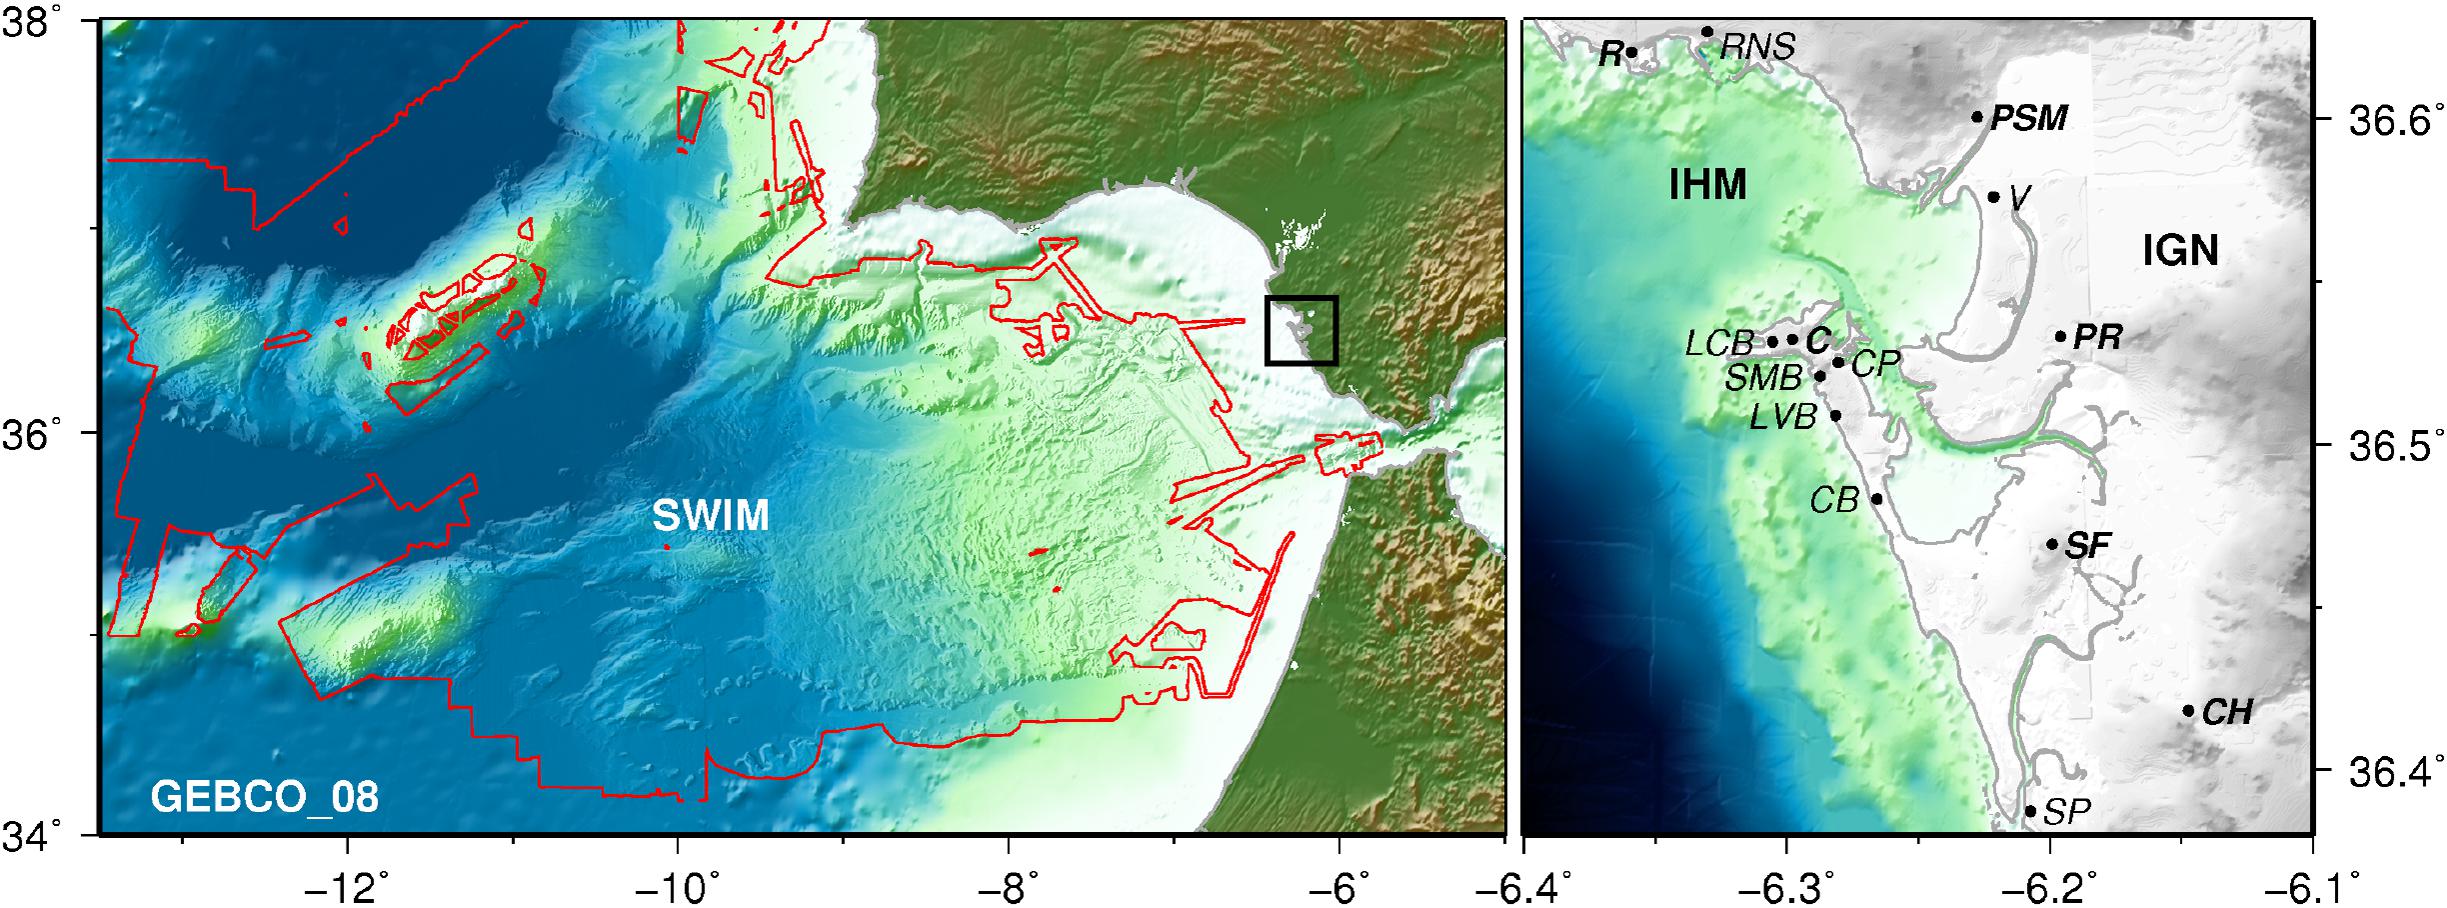
Figure 9. Topo-bathymetric grids. GEBCO data, SWIM: Zitellini et al. (2009) bathymetric data (The red line is the limit of the high resolution SWIM bathymetry), IHM: Instituto Hidrográfico de la Marina (Navy Hydrographic Institute) data (the black square is the limit of the high resolution local bathymetry IHM), IGN: Instituto Geográfico Nacional (National Geographic Institute) data. Labels in italic font type show the locations commented in the text: R, Rota; RNS, Rota Naval Station; PSM, Puerto de Santa María; V, Valdelagrana; C, Cádiz; CP, Cádiz Port; LCB, La Caleta Beach; SMB, Santa María Beach; LVB, La Victoria Beach; CB, Cortadura Beach; PR, Puerto Real; SF, San Fernando; CH, Chiclana; SP, Sancti Petri.
Three different nested grids have been used to run the numerical model. From the regional bathymetry used to propagate the wave from the source, with a resolution of 864 m, to the detailed grid that includes the topography and local bathymetry with a cell size of 50 m. Between them we used an intermediate grid with a resolution of 216 m.
The submerged profile of the beaches in the area is characterized by the existence of a rocky slab at a water depth of about 5 m and several sandy shoals. In front of the Cádiz urban area there are several elongated shoals and rocky bars (Figure 9). These morphological features play an important role in the local tsunami wave propagation.
Simulated Scenarios
A set of tsunami scenarios are considered for tsunami propagation and for the creation of the tsunami datasets. These cases cover the entire range of possible tsunami scenarios in each zone (potential sources, earthquake magnitudes, and epicenter locations), together with all the possible sea levels.
To establish the tsunamigenic earthquake scenarios in each fault, the relation between the seismic moment magnitude and the rupture area has been taken into account. The width of the fault (W) is constrained by the L/W constant ratio for each fault and the momentum magnitude (eqs. 6-8). The relation between the momentum magnitude and the rupture area for each fault is shown as example for CWF Fault. A sensitivity analysis was carried out to define the minimal area of rupture that generates the earthquake and it was defined as 500 km2. Based on a geological analysis of each fault, the maximal rupture area in this case for CWF fault was defined as 15.000 Km2. Thus, the definition of moment magnitudes was obtained for areas between 500 km2 and 15.000 km2 each ΔS = 500 km2, with minimal moment magnitude of 6.5 and maximal of 8.4, generating 31 magnitude events. As the magnitude increases, the area also increases exponentially. It is noteworthy that moment magnitudes selected are not equidistant, a change in the magnitude generates a higher variation in the area when the magnitude is large. Therefore, a larger number of scenarios have been considered for the big magnitudes.
On the other hand, in each fault, up to 4 different epicenter locations have been considered for each magnitude. The number of epicenter locations for a specific magnitude event, in a specific fault, depends on the moment magnitude (it defines the source size) and the maximal size of each fault. In the case of smaller magnitude events the size of the source is also small and more epicenter locations can be distributed along the fault. In the case of CWF fault, the largest fault in the area, 4 possible epicenters distributed along the fault were selected for magnitudes between 6.5 and 7.2, 3 for magnitudes 7.3 to 7.6, 2 for magnitudes 7.7 to 8.0 and just 1 epicenter location is possible for magnitudes larger than 8.0. The combination of magnitudes and epicenter locations on CWF fault led to 53 possible earthquake scenarios.
A sensitivity analysis was carried out to evaluate the sea level ranges based on numerical simulations and taking into account the computational time constraints. This analysis allowed considering 4 sea level ranges (Δsl = 1.0 m). In Table 3 the selected tidal levels are indicated where the reference level corresponds to the mean low spring tidal level.
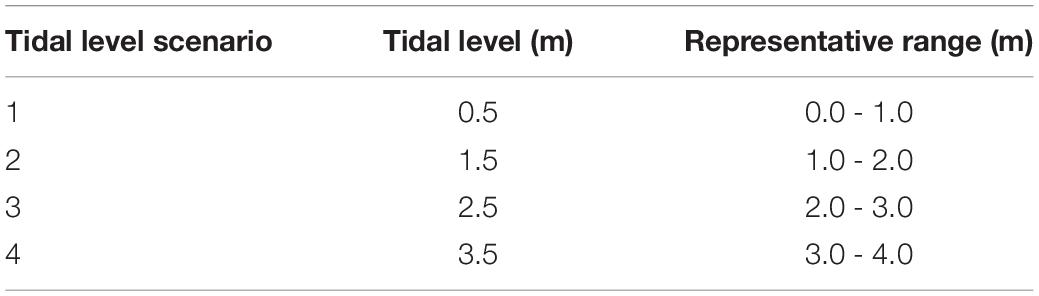
Table 3. Considered tidal level scenarios (the reference level corresponds to the mean low spring tidal level).
Finally, the combination of magnitudes, epicenter location and sea levels for the CWF fault requires the simulation of 212 scenarios.
A total of 619 scenarios have been modeled (Table 4) using the C3 numerical model. The numerical simulations were performed in the Altamira Supercomputer which is part of the Spanish Supercomputation network. This supercomputer is operated by IFCA (Cantabrian Physics Institute) and it has 512 processors able to manage 4.5 billion of operations per second.
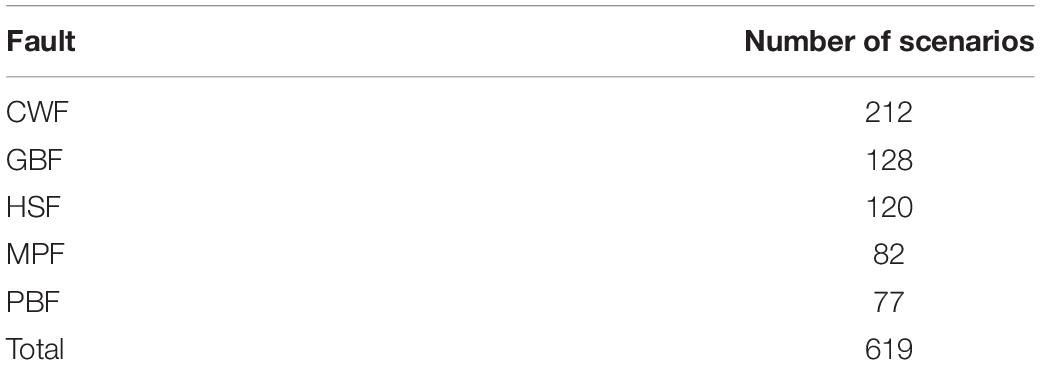
Table 4. Number of considered scenarios in each fault.
Probabilistic Thematic Hazard Maps
Once the 1000 time series of tsunamigenic earthquake events, coinciding with a given sea level, are created in the Monte Carlo computation, the effect of each tsunami on the coast is obtained using the numerical database generated in the previous steps. An algorithm written in Matlab® was used for this purpose. For each scenario in the synthetic catalog, the closest case (sea level + earthquake) in the numerical database was identified. For the interpolation of the events of the synthetic catalog, we start from the basis of a 3D matrix of numerically modeled scenarios, with three inputs: magnitude, location of the epicenter and sea level. For a synthetic event of a given magnitude, the closest modeled magnitude is searched in the matrix, for this closest magnitude, the closest modeled epicenter to the synthetic catalog is searched among the modeled epicenters, and finally, the corresponding event with the closest sea level is searched in the matrix. Thus, the event of the synthetic series is associated with the closest simulated event in magnitude, location of the epicenter and sea level. The tsunami intensity measures corresponding to this numerical case (maximum current speed, maximum water depth, maximum wave elevation, maximum Froude number, and maximum force) are assigned to the tsunamigenic earthquake in the synthetic catalog. Total forces, consider hydrostatic and hydrodynamic forces as defined in FEMA (2000), and are associated with a drag coefficient CD, which represents the shear coefficient which depends on the bottom roughness, on the Reynolds number and on the geometry of the structures in the flooding area. CD is based on FEMA (2000); Synolakis (2003); Yeh (2006), which provided recommended shear coefficient values for various obstacle geometries.
The time series of the tsunami intensity measures can be derived for the whole coastal region following the described procedure. Therefore, these time series of the maximum value can be used to perform a statistical analysis of the selected tsunami intensity measures and derive maps with an associated return period.
Once the time series are reconstructed in each high-resolution grid node, these data are sorted in an ascendant order. The cumulative probability is assigned to each organized scenario. This is given by its position, i:
where i represents the data position and m represents the total number of data. The distribution function of the analyzed parameter vi is given by the following expression:
where FZi (v) is the annual exceedance probability and λ is the tsunamigenic earthquakes annual rate. For the computation of return period Tr the following expression is used:
where Tr represents the mean number of years in which the variable vr exceeds a given value.
For each return period and each synthetically generated catalog, a value of the study variable is obtained in all the grid nodes. Therefore, for a given return period, the analyzed variable can be mapped in the high-resolution grid. If several synthetically generated earthquake and sea level catalogs are used, the value of the analyzed parameter for a given return period will present a mean value and a variance. Computing the distribution function of the values obtained for the given return period, the value for a given return period with a given confidence can be obtained.
For a given return period it is possible in each grid point of the detailed mesh (the flooding area) to obtain the desired parameter (e.g., maximum water depth) using the grid point distribution function. The representation on a map of this parameter for all the grid points allow us to produce thematic maps for specific return periods.
In the present study, return periods of 500, 1000, 5000, and 10000 years with a confidence band of 99% have been considered. This confidence band is representative of the mean extreme events. Other confidence bands can easily be derived.
Results
The probabilistic methodology applied to the Cádiz test-site enables the generation of different thematic maps in the study region. These maps do not represent the impact generated by a single tsunamigenic earthquake but the combined effect of different earthquakes in the area. For example, it is possible that an earthquake scenario generates a big impact in La Victoria beach but has a minor impact in Rota. However, another earthquake can generate a big impact in Rota and yet has a small effect in La Victoria. In these maps both Rota and La Victoria will appear to have a great impact, merging the effects of both earthquakes.
The maximum tsunami wave elevation is plotted only in those areas covering the intertidal zones and in those areas above this zone that are flooded due to tsunamis (Figure 10). For a 500-year return period the effects due to tsunamis are very low, and they are restricted to very specific areas. The area showing the highest sea surface elevations corresponds to the harbor of Cádiz and Rota. As expected, as the return period increases, the flooded area also increases, especially in the inner zone of Cádiz Bay as well as in the Sancti Petri zone. In Cádiz city, several beaches such as La Caleta, Santa María del Mar, Victoria, and Cortadura, are affected by the combined effect of sea level (tides) and tsunamis.
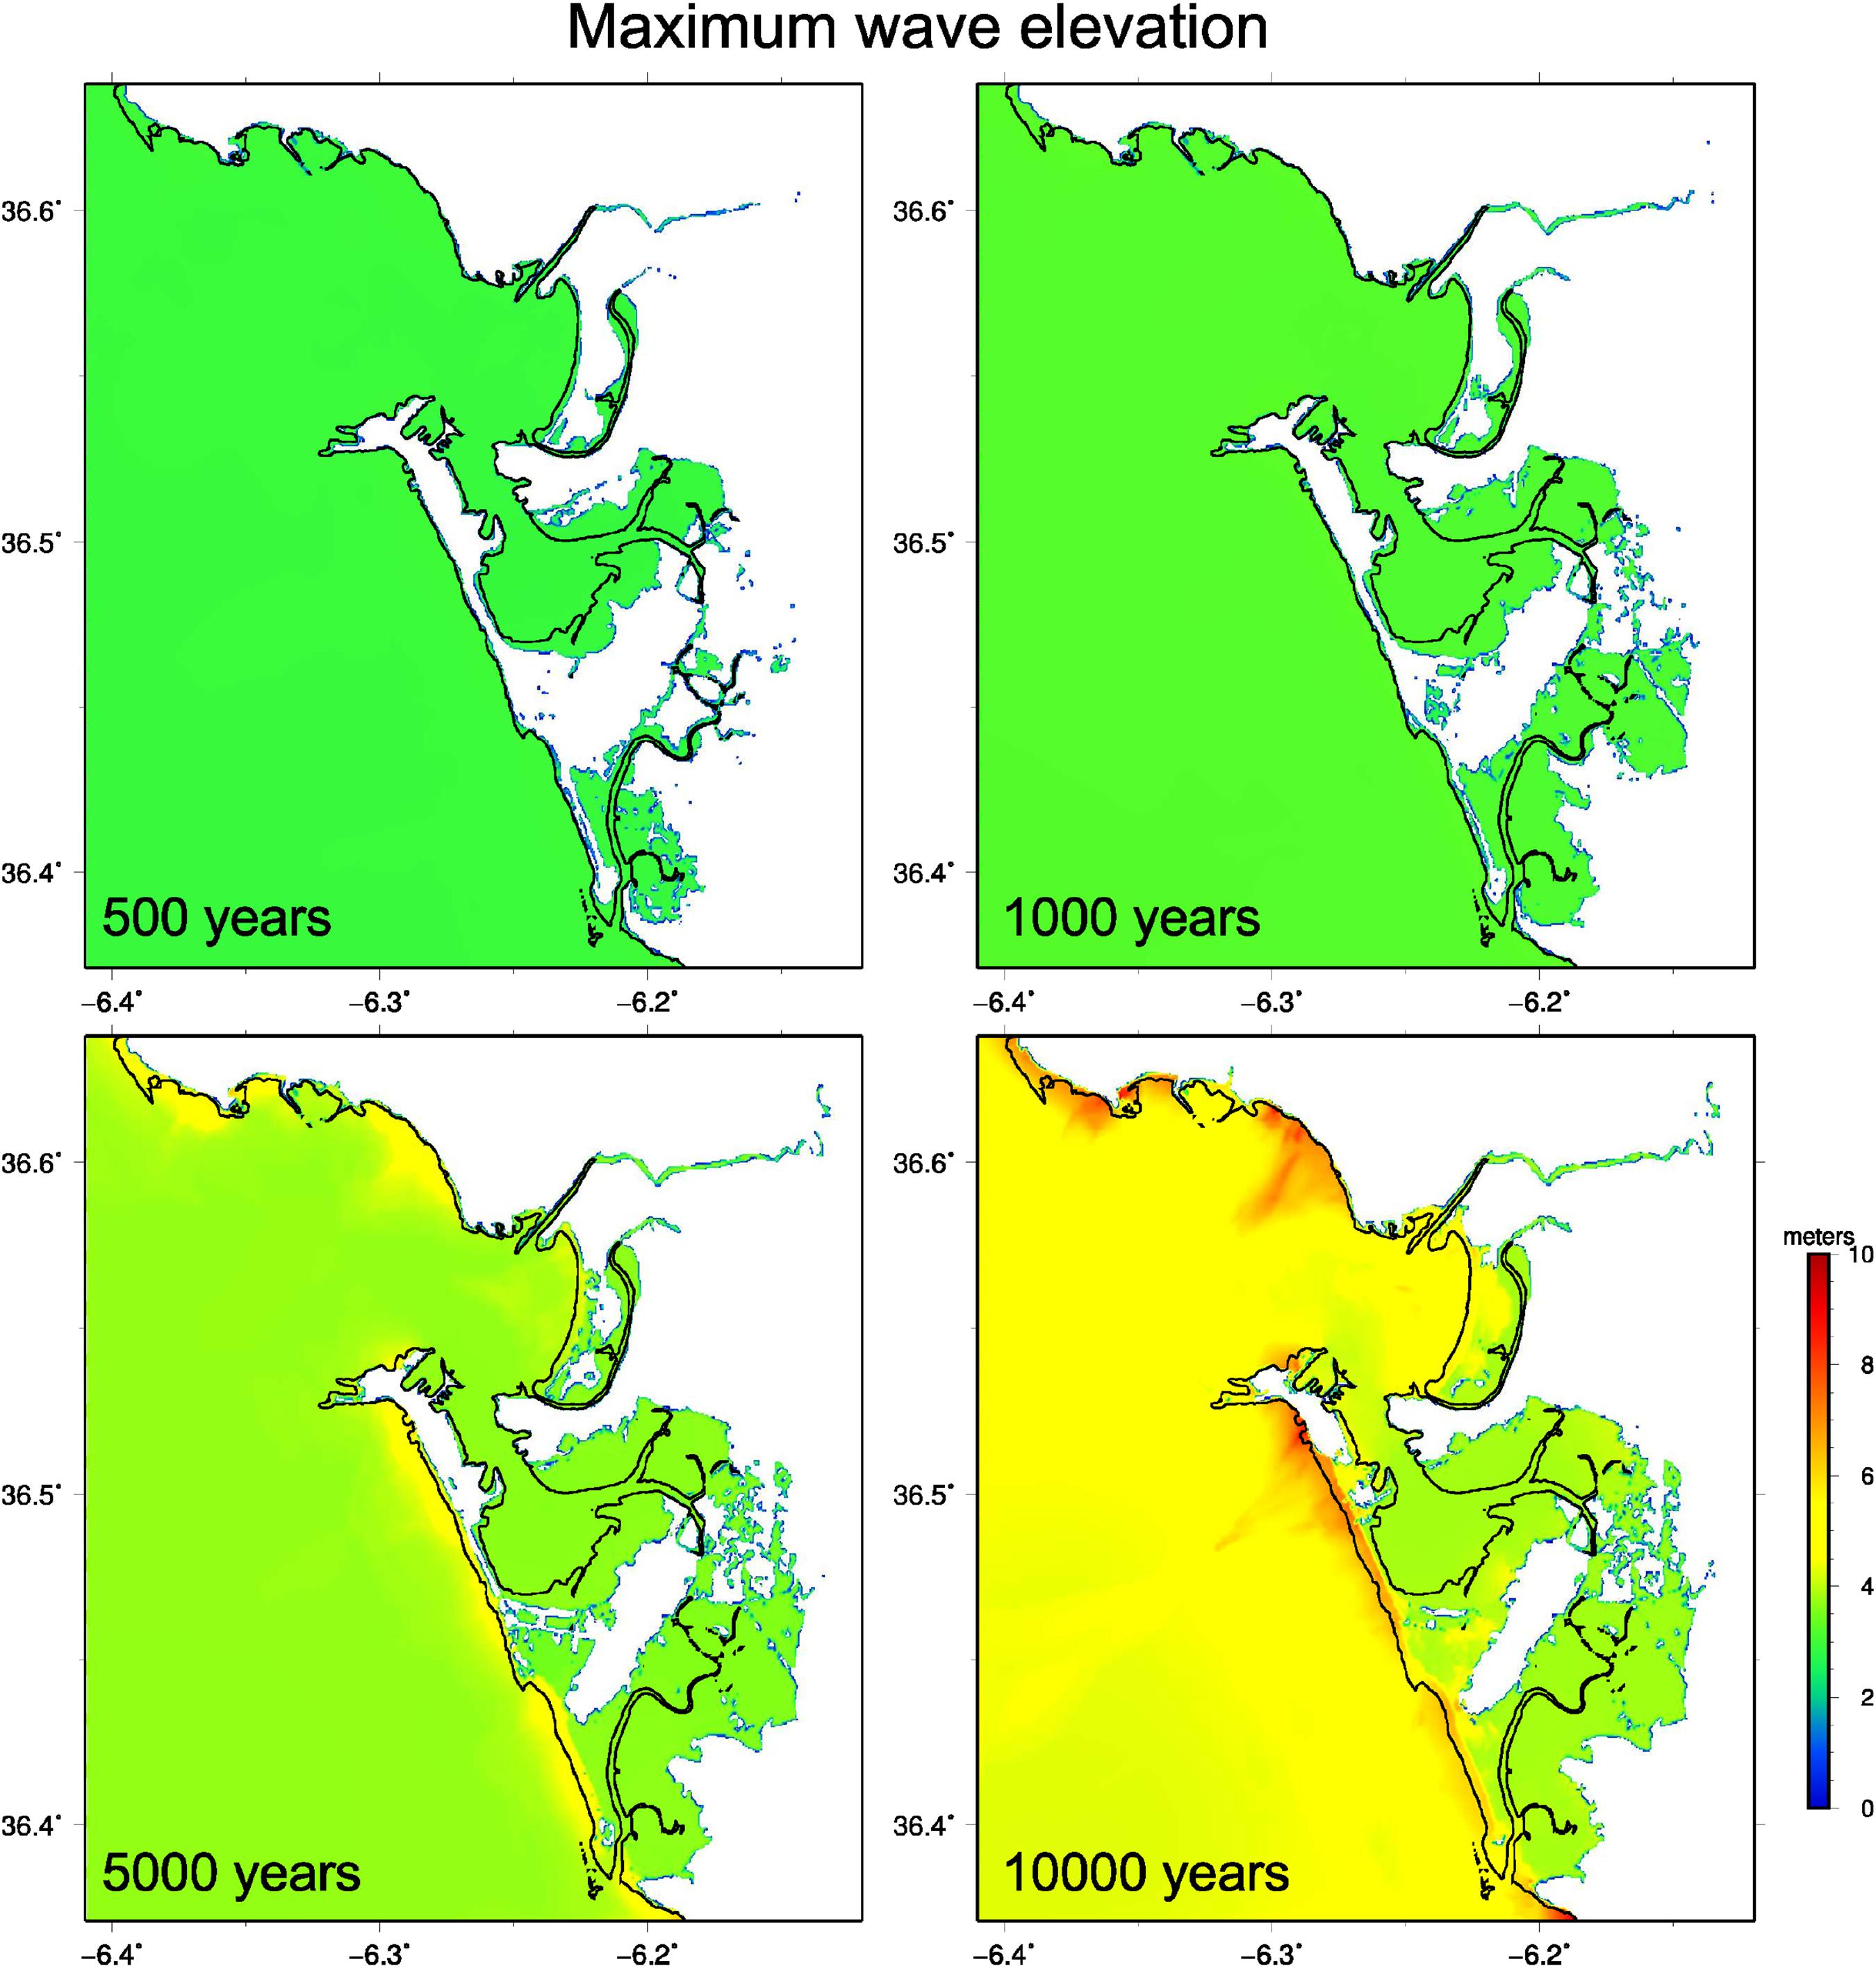
Figure 10. Maximum wave elevation for different return periods. 99% confidence interval.
In Figure 11, the maximum current speed for different return periods has been plotted. For a return period of 500 years only the zone of Rota presents velocities exceeding the value of 0.5 m/s. For a return period of 1000 years, velocities higher than 4 m/s are achieved in the urban beaches of Cádiz and Rota. For higher return periods most of the coastal area present maximum current speeds higher than 9 m/s.
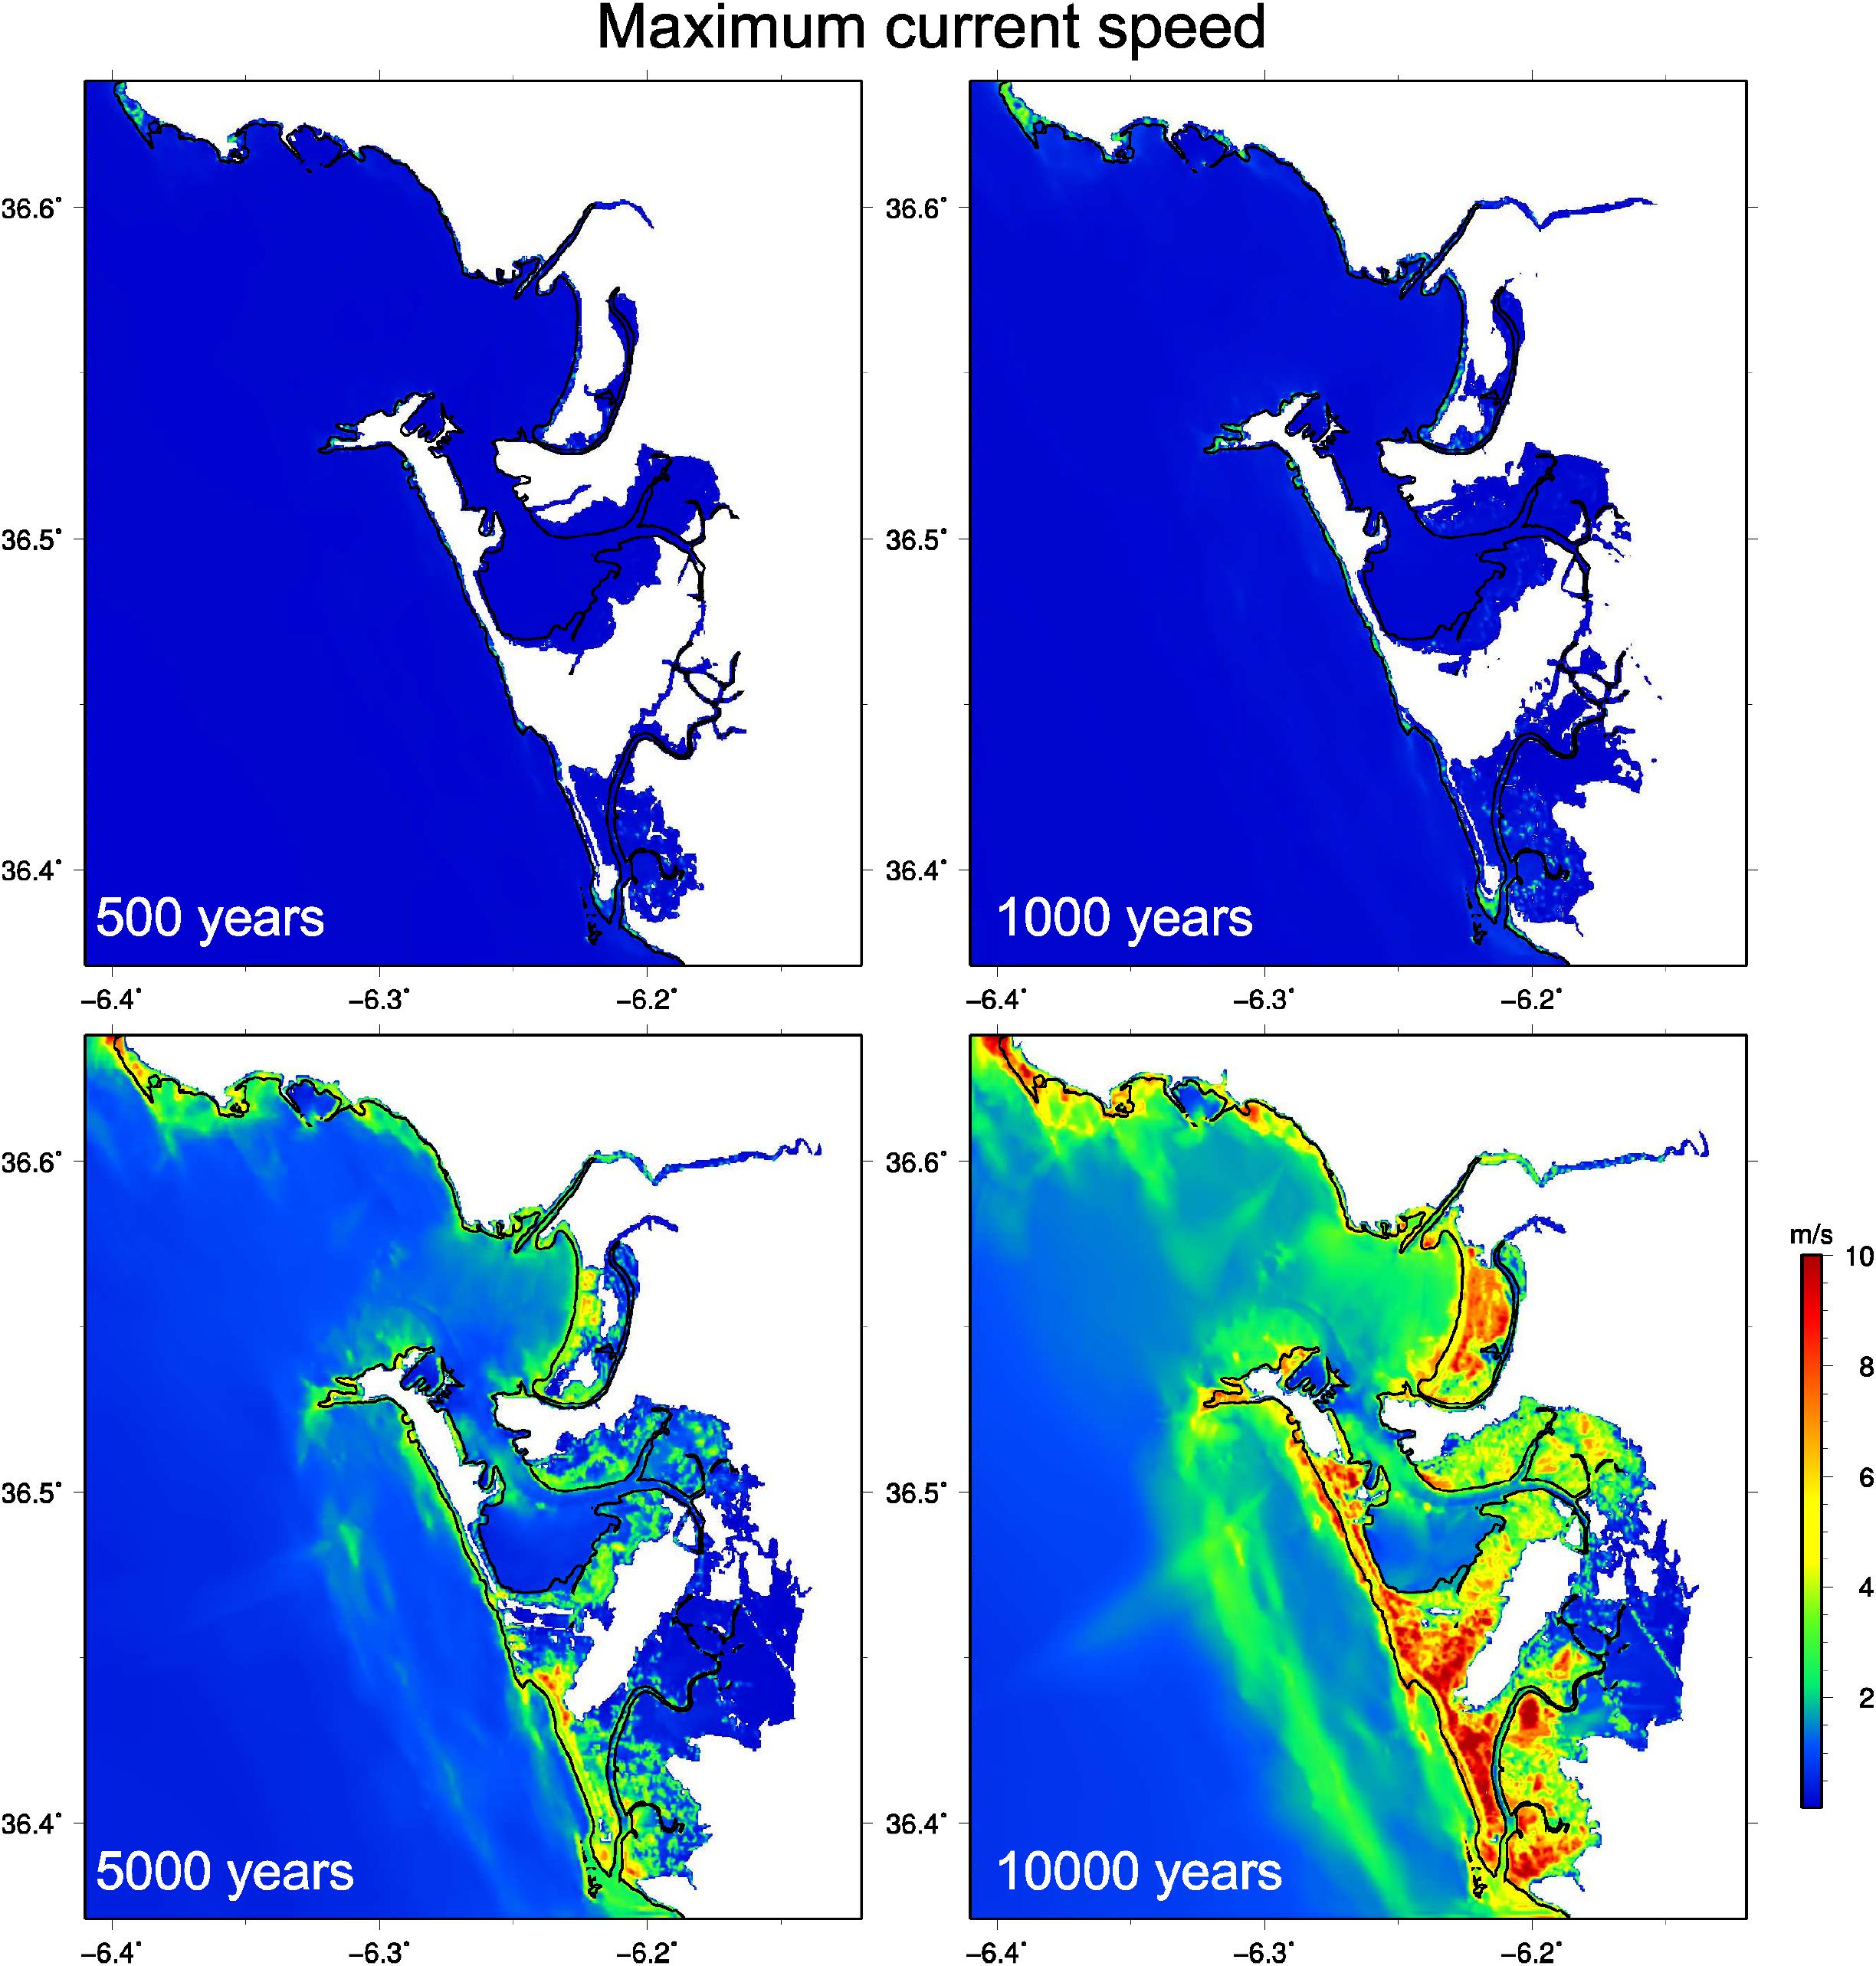
Figure 11. Maximum current speed for different return periods. 99% confidence interval.
Figure 12 the maximum total forces, including the hydrostatic and hydrodynamic contributions with a drag coefficient of 2, have been plotted. For a 500-year return period the net force does not exceed the value of 1 ton/m in the study area. For the 1000-year return period the maximum observed net force increases to 4 tons/m. Rota and the urban beaches in Cádiz (Caleta, Santa María del Mar, Victoria and Cortadura) are the zones with the highest net forces. For higher return periods values of 5 tons/m are reached in large areas. In Rota and in the urban beaches of Cádiz, values of up to 10 tons/m are possible.
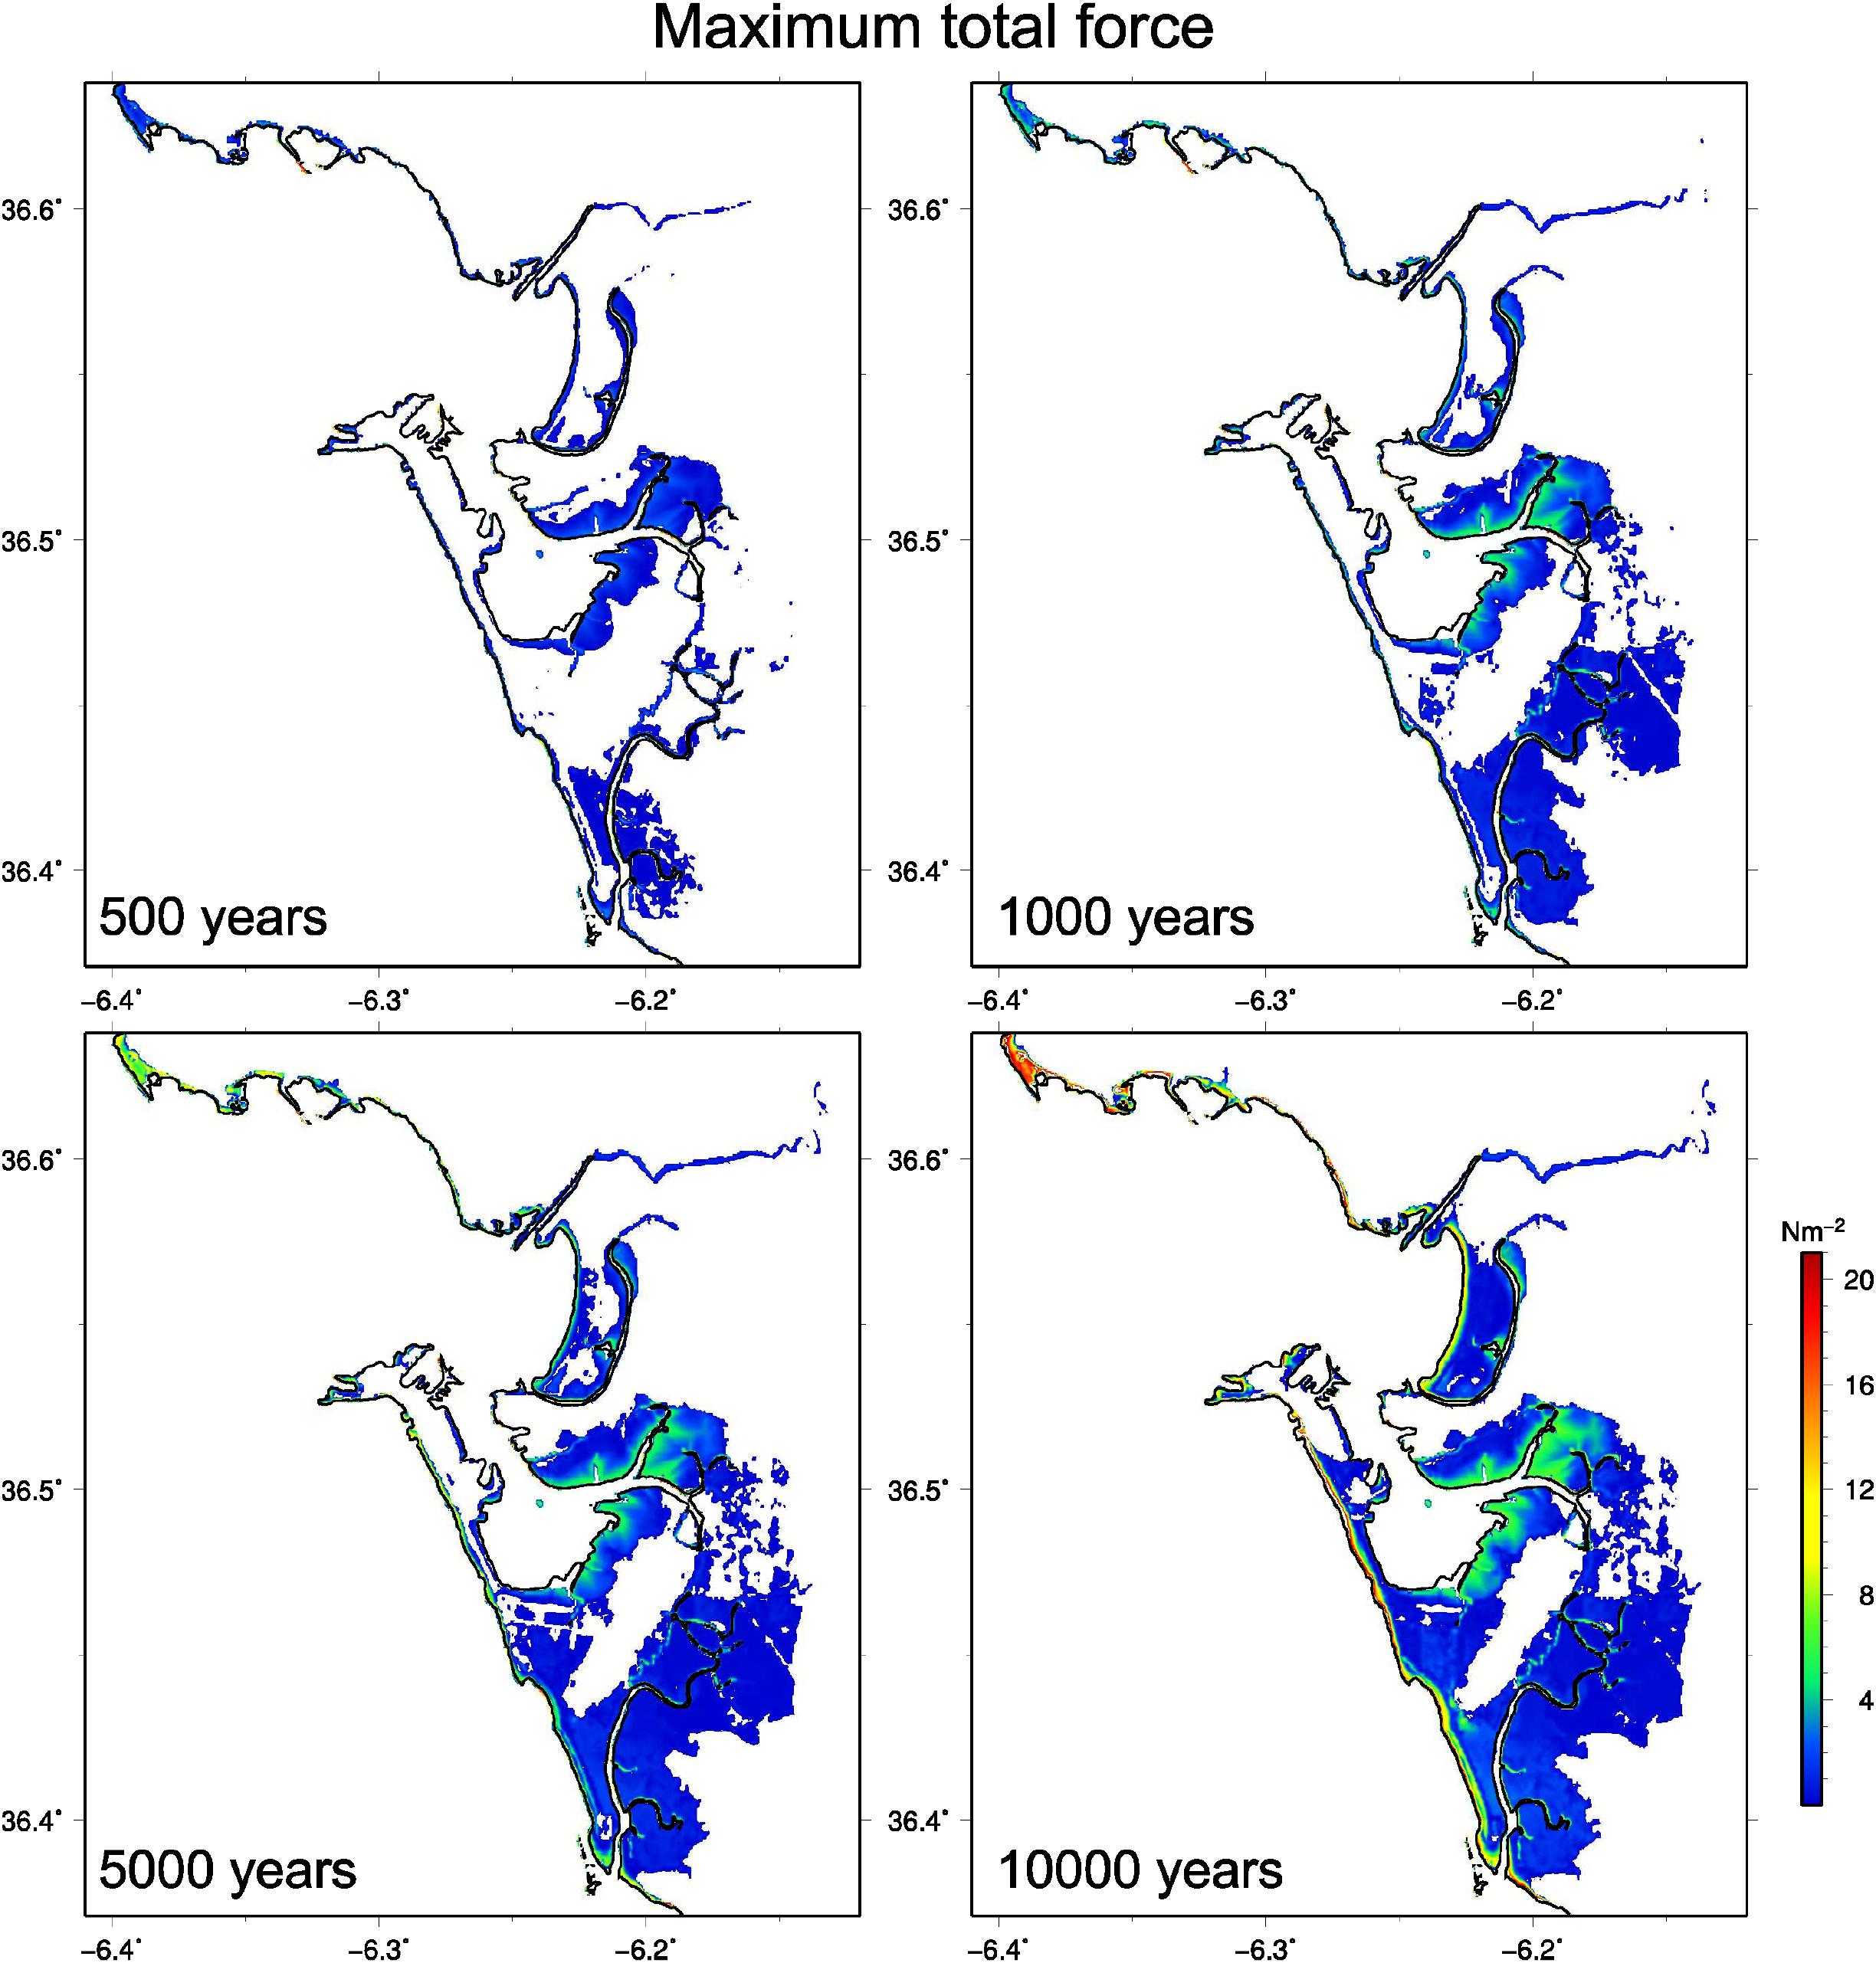
Figure 12. Maximum forces for different return periods, per unit area of exposed element. 99% confidence interval.
Discussion
Method and Limitations
The PTHA methodology proposed here treats aleatoric uncertainties on the seismic source and tidal stage through a Monte Carlo type framework. It, however, overlooks the epistemic uncertainties such as those related to the modeling of tsunami generation, propagation, and inundation and also those related to the accuracy of the bathymetric-topographic data. Our methodology allows deriving probabilistic coastal hazard maps (wave heights, current speed, and total force) for different return periods. It deals only with tsunamis of tectonic origin and can be applied to any tsunami-threatened coast where high-resolution DEM and records of tidal variations are available.
The PTHA developed here adopts a simple approximation to the source definition fixing some parameters of the earthquake faults (strike, dip, and rake angles) to constrain the variability of the models. This approximation is common in regional PTHA (e.g., Cheung et al., 2011; Heidarzadeh and Kijko, 2011; Power et al., 2012; Davies et al., 2018) but our methodological approximation can be extended to fully incorporate the aleatory uncertainties on the source definition by means of probability density functions using the Monte Carlo approach. Although the incorporation of these branches into the Monte Carlo approach would increase exponentially the number of simulations to compute, the use of GPU-optimized models can overcome this difficulty.
An important source of aleatoric uncertainty in the PTHA concerns the sea level when the tsunami waves reach the nearshore areas. However, this source of uncertainty is commonly disregarded in tsunami hazard assessments. On the other hand, tsunami-tide interaction has been a discussion topic in the literature. Several studies have been carried out to understand whether tide-tsunami interactions enhance/reduce tsunami elevation, flow speed, and arrival times. Based on observations and/or numerical experiments, various authors have found that tsunami inundation in rivers, inlets, harbors, and estuaries is strongly affected by tidal conditions (e.g., Kowalik et al., 2006; Kowalik and Proshutinsky, 2010; Zhang et al., 2011; Lee et al., 2015; Ayca and Lynett, 2016; Shelby et al., 2016; Tolkova, 2016; Ayca et al., 2017). Causes of tide-tsunami interaction are attributed to tidally induced currents and changes in the depth altering the background conditions during the propagation of the tsunami from its source (Weisz and Winter, 2005), both effects are small in the open ocean but increase as the tsunami shoals, mainly in coastal and bathymetric particular configurations as energetic tidal channels communicating large bodies of water or coastal configuration that can induce resonance effects between large scale shallow shelfs, narrow channels, islands, etc. The hydrodynamic pattern of tsunamis occurring under strong tidal regimes can be assessed using different approaches with increasing levels of complexity, depending on the scope of the study and local conditions of the site. Our PTHA approach accounts for the uncertainty of the tide level when the tsunami reaches the coast off Cádiz by incorporating four tidal stages (0.5 m, 1.5 m, 2.5 m, and 3.5 m) into the Monte Carlo simulations. The sensitivity related to these tides levels has not been tested, and it is subject to future studies. The reference for the selected tidal levels corresponds to the mean low spring tidal level. While this approach allows reducing the computational time, it has the limitation of overlooking the non-linear interaction between the tsunami wave, the tidal wave and their induced currents, which could be important on a large spatial and temporal scales. However, in the city of Cádiz that is exposed to the open sea, there are no relevant bathymetry features to generate tsunami-tide interactions, that together with the very large dimensions and periods of the tide (1000 kms and hours) and the tsunami (100 kms and minutes), we assume a small tsunami-tide interaction. Thus, the tide is a boundary condition that can be assumed as instantaneous due to its low speed of variation (in hours), compared to the tsunami speed (in minutes). On the other hand, inside the bay a tsunami-tidal interaction could occur mainly in current speeds that have not been considered here. The study of this tsunami-tide interaction is a challenge that requires further investigation beyond the scope of this work.
Coastal Tsunami Impact
The impact of tsunamis generated in the SW Iberian Transpressive Domain is significant on the Bay of Cádiz and increases, as expected, with the increase of the return period as shown in the results. It is also expected that the incorporation of the sea level variation due to the local tide highly influences the tsunami hazard results on the Bay of Cádiz. To evidence the relevance and the influence of the sea level incorporation, numerical simulations conducted for an example of a large tsunami generated in CWF (Cadiz Wedge Fault) with a Mw = 8.4 in the study area of Cadiz are presented (Figures 13A-C). Figure 13A presents the maximum tsunami wave elevation for a simulation in a low tide sea level. Figure 13B shows the result of the same scenario but incorporating the sea level to the propagation (spring tide 3.5 m, characteristic of the area). And finally, Figure 13C depicts the resulting flooded area for the same scenario executed in low tide condition, and then adding linearly the tide sea level (3.5 m) after the numerical simulation, which is a common approximation to include the tidal effect in PTHA analysis. Two main remarks can be drawn from these results. First, the incorporation of the tide is relevant because the flooded area is larger, and second, this incorporation was made using different initial levels, not just adding tidal levels linearly. Thus, in order to reduce the uncertainty of the sea level in meso and macro tidal areas in a probabilistic analysis, it is required to include the sea level as another variable taking into account its probability of occurrence.
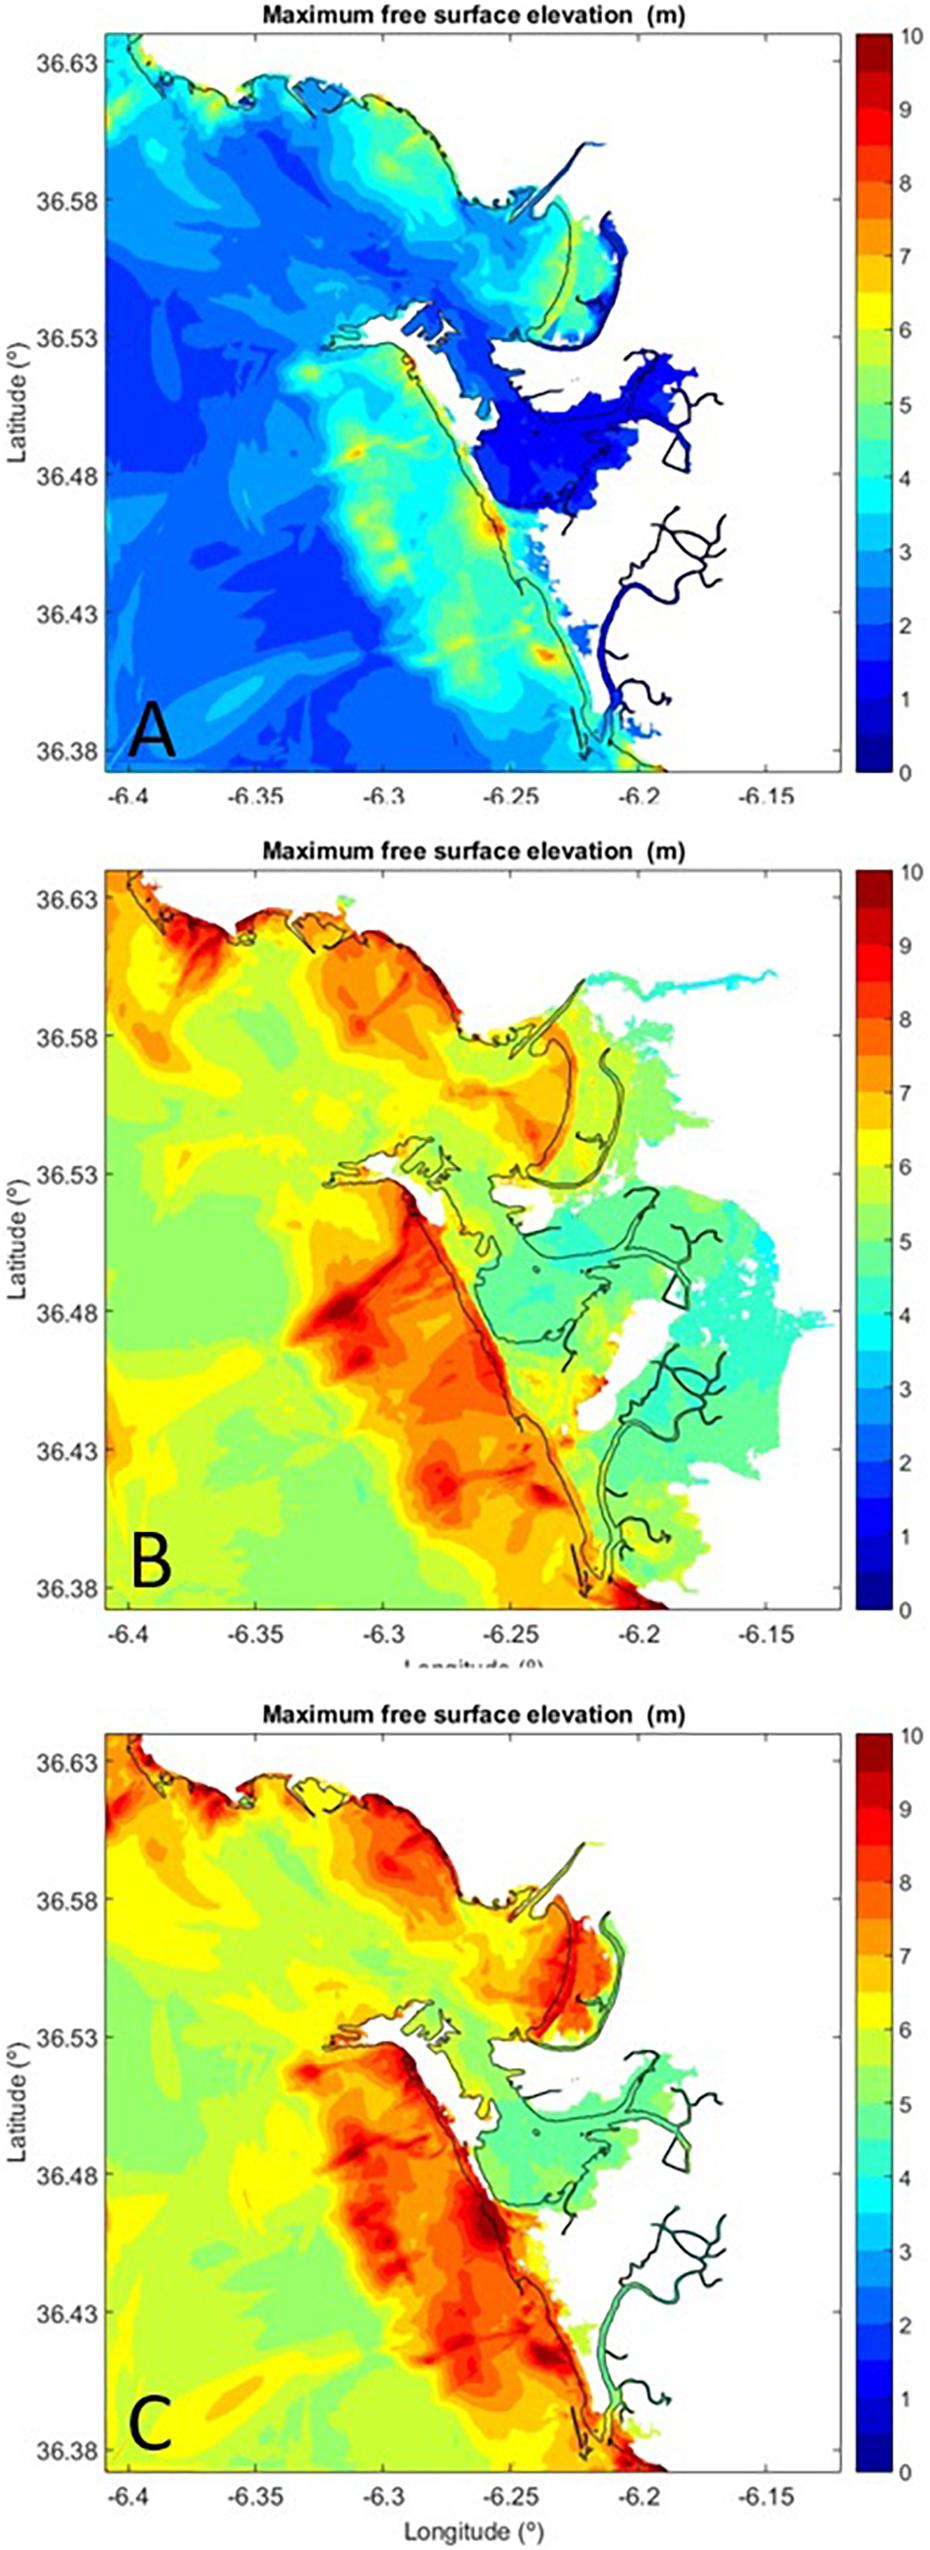
Figure 13. Importance of using tides in the simulations. (A) low tide propagation. (B) high tide propagation. (C) low tide propagation and tide added linearly.
Another important issue concerns the use of deterministic and probabilistic thematic tsunami hazard maps. Whether deterministic (conservative scenario) or probabilistic analysis serves better increasing the tsunami resilience of coastal areas depends on the scale and scope of the study. Figure 14 depicts a comparison of the aggregated results (envelope of the worst credible cases in each fault) for the high tide level obtained in a deterministic analysis with those obtained for the probabilistic results for a return period of 10000 years (confidence interval 99%). The comparison clearly indicates that the deterministic approach is very conservative. It is also noticeable that the aggregated results from the worst-case scenarios for each source of the deterministic approach (parameterized in Álvarez-Gómez et al., 2008; Omira et al., 2009; Lima et al., 2010) is associated with a return period longer than (Tr = 10000 years), as expected. Therefore, deterministic maps could be used to define those zones with no probability of being affected by a tsunami.
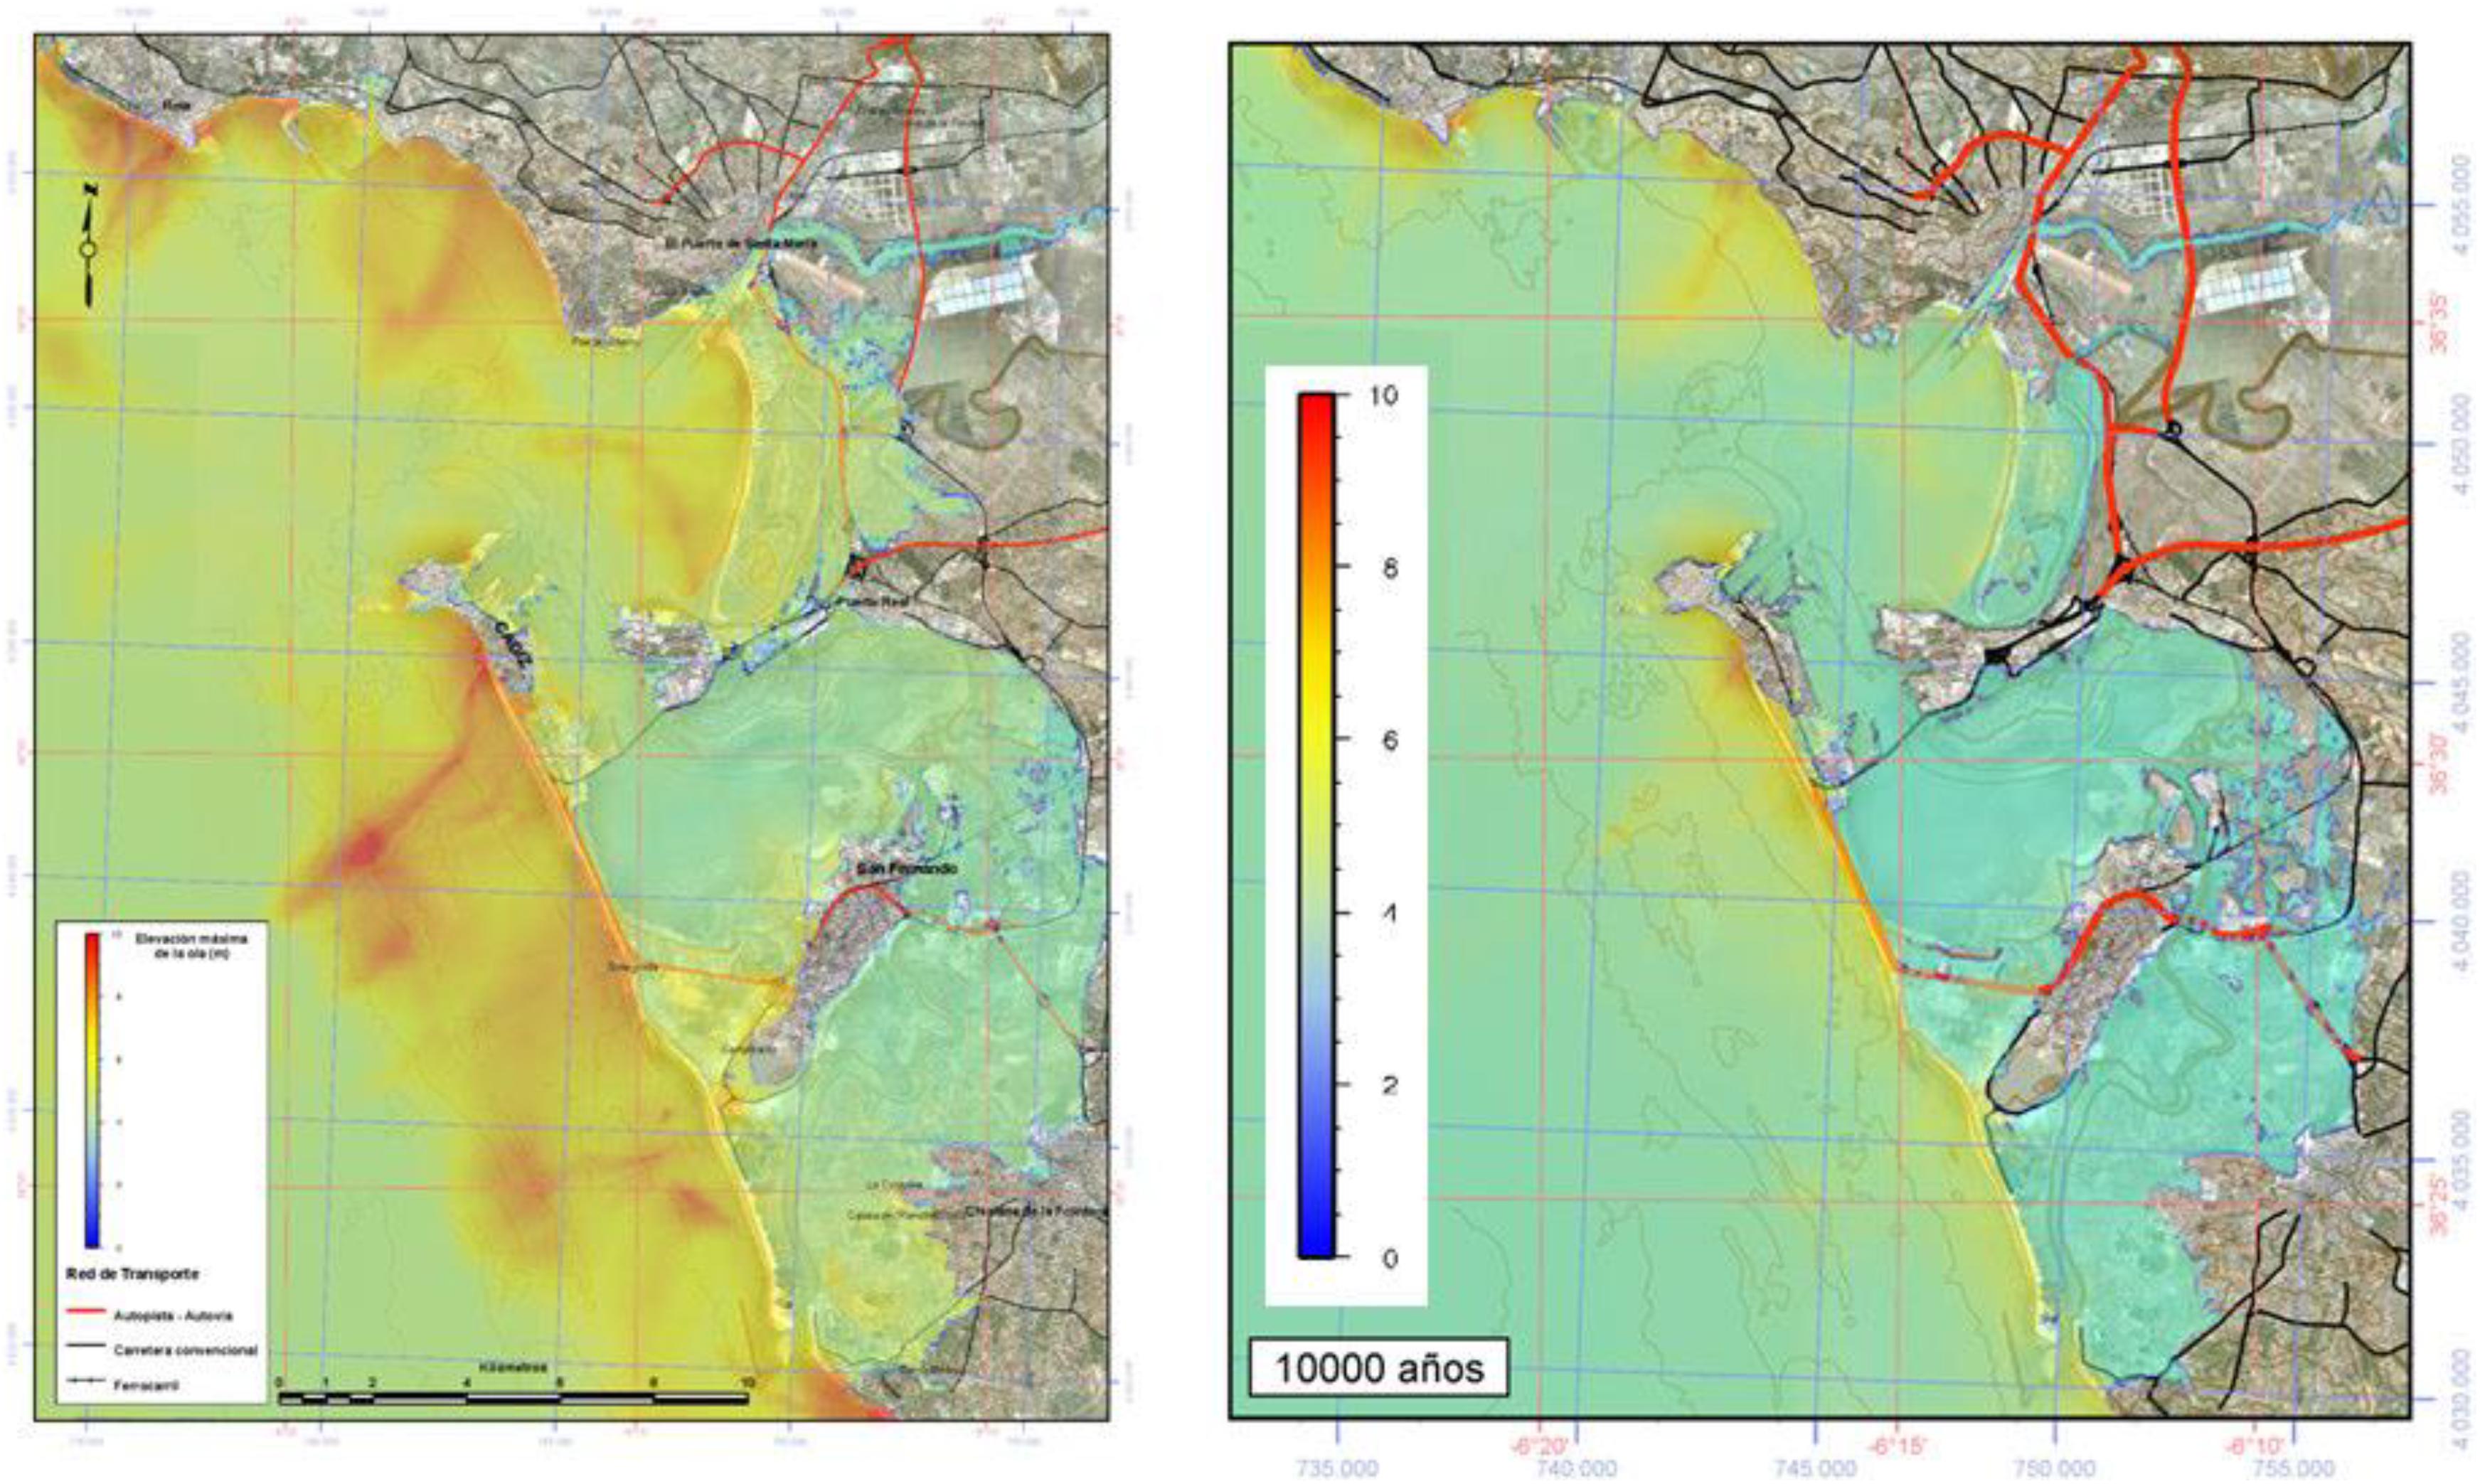
Figure 14. Comparison of the aggregated maximum wave elevation obtained for the high tide condition in the deterministic and in the probabilistic approaches (Tr = 10000 years and a confidence interval of 99%).
Both approaches can address different objectives in the analysis of the affected zone in a tsunami–prone area. Deterministic maps are more subjective but they are useful to establish inundation limits in areas where special infrastructures (nuclear plants, inflammable materials, pipelines) could be built or to assign the evacuation zones. On the other hand, the probabilistic maps are more valuable for vulnerability and risk assessments as well as for insurance purposes, as they provide a more complete picture of the hazard for a given zone with an associated return period. Additionally, building and infrastructure engineering design include probabilistic risk scenarios and risk return periods in the design.
To summarize, despite the limitations of the proposed PTHA methodology in dealing with limited sources of aleatoric uncertainty and disregarding the epistemic uncertainties it interestingly allows combining uncertainties in the generation parameters with the those of sea level in meso and maro tidal areas and performs high-resolution probabilistic tsunami hazard assessment. We believe that the method could highly benefit from further improvements. Particularly, the implementation in a specific case can be improved, with better probabilistic description of the different involved variables (definition of sources, geometrical parameters and scaling relations, Mw distribution, epicenter location in each fault, sea level distributions), and also, with higher resolution of the number of numerically modeled scenarios and higher grid resolutions inland taking into account the different source and sea level parameters, using more powerful and faster models using for example GPU techniques. However, the proposed methodology allows obtaining a reduction of the uncertainties for probabilistic flooding maps, achieving a distribution function of different tsunami intensity measures (max. water depth, max. wave elevation, max. current sped, max. forces, etc.) in each nodal grid point inland.
Conclusion
Deterministic or scenario-based approaches are based on tsunami events that could happen in the future, but have occurrence probabilities that are not well understood. In most deterministic assessments the tsunami scenario represents the worst tsunami case that can take place in the study region, often inferred from historical data. The most difficult task in this approach is to assign a return period to the considered scenario, which sometimes is impossible because of the time span of the seismic catalogs. Nevertheless, the results obtained from scenario-based approaches have been used for several applications, such as the establishment of inundation zones, evacuation maps (Geist and Parsons, 2006) and urban planning.
In this study, a new probabilistic method for the tsunami hazard estimation has been presented and its application to the Cádiz area has been described. This probabilistic method is combined with the application of high-resolution numerical simulations for tsunami propagation and inundation (in the present case the C3 model, Olabarrieta et al., 2011) to derive inundation and hazard maps for given return period and confidence interval. A novel characteristic of the present methodology, based on Monte Carlo simulations, is the statistical treatment of both tsunami hazard and sea level variation, including both astronomical and meteorological effects. Therefore, the present method does not assume that the tsunamigenic earthquake occurs at a given tidal level condition.
The application of the PTHA method described here requires a priori zoning of the source region and the identification of the different faults in each source region. In the specific case of the Cádiz area, only the tsunamigenic areas in the SWIT region were considered. The main tsunamigenic sources in the Gulf of Cádiz were identified as clusters of seismicity in the SWIT region, which represent the maximum earthquake ruptures. GBF (Gorringe Bank Fault), HSF (Horseshoe Fault), MPF (Marques de Pombal Fault), PBF (Portimao Bank Fault), and CWF (Cádiz Wedge Fault) were the five main earthquake ruptures identified in the analysis region. The a and b parameters of the Gutenberg-Ritcher Law for the SWIT region were obtained from the study of the instrumental and historical seismic catalog of the IGN. The tidal level probability distribution function and the characteristics of the main tidal harmonic constituents were obtained from a tidal gauge located near Cádiz. 1000 different time series of combined tsunamigenic earthquake and tidal levels were synthetically generated using the Monte Carlo technique. Each time series had a 10000-year duration.
The C3 model was used to propagate the tsunami from the source region to the coast. The tsunami characteristics were analyzed statistically to derive different thematic maps for the return periods of 500, 1000, 5000, and 10000 years. The derived thematic maps include the maximum wave elevation, the maximum current velocity, the maximum Froude number, and the maximum total forces. The thematic maps obtained for a return period of 10000-year (confidence interval 99%) were compared to those derived from the aggregated deterministic worst-case scenarios for the Cádiz region. This deterministic scenario assumed that the worst-case scenarios for each considered source coincided with the maximum water level measured by the tidal gauge, which means that the probability of occurrence of this extreme event is very low. Thus, the deterministic approach was very conservative. Deterministic maps could be used to define those zones with a very low probability or with no probability of being affected by a tsunami. This is a useful information for visualizing the hazard and the establishment of the maximum limits of flooding, which is necessary for planning the evacuation zones and for defining those areas in which critical infrastructures (e.g., nuclear plants, flammable materials, pipelines) can be built. Ideally, deterministic approach should be linked to the probabilistic study. The probabilistic maps are more valuable for vulnerability and risk assessment and also for insurance proposes.
Data Availability Statement
The raw data supporting the conclusions of this article will be made available by the authors, without undue reservation.
Author Contributions
MG conceived the manuscript, did the probabilistic approximation, and managed the process. JÁ-G conducted the characterization of tsunamigenic sources. ÍA-Q computed the Numerical simulations. LO and MO compiled the Montecarlo procedure and created the database. RJ, EK, and JB provided some data and internal discussion on the probabilistic model and revised the manuscript. MB, RO, and MM wrote parts of the manuscript and participated in internal discussion. ÍA-A and AL reviewed the probabilistic model. All authors contributed to the article and approved the submitted version.
Conflict of Interest
The authors declare that the research was conducted in the absence of any commercial or financial relationships that could be construed as a potential conflict of interest.
The handling editor declared a past co-authorship with several of the authors MB and RO.
Funding
This research was part of the TRANSFER project (http://www.transferproject.eu/). AL acknowledges the support of the Spanish Grant MTM2008-00759. Some of the figures have been produced with the software GMT (Wessel and Smith, 1998). This is a contribution from the Environmental Hydraulics Institute (Universidad de Cantabria) and the Active Tectonics, Paleoseismology, and Associated Hazards research group (UCM-910368).
Acknowledgments
We thank to the Environmental Ministry of Spain (Dirección General de Costas de Andalucia) for providing us the local bathymetry. We also thank to the Spanish Supercomputing Network the use of the Altamira IFCA supercomputer. We would like to thank to the TSUSY Project (IHCantabria).
Footnotes
References
Aki, K. (1966). Generation and propagation of G waves from Niigata earthquake of June 16, 1964. Part 2. Estimation of earthquake moment, released energy, and stress-strain drop from the G wave spectrum. Bull. Earthq. Res. Inst. 44, 73–88.
Álvarez-Gómez, J. A., Gutiérrez, O. Q. G., and Aniel-Quiroga, Í, and González, M. (2012). Tsunamigenic potential of outer-rise normal faults at the Middle America trench in Central America. Tectonophysics 574, 133–143. doi: 10.1016/j.tecto.2012.08.014
Álvarez-Gómez, J. A., Miranda, J. M., Carreño, E., Matías, L., Martínez-Solares, J. M., and Baptista, M. A. (2008). Review of tsunamigenic faults in the Gulf of Cádiz. Geotemas 10, 1425–1428.
Annaka, T., Satake, K., Sakakiyama, T., Yanagisawa, K., and Shuto, N. (2007). Logic-tree approach for probabilistic tsunami hazard analysis and its applications to the japanese coasts. Pure Appl. Geophys. 164, 577–592. doi: 10.1007/s00024-006-0174-3
Argus, D. F., Gordon, R. G., DeMets, C., and Stein, S. (1989). Closure of the Africa-Eurasia-North America plate motion circuit and tecton- ics of the gloria fault. J. Geophys. Res. 94, 5585–5602. doi: 10.1029/JB094iB05p05585
Ayca, A., and Lynett, P. J. (2016). Effect of tides and source location on nearshore tsunami-induced currents. J. Geophys. Res. Oceans 121, 8807–8820. doi: 10.1002/2016jc012435
Ayca, A., Lynett, P. J., and Wilson, R. (2017). Effects of tide and wave directionality on localized tsunami-induced currents in port and harbors. Coast. Eng. Proc. 1:8. doi: 10.9753/icce.v35.currents.8
Baptista, M. A. (2019). Tsunamis along the azores gibraltar plate boundary. Pure Appl. Geophys. 177, 1713–1724. doi: 10.1007/s00024-019-02344-8
Baptista, M. A., and Miranda, J. M. (2009). Revision of the Portuguese catalog of tsunamis. Nat. Haz. Earth Syst. Sci. 9, 25–42. doi: 10.5194/nhess-9-25-2009
Basili, R., Brizuela, B., Herrero, A., Iqbal, S., Lorito, S., Maesano, F. E., et al. (2021). The Making of the NEAM Tsunami Hazard Model 2018 (NEAMTHM18). Front. Earth Sci. 8:616594. doi: 10.3389/feart.2020.616594
Basili, R., Tiberti, M. M., Kastelic, V., Romano, F., Piatanesi, A., Selva, J., et al. (2013). Integrating geologic fault data into tsunami hazard studies. Nat. Haz. Earth Syst. Sci. 13, 1025–1050. doi: 10.5194/nhess-13-1025-2013
Behrens, J., Løvholt, F., Jalayer, F., Lorito, S., and Salgado-Gálvez, M. (2021). Probabilistic tsunami hazard and risk analysis -a review of research gaps. Front. Earth Sci. doi: 10.3389/feart.2021.628772
Blaser, L., Krüger, F., Ohrnberger, M., and Scherbaum, F. (2010). Scaling relations of earthquake source parameter estimates with special focus on subduction environment. Bull. Seismol. Soc. Am. 100, 2914–2926. doi: 10.1785/0120100111
Borges, J. F., Fitas, A. J., Bezzeghoud, M., and Teves-Costa, P. (2001). Seismotectonics of Portugal and its adjacent Atlantic area. Tectonophysics 331, 373–387. doi: 10.1016/s0040-1951(00)00291-2
Burbidge, D., Cummins, P. R., Mleczko, R., and Thio, H. K. (2008). A probabilistic tsunami hazard assessment for Western Australia. Pure Appl. Geophys. 165, 2059–2088. doi: 10.1007/978-3-0346-0057-6_6
Cheung, K. F., Wei, Y., Yamazaki, Y., and Yim, S. C. (2011). Modeling of 500-year tsunamis for probabilistic design of coastal infrastructure in the Pacific Northwest. Coast. Eng. 58, 970–985. doi: 10.1016/j.coastaleng.2011.05.003
Coppersmith, K. J., and Youngs, R. R. (1986). “Capturing uncertainty in probabilistic seismic hazard assessments within intraplate tectonic environments,” in Proceedings of the Third U.S. National Conference on Earthquake Engineering, Charleston, SC, 301–312.
Cramer, C. H., Petersen, M. D., and Reichle, M. S. (1996). A Monte Carlo approach in estimating uncertainty for a seismic hazard assessment of Los Angeles, Ventura, and Orange Counties, California. Bull. Seismol. Soc. Am. 86, 1681–1691.
Cunha, T., Watts, A., Pinheiro, L., and Myklebust, R. (2010). Seismic and gravity anomaly evidence of large-scale compressional deformation off SW Portugal. Earth Planet. Sci. Lett. 293, 171–179. doi: 10.1016/j.epsl.2010.01.047
Davies, G., and Griffin, J. (2019). Sensitivity of probabilistic tsunami hazard assessment to far-field earthquake slip complexity and rigidity depth-dependence: case study of Australia. Pure Appl. Geophys. 177, 1521–1548. doi: 10.1007/s00024-019-02299-w
Davies, G., Griffin, J., Løvholt, F., Glimsdal, S., Harbitz, C., Thio, H. K., et al. (2018). A global probabilistic tsunami hazard assessment from earthquake sources. Geol. Soc. Spec. Publ. 456, 219–244. doi: 10.1144/sp456.5
Davis, R. A., Fox, W. T., Hayas, M. O., and Boothroyd, J. C. (1972). Comparison of ridge and runnel systems in tidal and non-tidal environments. J. Sediment. Petrol. 42, 413–421.
Davison, F. C., and Scholz, C. H. (1985). Frequency-moment distribution of earthquakes in the Aleutian Arc: a test of the characteristic earthquake model. Bull. Seismol. Soc. Am. 75, 1349–1361.
De Risi, R., and Goda, K. (2016). Probabilistic earthquake-tsunami multi-hazard analysis: application to the Tohoku region, Japan. Front. Built Environ. 2, 2–25. doi: 10.3389/fbuil.2016.00025
Ebel, J. E., and Kafka, A. L. (1999). A Monte Carlo approach to seismic hazard analysis. Bull. Seismol. Soc. Am. 89, 854–866.
El-Hussain, I., Omira, R., Deif, A., Al-Habsi, Z., Al-Rawas, G., Mohamad, A., et al. (2016). Probabilistic tsunami hazard assessment along Oman coast from submarine earthquakes in the Makran subduction zone. Arab. J. Geosci. 9:668. doi: 10.1007/s12517-016-2687-0
FEMA (2000). Coastal Construction Manual, Tech. Rep. 55. Washington, DC: Federal Emergency Management Agency.
Fukao, Y. (1973). Thrust faulting at a lithospheric plate boundary the portugal earthquake of 1969. Earth Planet. Sci. Lett. 18, 205–216. doi: 10.1016/0012-821x(73)90058-7
Garcia-Orellana, J., Gràcia, E., Vizcaino, A., Masqué, P., Olid, C., Martínez- Ruiz, F., et al. (2006). Identifying instrumental and historical earthquake records in the SW Iberian margin using 210Pb turbidite chronology. Geophys. Res. Lett. 33:L24601. doi: 10.1029/2006GL028417
Gardner, J. K., and Knopoff, L. (1974). Is the sequence of earthquakes in Southern California, with aftershocks removed, Poissonian? Bull. Seismol. Soc. Am. 64, 1363–1367.
Geissler, W. H., Matias, L., Stich, D., Carrilho, F., Jokat, W., Monna, S., et al. (2010). Focal mechanisms for sub-crustal earthquakes in the Gulf of Cadiz from a dense OBS deployment. Geophys. Res. Lett. 37:L18309. doi: 10.1029/2010GL044289
Geist, E., and Parsons, T. (2006). Probabilistic analysis of tsunami hazards. Nat. Hazards 37, 277–314. doi: 10.1007/s11069-005-4646-z
Geist, E. L., and Lynett, P. J. (2014). Source processes for the probabilistic assessment of tsunami hazards. Oceanography 27, 86–93.
George, D. L., and LeVeque, R. J. (2006). Finite volume methods and adaptive refinement for global tsunami propagation and local inundation. Sci. Tsunami Hazards 24, 319–328.
Gica, E., Teng, M. H., Liu, P. L. F., Titov, V., and Zhou, H. (2007). Sensitivity analysis of source parameters for earthquake-generated distant tsunamis. J. Waterw. Port Coast. Ocean Eng. 133, 429–441. doi: 10.1061/(asce)0733-950x(2007)133:6(429)
Gjevik, B., Pedersen, G., Dybesland, E., Harbitz, C. B., Miranda, P. M. A., Baptista, M. A., et al. (1997). Modeling tsunamis from earthquake sources near Gorringe Bank southwest of Portugal. J. Geophys. Res. Oceans 102, 27931–27949. doi: 10.1029/97jc02179
Goda, K., Yasuda, T., Mori, N., and Mai, P. M. (2015). Variability of tsunami inundation footprints considering stochastic scenarios based on a single rupture model: application to the 2011 T ohoku earthquake. J. Geophys. Res. Oceans 120, 4552–4575. doi: 10.1002/2014jc010626
González, F. I., Geist, E. L., Jaffe, B., Kânoglu, U., Mofjeld, H., Synolakis, C. E., et al. (2009). Probabilistic tsunami hazard assessment at seaside, Ore- gon, for near- and far-field seismic sources. J. Geophys. Res. 114:C11023. doi: 10.1029/2008JC005132
González, M., Medina, R., Olabarrieta, M., and Otero, L. (2010). Tsunami hazard assesment in the Southern coast of Spain. Turk. J. Earth Sci. 19, 351–366.
Grandin, R., Borges, J. F., Bezzeghoud, M., Caldeira, B., and Carrilho, F. (2007). Simulations of strong ground motion in SW Iberia for the 1969 February 28 (Ms= 8.0) and the 1755 November 1 (M ∼ 8.5) earthquakes – II. Strong ground motion simulations. Geophys. J. Int. 171, 807–822. doi: 10.1111/j.1365-246x.2007.03571.x
Grezio, A., Babeyko, A., Baptista, M. A., Behrens, J., Costa, A., Davies, G., et al. (2017). Probabilistic tsunami hazard analysis: multiple sources and global applications. Rev. Geophys. 55, 1158–1198. doi: 10.1002/2017RG000579
Grezio, A., Sandri, L., Marzocchi, W., Argnani, A., and Gasparini, P. (2012). Probabilistic tsunami hazard assessment for messina strait area (Sicily, Italy). Nat. Hazards 64, 329–358. doi: 10.1007/s11069-012-0246-x
Griffin, J., Pranantyo, I. R., Kongko, W., Haunan, A., Robiana, R., Miller, V., et al. (2016). Assessing tsunami hazard using heterogeneous slip models in the Mentawai Islands, Indonesia. Geol. Soc. Spec. Publ. 441, 47–70. doi: 10.1144/SP441.3
Gutscher, M.-A., Dominguez, S., Westbrook, G. K., and Leroy, P. (2009). Deep structure, recent deformation and analog modeling of the Gulf of Cadiz accretionary wedge: implications for the 1755 Lisbon earthquake. Tectonophysics 475, 85–97. doi: 10.1016/j.tecto.2008.11.031
Heidarzadeh, M., and Kijko, A. (2011). A probabilistic tsunami hazard assessment for the Makran subduction zone at the northwestern Indian Ocean. Nat. Hazards 56, 577–593. doi: 10.1007/s11069-010-9574-x
Hoechner, A., Babeyko, A. Y., and Zamora, N. (2016). Probabilistic tsunami hazard assessment for the Makran region with focus on maximum magnitude assumption. Nat. Hazards Earth Syst. Sci. 16, 1339–1350. doi: 10.5194/nhess-16-1339-2016
Horspool, N., Pranantyo, I., Griffin, J., Latief, H., Natawidjaja, D. H., Kongko, W., et al. (2014). A probabilistic tsunami hazard assessment for Indonesia. Nat. Hazards Earth Syst. Sci. 14, 3105–3122. doi: 10.5194/Nhess-14-3105-2014
Kanamori, H. (1977). The energy release in great earthquakes. J. Geophys. Res. 82, 2981–2987. doi: 10.1029/jb082i020p02981
Knighton, J., and Bastidas, L. A. (2015). A proposed probabilistic seismic tsunami hazard analysis methodology. Nat. Hazards 78, 699–723. doi: 10.1007/s11069-015-1741-7
Kotani, T., Tozato, K., Takase, S., Moriguchi, S., Terada, K., Fukutani, Y., et al. (2020). Probabilistic tsunami hazard assessment with simulation-based response surfaces. Coast. Eng. 160:103719. doi: 10.1016/j.coastaleng.2020.103719
Kowalik, Z., and Proshutinsky, A. (2010). Tsunami–tide interactions: a cook inlet case study. Cont. Shelf Res. 30, 633–642. doi: 10.1016/j.csr.2009.10.004
Kowalik, Z., Proshutinsky, T., and Proshutinsky, A. (2006). Tide-tsunami interactions. Sci. Tsunami Hazards 24, 242–256.
Laughton, A. S., and Whitmarsh, R. B. (1974). The Azores-Gibraltar Plate Boundary. Dordrecht: Reidel Publishing, 63–81.
Lee, H. S., Shimoyama, T., and Popinet, S. (2015). Impacts of tides on tsunami propagation due to potential Nankai Trough earthquakes in the Seto Inland Sea, Japan. J. Geophys. Res. Oceans 120, 6865–6883. doi: 10.1002/2015jc010995
Leonard, M. (2010). Earthquake fault scaling: self-consistent relating of rupture length, width, average displacement, and moment release. Bull. Seismol. Soc. Am. 100, 1971–1988. doi: 10.1785/0120090189
Li, L., Switzer, A. D., Chan, C.-H., Wang, Y., Weiss, R., and Qiu, Q. (2016). How heterogeneous coseismic slip affects regional probabilistic tsunami hazard assessment: a case study in the South China Sea. J. Geophys. Res. 121, 6250–6272. doi: 10.1002/2016jb013111
Lin, I.-C., and Tung, C. C. (1982). A preliminary investigation of tsunami hazard. Bull. Seismol. Soc. America Am. 72, 2323–2337.
Lima, V. V., Miranda, J. M., Baptista, M. A., Catalão, J., Gonzalez, M., Otero, L., et al. (2010). Impact of a 1755-like tsunami in Huelva, Spain. Nat. Hazards Earth Syst. Sci. 10, 139–148. doi: 10.5194/nhess-10-139-2010
Liu, P. L.-F., Cho, Y.-S., Briggs, M. J., Kanoglu, U., and Synolakis, C. E. (1995). Runup of solitary waves on a circular island. J. Fluid Mech. 302, 259–285. doi: 10.1017/s0022112095004095
Lorito, S., Selva, J., Basili, R., Romano, F., Tiberti, M. M., and Piatanesi, A. (2015). Probabilistic hazard for seismically induced tsunamis: accuracy and feasibility of inundation maps. Geophys. J. Int. 200, 574–588. doi: 10.1093/gji/ggu408
Lorito, S., Tiberti, M. M., Basili, R., Piatanesi, A., and Valensise, G. (2008). Earthquake generated tsunamis in the Mediterranean Sea: scenarios of potential threats to southern Italy. J. Geophys. Res. Solid Earth 113, 1978–2012.
Luque, L., Lario, J., Civis, J., Silva, P. G., Zazo, C., Goy, J. L., et al. (2002). Sedimentary record of a tsunami during Roman times, Bay of Cadiz, Spain. J. Quat. Sci. 17, 623–631. doi: 10.1002/jqs.711
Luque, L., Lario, J., Zazo, C., Goy, J. L., Dabrio, C. J., and Silva, P. G. (2001). Tsunami deposits as paleoseismic indicators: examples from the Spanish coast. Acta Geol. Hisp. 36, 197–211.
Main, I. (2000). Apparent breaks in scaling in the earthquake cumulative frequency- magnitude distribution: fact or artifact? Bull. Seismol. Soc. Am., 90, 86–97. doi: 10.1785/0119990086
Martínez-Loriente, S., Gràcia, E., Bartolome, R., Sallarès, V., Connors, C., Perea, H., et al. (2013). «Active deformation in old oceanic lithosphere and significance for earthquake hazard: seismic imaging of the coral patch ridge area and neighboring abyssal plains (SW Iberian Margin)». Geochem. Geophys. Geosy. 14, 2206–2231. doi: 10.1002/ggge.20173
Medialdea, T., Vegas, R., Somoza, L., Vázquez, J., Maldonado, A., del Río, V. D., et al. (2004). Structure and evolution of the “Olistostrome” complex of the Gibraltar Arc in the Gulf of Cádiz (east- ern Central Atlantic): evidence from two long seismic cross-sections. Mar. Geol. 209, 173–198. doi: 10.1016/j.margeo.2004.05.029
Mezcua, J., and Martínez-Solares, J. M. (1983). Sismicidad en el Área Ibero-Mogrebí, Publicación Técnica 203. Madrid: Instituto Geográfico Nacional.
Morales, J. A., Borrego, J., Miguel, E. G. San, López-González, N., and Carro, B. (2008). Sedimentary record of recent tsunamis in the Huelva Estuary (southwestern Spain). Quat. Sci. Rev. 27, 734–746. doi: 10.1016/j.quascirev.2007.12.002
Murotani, S., Satake, K., and Fujii, Y. (2013). Scaling relations of seismic moment, rupture area, average slip, and asperity size for M˜ 9 subduction-zone earthquakes. Geophys. Res. Lett. 40, 5070–5074. doi: 10.1002/grl.50976
National Research Council (1988). Probabilistic Seismic Hazard Analysis, Tech. Rep. Washington, DC: National Academy press.
National Research Council (1997). Review of Recommendations for Probabilistic Seismic Hazard Analysis: Guidance on Uncertainty and Use of Experts, Tech. rep. Washington, DC: National Academy press.
Okal, E. A., and Synolakis, C. E. (2004). Source discriminants for near-field tsunamis. Geophys. J. Int. 158, 899–912. doi: 10.1111/j.1365-246x.2004.02347.x
Olabarrieta, M., Medina, R., Gonzalez, M., and Otero, L. (2011). C3: a finite volume- finite difference hybrid model for tsunami propagation and runup, computers andamp. Geosciences 37, 1003–1014. doi: 10.1016/j.cageo.2010.09.016
Omira, R., Baptista, M. A., and Matias, L. (2015). Probabilistic tsunami hazard in the northeast atlantic from near-and far-field tectonic sources. Pure Appl. Geophys. 172, 901–920. doi: 10.1007/s00024-014-0949-x
Omira, R., Baptista, M. A., Matias, L., Miranda, J. M., Catita, C., Carrilho, F., et al. (2009). Design of a sea-level tsunami detection network for the Gulf of Cadiz. Nat. Hazards Earth Syst. Sci. 9, 1327–1338. doi: 10.5194/nhess-9-1327-2009
Omira, R., Baptista, M. A., and Miranda, J. M. (2011). Evaluating tsunami impact on the Gulf of Cadiz Coast (Northeast Atlantic). Pure Appl. Geophys. 168, 1033–1043. doi: 10.1007/s00024-010-0217-7
Omira, R., Matias, L., and Baptista, M. A. (2016). Developing an event-tree probabilistic tsunami inundation model for NE Atlantic coasts: application to a case study. Pure Appl. Geophy. 173, 3775–3794. doi: 10.1007/s00024-016-1367-z
Otero, L. (2008). Metodología Para Evaluar la Peligrosidad Debido a Tsunamis en Zonas Costeras. Ph.D. thesis. Santander: University of Cantabria.
Pereira, R., Alves, T. M., and Cartwright, J. (2011). Post-rift compression on the SW Iberian margin (eastern North Atlantic): a case for prolonged inversion in the ocean–continent transition zone. J. Geol. Soc. 168, 1249–1263. doi: 10.1144/0016-76492010-151
Power, W., Wallace, L., Wang, X., and Reyners, M. (2012). Tsunami hazard posed to New Zealand by the Kermadec and southern New Hebrides subduction margins: an assessment based on plate boundary kinematics, interseismic coupling, and historical seismicity. Pure Appl. Geophys. 169, 1–36.
Power, W., Downes, G., and Stirling, M. (2007). Estimation of tsunami hazard in New Zealand due to South American earthquakes. Pure Appl. Geophys. 164, 547–564.
Power, W., Wang, X., Lane, E. M., and Gillibrand, P. A. (2013). A probabilistic tsunami hazard study of the Auckland region, Part I: propagation modelling and tsunami hazard assessment at the shoreline. Pure Appl. Geophys. 170, 16–21. doi: 10.1007/s00024-012-0543-z
Rikitake, B. T., and Aida, I. (1988). Tsunami hazard probability in Japan. Bull. Seismol. Soc. Am. 78, 1268–1278.
Roger, J., Baptista, M. A., Sahal, A., Accary, F., Allgeyer, S., and Hébert, H. (2011). The Transoceanic 1755 Lisbon tsunami in Martinique. Pure Appl. Geophys. 168, 1015–1031.
Rosas, F., Duarte, J., Terrinha, P., Valadares, V., and Matias, L. (2009). Morphotectonic characterization of major bathymetric lineaments in Gulf of Cadiz (Africa– Iberia plate boundary): insights from analogue modelling experiments. Mar. Geol. 261, 33–47.
Rueda, J., and Mezcua, J. (2002). Estudio del terremoto de 23 de septiembre de 2001 en Pego (Alicante). Obtención de una relación m_bLg - M_W para la Península Ibérica. Rev. Soc. Geol. Esp. 15, 159–173.
Ruiz, F., Rodríguez-Ramírez, A., Cáceres, L. M., Vidal, J. R., Carretero, M. I., Abad, M., et al. (2005). Evidence of high-energy events in the geological record: mid-holocene evolution of the southwestern Doñana National Park (SW Spain). Palaeogeogr. Palaeoclimatol. Palaeoecol. 229, 212–229.
Sartori, R., Torelli, L., Zitellini, N., Peis, D., and Lodolo, E. (1994). Eastern segment of the Azores-Gibraltar line (central-eastern Atlantic): an oceanic plate boundary with diffuse compressional deformation. Geology 22, 555–558.
Savage, J. C. (1991). Criticism of some forecasts of the National Earthquake Prediction Evaluation Council. Bull. Seismol. Soc. Am. 81, 862–881.
Savage, J. C. (1992). The uncertainty in earthquake conditional probabilities. Geophys. Res. Lett. 19, 709–712.
Scholz, C. H. (2002). The Mechanics of Earthquakes and Faulting, 2nd Edn. Cambridge: Cambridge University Press, 471.
Schwartz, D. P., and Coppersmith, K. J. (1984). Fault behavior and characteristic earthquakes: examples from the wasatch and san andreas fault zones. J. Geophys. Res. 89, 5681–5698. doi: 10.1029/JB089iB07p05681
Senior Seismic Hazard Analysis Comittee (1997). Recommendations for Probabilistic Seismic Hazard Analysis: Guidance on Uncertainty and Use of Experts, Tech. rep. Rockville, MD: U. S. Nuclear Regulatory Commission.
Sepúlveda, I., Liu, P. L. F., and Grigoriu, M. (2019). Probabilistic tsunami hazard assessment in South China Sea with consideration of uncertain earthquake characteristics. J. Geophys. Res. Solid Earth 124, 658–688. doi: 10.1029/2018JB016620
Shelby, M., Grilli, S. T., and Grilli, A. R. (2016). Tsunami hazard assessment in the Hudson River Estuary based on dynamic tsunami-tide simulations. Pure Appl. Geophys. 173, 3999–4037.
Shin, J. Y., Chen, S., and Kim, T.-W. (2015). Application of Bayesian Markov Chain Monte Carlo method with mixed gumbel distribution to estimate extreme magnitude of tsunamigenic earthquake. J. Civ. Eng. 19, 366–375. doi: 10.1007/s12205-015-0430-0
Sibson, R. H. (1982). «Fault zone models, heat flow, and the depth distribution of earthquakes in the continental crust of the United States». Bull. Seismol. Soc. Am. 72, 151–163.
Silva, S., Terrinha, P., Matias, L., Duarte, J. C., Roque, C., Ranero, C. R., et al. (2017). Micro-seismicity in the Gulf of Cadiz: is there a link between micro-seismicity, high magnitude earthquakes and active faults? Tectonophysics 717, 226–241. doi: 10.1016/j.tecto.2017.07.026
Sørensen, M. B., Spada, M., Babeyko, A., and Wiemer, S., and Grunthal, G. (2012). Probabilistic tsunami hazard in the Mediterranean Sea. J. Geophys. Res. 117:B01305. doi: 10.1029/2010JB008169
Sorensen, M. B., Spada, M., Babeyko, A., Wiemer, S., and Grunthal, G. (2012). Probabilistic tsunami hazard in the Mediterranean Sea. J. Geophys. Res. 117:B01305. doi: 10.1029/2010JB008169
Stich, D., de Lis Mancilla, F., and Morales, J. (2005). Crust-mantle coupling in the Gulf of Cadiz (SW-Iberia). Geophys. Res. Lett. 32:L13306.
Stich, D., Martín, R., and Morales, J. (2010). Moment tensor inversion for Iberia– Maghreb earthquakes 2005–2008. Tectonophysics 483, 390–398.
Stich, D., Serpelloni, E., de Lis Mancilla, F., and Morales, J. (2006). Kinematics of the Iberia–Maghreb plate contact from seismic moment tensors and GPS observations. Tectonophysics 426, 295–317.
Stirling, M., Goded, T., Berryman, K., and Litchfield, N. (2013). Selection of earthquake scaling relationships for seismic-hazard analysis. Bull. Seismol. Soc. Am. 103, 2993–3011.
Strasser, F. O., Arango, M. C., and Bommer, J. J. (2010). Scaling of the source dimensions of interface and intraslab subduction-zone earthquakes with moment magnitude. Seismol. Res. Lett. 81, 941–950. doi: 10.1785/gssrl.81.6.941
Suppasri, A., Imamura, F., and Koshimura, S. (2012). Probabilistic tsunami hazard analysis and risk to coastal populations in Thailand. J. Earthq. Tsunami 06:1250011. doi: 10.1142/S179343111250011x
Synolakis, C. E. (2003). Tsunami and Seiche, pp. 9.1–9.99, Earthquake Engineering Handbook. New York, NY: CRC Press.
Synolakis, C. E., Bernard, E. N., Titov, V. V., Kanoglu, U., and GonzáLez, F. I. (2007). Standard, Criteria, and Procedures for NOAA Evaluation Of Tsunami Numerical Models, Technical Memorandum PMEL-135. Washington, DC: NOAA.
Terrinha, P., Matias, L., Vicente, J., Duarte, J., Luís, J., Pinheiro, L., et al. (2009). Morphotectonics and strain partitioning at the Iberia–Africa plate boundary from multibeam and seismic reflection data. Mar. Geol. 267, 156–174.
Taubenböck, H., Post, J., Roth, A., Zosseder, K., Strunz, G., and Dech, S. (2008). A conceptual vulnerability and risk framework as outline to identify capabilities of remote sensing. Nat. Hazard. Earth Syst. Sci. 8, 409–420. doi: 10.5194/nhess-8-409-2008
Thio, H. K., Somerville, P., Polet, J., and Ichinose, G. (2007). “Probabilistic tsunami hazard analysis for ports and harbors. Ports 2007: 30 Years of Sharing Ideas 1977-2007,” in Proceedings of the Eleventh Triennial International Conference. doi: 10.1061/40834(238)103
Tinti, S., and Armigliato, A. (2003). The use of scenarios to evaluate the tsunami impact in southern Italy. Mar. Geol. 199, 221–243.
Tinti, S., Armigliato, A., Pagnoni, G., and Zaniboni, F. (2005). Scenarios of giant tsunamis of tectonic origin in the Mediterranean. ISET J. Earthq. Technol. 42, 171–188.
Tolkova, E. (2016). Tsunami penetration in tidal rivers, with observations of the Chile 2015 tsunami in rivers in Japan. Pure Appl. Geophys. 173, 389–409.
Volpe, M., Lorito, S., Selva, J., Tonini, R., Romano, F., and Brizuela, B. (2019). From regional to local SPTHA: efficient computation of probabilistic tsunami inundation maps addressing near-field sources. Nat. Hazard. Earth Syst. Sci. 19, 455–469.
Ward, S. N. (1991). A synthetic seismicity model for the middle America trench. J. Geophys. Res. 96, 433–421.
Ward, S. N. (1996). A synthetic seismicity model for southern California: cycles, probabilities, and hazard. J. Geophys. Res. 101, 393–322.
Ward, S. N. (2000). San Francisco Bay Area earthquake simulations: a step toward a standard physical earthquake model. Bull. Seismol. Soc. Am. 90, 370–386.
Weisz, R., and Winter, C. (2005). “Tsunami, tides and run-up: a numerical study,” in Proceedings of the International Tsunami Symposium, eds G. A. Papadopoulos and K. Satake, Chania, 322.
Wells, D. L., and Coppersmith, K. J. (1994). New empirical relationships among magnitude, rupture length, rupture width, rupture area, and surface displacement. Bull. Seismol. Soc. Am. 84, 974–1002.
Wesnousky, S. G. (1994). The Gutenberg-Richter or characteristic earthquake distribution, which is it? Bull. Seismol. Soc. Am. 84, 1940–1959.
Wessel, P., and Smith, W. H. F. (1998). New improved version of generic mapping tools released. EOS Trans. Am. Geophys. Union 79:579.
Weatherall, P., Marks, K. M., Jakobsson, M., Schmitt, T., Tani, S., Arndt, J. E., et al. (2015). A new digital bathymetric model of the world’s oceans. Earth Space Sci. 2, 331–345. doi: 10.1002/2015EA000107
Yadav, R. B. S., Tsapanos, T. M., Bayrak, Y., and Koravos, G. C. (2013). Probabilistic appraisal of earthquake hazard parameters deduced from a bayesian approach in the northwest frontier of the himalayas. Pure Appl. Geophys. 170, 283–297. doi: 10.1007/s00024-012-0488-2
Yamada, Y., Masui, R., and Tsuji, T. (2013). Characteristics of a tsunamigenic megasplay fault in the Nankai Trough. Geophys. Res. Lett. 40, 4594–4598.
Yeh, H. (2006). “Tsunami forces in the runup zone,” in NSF Caribbean Tsunami Workshop, eds A. Mercado-Irizarry and P. L.-F. Liu (Singapore: World Scientific).
Zamora, N., and Babeyko, A. Y. (2020). Probabilistic tsunami hazard assessment for local and regional seismic sources along the Pacific coast of Central America with emphasis on the role of selected uncertainties. Pure Appl. Geophys. 177, 1471–1495.
Zhang, Y. J., Witter, R. C., and Priest, G. R. (2011). Tsunami–tide interaction in 1964 Prince William Sound tsunami. Ocean Model. 40, 246–259.
Zielke, O., and Arrowsmith, J. R. (2008). Depth variation of coseismic stress drop explains bimodal earthquake magnitude-frequency distribution. Geophys. Res. Lett. 35, L24301. doi: 10.1029/2008GL036249
Keywords: tsunami, PTHA, montecarlo, tsunamigenic-sources, numerical modeling
Citation: González M, Álvarez-Gómez JA, Aniel-Quiroga Í, Otero L, Olabarrieta M, Omira R, Luceño A, Jelinek R, Krausmann E, Birkman J, Baptista MA, Miranda M and Aguirre-Ayerbe I (2021) Probabilistic Tsunami Hazard Assessment in Meso and Macro Tidal Areas. Application to the Cádiz Bay, Spain. Front. Earth Sci. 9:591383. doi: 10.3389/feart.2021.591383
Received: 04 August 2020; Accepted: 16 April 2021;
Published: 13 May 2021.
Edited by:
Finn Løvholt, Norwegian Geotechnical Institute, NorwayCopyright © 2021 González, Álvarez-Gómez, Aniel-Quiroga, Otero, Olabarrieta, Omira, Luceño, Jelinek, Krausmann, Birkman, Baptista, Miranda and Aguirre-Ayerbe. This is an open-access article distributed under the terms of the Creative Commons Attribution License (CC BY). The use, distribution or reproduction in other forums is permitted, provided the original author(s) and the copyright owner(s) are credited and that the original publication in this journal is cited, in accordance with accepted academic practice. No use, distribution or reproduction is permitted which does not comply with these terms.
*Correspondence: Mauricio González, Z29uemFsZXJlQHVuaWNhbi5lcw==