 Stéphane Affolter
 Markus C. Leuenberger
- 1Climate and Environmental Physics Division, Physics Institute and Oeschger Centre for Climate Change Research, University of Bern, Bern, Switzerland
- 2Quaternary Geology, Department of Environmental Sciences, University of Basel, Basel, Switzerland
Water isotopes are powerful proxies able to deliver valuable information about past climate conditions at the precipitation site, along the path of the moisture or at its source. We use a recently developed microliter sampling technique associated with continuous-flow laser spectroscopy in order to investigate its potential for direct determination of 17Oexcess on microliter amount of water released from speleothem crushing. Results from Milandre Cave stalagmite (Switzerland) suggest that 17Oexcess from speleothem fluid inclusion water could likely be used as a paleoclimate proxy and to resolve past hydroclimatic changes mainly depending on (i) the technical capability to produce precise and accurate direct measurements and (ii) our understanding of which factors influence the 17Oexcess proxy in speleothem fluid inclusion water. With our setup, the main challenge regarding 17Oexcess measurements is the very low amount of water released by the crushing of speleothem samples, which also lead to the difficulty of producing sample replications. The precision achieved based on duplicate measurements is ∼30 per meg, which is currently a value too high to retrieve robust paleoclimate information. We suggest sample replications and further improvement of the presented method through the increase of the signal to noise ratio and correction for isotope composition—mixing ratio dependence to reach the required precision of 10 per meg or less.
Introduction
Water stable isotopes of oxygen and hydrogen of past precipitation are widely used in paleoclimatology (e.g., Seierstad et al., 2014; Lecavalier et al., 2017; Affolter et al., 2019). The isotope composition may be preserved without significant alterations in natural archives such as ice from polar regions (Landais et al., 2008) or at lower latitudes in glacier or in ice caves (Persoiu et al., 2017). Water can also be found in speleothems (secondary cave carbonate deposits) as small fluid inclusions surrounded by a calcite matrix (Affolter et al., 2014) as well as from gypsum hydration (Gazquez et al., 2015). As such, the water found in these archives constitutes a direct witness of past precipitation falling above the study site, which froze as ice or was sealed in the calcite micro-voids. However, post-depositional oxygen isotope exchange may occur in speleothems between calcite (hereafter δ17Oc or δ18Oc) and fluid inclusion water (hereafter δ17O or δ18O), whereas the hydrogen (δD) seems to remain essentially unaltered (Demeny et al., 2016; Affolter et al., 2019; Uemura et al., 2020). We use the delta notation (δ given in permil (‰) to describe changes in isotopic composition, which is defined as in Eq. (1):
where R is the ratio of the rare to the frequent isotope abundances. To date, most water isotope studies focus on hydrogen and oxygen stable isotopes or to a minor extent on the deuterium excess (d = δD – 8 ×δ18O), proxies that could deliver information about past temperature, precipitation amount or moisture source. The derived parameter 17Oexcess, which is defined in Eq. (2):
and is given in per meg (10–6) due to very small variations has received less attention. Historically, this parameter has been poorly studied because of methodological limitations. Measurements of 17Oexcess were first achieved using fluorination of water prior to isotope analyses (e.g., Oneil and Epstein, 1966; Baker et al., 2002; Barkan and Luz, 2005). More recent advances in laser spectroscopy have allowed a routine measurement of triple stable isotopes including precise and rapid determination of 17Oexcess in discrete water samples (Steig et al., 2014). This has enabled studies about 17Oexcess variability in water from precipitation (Leuenberger and Ranjan, 2021; Leuenberger et al., 2021), tap water (Li et al., 2015), rivers (Luz and Barkan, 2010) or ocean water (Schoenemann and Steig, 2016; Uechi and Uemura, 2019). It is relatively straightforward to measure water isotopes and 17Oexcess on “modern” samples because the water amount is not limiting. However, analysis of ancient water that is either chemically- or physically bound (e.g., in gypsum or fluid inclusions) is more difficult because 100s–1000s mg of material is needed to acquire sufficient water for sampling. For example, fluid inclusions make up 0.05–0.5% of speleothem by weight (McDermott et al., 2006).
The low temperature sensitivity of about 1 per meg/°C relative to the much larger expected changes due to relative humidity variations (at the moisture source) makes 17Oexcess an interesting proxy in hydrological studies (e.g., Uemura et al., 2010; Sha et al., 2020). Paleoclimate interpretations of 17Oexcess data have been acquired from Greenland (Landais et al., 2018) and Antarctica (Landais et al., 2008; Winkler et al., 2013) ice cores, from gypsum hydration water in lakes from Spain (Gazquez et al., 2018) or from speleothems in Switzerland (Affolter et al., 2015). In these studies, different techniques were used for 17Oexcess measurements of the water: for ice cores, the ice is melted and the water is further analyzed using the method of water fluorination with a precision of ± 6 per meg (e.g., Winkler et al., 2013). For gypsum, researchers extracted a large amount of hydration water (∼40–60 μl) using the decrepitation technique and a cryogenic trap (Gazquez et al., 2015). Once released, the water is filled in 2 ml vials that are further placed in an autosampler and measured using a Picarro L2140-i laser instrument. This setup allows the measurements of past hydration water with a precision of ± 8 per meg mostly related to the high amount of water available. However, there is also a possibility of fractionation, either during filling or storing water in vials. For speleothems, Sha et al. (2020) explored the fractionation between water and calcite. They analyzed 17Oexcess on speleothem calcite (precision of ± 9 per meg) and used the data to calculate the triple isotopic composition of the parent drip water. Yet, it still needs to be shown whether calcite measurements indeed represent the 17Oexcess values of water. This issue may be solved with the direct measurement of the water stored in the speleothem fluid inclusions (Affolter et al., 2015). Generally, studies using laser spectroscopy (e.g., Picarro L2140-i) to analyze water samples can generate precise and accurate 17Oexcess data (± 8 per meg) in the operation mode recommended by the manufacturer and especially using the required amount of water for single water samples of 2 ml (Steig et al., 2014) or from archives (Gazquez et al., 2015). However, with our setup (Affolter et al., 2014, 2015) it is more difficult to analyze 17Oexcess values robustly, potentially due to (i) the low extracted water amount per calcite sample crushing (∼0.5–4 μl), (ii) the water released in a continuous-flow mode and (iii) the difficulty to produce sample replications. Because 17Oexcess in speleothem fluid inclusions can provide valuable paleoclimate information independently of possible complicating kinetic effects during calcite formation in speleothem, it is important to assess which methodology is required to acquire suitable measurements. Therefore, using a fluid inclusion extraction line directly connected to a cavity ring-down spectrometer, we examined how analytical conditions (sample size, background level, normalization scheme) affect the accuracy and precision of 17Oexcess analyses. To further assess the results, we made preliminary comparisons with other existing records.
Experimental Settings
Reported measurements are based on M6 stalagmite from Milandre Cave in north-western Switzerland (Affolter et al., 2019). The stalagmite already delivered robust information about past temperature evolution over the Holocene and the Younger Dryas (Affolter et al., 2015, 2019). The cave is set in sub-horizontal Mesozoic limestone from the geological structure of the Jura mountains. The location of the cave makes it an ideal candidate to study the moisture source variability in the past, especially as the site is strongly dominated by westerlies during winter precipitation (Sodemann and Zubler, 2010; Affolter et al., 2020). In a previous study, duplicate measurements of fluid inclusions of recent stalagmite samples suggested that crushing of speleothem samples potentially delivered usable 17Oexcess values (Affolter et al., 2015). We measured samples with an age range corresponding to the last 80 years and obtained a mean value of 10 ± 36 per meg, which was close to modern values in precipitation that was 18 per meg for the interval 2013–2015, which itself was similar to the drip water values feeding the stalagmite. This observation suggested that the 17Oexcess signal from precipitation could likely be preserved in speleothem fluid inclusion water, despite numerous competing factors affecting the oxygen isotopes in a karstic environment (Lachniet, 2009).
Triple water isotope measurements of speleothem fluid inclusion water including 17Oexcess were performed at the Physics institute of the University of Bern (Affolter et al., 2014) between June 2016 and February 2017. Results for δD and δ18O on the same samples were published in Affolter et al. (2019). The method to extract and analyze speleothem fluid inclusion water is described in Affolter et al. (2014) and is summarized as follows: a stalagmite sample of approximately 1 g is placed in a copper tube and connected to the measuring line, which is held constantly at 140°C ± 0.1°C and flushed with a dry nitrogen/standard water mixture carrier. We operate measurements on a continuous background level of standard water in order to cancel or minimize the memory effect. After the sample is crushed using a hydraulic press, the released sample water is vaporized and directly flushed to the laser instrument (Picarro L2140-i, Santa Clara, United States) without any treatment of the water molecule prior to its measurement.
Method Development
Calibration of Oxygen Isotopes and 17Oexcess
Evaluation of isotope ratios, including 17Oexcess, are based on the method described in Affolter et al. (2014) as outlined in Supplementary Figure 1. Instrument calibration was applied using a linear correlation between the measured values and the assigned values of laboratory water standards on the Vienna Standard Mean Ocean Water (VSMOW) scale independently for each of the three measurement periods. Following Affolter et al. (2015), we calibrate 17Oexcess independently of δ17O and δ18O using a three-point approach, with the standard sets given in Table 1. This generally leads to an inconsistency between the directly calibrated 17Oexcess data and those calculated from calibrated δ17O and δ18O as seen below. A normalization of the δ17O values is obtained through Eq. (2) of Affolter et al. (2015), namely by calculating δ17O from the calibrated δ18O and 17Oexcess. We favor the calibration procedure of measured 17Oexcess values based on the fact that the precision of 17Oexcess significantly exceeds precisions of δ17O and δ18O values due to the cancellation of covariation of their signals (Landais et al., 2006; Barkan and Luz, 2007; Schoenemann et al., 2013). The difference with Schoenemann et al., 2013 approach leads to small differences as documented in Affolter et al., 2015 in the order of less than 10 per meg. Specifically, for the calibration of δ18O, we used the internal water standards Meerwasser 77, ST-08 and GISP (Table 1). In order to increase the range for δ17O and 17Oexcess reference values we used two alternative standards with known δ17O and 17Oexcess values, which are Eiswasser and DOME-C in addition to ST-08. Figure 1 shows the linear relationship between measured (x) and assigned (y) values used for the δ17O and δ18O (R2 = 0.999) and 17Oexcess (R2> 0.930) calibration. Isotope values of standards were determined precisely against VSMOW and VSLAP with Isotope Ratio Mass Spectrometry (IRMS) at the Physics institute in Bern for δ18O and at the Laboratoire des Sciences, du Climat et de l’Environnement in Paris for δ17O and 17Oexcess. See Affolter et al. (2015) for more information about the calibration and standard isotope values.
Table 1. Standard waters used in this study.
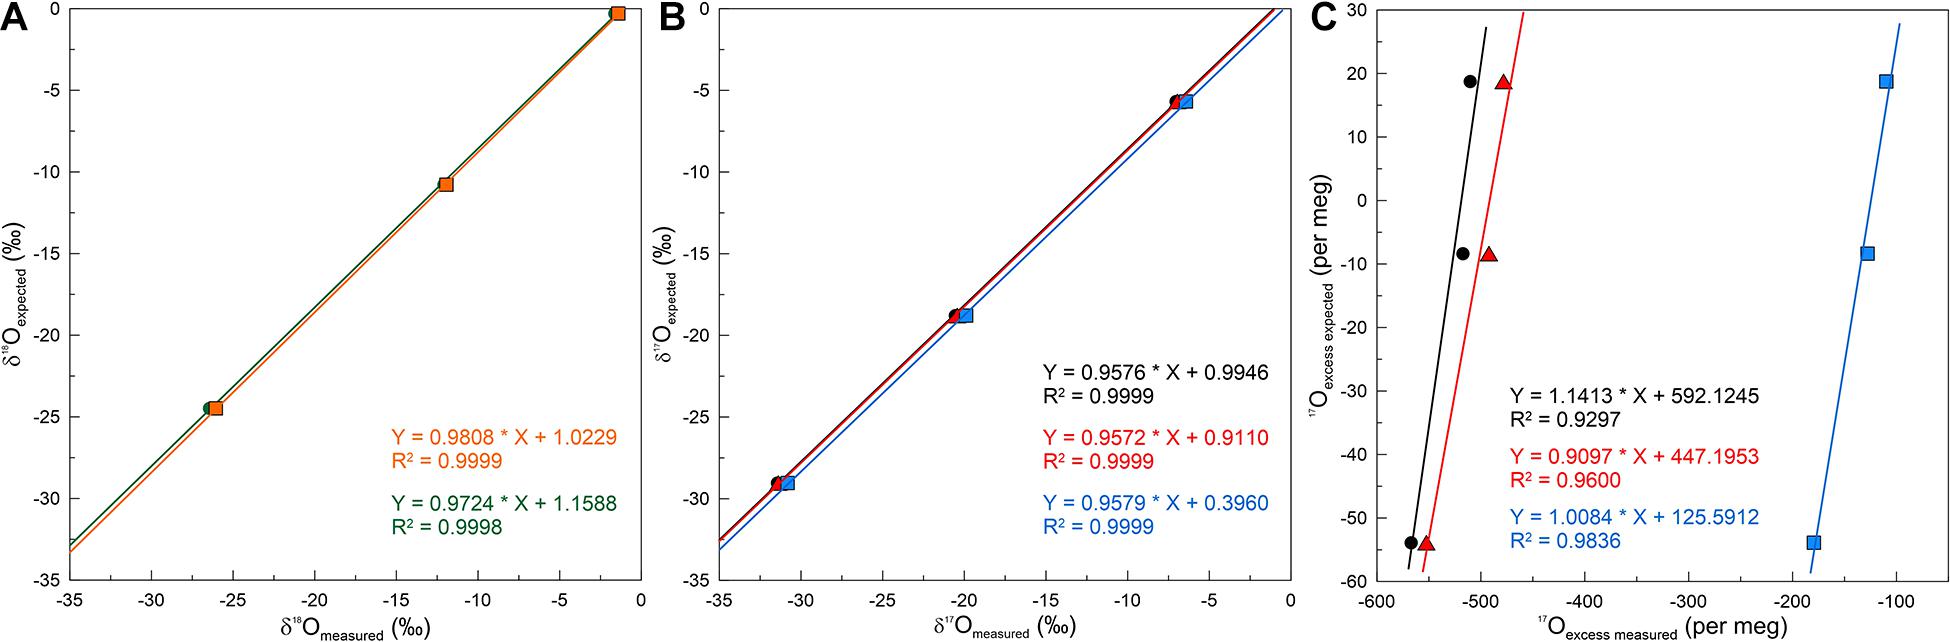
Figure 1. Calibrations used for δ18O (A), δ17O (B), and 17Oexcess (C) measured with the Picarro L2140-i for three different time periods (shown as different colors) between June 2016 and January 2017. For δ18O calibration we used GISP, ST-08 and Meerwasser standards. For δ17O and 17Oexcess, we used Dome-C, Eiswasser and ST-08 standards. See Table 1 for assigned values.
To evaluate the 17Oexcess values of fluid inclusion samples, we used the same approach as for the calculation of the hydrogen and oxygen isotopes (Eq. 3; Affolter et al., 2014). The evaluated 17Oexcess values correspond to the measured mean of the 17Oexcess values of the mixture (sample + background) from which the mean 17Oexcess of the background is subtracted and then divided by the released water amount of the sample (Figure 2 and Eq. 3). All means were previously integrated over time.
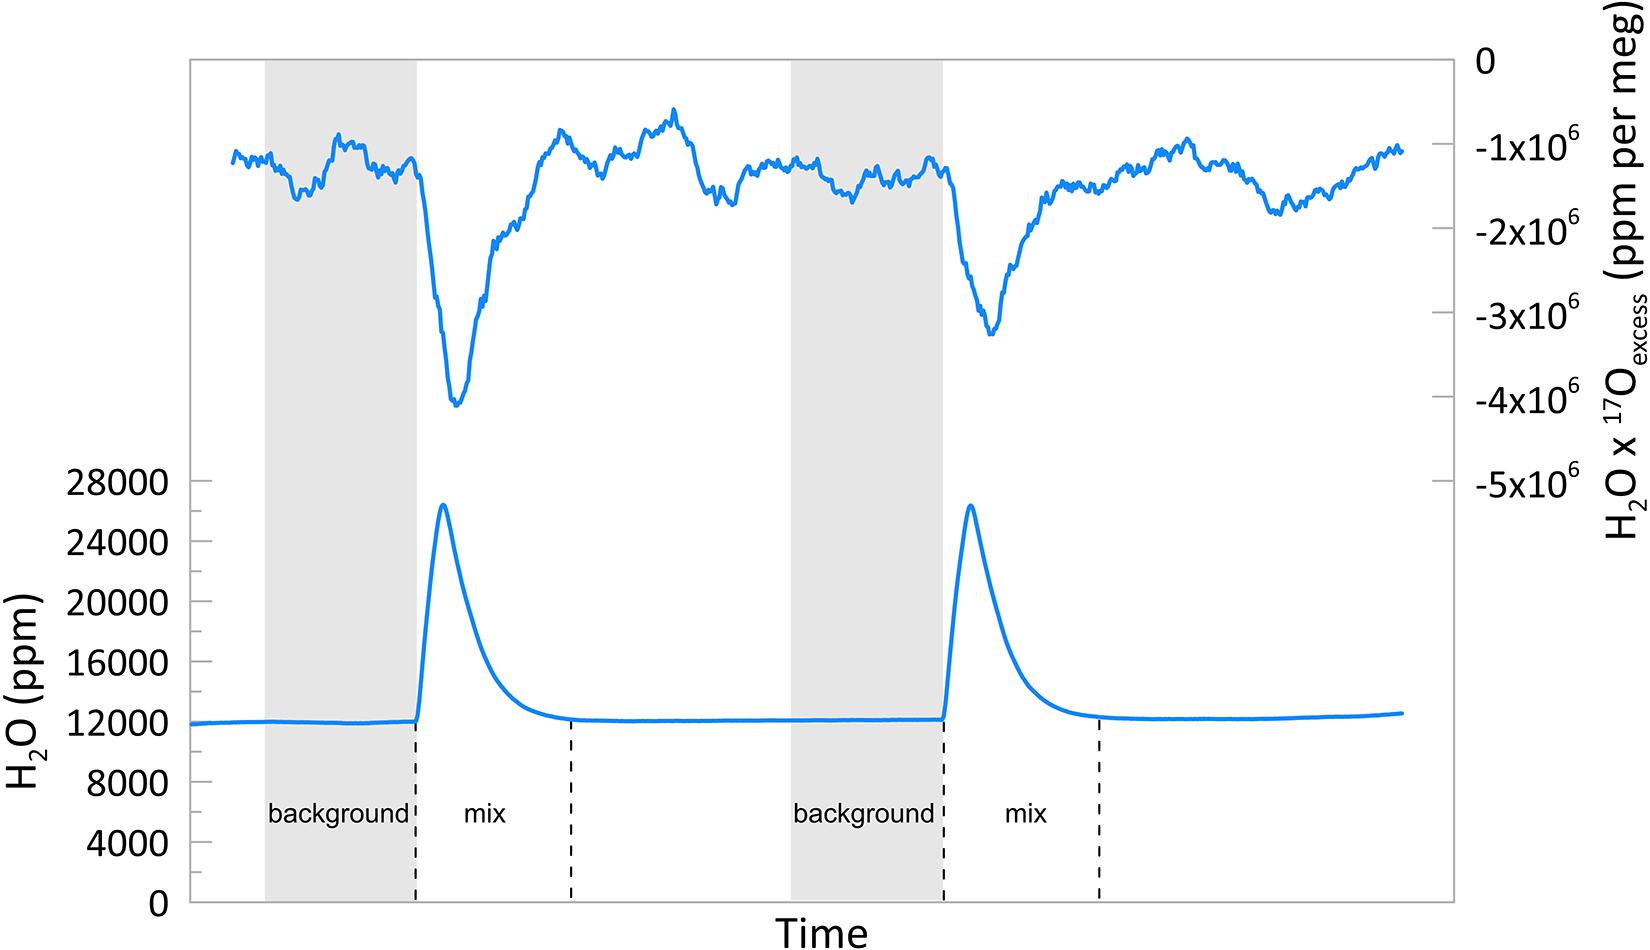
Figure 2. Examples of 17Oexcess measurement for two stalagmite samples and corresponding H2O peaks. Final 17Oexcess values are calculated from the integration of 17Oexcess and H2O over time (upper panel). Values of H2O ×17Oexcess are averaged over 5 min in order to amplify the signal illustrated. 17Oexcess “mix” represents the mixture of sample and background waters analyzed.
Precision achieved for δ18O and δ17O measurements based on syringe standard water injections to the custom-made line are better than 0.2 and 0.3‰, respectively (Figure 3). Thus, the theoretical error for 17Oexcess measurement of fluid inclusion samples could be estimated as follows: if we assume that no covariation exists between δ17O and δ18O errors, the measurement precision would be in the order of 320 per meg (propagation of uncertainty) or 160 per meg based on the replicate measurements (standard deviations of 0.2 and 0.1‰ for δ18O and δ17O, respectively, section “Consideration of Other Published Results”), which is far too high to retrieve information about past climate and/or environment from the archives. Nonetheless, due to its mass dependent properties, both oxygen isotopes are co-varying and consequently, even if the individual standard deviation of oxygen isotopes measurements is high, 17Oexcess can be precisely calculated (Landais et al., 2006; Barkan and Luz, 2007; Schoenemann et al., 2013). Variation estimation based on the background values displayed in Figure 2 leads to about 80 per meg for short-term variations (10 s). See section Modern and Holocene Samples for more information.
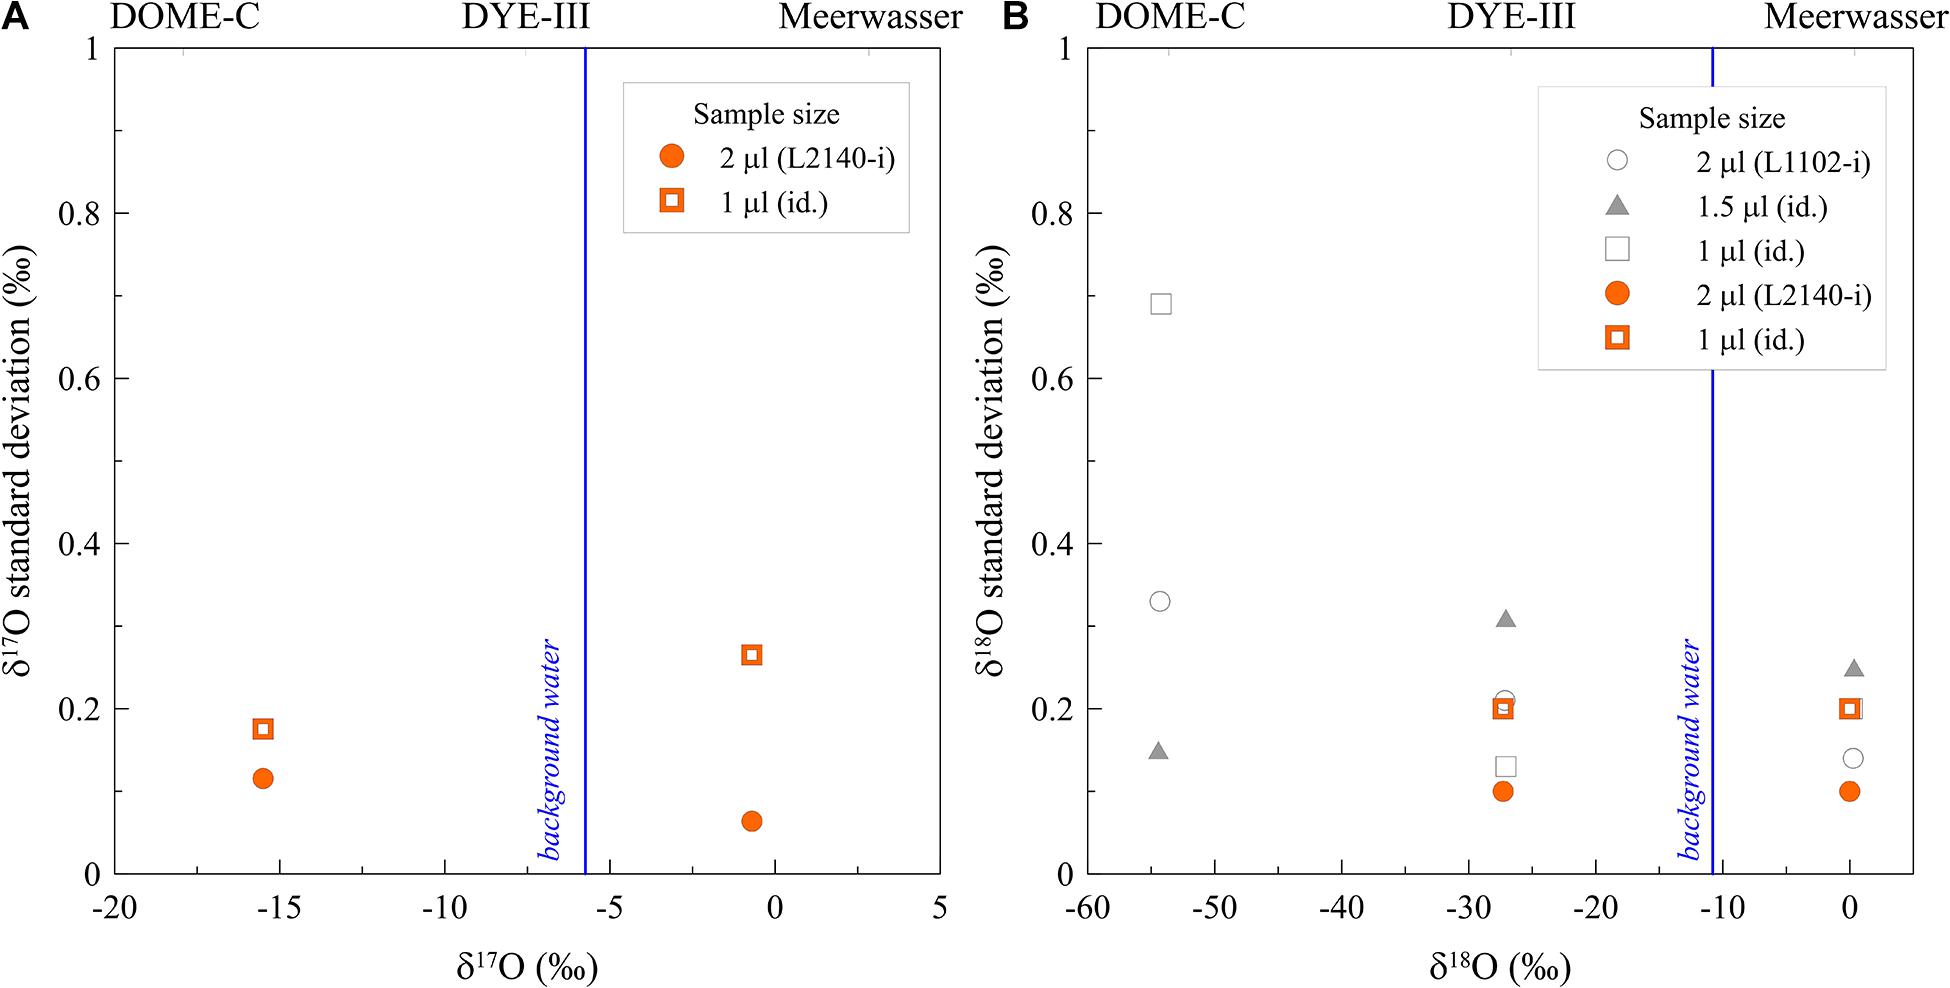
Figure 3. Comparison of the fluid inclusion line performance between the laser spectrometers L2140-i (orange symbols, this study) and L1102-i (gray symbols; Affolter et al., 2014). We injected standard waters of 1 and 2 μl with a syringe for δ17O (A) and δ18O (B) measurements.
Shift of the 17Oexcess (δ17O) Analyzer Baseline
We show that the 17Oexcess values evaluated using our protocol (Supplementary Figure 1) are automatically corrected for shifts in δ17O response of the analyzer (Figure 4). When displaying 17Oexcess values based on calibrated δ17O and δ18O versus the values obtained through our protocol (blue dots) different linear dependencies become visible. However, if we normalize these calculated data for the observed linear dependencies (slope and offset corrected, orange dots; offset corrected, open black dots), a significantly improved agreement with our values is achieved. The reason for these observed shifts must be due to an abrupt change in the measurement behavior of the laser instrument. It also suggests that the way we evaluate the data (direct calibration of 17Oexcess) allows to avoid issues related to background variabilities as the evaluated 17Oexcess values of the sample are independent of the background values as the latter is subtracted from the two-component sample/background mixture which is determined shortly before the peak. The same results would be obtained if δ17O calibration would be made on δ17O values corrected for the measured 17Oexcess values. This would correct these apparent shifts in the calibrated δ17O and finally end up with correct 17Oexcess values.
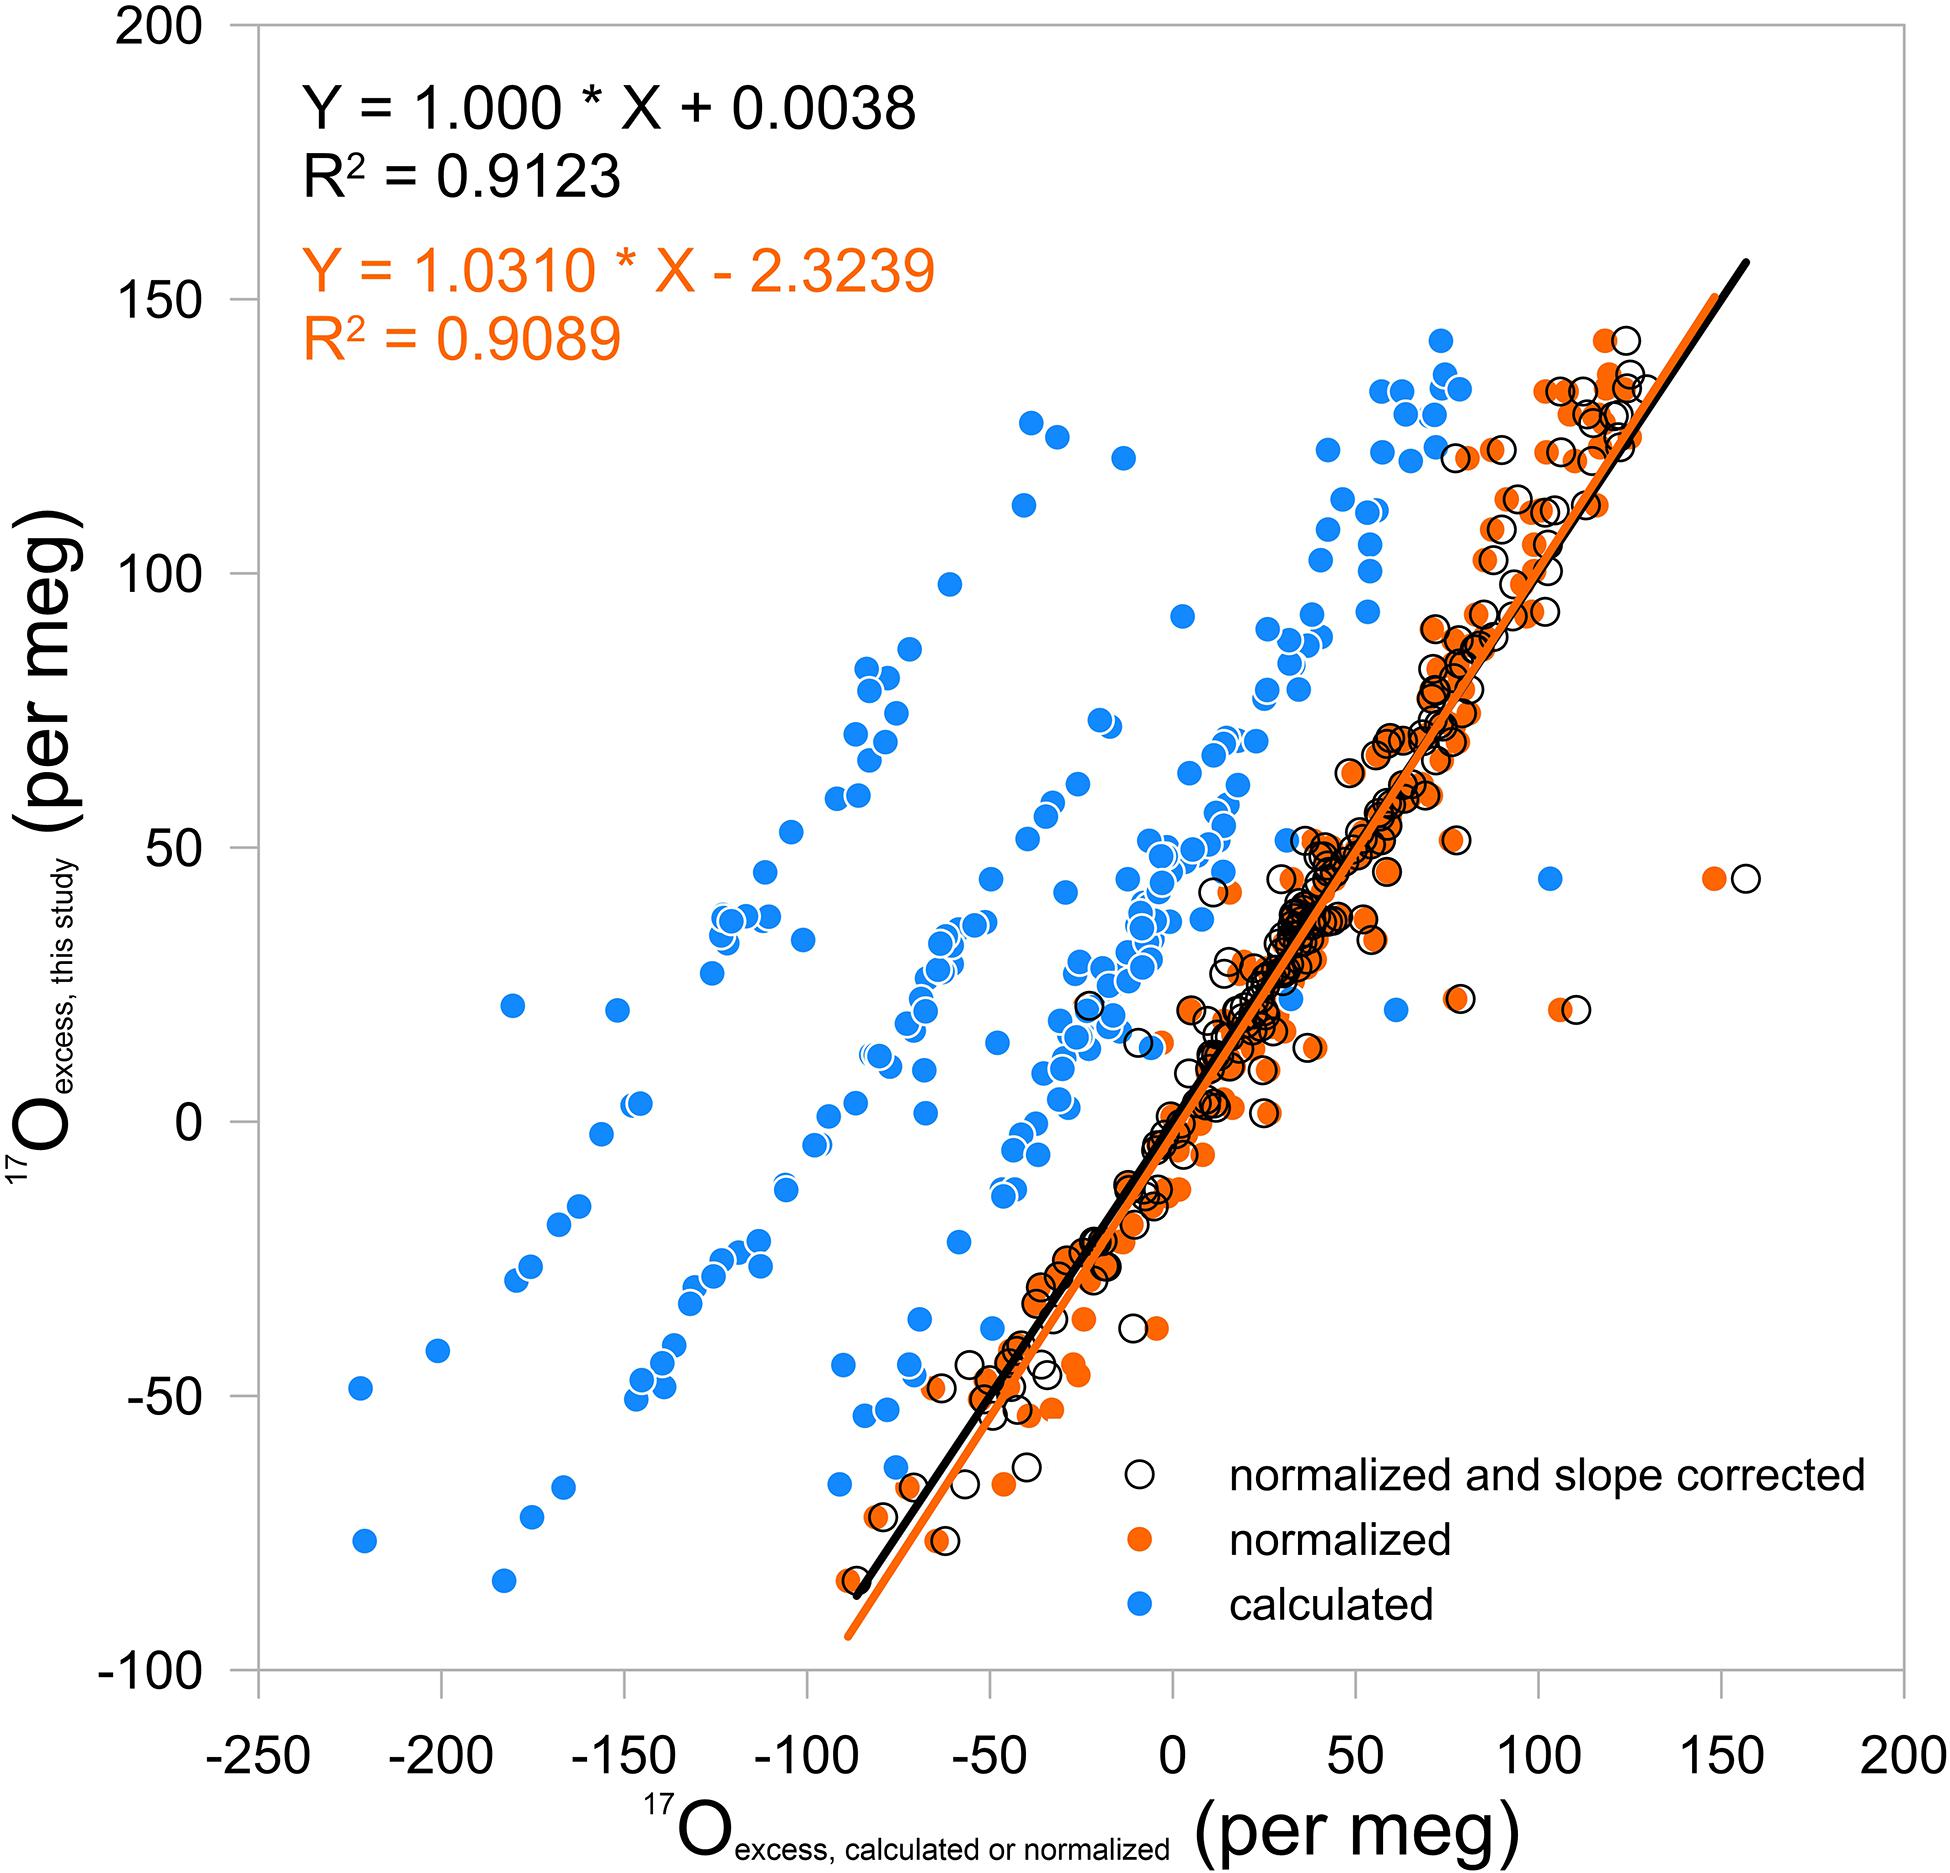
Figure 4. Calculated 17Oexcess based on calibrated δ17O and δ18O (blue) values and versus measured 17Oexcess. Values of 17Oexcess calibrated from this study (see Figure 1; y-axis) are compared with the calculated values based on measured δ17O and δ18O that were themselves calibrated with different standards (blue dots; x-axis) and with normalized values such that zero offsets are eliminated (open black dots; x-axis) or slope and offset corrected (orange dots; x-axis). Here, the blue dots document the long-term variability of 17Oexcess measurements of the laser spectrometer. See our protocol in Supplementary Figure 1.
The difference between the normalized values and the directly calibrated 17Oexcess values (Figure 5) shows that almost all values are within a range of ±20–30 per meg similar as obtained when measuring duplicates (see section “Consideration of Other Published Results”), which suggests that 17Oexcess measurements would be reliable if a better precision of 10 per meg or less would be reached.
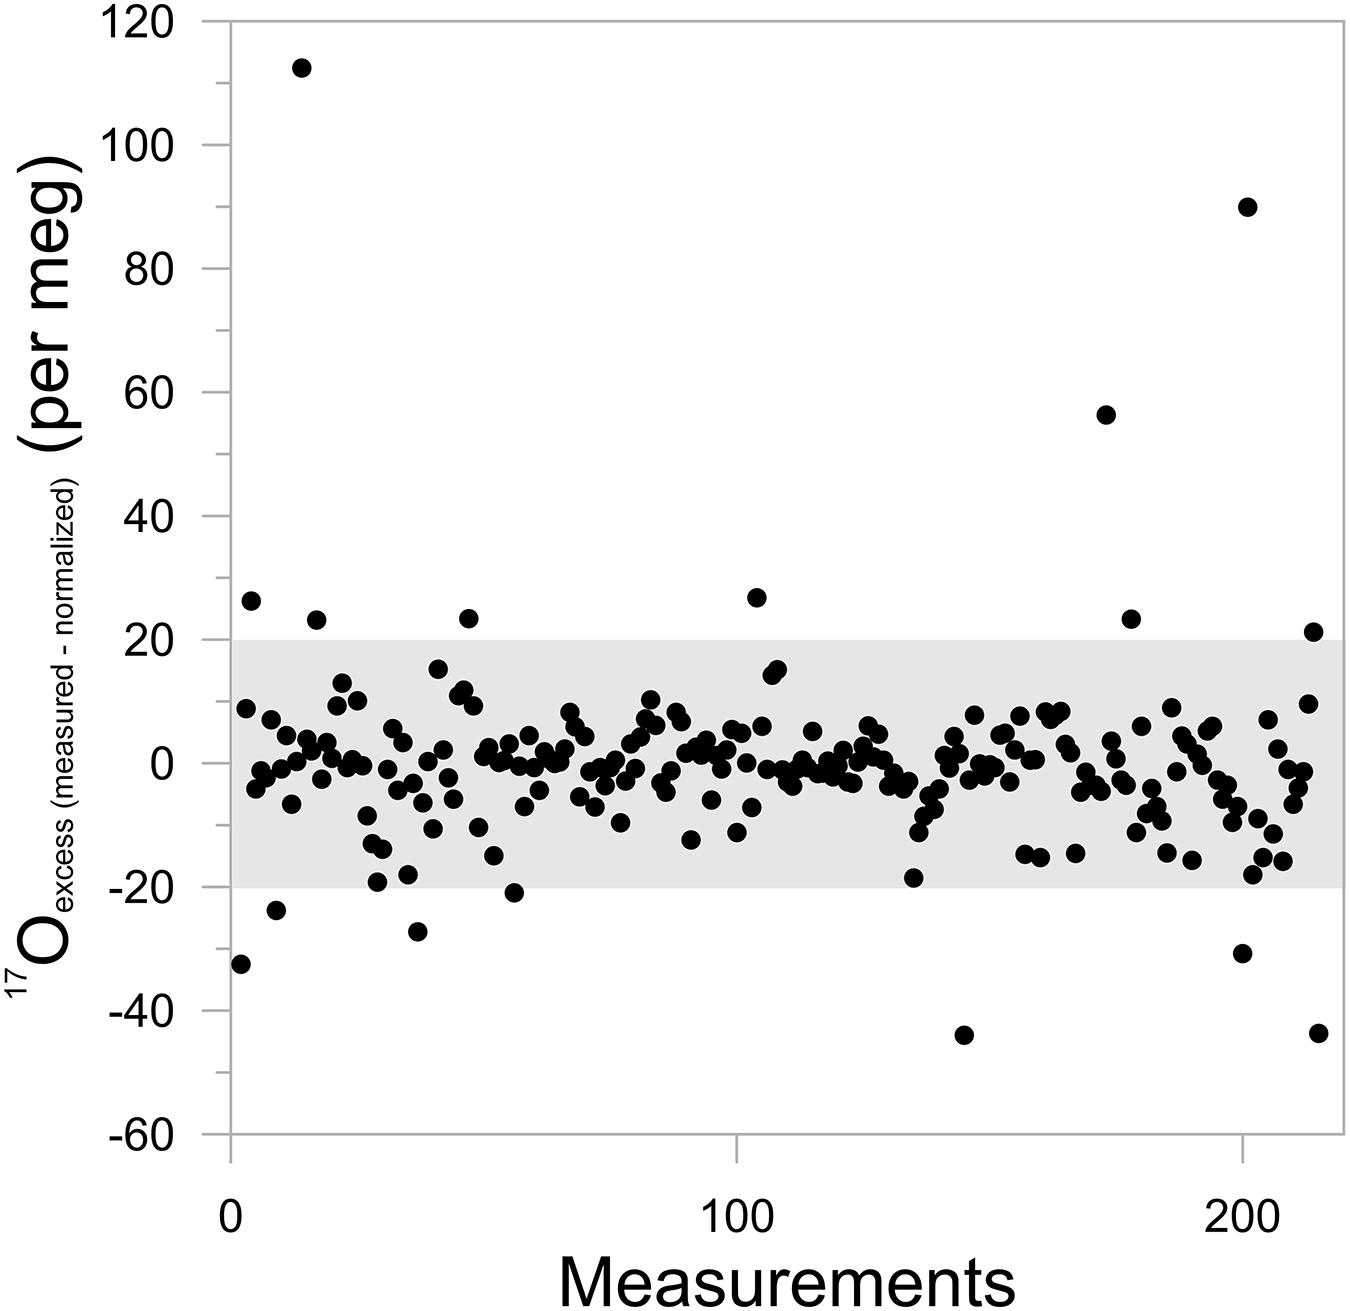
Figure 5. Difference between 17Oexcess values calibrated using our protocols and scaled calibrated δ17O and δ18O values with zero offset normalization and slope correction. The gray shaded area corresponds to the range when taking an uncertainty of ± 20 per meg (standard deviation of the normalized values).
Results and Discussion
Speleothem Fluid Inclusion 17Oexcess Values and Data Selection
The full δ17O and 17Oexcess records consist of 255 values. For δ17O, values range between −6.4 and −1.8‰. For 17Oexcess, the range of values is between −152 and 1,378 per meg, which is unrealistic compared to the range of modern precipitation at the same location (−26 to 72 per meg; with a 2 year’s mean of 18 ± 15 per meg; Affolter et al., 2015), meaning that undetermined processes affect the precision and/or accuracy of measurements. Therefore and for the purpose of the study, i.e., the evaluation of the potential of the 17Oexcess values, we followed two different selection criteria as discussed in the following. The first criterion is based on the range of modern precipitation values. We discarded 41 values that are considered as outliers based on the following procedure. As a first step to evaluate the data, we chose to be conservative in order to not exclude too many data as long as we assess their potential relevance and, thus, used two standard deviations of the last 80 years fluid inclusion measurements (±72 per meg, Table 2). It results in the selection of values ranging from −98 to 144 per meg. The broad selection made here allows an investigation of the dataset in terms of methodological development. It is interesting to note that the discarded values, following the above criteria, exhibits a lower slope for δD versus δ18O compared to the selected ones. This agrees with the recent finding of Uemura et al. (2020) that an oxygen isotope exchange between fluid inclusion and calcite lead to an oxygen enrichment and therefore to a lower slope for δD versus δ18O correlation (Supplementary Figure 2). The corresponding mean deuterium excess values are 3.6‰ for the discarded data and 6.0‰ for the selected data. It is noteworthy to mention that the fluid inclusion δD and δ18O values as documented in Affolter et al. (2019) plot along the LMWL (Supplementary Figure 3). For paleoclimate interpretation, additional criteria may be added once the required precision for 17Oexcess measurements will be achieved. Thus, a more conservative approach based on the water amount released criterion as visible on Figure 6 can be used, for instance, with the selection of amounts higher than 2.0 μl, this criterion would, however, have the disadvantage to exclude a large amount of potentially reliable values (only 144 out of 255 values; Supplementary Figure 4) and is not compatible with the reproducibility tests shown in Figure 3. For further data assessment, we chose the first criteria and selected 214 out of 255 measurements, which corresponds to 84% of the total (Figure 6). The mean value and its standard deviation of selected values is 34 ± 48 per meg. The slope obtained for a correlation between δ17O and δ18O from the inclusion water yields 0.529 ± 0.011, which is close to the global meteoric water line (GMWL) for oxygen with a slope of 0.528 (Luz and Barkan, 2010) and the local meteoric water line (LMWL) with a slope of 0.527 ± 0.001 (Figure 7).
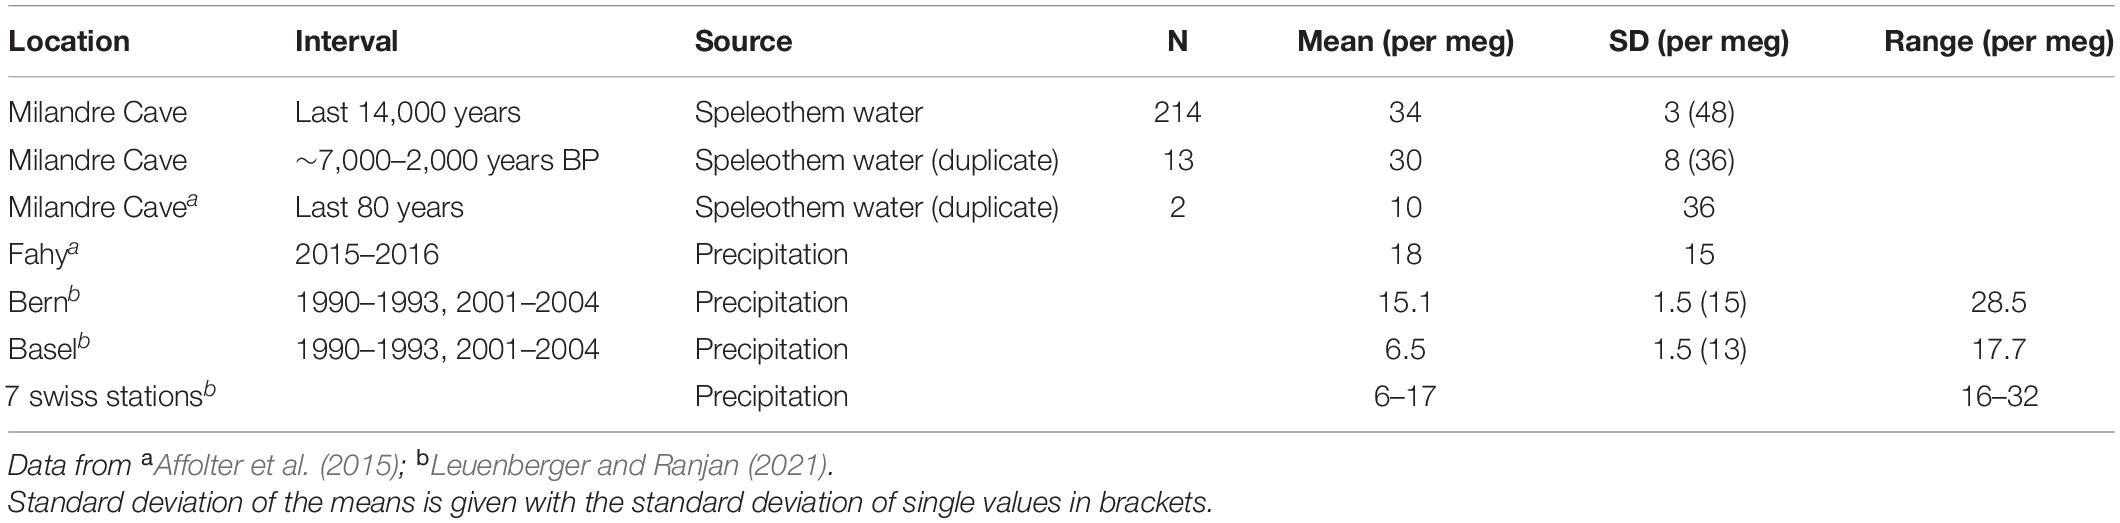
Table 2. Mean 17Oexcess values obtained for different time interval and sources.
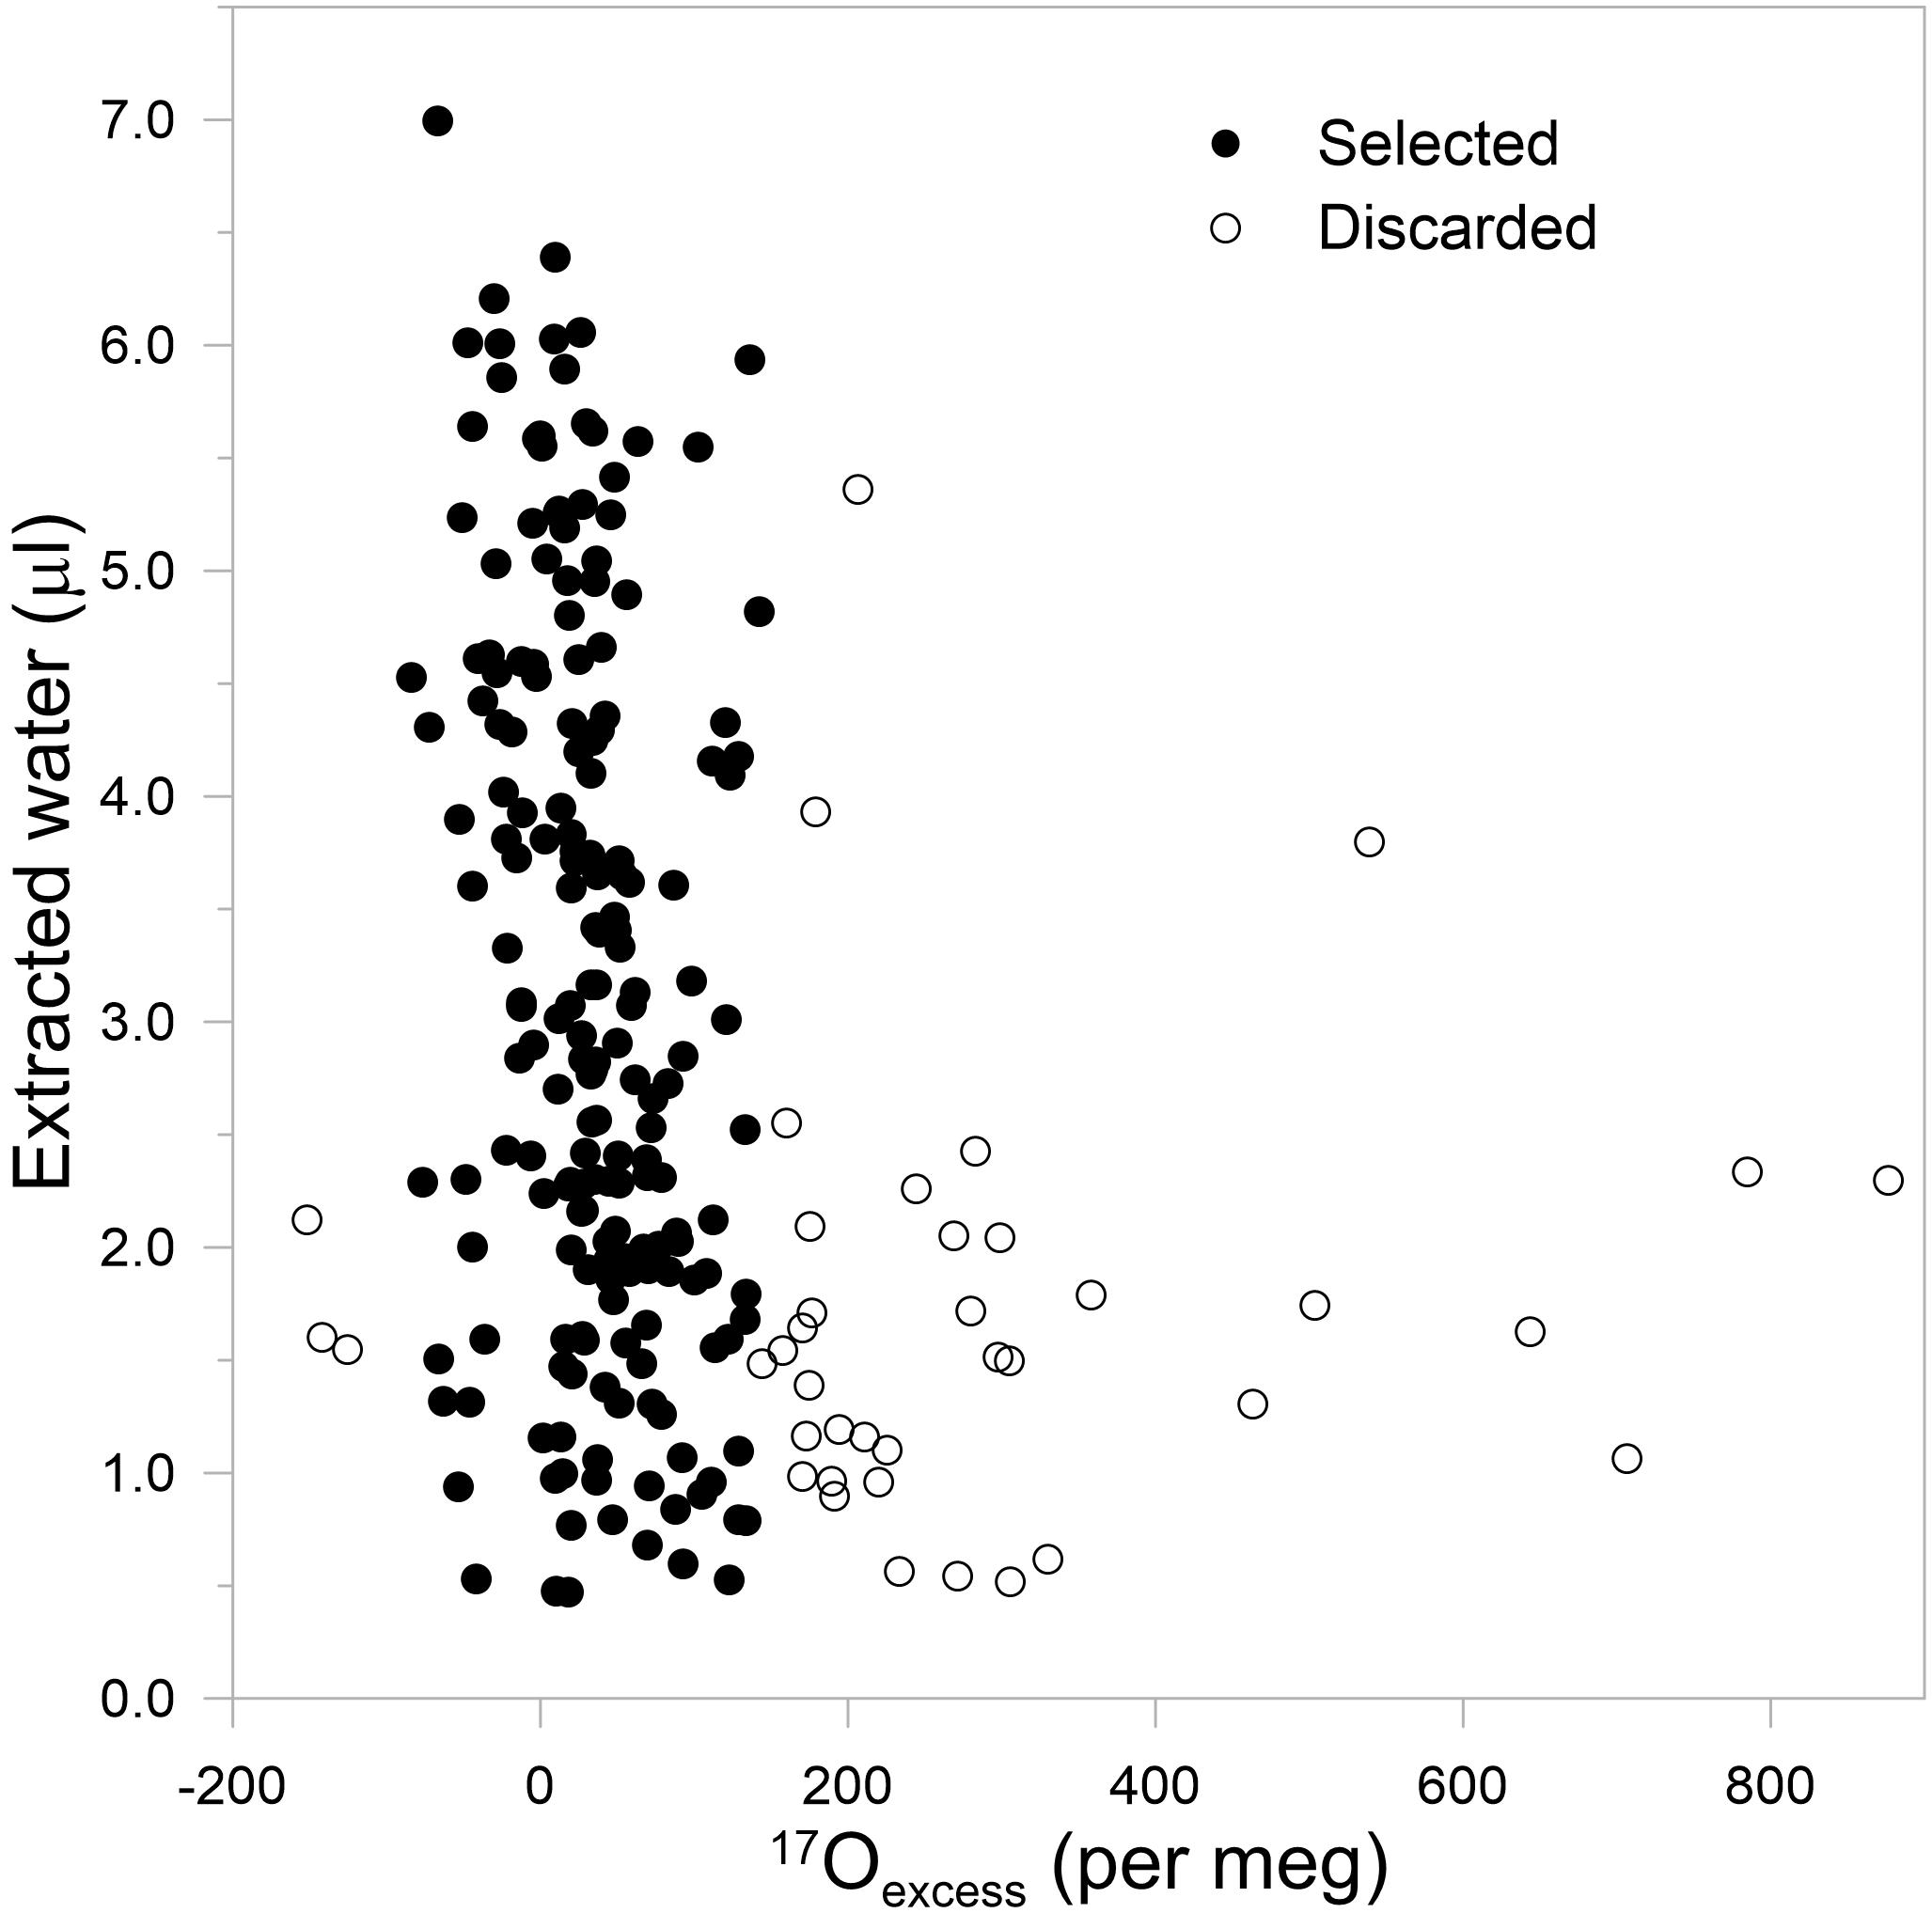
Figure 6. Selection of values using the criteria given in section “Speleothem Fluid Inclusion 17Oexcess Values and Data Selection.” 17Oexcess values versus extarcted water amount (if available). Discarded values are shown as open circles.
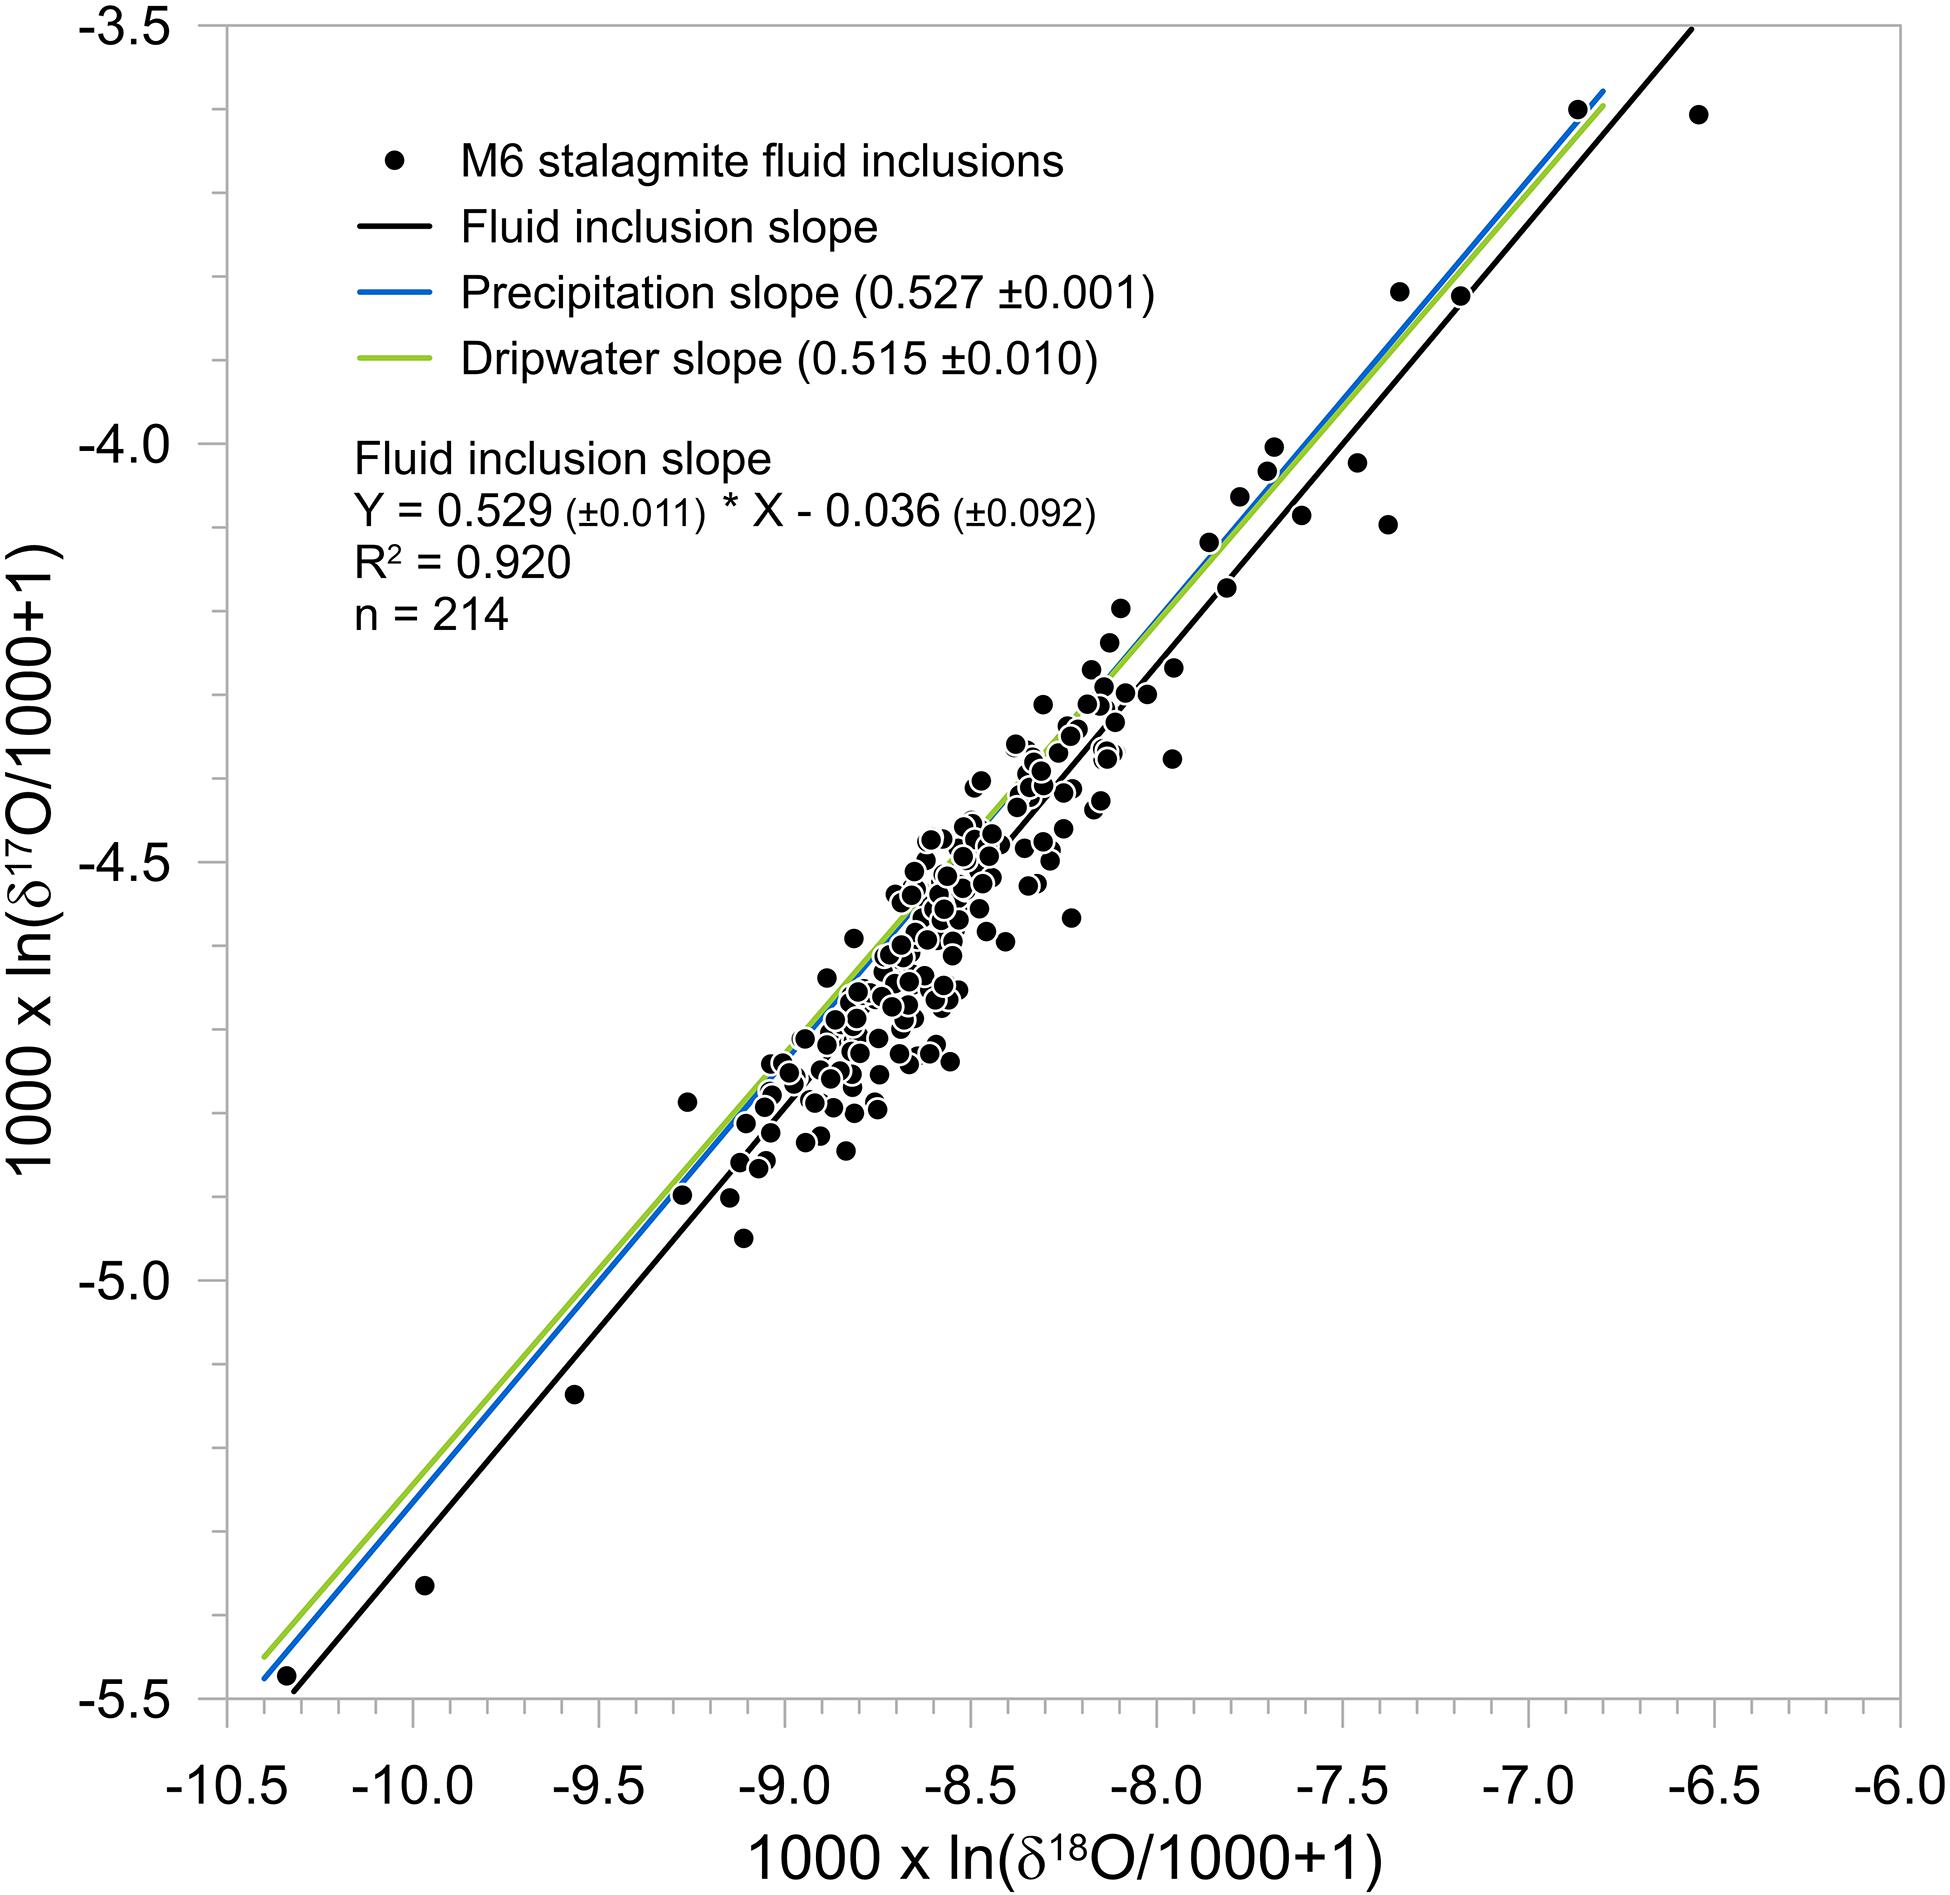
Figure 7. Relationship between δ17O and δ18O in speleothem fluid inclusion water compared to the slopes of the local meteoric water line in precipitation above the cave and to the drip water in Milandre Cave as measured between 2012 and 2015 (Affolter et al., 2015).
Modern and Holocene Samples
The previous value of 10 ± 36 per meg (based on duplicates) that we obtained in recent fluid inclusions was close to modern values in precipitation that is 18 per meg for the interval 2013–2015, which itself is similar to the drip water values feeding the stalagmite (Affolter et al., 2015). This recent speleothem value is also within the range of values observed in Swiss precipitation samples (6–17 per meg; Leuenberger and Ranjan, 2021) for the period between 1990 and 2004 (Table 2). We consider these preliminary observations as promising in retrieving 17Oexcess values from speleothem fluid inclusion water. We also suggest that the fairly good agreement in modern values could allow looking at long-term trends essentially due to the smoothing of values obtained either by replication of samples or by high resolution obtained with a large amount of data.
Affolter et al. (2019) have measured duplicate samples originating from 15 calcite blocks of stalagmite M6 split in half, i.e., 30 measurements, which allows an estimation of the measurement reproducibility based on real samples and under measuring conditions (Table 3). We selected samples with large amount of water and for which low variability in the stable isotope ratios were expected. The latter assumes that weak climatic and/or environmental variability shall represent stable conditions for isotope ratios. For the oxygen stable isotopes, the overall mean standard deviation for the duplication of 15 Holocene samples is 0.2‰ for δ18O (range 0.0–0.7‰) (Affolter et al., 2019) and 0.1‰ for δ17O (range 0.0–0.4‰). For 17Oexcess, we exclude two replicates for samples M6-167 (188 per meg) and M6-189 (229 per meg), which are above the defined criterion. The mean standard deviation between duplicates is ± 27 per meg with values ranging between 2 and 51 per meg and one third of the values below 10 per meg (Table 3). Mean deviations obtained from duplicate measurements (36 per meg) are in the range of the full record mean (48 per meg) of the monitored precipitation range (15 per meg) and in agreement with previous measurements of recent samples (36 per meg; Table 2). Results are precise for the stable isotopes but for 17Oexcess several samples per time period need to be considered in order to reduce the standard error to the expected range for the detection of natural variations. For instance, using 10 measurements per time period would lead to an expected standard error of 7–10 per meg.
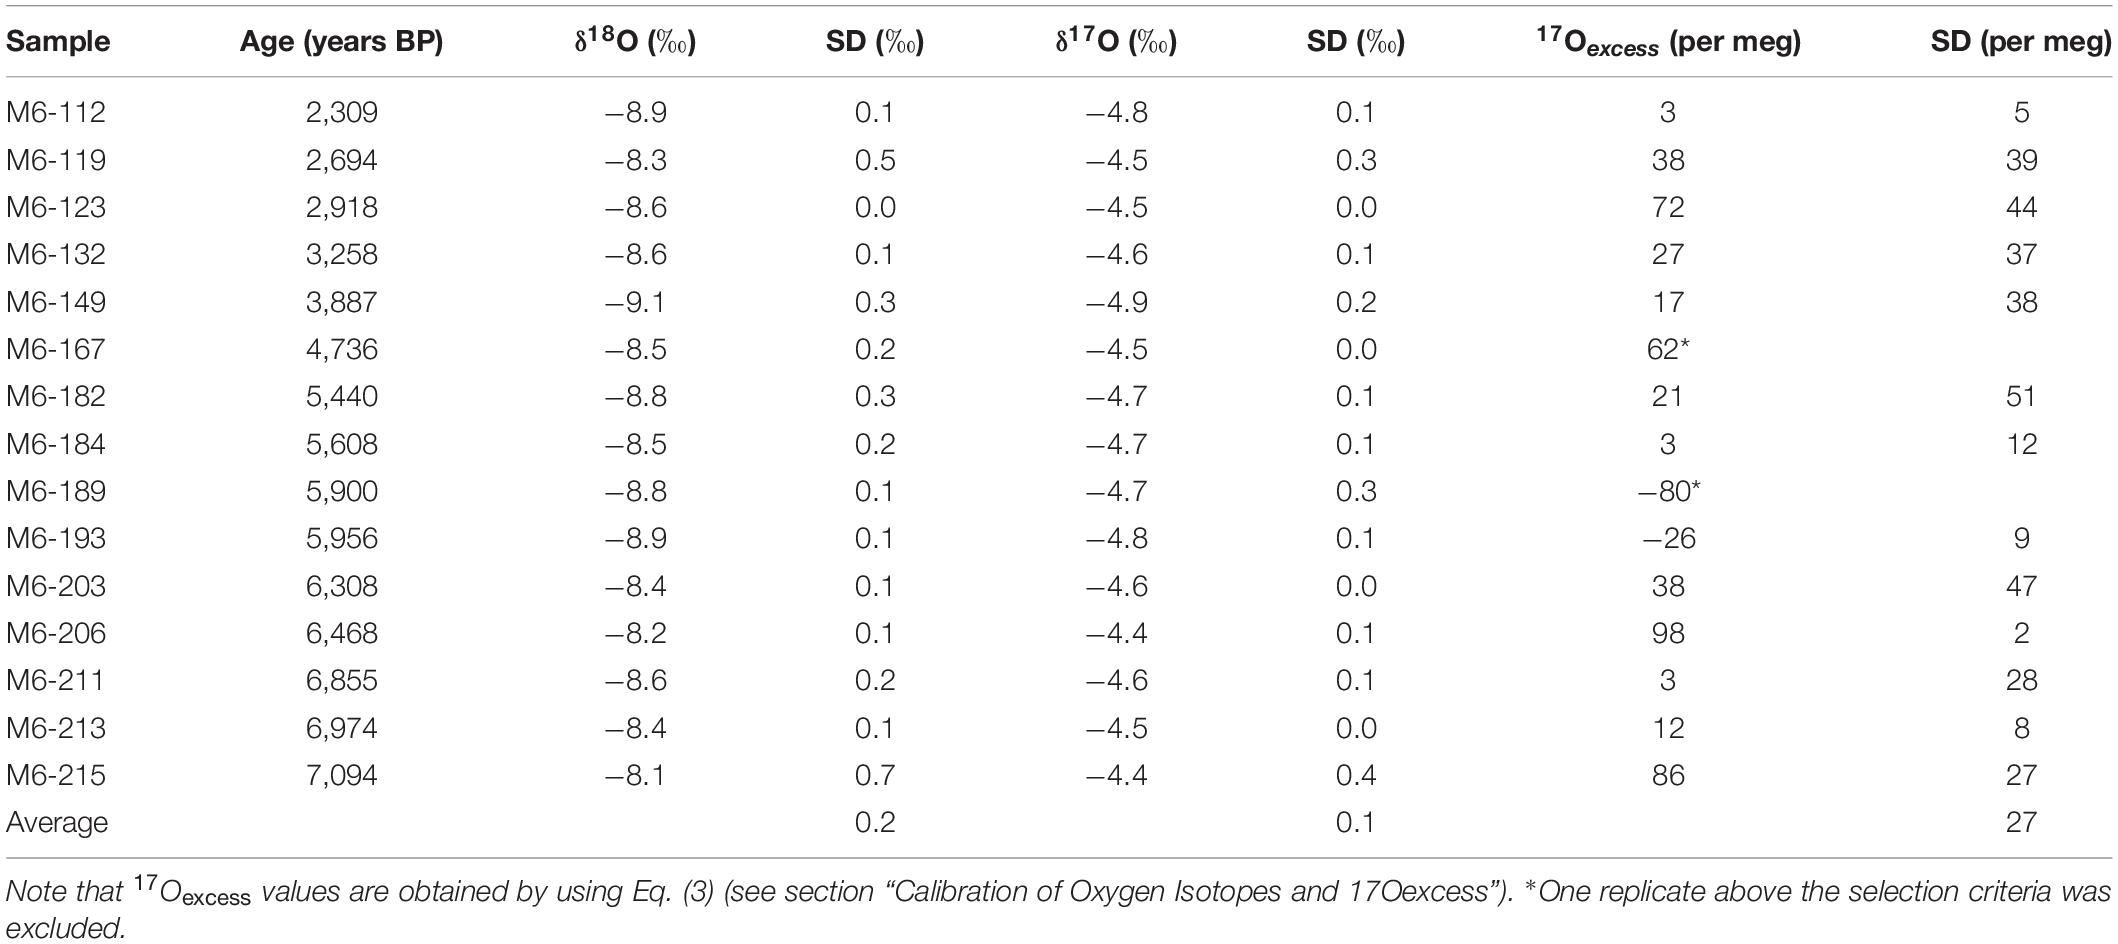
Table 3. Mean values and standard deviations obtained from duplication of stalagmite samples.
A first comparison of our 17Oexcess values against established paleoclimate information is shown in Figure 8. It shows contrasting results as discussed hereafter and should be taken with care considering the rather large uncertainties of our fluid inclusions 17Oexcess values. The comparison includes the other parameters already measured on the stalagmite to see whether significant patterns are visible. We know for instance that the hydrogen stable isotope is a proxy for temperature variations (Affolter et al., 2019), the deuterium excess (d) is linked with moisture source (e.g., Aemisegger, 2018) and δ13C with vegetation dynamics at the surface (e.g., Fohlmeister et al., 2012) and thus indirectly linked with the moisture conditions.
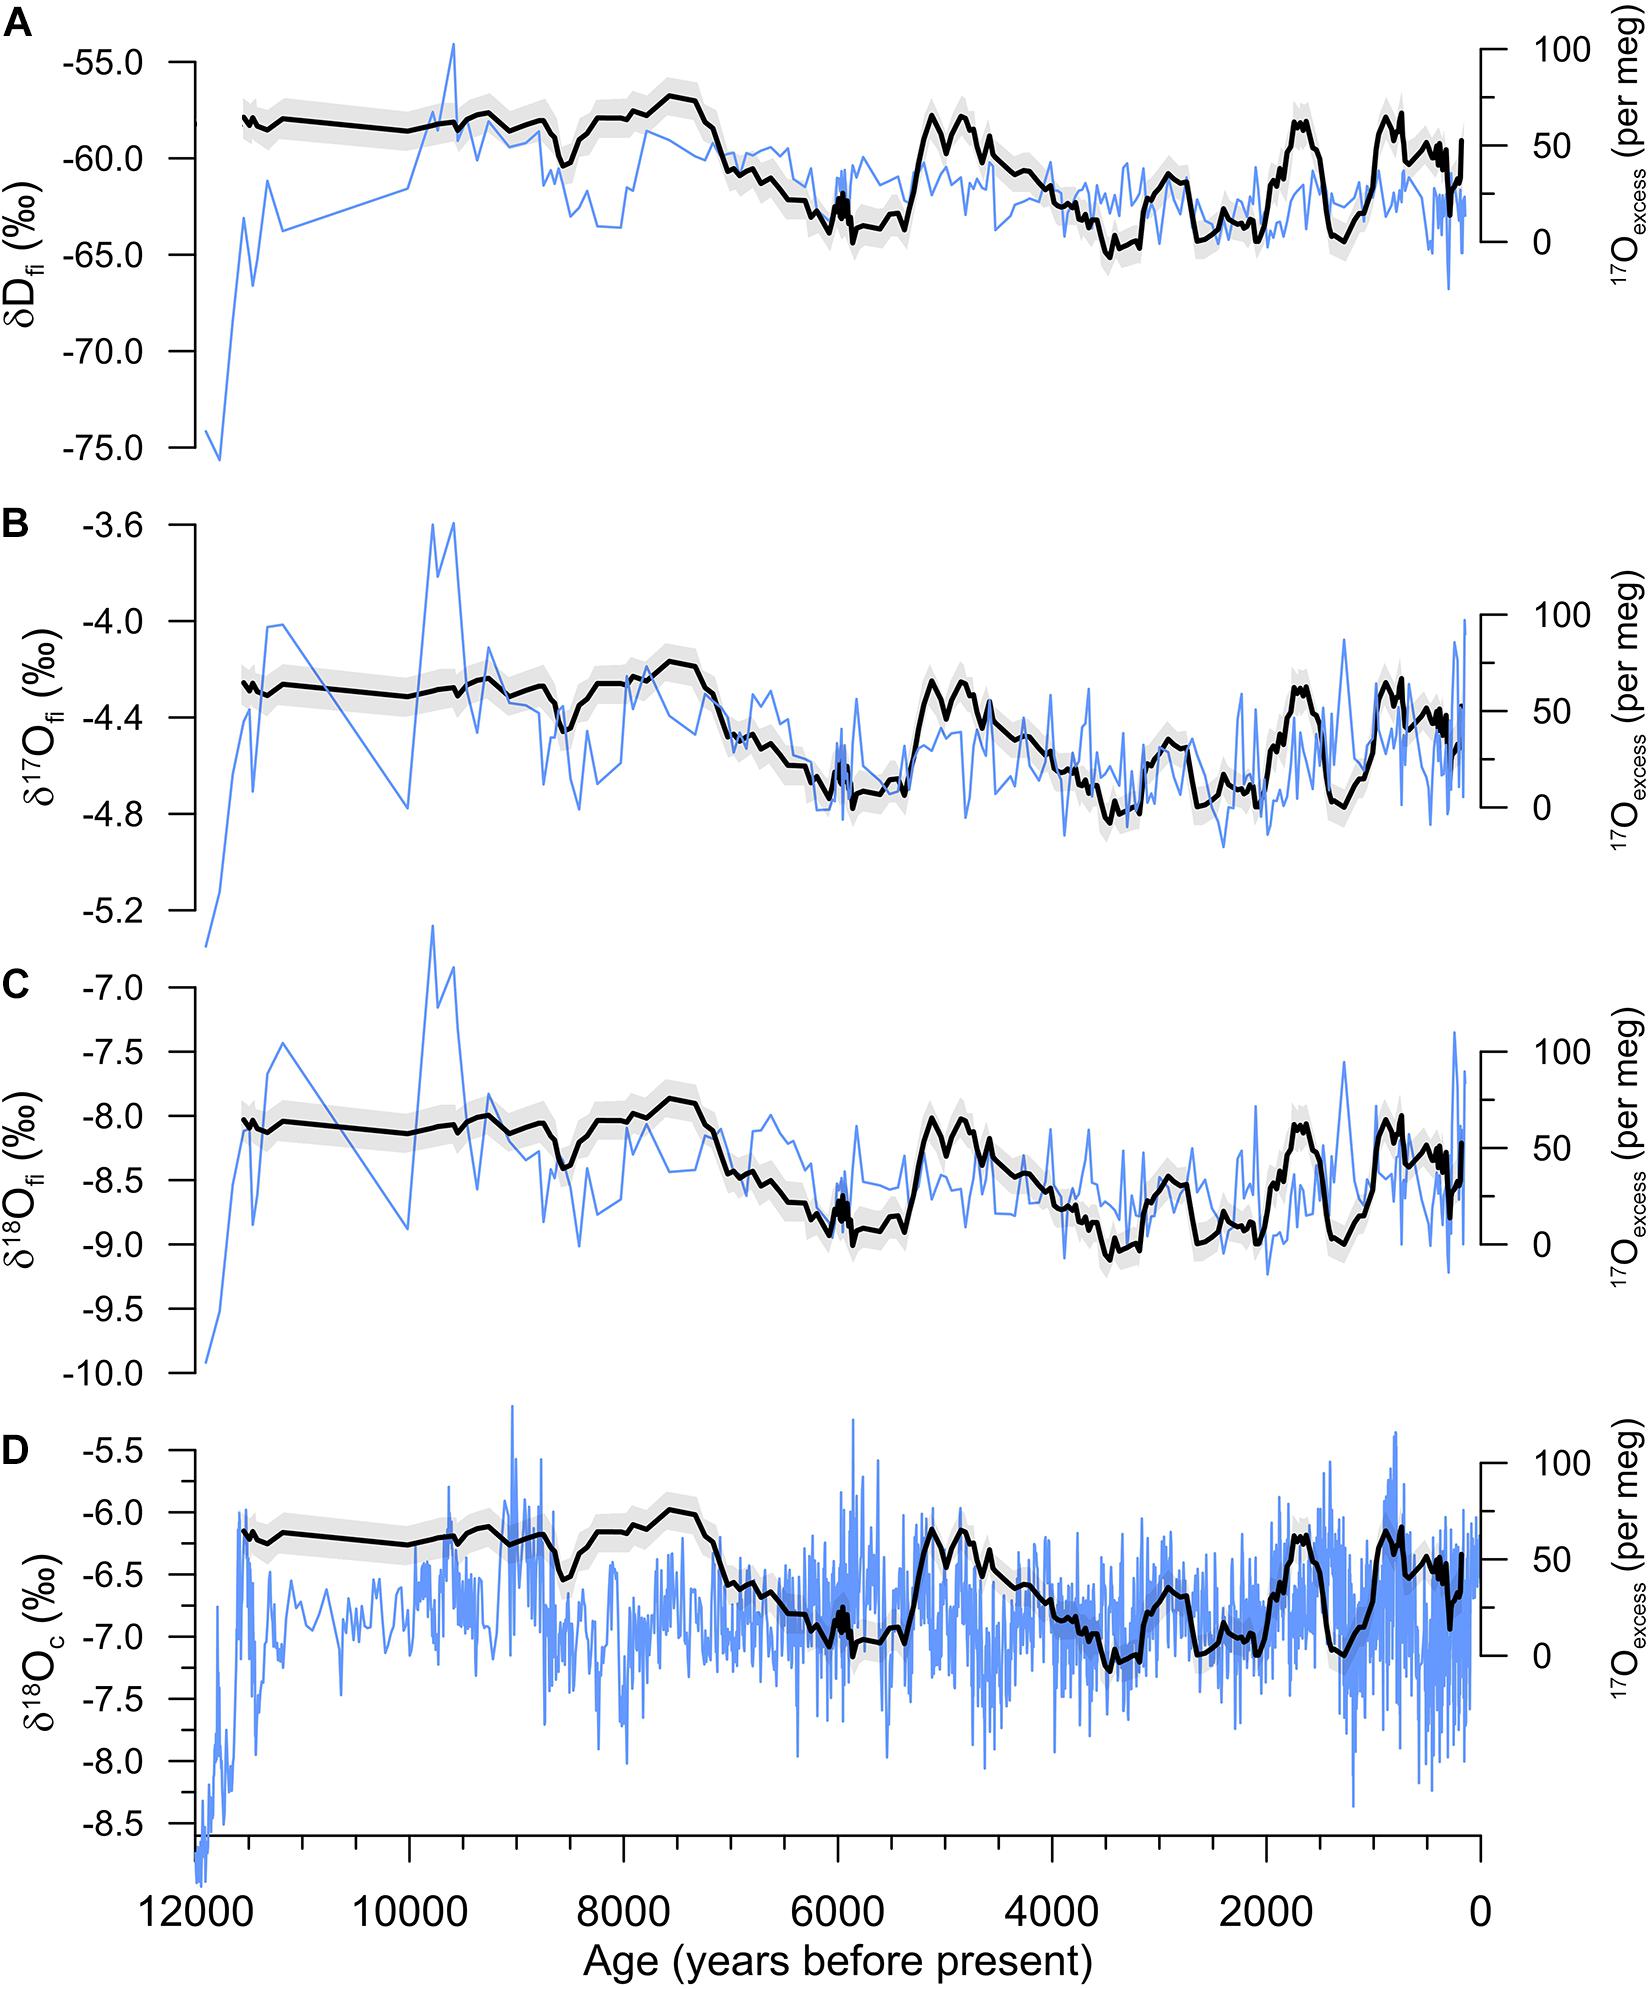
Figure 8. Comparison of 17Oexcess values and uncertainties (black lines and gray areas) with other published records coming from the same stalagmite over the past 14,000 years (Affolter et al., 2019). The 17Oexcess record (9 value running average) is shown with the corresponding fluid inclusion δDfi (A), δ17Ofi (B), δ18Ofi (C) values and the calcite δ18Oc (D) full record (all blue lines).
We looked at correlations with the parameters available. Based on selected values, there is no correlation with the δD and δ18O and a low correlation with δ17O (R2 = 0.09) isotope composition of the fluid inclusion water. There is also no correlation with d (R2 = 0.01) and with the water amount released by crushing (R2 = 0.06). However, it seems that based on a visual examination 17Oexcess and other parameters evolve similarly on certain time periods. Overall, the general trend over the entire record is coherent between 17Oexcess, δ18O and δ17O (Figure 8). For instance, 17Oexcess and δ17O evolve coherently between ∼9,000 and 4,000 years BP (R2 = 0.34). For the same interval, 17Oexcess is poorly correlated with either δD or δ18O. It is worth mentioning that δD as a witness for past temperatures does not show similarities with 17Oexcess which agrees with the low temperature-sensitivity of 17Oexcess described in section “Modern and Holocene Samples.” The comparison with calcite δ18Oc shows a visual similar evolution between ∼4,000 and 1,800 BP (Figure 8), whereas δ13Cc (Häuselmann, 2015) shows similarity between ∼5,500 and 2,000 years BP (not shown). In summary, interrelations are complex and are not yet understood and require further investigation.
Consideration of Other Published Results
A general equation for triple oxygen isotope fractionation between two substances A and B has been described by Passey et al. (2014) and further discussed by Bergel et al. (2020).
In our case 17Oexcess(B) corresponds to our measured fluid inclusions measurements, 17Oexcess(A) to calcite values, the fractionation slope ΘB/A corresponds to 0.5231 according to Bergel et al. (2020) or to 0.524 according to Sha et al. (2020). The slope of the reference line λref corresponds to 0.528. The isotope fractionation factor 18αB/A corresponds to 1.03002 between calcite and water (Devriendt et al., 2017 and references inside). When we apply this Eq. (4) to our values, we obtain the values shown in Figure 9. As already discussed in Passey et al. (2014); Bergel et al. (2020), and Sha et al. (2020), the temperature dependence of Eq. (4) leads to a δ17Oexcess of 5 per meg change for a 1‰ change in δ18O, which itself corresponds to a 5°C temperature change, i.e., a 1°C change leads to a 1 per meg change. The temperature change throughout the Holocene is estimated to approximately 1°C in this area (Affolter et al., 2019), therefore we would only expect a variation due to temperature of 1 per meg. Since the observed variations are significantly larger and also exceeding the range of reproducibility estimated to 20–30 per meg (see next section), we conclude that variations need to be assigned to another influencing parameter. Other factors may affect 17Oexcess, which would be related to (i) the relative humidity (hn) in the source region, (ii) transport processes (rainout, mixed moisture sources, moisture recycling) or (iii) local effects (sub-cloud evaporation, soil and karst evaporation and mixing). We suppose here that the relative humidity is the most plausible parameter influencing our 17Oexcess signal (e.g., Uemura et al., 2010; Sha et al., 2020). When we follow the approach discussed and applied in Sha et al. (2020) we then get unrealistically large variations of the normalized relative humidity. This indicates that the precision obtained for fluid inclusion 17Oexcess (this study) is still insufficient to reconstruct hn with similar precision as reached from calcite measurements despite the fact that hn is only one of several controls. Yet, potential mass-dependent disequilibrium occurring at the supposedly drier periods could also be involved in those variations. The tendency that we see in our record does, however, roughly agree with the trend that Sha et al. (2020) have observed for the Eastern Mediterranean Sea across the Last Glacial—Holocene transition. When averaging values, our data may suggest a change of humidity levels at around 6,500 years BP (before present, where present is 1950). Though, it is different for our late Holocene values, which also show significantly higher variations as reconstructed from gypsum water from Lake Estanya, NE Spain (Figure 9; Gazquez et al., 2018). A direct comparison with the Spanish site is yet to be made with caution as it has a Mediterranean continental climate. Nonetheless, precipitation is mostly related to Atlantic fronts in winter (Morellón et al., 2009), as at our study site. Further improvement in precision as well as process understanding is necessary before a robust humidity reconstruction is possible from fluid inclusion measurements.
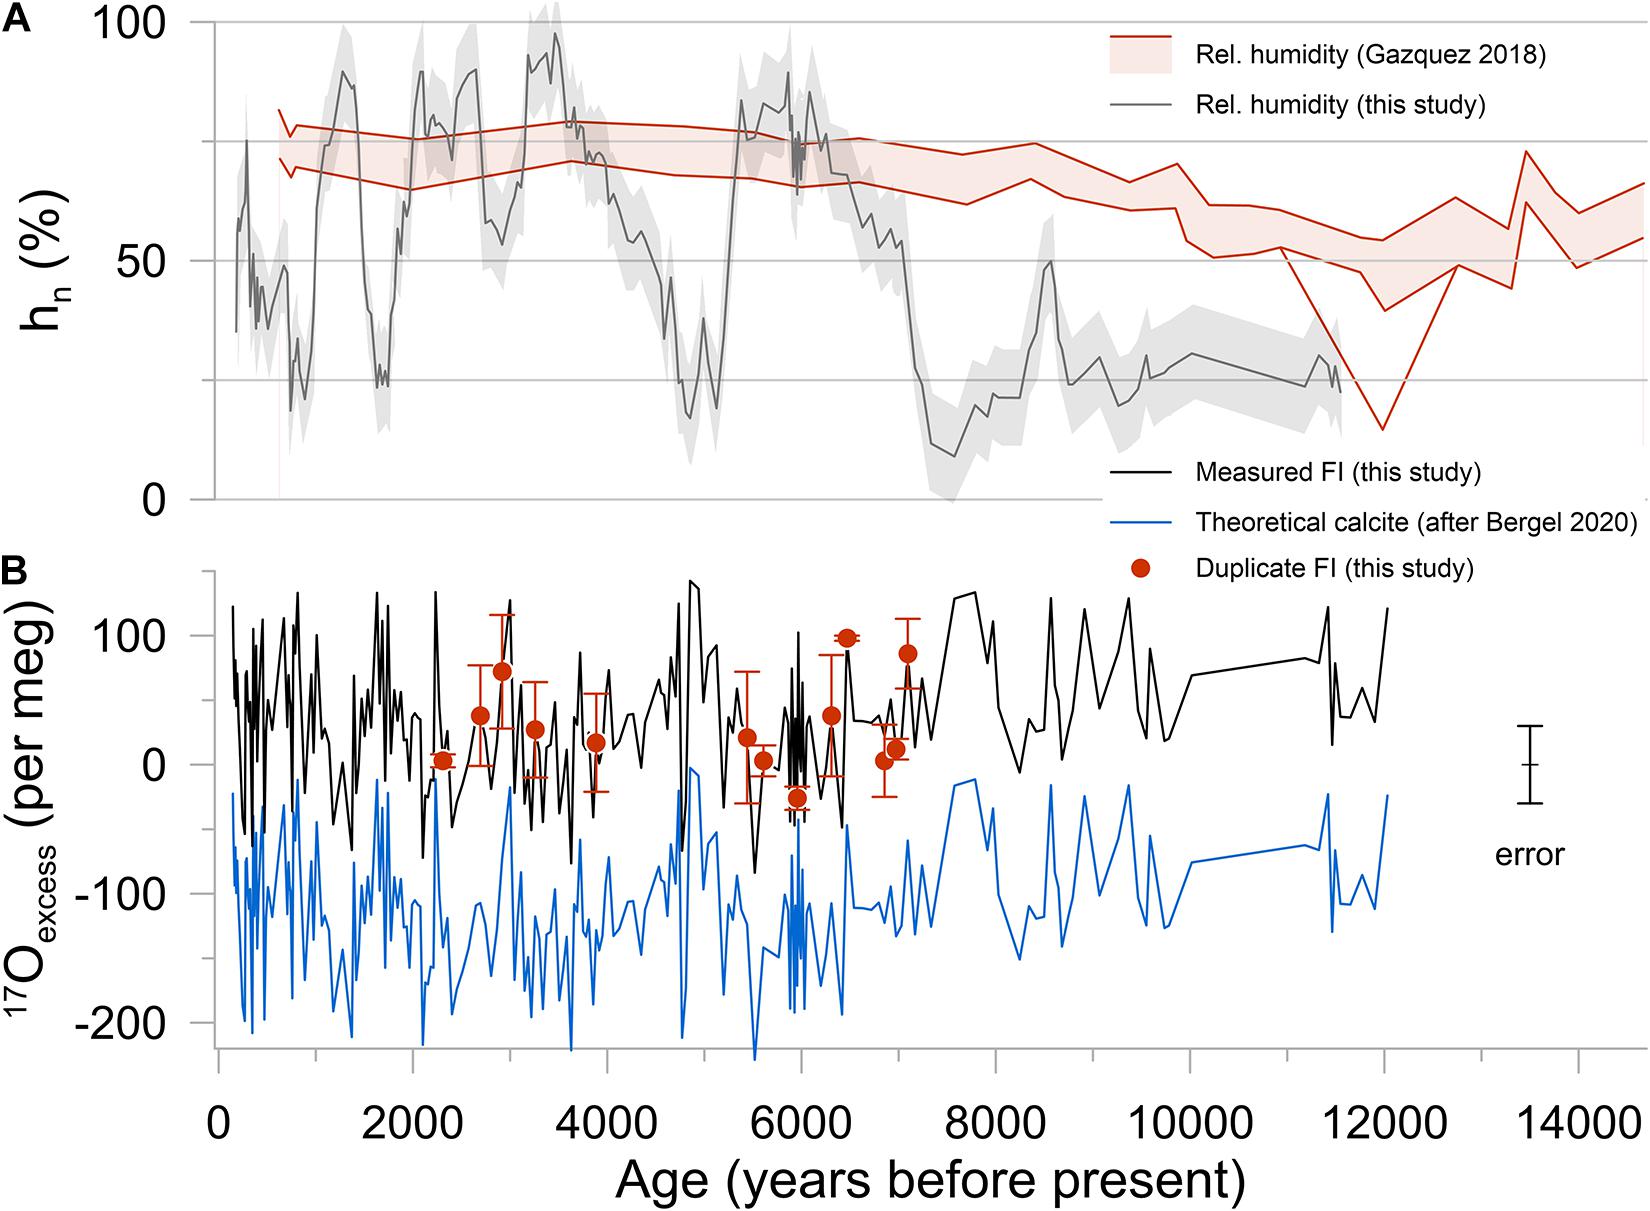
Figure 9. Tentative reconstruction of the relative humidity and the calcite 17Oexcess values. (A) Relative humidity estimation. The gray line is hn calculated from our speleothem fluid inclusion 17Oexcess data (following Sha et al., 2020; 9 value running average) and the red line is the reconstructed hn from Lake Estanya (Gazquez et al., 2018). (B) Calculation of theoretical Δ17O of the calcite (blue line) based on measured 17Oexcess of the water (black line according to Bergel et al. (2020). Speleothem duplicate measurements (red dots) as given in Table 2. FI stands for fluid inclusions.
Summary and Perspective
With the new generation of laser instruments (Picarro L2140-i) we have enhanced the precision of standard injection measurements using a syringe to 0.2‰ for δ18O. The precision for δ17O is better than 0.3‰. For the replication of fluid inclusion measurements, the mean deviation is 0.2‰ for δ18O and 0.1‰ for δ17O based on 19 replicates, which suggest an enhanced reproducibility for our setup when the line remains closed during the measurements compared to measurements where standards are injected with a syringe through a nut and a septum (Affolter et al., 2019).
Direct measurements of 17Oexcess on discrete (sub)-microliter amount of water released from an online crushing are more challenging. As pioneers of this system, we are facing several issues and technical challenges, namely regarding robustness of the single measurements that has not yet been achieved. The mean reproducibility of stalagmite sample duplicates of ± 27 per meg suggests that, with further technical improvement and a well-defined protocol for the selection of reliable data, robust values may be obtained from online measurements. Moreover, the large amount of 17Oexcess data obtained over the studied interval indicates that despite the lack of precision and accuracy of the single measurements, the trends sometimes fit other stalagmite parameters and on restricted time intervals, which are themselves used a paleoclimate proxy. Whereas no similarity is observed with temperature variability, it seems that 17Oexcess partly resembles other parameters linked to the past moisture variability for given time interval during the Holocene warm period, which would be—if our averaged 17Oexcess data represents the reality—compatible with modern observation of the 17Oexcess variability that is mostly related to the moisture history (Gazquez et al., 2018; Sha et al., 2020).
Using the presented method, a good way to improve the reliability of 17Oexcess would be to increase the sensitivity of the measurements by reducing the ratio sample/background water and to correct the isotope composition—mixing ratio dependence (Weng et al., 2020). Another way would be to perform the analyses in two steps with (i) a water extraction procedure and storage of the water and (ii) the analyses using an autosampler or via a septum injection into the analyser. To extract the water, our line could be modified so that a cold trap using dry ice at −78.5°C can be placed right after the crushing. The water is then collected and stored in 2 ml vials and measured with an autosampler. To run one single measurement using the autosampler coupled to the Picarro, a minimum amount of ∼2 μl is needed (∼15,000 ppm). Furthermore, to get precise 17Oexcess values, 10 replications are required (∼20 μl), but at least six replications are needed (∼12 μl) keeping in mind that the first two values are discarded. The 20 μl would correspond to the crushing of 3–20 g of calcite. This system would then allow measuring all three isotopes at the same time on the same aliquots of water. However, it has the disadvantage to add a treatment to the water molecule and to decrease the temporal resolution for the interpretation. Moreover, the measurements of the speleothem water content, which is another proxy for paleoclimate reconstruction may be affected (Vogel et al., 2013). Another issue is related to the speleothem choice itself. To fulfill the requirements a fast-growing speleothem containing large amounts of inclusion water is needed in order to achieve a good temporal resolution. For example, to get the required minimal amount of 12 μl from M6 stalagmite (Milandre Cave) and assuming a mean water content of 2.9 μl per gram of calcite, approximately four grams of calcite would be needed.
Observations made in this study about continuous-flow 17Oexcess measurement of fluid inclusion water seem promising enough to look for further methodological development. Recent improvement based on a similar extraction line as used in this study may help to solve part of these issues (e.g., de Graaf et al., 2020) and reduce the uncertainty associated to 17Oexcess measurements and provide a direct access to past precipitation 17Oexcess data. Furthermore, it is timely to compare fluid inclusion 17Oexcess values with corresponding values of the surrounding calcite.
Data Availability Statement
The raw data supporting the conclusions of this article will be made available by the authors, without undue reservation.
Author Contributions
SA and ML designed the study, analyzed the data, and wrote the manuscript. SA performed measurements. Both authors contributed to the article and approved the submitted version.
Funding
This work was supported by the Swiss National Science Foundation (grant nos. CRSI22-132646 and CRSII2_147674) within projects “STALCLIM” and “STALCLIM 2” and additionally supported by SNF through the project isoCEP (grant no. SNF 200020_172550).
Conflict of Interest
The authors declare that the research was conducted in the absence of any commercial or financial relationships that could be construed as a potential conflict of interest.
Acknowledgments
We would like to acknowledge Peter Nyfeler for this laboratory assistance and advice in technical issues. We acknowledge two reviewers for their comments that significantly improved this manuscript.
Supplementary Material
The Supplementary Material for this article can be found online at: https://www.frontiersin.org/articles/10.3389/feart.2021.612436/full#supplementary-material
References
Aemisegger, F. (2018). On the link between the North Atlantic storm track and precipitation deuterium excess in Reykjavik. Atmos. Sci. Lett. 19:e865. doi: 10.1002/asl.865
Affolter, S., Fleitmann, D., and Leuenberger, M. (2014). New online method for water isotope analysis of speleothem fluid inclusions using laser absorption spectroscopy (WS-CRDS). Clim. Past 10, 1291–1304. doi: 10.5194/cp-10-1291-2014
Affolter, S., Hauselmann, A., Fleitmann, D., Edwards, R. L., Cheng, H., and Leuenberger, M. (2019). Central Europe temperature constrained by speleothem fluid inclusion water isotopes over the past 14,000 years. Sci. Adv. 5:eaav3809. doi: 10.1126/sciadv.aav3809
Affolter, S., Hauselmann, A. D., Fleitmann, D., Hauselmann, P., and Leuenberger, M. (2015). Triple isotope (delta D, delta O-17, delta O-18) study on precipitation, drip water and speleothem fluid inclusions for a Western Central European cave (NW Switzerland). Quat. Sci. Rev. 127, 73–89. doi: 10.1016/j.quascirev.2015.08.030
Affolter, S., Steinmann, P., Aemisegger, F., Purtschert, R., and Leuenberger, M. (2020). Origin and percolation times of Milandre Cave drip water determined by tritium time series and beryllium-7 data from Switzerland. J. Environ. Radioact. 222:106346. doi: 10.1016/j.jenvrad.2020.106346
Baker, L., Franchi, I. A., Maynard, J., Wright, I. P., and Pillinger, C. T. (2002). A technique for the determination of O-18/O-16 and O-17/O-16 isotopic ratios in water from small liquid and solid samples. Anal. Chem. 74, 1665–1673. doi: 10.1021/ac010509s
Barkan, E., and Luz, B. (2005). High precision measurements of O-17/O-16 and O-18/O-16 ratios in H2O. Rapid Commun. Mass Spectrom. 19, 3737–3742. doi: 10.1002/rcm.2250
Barkan, E., and Luz, B. (2007). Diffusivity fractionations of (H2O)-O-16/(H2O)-O-17 and (H2O)-O-16/(H2O)-O-18 in air and their implications for isotope hydrology. Rapid Commun. Mass Spectrom. 21, 2999–3005.
Bergel, S. J., Barkan, E., Stein, M., and Affek, H. P. (2020). Carbonate O-17(excess) as a paleo-hydrology proxy: triple oxygen isotope fractionation between H2O and biogenic aragonite, derived from freshwater mollusks. Geochim. Cosmochim. Acta 275, 36–47. doi: 10.1016/j.gca.2020.02.005
de Graaf, S., Vonhof, H. B., Weissbach, T., Wassenburg, J. A., Levy, E. J., Kluge, T., et al. (2020). A comparison of isotope ratio mass spectrometry and cavity ring-down spectroscopy techniques for isotope analysis of fluid inclusion water. Rapid Commun. Mass Spectrom. 34:e8837.
Demeny, A., Czuppon, G., Kern, Z., Leel-Ossy, S., Nemeth, A., Szabo, M., et al. (2016). Recrystallization-induced oxygen isotope changes in inclusion-hosted water of speleothems – Paleoclimatological implications. Quat. Int. 415, 25–32. doi: 10.1016/j.quaint.2015.11.137
Devriendt, L. S., Watkins, J. M., and McGregor, H. V. (2017). Oxygen isotope fractionation in the CaCO3-DIC-H2O system. Geochim. Cosmochim. Acta 214, 115–142. doi: 10.1016/j.gca.2017.06.022
Fohlmeister, J., Schroder-Ritzrau, A., Scholz, D., Spotl, C., Riechelmann, D. F. C., Mudelsee, M., et al. (2012). Bunker Cave stalagmites: an archive for central European Holocene climate variability. Clim. Past 8, 1751–1764. doi: 10.5194/cp-8-1751-2012
Gazquez, F., Mather, I., Rolfe, J., Evans, N. P., Herwartz, D., Staubwasser, M., et al. (2015). Simultaneous analysis of O-17/O-16, O-18/O-16 and H-2/H-1 of gypsum hydration water by cavity ring-down laser spectroscopy. Rapid Commun. Mass Spectrom. 29, 1997–2006. doi: 10.1002/rcm.7312
Gazquez, F., Morellon, M., Bauska, T., Herwartz, D., Surma, J., Moreno, A., et al. (2018). Triple oxygen and hydrogen isotopes of gypsum hydration water for quantitative paleo-humidity reconstruction. Earth Planet. Sci. Lett. 481, 177–188. doi: 10.1016/j.epsl.2017.10.020
Häuselmann, A. D. (2015). Late Quaternary and Holocene paleoclimate and paleoenvironmental reconstruction - a multi-proxy approach on Swiss speleothems. Ph D. Thesis, University of Bern: Switzerland.
Lachniet, M. S. (2009). Climatic and environmental controls on speleothem oxygen-isotope values. Quat. Sci. Rev. 28, 412–432. doi: 10.1016/j.quascirev.2008.10.021
Landais, A., Barkan, E., and Luz, B. (2008). Record of delta O-18 and O-17-excess in ice from Vostok Antarctica during the last 150,000 years. Geophys. Res. Lett. 35:L02709.
Landais, A., Barkan, E., Yakir, D., and Luz, B. (2006). The triple isotopic composition of oxygen in leaf water. Geochim. Cosmochim. Acta 70, 4105–4115. doi: 10.1016/j.gca.2006.06.1545
Landais, A., Capron, E., Masson-Delmotte, V., Toucanne, S., Rhodes, R., Popp, T., et al. (2018). Ice core evidence for decoupling between midlatitude atmospheric water cycle and Greenland temperature during the last deglaciation. Clim. Past 14, 1405–1415. doi: 10.5194/cp-14-1405-2018
Lecavalier, B. S., Fisher, D. A., Milne, G. A., Vinther, B. M., Tarasov, L., Huybrechts, P., et al. (2017). High Arctic Holocene temperature record from the Agassiz ice cap and Greenland ice sheet evolution. Proc. Natl. Acad. Sci. U. S. A. 114, 5952–5957. doi: 10.1073/pnas.1616287114
Leuenberger, M., Nyfeler, P., Moret, H., and Ranjan, S. (2021). 17O-excess on precipitated water and water vapor samples at the High Altitude Research Station Jungfraujoch and Bern, Switzerland. Front. Earth Sci. (in preparation).
Leuenberger, M. C., and Ranjan, S. (2021). Disentangle Kinetic From Equilibrium Fractionation Using Primary (δ17O, δ18O, δD) and Secondary (Δ17O, dex) Stable Isotope Parameters on Samples From the Swiss Precipitation Network. Front. Earth Sci. 9:598061. doi: 10.3389/feart.2021.598061
Li, S. N., Levin, N. E., and Chesson, L. A. (2015). Continental scale variation in O-17-excess of meteoric waters in the United States. Geochim. Cosmochim. Acta 164, 110–126. doi: 10.1016/j.gca.2015.04.047
Luz, B., and Barkan, E. (2010). Variations of O-17/O-16 and O-18/O-16 in meteoric waters. Geochim. Cosmochim. Acta 74, 6276–6286.
McDermott, F., Schwarcz, H., and Rowe, P. J. (2006). Isotopes in speleothems. Isotopes in palaeoenvironmental research. New York: Springer.
Morellón, M., Valero-Garces, B., Vegas-Vilarrúbia, T., González-Sampériz, P., Romero, O., Delgado-Huertas, A., et al. (2009). Lateglacial and Holocene palaeohydrology in the western Mediterranean region: the Lake Estanya record (NE Spain). Quat. Sci. Rev. 28, 2582–2599. doi: 10.1016/j.quascirev.2009.05.014
Oneil, J. R., and Epstein, S. (1966). A Method for Oxygen Isotope Analysis of Milligram Quantities of Water and Some of Its Applications. J. Geophys. Res. 71:4955. doi: 10.1029/jz071i020p04955
Passey, B. H., Hu, H. T., Ji, H. Y., Montanari, S., Li, S. N., Henkes, G. A., et al. (2014). Triple oxygen isotopes in biogenic and sedimentary carbonates. Geochim. Cosmochim. Acta 141, 1–25. doi: 10.1016/j.gca.2014.06.006
Persoiu, A., Onac, B. P., Wynn, J. G., Blaauw, M., Ionita, M., and Hansson, M. (2017). Holocene winter climate variability in Central and Eastern Europe. Sci. Rep. 7:1196.
Schoenemann, S. W., Schauer, A. J., and Steig, E. J. (2013). Measurement of SLAP2 and GISP 17O and proposed VSMOW-SLAP normalization for 17O and 17Oexcess. Rapid Commun. Mass Spectrom. 27, 582–590. doi: 10.1002/rcm.6486
Schoenemann, S. W., and Steig, E. J. (2016). Seasonal and spatial variations of O-17(excess) and d(excess) in Antarctic precipitation: insights from an intermediate complexity isotope model. J. Geophys. Res. Atmos. 121, 11215–11247.
Seierstad, I. K., Abbott, P. M., Bigler, M., Blunier, T., Bourne, A. J., Brook, E., et al. (2014). Consistently dated records from the Greenland GRIP, GISP2 and NGRIP ice cores for the past 104 ka reveal regional millennial-scale delta O-18 gradients with possible Heinrich event imprint. Quat. Sci. Rev. 106, 29–46. doi: 10.1016/j.quascirev.2014.10.032
Sha, L. J., Maha, S., Duan, P. Z., Luz, B., Zhang, P., Baker, J., et al. (2020). A novel application of triple oxygen isotope ratios of speleothems. Geochim. Cosmochim. Acta 270, 360–378. doi: 10.1016/j.gca.2019.12.003
Sodemann, H., and Zubler, E. (2010). Seasonal and inter-annual variability of the moisture sources for Alpine precipitation during 1995–2002. Int. J. Climatol. 30, 947–961.
Steig, E. J., Gkinis, V., Schauer, A. J., Schoenemann, S. W., Samek, K., Hoffnagle, J., et al. (2014). Calibrated high-precision O-17-excess measurements using cavity ring-down spectroscopy with laser-current-tuned cavity resonance. Atmos. Meas. Tech. 7, 2421–2435. doi: 10.5194/amt-7-2421-2014
Uechi, Y., and Uemura, R. (2019). Dominant influence of the humidity in the moisture source region on the O-17-excess in precipitation on a subtropical island. Earth Planet. Sci. Lett. 513, 20–28. doi: 10.1016/j.epsl.2019.02.012
Uemura, R., Barkan, E., Abe, O., and Luz, B. (2010). Triple isotope composition of oxygen in atmospheric water vapor. Geophys. Res. Lett. 37:L04402.
Uemura, R., Kina, Y., Shen, C.-C., and Omine, K. (2020). Experimental evaluation of oxygen isotopic exchange between inclusion water and host calcite in speleothems. Clim. Past 16, 17–27. doi: 10.5194/cp-16-17-2020
Vogel, N., Scheidegger, Y., Brennwald, M. S., Fleitmann, D., Figura, S., Wieler, R., et al. (2013). Stalagmite water content as a proxy for drip water supply in tropical and subtropical areas. Clim.Past 9, 1–12. doi: 10.5194/cp-9-1-2013
Weng, Y., Touzeau, A., and Sodemann, H. (2020). Correcting the impact of the isotope composition on the mixing ratio dependency of water vapour isotope measurements with cavity ring-down spectrometers. Atmos. Meas. Tech. 13, 3167–3190. doi: 10.5194/amt-13-3167-2020
Keywords: speleothem, fluid inclusions, cpsdummy1cpsdummy7Oexcess, water, triple oxygen isotopes
Citation: Affolter S and Leuenberger MC (2021) Challenges in the Direct Determination of 17Oexcess in Microliter Amount of Water Extracted From Speleothem Fluid Inclusions. Front. Earth Sci. 9:612436. doi: 10.3389/feart.2021.612436
Received: 30 September 2020; Accepted: 18 March 2021;
Published: 15 April 2021.
Edited by:
Daniel Herwartz, University of Cologne, GermanyReviewed by:
Tobias Kluge, Karlsruhe Institute of Technology (KIT), GermanyTyler Huth, University of Michigan, United States
Copyright © 2021 Affolter and Leuenberger. This is an open-access article distributed under the terms of the Creative Commons Attribution License (CC BY). The use, distribution or reproduction in other forums is permitted, provided the original author(s) and the copyright owner(s) are credited and that the original publication in this journal is cited, in accordance with accepted academic practice. No use, distribution or reproduction is permitted which does not comply with these terms.
*Correspondence: Stéphane Affolter, c3RlcGhhbmUuYWZmb2x0ZXJAdW5pYmFzLmNo