 Adrian Felix Höfken
 Tilo von Dobeneck
 Thomas Kuhn
 Sabine Kasten
- 1MARUM Center for Marine Environmental Sciences, Bremen, Germany
- 2Faculty of Geosciences, University of Bremen, Bremen, Germany
- 3Federal Institute for Geosciences and Natural Resources (BGR), Hannover, Germany
- 4Alfred Wegener Institute, Helmholtz Centre for Polar and Marine Research, Bremerhaven, Germany
Recent measurements of pore-water oxygen profiles in ridge flank sediments of the East Pacific Rise revealed an upward-directed diffusive oxygen flux from the hydrothermally active crust into the overlying sediment. This double-sided oxygenation from above and below results in a dual redox transition from an oxic sedimentary environment near the seabed through suboxic conditions at sediment mid-depth back to oxic conditions in the deeper basal sediment. The potential impact of this redox reversal on the paleo- and rock magnetic record was analyzed for three sediment cores from the Clarion-Clipperton-Zone (low-latitude eastern North Pacific). We found that the upward-directed crustal oxygen flux does not impede high quality reversal-based and relative paleointensity-refined magnetostratigraphic dating. Despite low and variable sedimentation rates of 0.1–0.8 cm/kyr, robust magnetostratigraphic core chronologies comprising the past 3.4 resp. 5.2 million years could be established. These age-models support previous findings of significant local sedimentation rate variations that are probably related to the bottom current interactions with the topographic roughness of the young ridge flanks. However, we observed some obvious paleomagnetic irregularities localized at the lower oxic/suboxic redox boundaries of the investigated sediments. When analyzing these apparently remagnetized sections in detail, we found no evidence of physical disturbance or chemical alteration. A sharp increase in single-domain magnetite concentration just below the present lower oxic/suboxic redox boundary suggests secondary magnetite biomineralization by microaerophilic magnetotactic bacteria living as a separate community in the lower, upward oxygenated part of the sediment column. We therefore postulate a two-phased post-depositional remanent magnetization of ridge flank sediments, first by a shallow and later by a deep-living community of magnetotactic bacteria. These findings are the first evidence of a second, deep population of probably inversely oriented magnetotactic bacteria residing in the inverse oxygen gradient zone of ridge flank sediments.
Introduction
Over the past decades, the Clarion-Clipperton-Zone (CCZ) in the eastern low latitude North Pacific gained increasing scientific and economic interest due to its rich abundance in polymetallic manganese nodules (e.g., Chun, 1908; Bischoff and Piper, 1979; Bender, 1983; Lodge et al., 2014). Most related studies focused on chemical and mineralogical aspects of nodule formation (e.g., Calvert and Price, 1977; Jeon et al., 1994; Wegorzewski and Kuhn, 2014). However, there is also growing interest to understand (bio)geochemical processes and element fluxes in the underlying sediments (e.g., Bischoff and Piper, 1979; Jahnke et al., 1982; Müller et al., 1988; Mewes et al., 2014; Volz et al., 2018). Only recently, ex-situ onboard measurements of sedimentary pore-water oxygen concentrations revealed characteristic bow-shaped oxygen profiles because of diffusive vertical oxygen exchange with low-temperature hydrothermal fluids circulating through the underlying crust (Mewes et al., 2016; Kuhn et al., 2017; Versteegh et al., 2021). Low-temperature hydrothermal circulation in ridge flank settings is a widespread postmagmatic process (e.g., Rudnicki et al., 2001; Wheat et al., 2002; Fisher et al., 2003; Wheat and Fisher, 2008; Winslow and Fisher, 2015; Coogan and Gillis, 2018) and upward oxygen diffusion from the sediment-crust interface may therefore be a common phenomenon in the deeper sections of marine sediments.
Several reasons make the eastern part of the CCZ an ideal location to study the associated processes and impacts of upward oxygen diffusion on sediment geochemistry as well as on potential alterations of the sedimentary paleo- and rock magnetic record. Low sedimentation rates of ∼0.35–0.6 cm/kyr (Mewes et al., 2014) and correspondingly thin sediment covers of a few tens of meters (Kuhn et al., 2015) facilitate slow, diffusively controlled geochemical processes. These are confined to comparably short (<20 m), but in proportion, very relevant sections of the entire sediment column. These specific sedimentation conditions make it possible to investigate such phenomena with traditional gravity- and piston-coring techniques. Additionally, low residual organic carbon contents of <0.3 wt% (e.g., Müller and Mangini, 1980; Müller et al., 1988; Mewes et al., 2014; Mogollón et al., 2016) in these sediments aid in sustaining comparably large O2 penetration lengths from the sediment-rock interface. The rough seabed topography of this area with characteristic fault structures (Haxby and Weissel, 1986) and scattered seamounts (Rühlemann et al., 2011) provides many recharge and discharge passages for bottom-water fed, low-temperature hydrothermal circulation through the still relatively young and not yet fully cooled crust (Fisher and Wheat, 2010).
Reliable age-depth estimates of the corresponding sediments are a key requisite to advance the understanding of the underlying processes and to provide estimates for element fluxes, reaction kinetics and non-steady state boundary conditions. The method of choice for age-depth estimation of the carbonate-starved sediments of the eastern CCZ (Kuhn et al., 2015) is magnetostratigraphy. However, various aspects may complicate the paleomagnetic approach in such geochemically and sedimentologically active settings. For instance, Costa et al. (2016) showed that sedimentation rates at the adjacent Juan de Fuca ridge underwent large temporal and spatial variations due to unsteady bottom current patterns. As the magnetostratigraphic method relies on the continuity and integrity of the sediment column, such similar processes at the flanks of the East Pacific Ridge (EPR) could affect the identification of geomagnetic polarity zones and thereby complicate age-depth estimation. Paleomagnetic dating can be aggravated if the magnetic mineral assemblage is subject to redoxomorphic diagenesis (e.g., Funk et al., 2004; Korff et al., 2016) which should definitely be considered in the presented case of a double redox change.
Following good magnetostratigraphic practice, one would try to isolate the primary or “characteristic” paleomagnetic information from secondary sedimentary or diagenetic magnetic overprints. However, valuable and generalizable insights can be obtained by analyzing also secondary magnetizations and their acquisition processes in an integral approach. This study aims to provide a reliable age-depth framework for the eastern CCZ while disentangling and (re)assessing the sedimentary, geochemical and microbial processes affecting the paleomagnetic dating methods of ridge flank sediments.
Methods and Materials
Study Area and Materials
This study investigates three sediment cores 22-KL, 42-SL and 81-SL retrieved during RV Sonne cruise SO-240 (Kuhn et al., 2015; Versteegh et al., 2021) to the Clarion-Clipperton-Zone (CCZ) in the eastern low-latitude North Pacific. The coring sites (Figure 1) lie within the German license area “East” for manganese nodule exploration (11.8°N, 116.5°W to 13.2°N, 118.4°W). This pelagic region is characterized by an inhomogeneous, generally shallow and ponded sediment cover of up to 100 m thickness (Kuhn et al., 2017) on 17 to 22 Ma old crust (Barckhausen et al., 2013; Müller et al., 2016) at the western flank of the East Pacific Ridge (EPR). NNE-SSW striking horst and graben structures (Haxby and Weissel, 1986) and rows of seamounts of up to 30 km in diameter (Rühlemann et al., 2011) are common in this part of the CCZ. Sediment-barren areas in this rough terrain form potential in- and outlets for the re- and discharge of seawater/crustal fluids (Mewes et al., 2016).
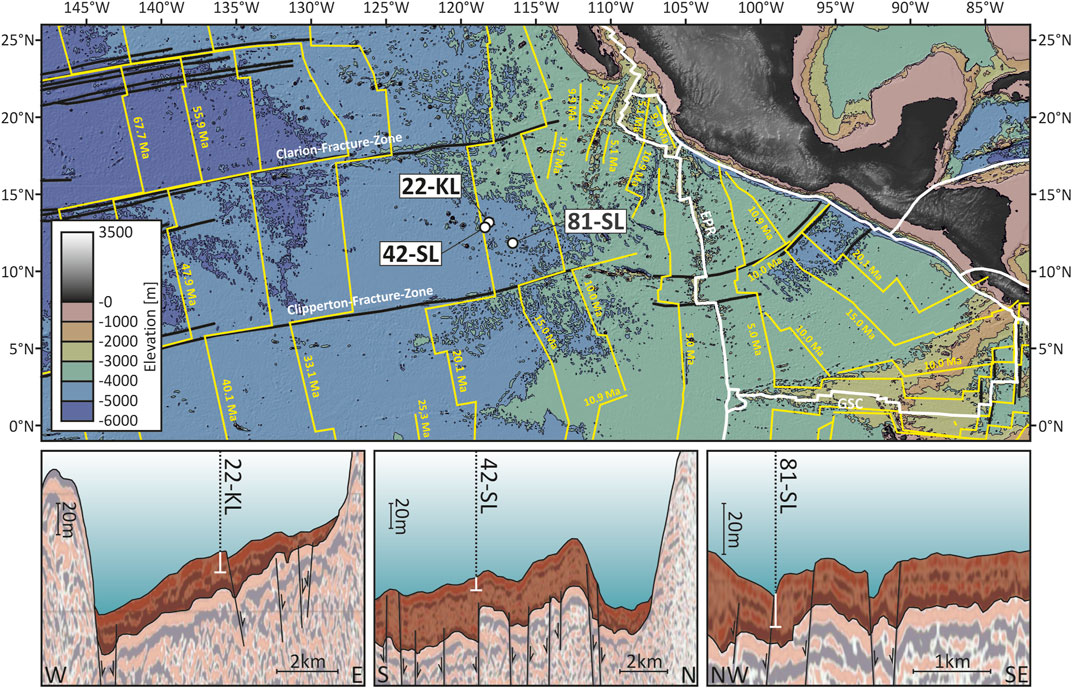
FIGURE 1. Bathymetric overview of the eastern low-latitude North Pacific with the three SO-240 coring sites of interest here (Kuhn et al., 2015). Crustal age isochrones (yellow lines) were drawn after Müller et al. (2016), plate boundaries (white lines) and major fracture zones (black lines) follow interpretations of Matthews et al. (2011). The three interpreted sections at the bottom show seismic profiles through the coring sites with associated fault structures modified from Kuhn et al. (2015). The shallow sediment cover above the crust is highlighted in brown. White markers depict the approximate penetration depth of the recovered sediment cores.
The three here presented sediment cores were recovered using gravity- (cores 42-SL and 81-SL) and piston- (core 22-KL) coring devices and originate from water depths of 4,290–4,355 m (Table 1). The sediments consist of carbonate-free siliceous ooze and clay (Kuhn et al., 2017). They have light to dark brown colors and stiff homogenous textures.
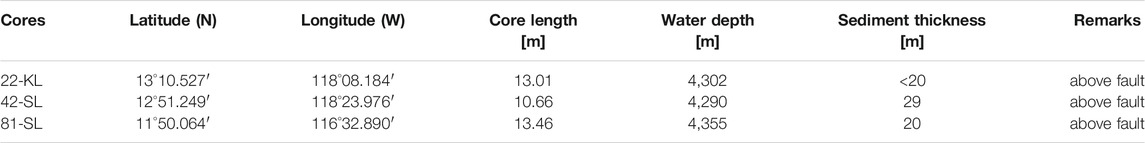
TABLE 1. Coordinates, recovered piston (KL) and gravity (SL) core lengths, water depths and sediment thickness of selected SO-240 coring sites.
Paleo- and Rock Magnetic Measurements
Discrete cube samples for paleomagnetic investigations of all three cores were continuously collected in 2.3 cm intervals using non-magnetic plastic cubes of ca. 2 cm × 2 cm x 1.6 cm internal dimensions. All samples were analyzed with the 2G Enterprises 755HR cryogenic magnetometer of the Magnetic Laboratory of the Faculty of Geosciences at the University of Bremen. Automated measurements of the Natural Remanent Magnetization (NRM) remaining after subsequent three-axis alternating field (AF) demagnetization increasing in 5 mT steps from 0 to 50 mT and in 10 mT steps from 50 to 100 mT were executed. NRM demagnetization was followed by imparting an Anhysteretic Remanent Magnetization (ARM) in a single step using a 100 mT AF and 40 µT biasing field. A subsequent stepwise AF demagnetization of the ARM was applied analogously to NRM demagnetization. Finally, we measured a single-step Isothermal Remanent Magnetization (IRM) after applying a 100 mT pulse field.
Characteristic Remanence Analysis and Relative Paleointensity
A principal Component Analysis (PCA) of all NRM data was performed using Puffinplot 1.4.1 (Lurcock and Wilson, 2012). NRM values of demagnetizing fields below 10 mT were consistently removed from further data processing to minimize the effects of soft magnetic overprinting by weak natural magnetic fields, fields produced by the steel parts of the coring equipment and the ship environment as well as thermal effects. Relative Paleointensity (RPI) values were derived from the processed NRM data using the slope method described by Tauxe and Valet (1989), utilizing the corresponding ARM demagnetization data for normalization.
FORC Measurements
First Order Reversal Curve (FORC) measurements were performed on a set of five selected subsamples from each sediment core using a Princeton Measurement Corporation MicroMag 2900 alternating gradient field magnetometer. These high-resolution FORC measurements were carried out in maximum fields of 300 mT. The raw FORC data was processed with Forcinel 3 software (Harrison and Feinberg, 2008) in an Igor Pro 8 environment and a smoothing factor of eight was chosen throughout the sampleset. For each sample, four consecutive measurements were carried out, of which the two with the lowest drift and noise levels were selected and averaged to improve the signal quality. For best comparability of the FORC diagrams, we chose a normalized, discrete and linear 32 value color scale.
Magnetic Extraction and Scanning Electron Microscopy
Magnetic extracts of selected samples from each core were prepared by recirculating the suspended sediment through a magnetic extraction apparatus as described by von Dobeneck et al. (1987). Scanning Electron Microscope (SEM) images were produced with the Zeiss SUPRA 40 field emission electron microscope of the University of Bremen petrology group. We used the electron backscatter mode for imaging and captured Energy Dispersive X-ray spectra (EDX) for element analysis of selected particles.
Ex-situ Pore-Water Oxygen Measurements
Ex-situ oxygen measurements were carried out directly on board of RV Sonne in the cold room (4°C) of the ship using amperometric Clark-type O2 sensors following the procedure description of Ziebis et al. (2012), Mewes et al. (2014) and Mewes et al. (2016). Down-core O2 measurements were carried out in 5 cm sampling intervals.
Linescan Core Imaging
Sediment core imaging was carried out on a GEOTEK multi-sensor core logger equipped with a GEOSCAN II RGB line scan camera. The camera produces single lines with a width of 1,024 pixels in the red, green and blue sections of the visible spectrum referenced to the position of the sediment core. A MATLAB-based routine was used for image processing and color calibration. The routine removes image artifacts along the core sections end caps and merges the individual images into a single composite. For lightness calibration a GEOTEK camera test card was scanned before and after the acquisition of the core images and brightness and drift were corrected against a calibration image.
Results
Rock Magnetic and SEM Diagnostics of Magnetic Carrier Mineralogy
To solve controversial issues of paleomagnetic recordings, a detailed understanding of the mineralogy and granulometry of the available magnetic carriers is indispensable. FORC diagrams based on series of partial hysteresis curves create an elegant and sophisticated image of a sample’s integral magnetic properties (e.g., Roberts et al., 2000; Roberts et al., 2006). Normalized FORC diagrams of samples distributed over the full length of all three cores are displayed in Figure 2. The normalization to values between −0.3 and 1 of the FORCs maximum is useful as absolute FORC values are generally of minor diagnostic value. All FORC distributions show a predominant central ridge at Bi = 0, virtually no asymmetry and only minimal spread along the vertical Bi-axis. No significant depth trend is inferred by the FORC distributions of cores 22-KL and 42-SL. Core 81-SL shows a weak tendency towards a larger spread along the Bi-axis of the FORC distribution with increasing sample depth. This indicates that particle interaction slightly increases with depth at this site. However, this effect is minimal compared to the overall FORC intensities. The narrow central ridge in all FORC distributions indicates that non-interacting single-domain (SD) particles are the dominant carriers of magnetization throughout the three sedimentary records (e.g., Li et al., 2000; Newell, 2005; Egli, 2006).
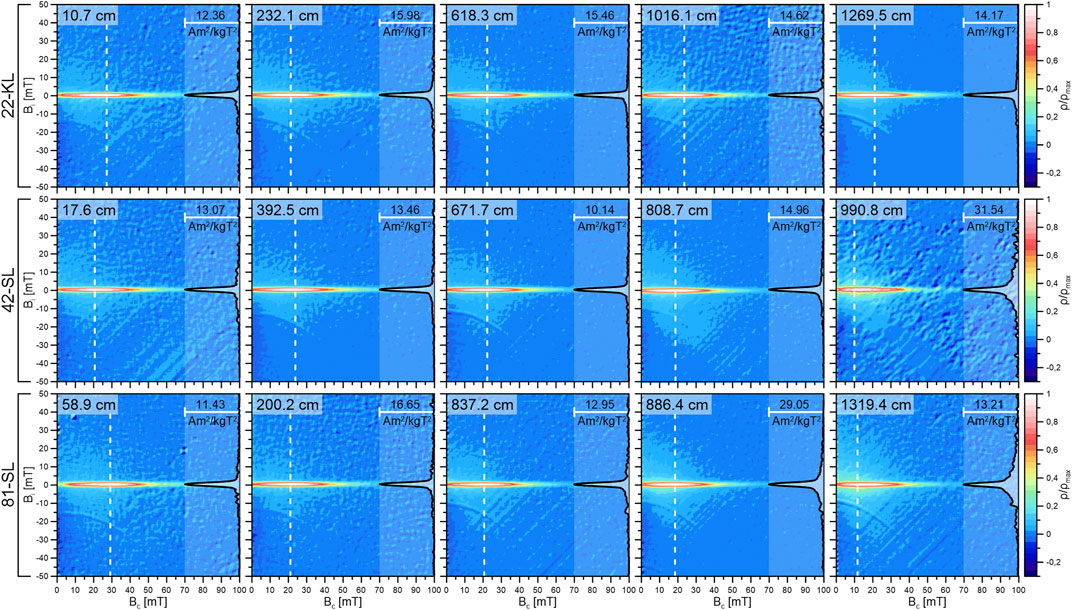
FIGURE 2. Overview of selected FORC diagrams covering the full depth range at the three coring sites. The color scale of each diagram was normalized for improved comparability. Normalized profiles along the white dashed lines are displayed on the right side of each diagram. The profile lines were chosen such that they intersect the FORC distribution at their peak values, The corresponding peak values are displayed in the upper left corner of each diagram. The FORC distributions at all three sites are dominated by a pronounced central ridge indicating that non-interacting single domain particles are the main carrier of magnetization throughout the whole sampleset.
An overview of selected SEM micrographs of larger (>1 μm range) magnetically extracted particles of cores 42-SL and 81-SL is displayed in Figure 3. Most particles are at least partially covered by manganese-rich coatings (see crystal surface in Figure 3E). Nearly all recognizable larger magnetic grains are titanomagnetite crystals of octahedral shape in different preservation condition. The titanium content found via EDX spectrum analysis of selected crystals varied between 4.5 and 13.7 wt% (normalized). Some of the titanomagnetite crystals show shrinkage cracks (Figure 3B) from internal stress as a consequence of surficial oxidation (maghemitization, e.g. Petersen and Vali, 1987). Other particles exhibit complex etch marks indicative of slow dissolution (Figures 3D,H). Some well-preserved isolated magnetite dendrites (Figure 3G) originating from quickly chilled lavas were also found in the samples. Despite the somewhat limited resolution of SEM backscatter micrographs, short chains of six or more octahedral biogenic magnetite particles, so-called magnetofossils (Petersen et al., 1986), were frequently found attached to the surface of some larger crystals (Figures 3A,C,D,F). Large parts of the magnetic extracts consisted of fine, filamentous manganese oxides (verified with EDX spectrum analysis) that inhibited systematic analyzes of smaller (<1 μm) magnetic particles, especially submicron (∼50 nm) biogenic magnetite particles. Finding such abundance of fossil magnetosomes in SEM images is actually quite extraordinary, as most studies use TEM imaging to make these nm-sized particles visible (von Dobeneck et al., 1987; Vali et al., 1989).
FIGURE 3. Selected SEM backscatter micrographs of magnetic extracts of 42-SL and 81-SL samples. (A,F) Titanomagnetite crystals with attached magnetofossil chains. (B) Maghemitized titanomagnetite with shrinkage cracks. (C) Octahedral magnetofossil chains on titanomagnetite crystal. Titanomagnetite crystals with complex etch marks (H,D) and adhering biogenic magnetite (D). (E) Titanomagnetite partially covered with a filamentous layer of manganese oxide. (G) Isolated magnetite dendrite.
Paleomagnetic Direction and Polarity Records
Typical vector-endpoint demagnetization diagrams (Zijderveld, 2013) of all three cores are displayed in Figure 4 (same sample selection as for FORC data in Figure 2). These illustrate stable paleomagnetic behavior between 10 and 100 mT AF demagnetization over the full core length and at all three coring sites. The magnetization vectors decay linearly towards the origin, and most data can be satisfactorily fitted with a single straight slope line. In a few exceptions, NRM intensities were so low that the noise to signal ratio increased at higher AF steps. This was the case for the shown samples of core 22-KL from 618.3 to 1,269.5 cm depths. Apart from geomagnetic reversals, the Maximum Angular Deviation (MAD) was generally lower than 5°. Differential NRM vectors of AF fields <10 mT usually deviate from a linear trend, and their removal from the PCA appears therefore as fully justified. A small and systematic offset of the vertical component seen in these Zijderveld plots is attributed to a week artificial bias field and a minor contribution of higher coercivity components that are unproblematic for further interpretations.
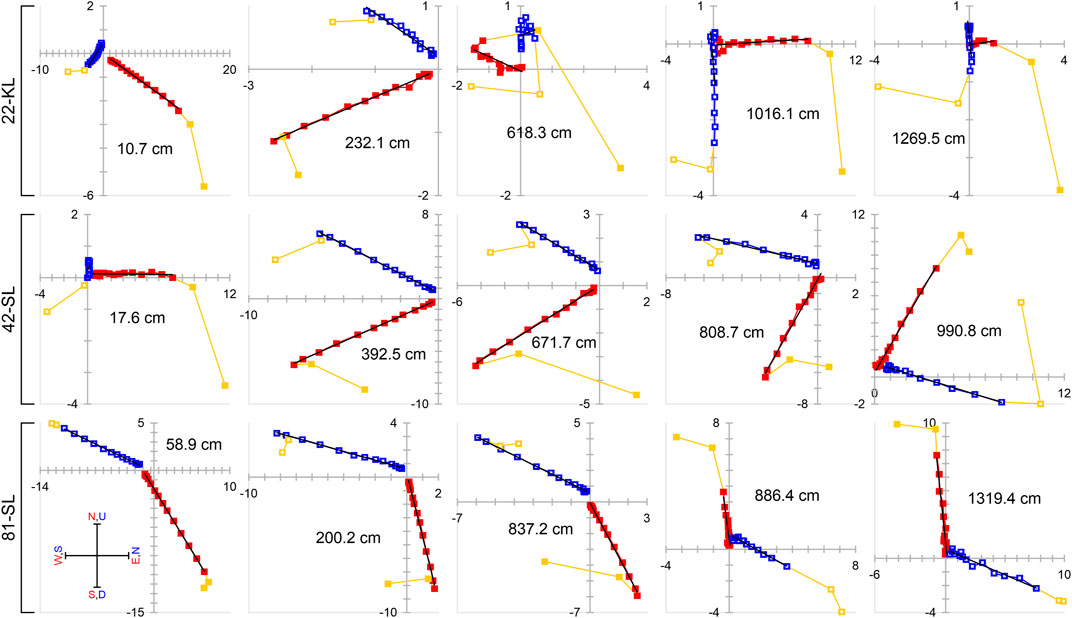
FIGURE 4. Selected Zijderveld NRM demagnetization plots (units in mA/m) for all three cores. Vertical projections are marked with blue open squares, horizontal projections with red filled squares. Yellow symbols mark magnetically overprinted components that were excluded by PCA. Linear regression fits point to the origin for most of the samples, but a small and systematic vertical offset is noticeable in most cases.
The resulting Characteristic Remanent Magnetization (ChRM) declination, inclination, and polarity records were compiled and tied to the newest GTS2020 Geomagnetic Polarity Time Scale by Ogg (2020) in Figure 5. All three records feature very pronounced and easily interpretable polarity reversal patterns. As the low latitude study area limits ChRM inclination changes to ±30°, ChRM declinations provide a better reversal record. In the Brunhes, Matuyama and Gauss chrons, our polarity records are in excellent accordance with the GPTS and allow dating all major reversals reliably. The reversal pattern of core 81-SL obviously begins in subchron C1r.3r (Matuyama) indicating that approximately 3 to 5 m of core-top sediment is missing. This material loss is not thought to result from the coring process and should have natural causes. Core 81-SL was intentionally taken above a fault structure indicated by previous seismic surveys (Kuhn et al., 2015). The loss of the upper 5 m of sediment may therefore result from coring the footwall of a normal fault in the oceanic crust that continues upwards through the entire sediment column.
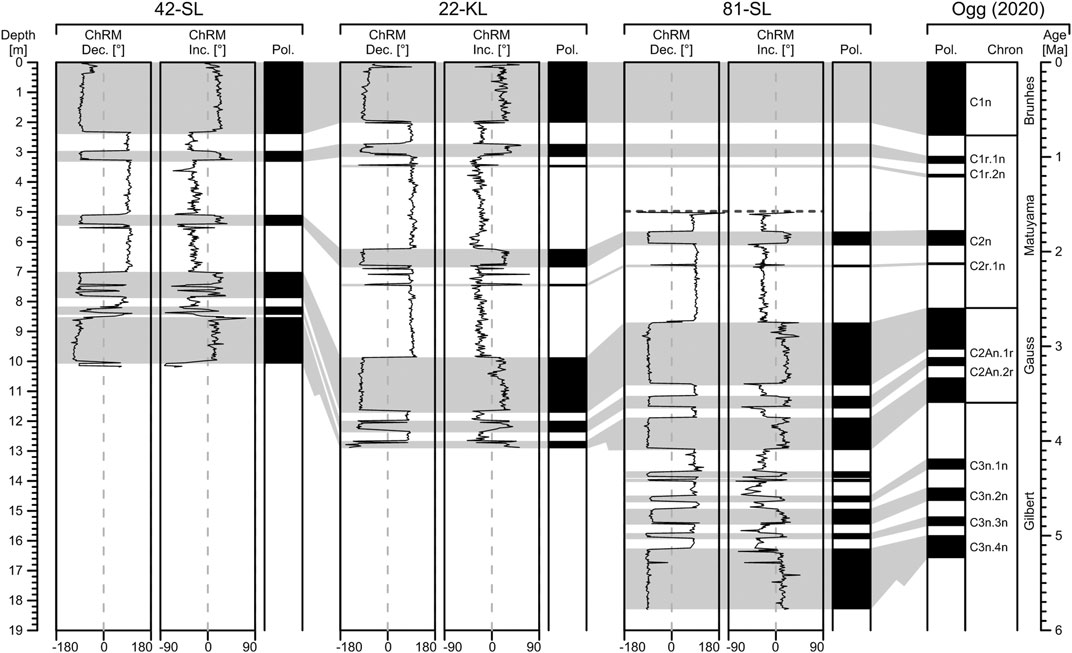
FIGURE 5. Down core plots of ChRM data and corresponding polarity pattern at the three coring sites alongside with the polarity reference from Ogg (2020). The topmost layers of core 81-SL are missing. For improved presentability, the data of core 81-SL was shifted downwards by 5.2 m and consequently the depth indication needs to be converted in case of core 81-SL. Areas shaded in gray display the correlatable periods of normal ChRM polarization.
Core 22-KL covers the complete polarity record from C1n (Brunhes) back to C2An.3n (Gauss prior to C2An.2r), but just misses the Gilbert-Gauss reversal. The two shorter C1r.2n (Cobb-Mountain) and C2r.1n (formerly Réunion, now Feni) normal subchrons of Matuyama are clearly recorded. The lower boundaries of normally polarized periods often exhibit short (single sample) precursor artifacts.
Being ∼2.8 m shorter than 22-KL, core 42-SL still comprises a complete polarity record from recent to the Gilbert-Gauss reversal. The accordingly lower sedimentation rates and therefore lesser temporal resolution of this core explain its inability to keep track of short subchrons. The Gauss polarity pattern of 42-SL is also less precise, and shows bowed transitions of C2An.1r (Kaena), a shortened C2An.2r (Mammoth) subchron, and two outliers at ca. 7.5 m depth.
Except for its missing youngest sediment layers, the polarity record of core 81-SL seems to be complete from the C2n (Olduvai) subchron down to the Gilbert-Gauss reversal. The older reversal sequences correspond to the C3n.1n (Cochiti), C3n.2n (Nunivak), C3n.3n (Sidjufall), and C3n.4n (Thvera) subchrons, but are less well defined as the overlying record. An elusive normal polarity zone appears in C2Ar, i.e., between the Gilbert-Gauss reversal and C3n.1n subchron. This clearly defined double reversal has no match with GTS2020 or earlier GPTS.
Relative Paleointensity Records
The RPI records of our three cores were obtained by an ARM-based straight slope method and plotted in Figure 6 against an RPI record by Yamazaki and Yamamoto (2018). A discussion on alternative target records for deep pacific sites has been recently given by Wang et al. (2021). The here chosen reference record relies on two Equatorial Pacific cores recovered about 7°S and 8°W of our coring sites. Initial ages for our RPI records were obtained by linear interpolation between the above identified reversal ages that we considered as fix age anchor points in the subsequent RPI correlation. Some additional RPI-based tie points were inserted to connect certain more prominent RPI minima within longer polarity zones (red lines in Figure 6). Their number was deliberately kept low to avoid erroneous overfitting causing implausible kinks in the inferred age models and sedimentation rates.
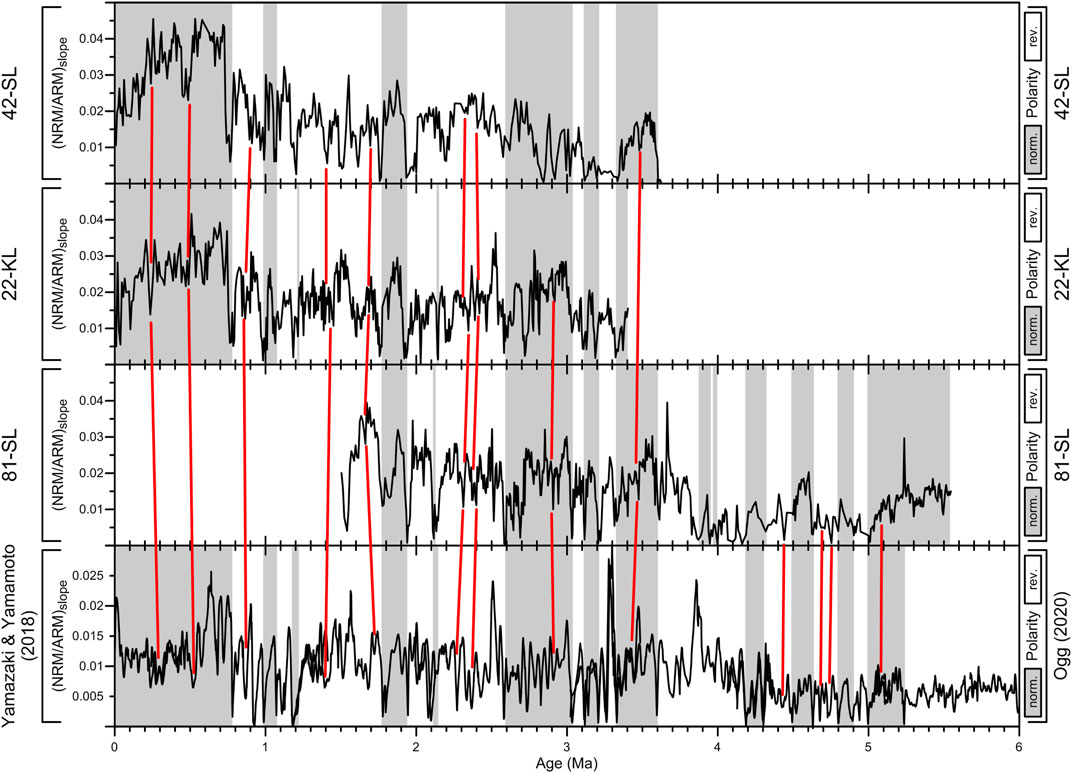
FIGURE 6. RPI records and reversal patterns (in grey) of cores 42-SL, 22-KL and 81-SL in comparison to RPI reference data by Yamazaki and Yamamoto (2018) and GTS2020 reversal ages from Ogg (2020). Red tie lines mark additional chronostratigraphic anchor points inside longer polarity zones. The individual records agree well for the recovered sections in the first ∼3.6 Ma. No convincing signal correlations were found in the 3.3–4.4 Ma interval of core 81-SL due to unusually low signal amplitudes and considerable dissimilarity from the reference RPI record.
Despite very low sedimentation rates of 0.2–0.7 cm/kyr (Figure 7), all RPI records show similar features in the 0–3.5 Ma interval matching the RPI reference record. In the lower 3.5–5.5 Ma section of 81-SL, RPI amplitudes are significantly reduced, equally as the RPI reference curve of Yamazaki and Yamamoto (2018). This drop in the RPI amplitude results from an abrupt increase of the ARM normalizer values without a respective increase of NRM. This discrepancy is most significant at around 3.9–4.0 Ma where the elusive normal polarity in the ChRM record of core 81-SL is situated; here, the RPI record of 81-SL is highly incompatible with the RPI reference. Further down, in the 4.5–5.2 Ma interval, both RPI patterns appear to assimilate again. Four additional tie points based on RPI matches were assumed, but with somewhat lower significance than in the 0–3.5 Ma interval.
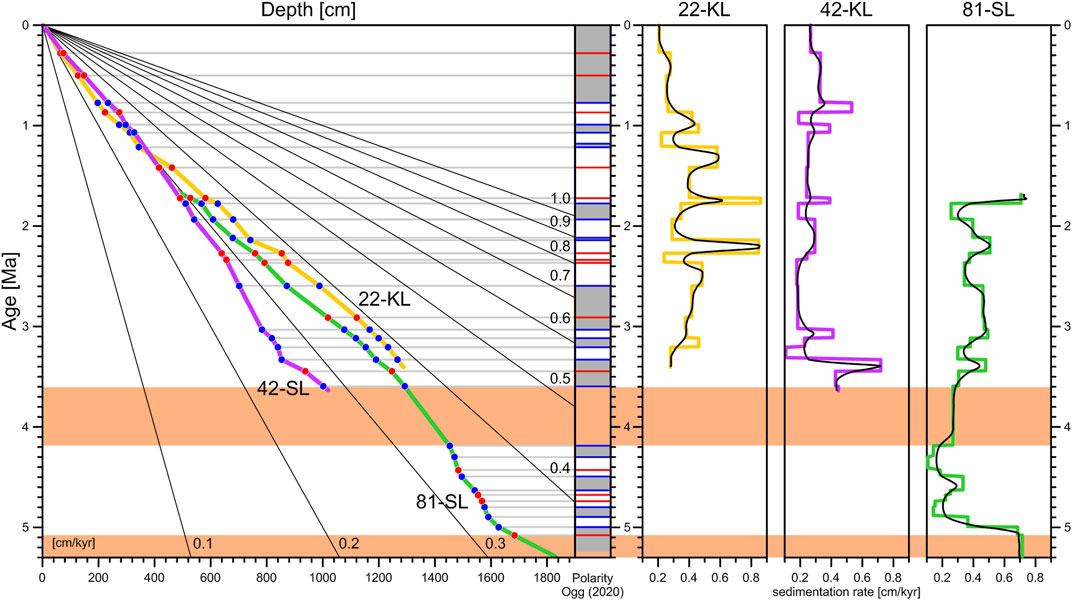
FIGURE 7. Age-depth models (left) and inferred sedimentation rates (three plots at right) of the three studied sediment cores. The polarity plot in the center (grey stands for normal polarity) illustrates the positions of age anchor points in blue (reversals) and red (RPI). No reliable pattern correlation exists for the age intervals marked in orange. The straight radial lines in the age depth plot serve as linear sedimentation rate [cm/kyr] references. The high spatial and temporal variability of sedimentation rates at the different coring sites may result from past sediment dynamics as well as dating uncertainties. Running means in black (500 kyr average) illustrate continuous and probably more realistic sedimentation rate variations, albeit just by plausibility and not by evidence!
Discussion
Magnetostratigraphic Age Models and Sedimentation Rates
Resultant piecewise linear age-depth curves of all three cores and mathematically inferred as well as running-mean smoothed sedimentation rates are displayed in Figure 7 together with their age anchors. The range of sedimentation rates agrees well with those determined by Mewes et al. (2014) and Volz et al. (2018), who determined rates ranging from 0.35 to 0.6 cm/kyr and 0.2–1.15 cm/kyr for several sites in the study area based on 10Be/9Be and 231Pa and 230Th, respectively. The missing top section of core 81-SL must have spanned ∼5.2 m according to backward extrapolation of the age-depth trend. For better comparability, the age-depth curve was shifted respectively. All our magnetostratigraphic age models seem to be quite reliable for the past ∼3.6 Ma. The time interval from 3.6 to 4.2 Ma shaded in orange is without reliable age picks and in conflict with the GPTS due to the unknown double reversal from 3.9 to 4.0 Ma without any sign of a hiatus or discontinuous sedimentation. Paleomagnetic data quality improves again with the C3n.2n subchron and remains until the top of the C3n.4n (Thvera) subchron, the deepest identifiable reversal of core 81-SL. The C3n.4n normal polarity zone extends over ∼2 m all the way down to the core end. Given that C3n.4n has a duration of 238 kyr, this normal section length implies an unexpected high sedimentation rate of >0.8 cm/kyr. Based on the RPI data, the top of the C3n.4n subchron appears to be intact, which suggests that the paleomagnetic record may be disturbed prior to ∼5.2 Ma.
It is, in principle, possible to stretch and compress any ChRM polarity record such that it ideally correlates with a given GPTS. Possible correlation alternatives should be weighed carefully and critically. For testing purposes, an alternative approach to correlate the ChRM data with the GPTS was applied in the attempt to avoid the elusive double normal zone prior to the Gilbert-Gauss reversal in core 81-SL. In this alternative approach, the elusive event in core 81-SL with two normal polarized periods between core depths of 1,368.6 and 1,398.6 cm was correlated to chron C3n.1n, and the following succession of normal events should then correspond to C3n.2n back to subchron C3An.1n which ranged from 6.02 to 6.27 Ma (Ogg, 2020) and is not displayed in Figure 5. However different aspects hamper the plausibility of this alternative correlation, and therefore it is not considered feasible. In the alternative correlation approach, the age model would become considerably stretched, and a maximum sediment age of 7.1 Ma is reached. This requires implausibly low sedimentation rates of less than 0.05 cm/kyr over a continuous period between 5.0 and 6.1 Ma. Such low sedimentation rates over long periods contradict the observation of Costa et al. (2016) who found that stable sedimentation rates should be in the range of 0.5–3.0 cm/kyr for the ridge flank environment of the nearby Juan the Fuca ridge. The situation is further aggravated as the double normal zone prior to the Gilbert-Gauss reversal is clearly separated into two distinctive zones of normal polarity. For direct correlation with chron C3n.1n at least two data points must be considered as outliers without reasonable indication. Out of these reasons the presented age model in Figure 7 and the corresponding correlation of core 81-SL (Figure 5 and Figure 6) is considered more applicable than the potential alternative. Therefore any efforts to correlate the incongruous double event prior to the Gilbert-Gauss reversal in core 81-SL to the GPTS by force are questionable.
Sedimentation rates are generally low in the study area, with average values of 0.42 cm/kyr for 22-KL, 0.26 cm/kyr for 42-SL, and 0.35 cm/kyr for 81-SL for the entire cores. A peak sedimentation rate of ∼0.8 cm/kyr at the bottom of cores 42-SL and 81-SL may suggest increasing age uncertainties toward core ends; similarly high sedimentation rates of ∼0.8 cm/kyr were also found for core 22-KL at around 1.7 Ma and 2.2 Ma. The individual sedimentation rate patterns do not coincide well between all three locations, which may not necessarily mirror heterogeneity in regional sedimentation but could instead result from differential PDRM lock-in effects or other phenomena. The calculated late Pleistocene mean sedimentation rate of core 22-KL is 0.21 cm/kyr; for core 42-SL, it is slightly higher with 0.27 cm/kyr. Localized sediment redistribution by bottom currents may play a certain role in the region up to present days as suggested by Mewes et al. (2014) and Volz et al. (2018) for the study area and by Costa et al. (2016) for the nearby Juan de Fuca Ridge, but we would not expect such relatively stable sedimentation rates, complete reversal records, and matchable RPI records if the variability were large and erosion commonly occurred.
Table 2 gives an overview of sedimentation information at the three coring sites. Crustal ages are interpolated from Müller et al. (2016) at the corresponding location. The thickness of the sediment cover is based on picks from seismic profiles by Kuhn et al. (2015). Costa et al. (2016) found the major factor controlling sedimentation in the near ridge environment of the Juan de Fuca ridge to be localized sediment redistribution rather than cyclic changes in particle influx. Mewes et al. (2014) and Volz et al. (2018) already postulated that strong interactions of bottom currents and topographic features such as seamounts locally affect sedimentation rates and patterns in the CCZ. In such a regime, it would be unlikely to assume continuous sedimentation at minimal rates of the captured time scale. More likely is a scenario where sedimentation starts abruptly as soon as bottom current velocities fall below a certain threshold velocity defined by the physical properties of the suspended nepheloid particles. Linear back calculation of our age-depth models infers sediment bottom ages between 5.8 and 10.9 Ma, implying that large parts of the crust in the study area remained exposed for the first 9.2–13.8 Ma. However lacking further evidence about the actual age of these lowest sediments, such estimates remain speculative.
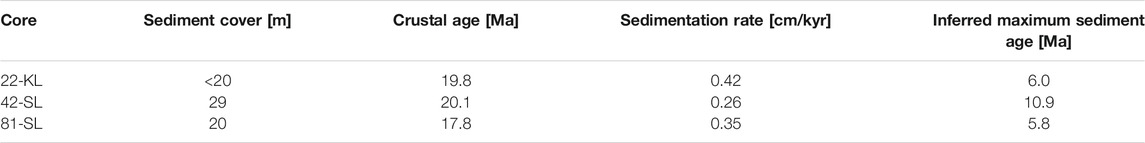
TABLE 2. Maximum sediment thickness (Kuhn et al., 2015) interpolated crustal ages at the corresponding site (Müller et al., 2016), averaged sedimentation rates of the recorded period and the inferred maximum sediment ages.
Potential Causes for Paleomagnetic Artifacts in Ridge Flank Sediments
Non-steady-state Sedimentation, Bioturbation, and PDRM Lock-In
The strictly binary character of geomagnetic reversal records makes them vulnerable to lateral sediment redistribution, e.g. the addition (e.g. turbidites, contourites) or the removal (bottom current erosion) of sediment layers. Inconsistencies such as the overly wide C3n.4n subchron zone at the very bottom of core 81-SL could result from a longer sediment hiatus created by arrested sedimentation or erosion as also reported by Mewes et al. (2014) for sites in the German/BGR exploration license area. In such a scenario, the record for the lower Gilbert (C3r) would simply be missing. This would require the seamless joining of an older normally polarized layer of unknown age to the newer normally polarized layers deposited during C3n.4n. Such a scenario is imaginable if early sediment layers deposited under unstable sedimentation conditions when the bottom current velocity toggled over a hypothetical sedimentation-remobilization threshold.
Vertical sediment mixing by burrowing benthic organisms, i.e., bioturbation, can also play a significant role in reversal patterns as it modifies the depth of the PDRM lock-in zone. Volz et al. (2020a) found typical bioturbation depths of 6–13 cm for CCZ sediments. Bioturbation-induced mixing of magnetic carrier particles in reversing geomagnetic fields may lead to lowered NRM intensities and higher uncertainties in PCA picks. This mechanism can well explain signal artifacts across paleomagnetic reversals (Bleil and von Dobeneck, 1999). Such spurious precursor events occur at some reversals captured in core 22-KL and are mostly carried by only one sample. However, variations in bioturbation depth should not affect paleomagnetic directions during longer phases of stable polarity. They can, therefore, not explain the elusive normal subchron in the upper Gilbert of core 81-SL.
Complex intermittent sedimentation cannot be excluded entirely, but is not recognizable in the sedimentological and rock magnetic records. It is therefore not a convincing explanation for the observed magnetostratigraphic artifacts. More likely mechanisms for the observed ChRM polarity artifacts will be considered in the following.
Redoxomorphic Iron Mineral Diagenesis
As the three ex-situ pore-water oxygen concentration profiles (oxygen data for core 22-KL and 81-SL from Kuhn et al., 2017; Versteegh et al., 2021 oxygen data for core 42-SL from Versteegh et al., 2021) in Figure 8 reveal, the sediments at all three coring sites are subject to upward-directed oxygen diffusion from fluids migrating within the underlying oceanic crust as already described by Kuhn et al. (2017). The vertical coverage of upward oxygen diffusion is largest by core 81-SL (∼5 m), and lesser (∼2.5 m) in cores 42-SL and 22-KL, a consequence of total sediment thickness and core recovery. The consumption of oxygen within the sediments leads to intermediate suboxic zones of various thicknesses in the center of the sediment body. The upward-directed oxygen gradients of the lower oxic zones appear to be almost constant and less steep than those of the upper oxic zones where bow shaped O2 profiles are found. This distinction is easily explained by the continuous upward motion of the sediment-water interface and the burial of fresh, oxygen-consuming organic carbon, which finds its signature in the stronger curvatures and wiggles of the O2 concentration curves in the upper part of the cores.
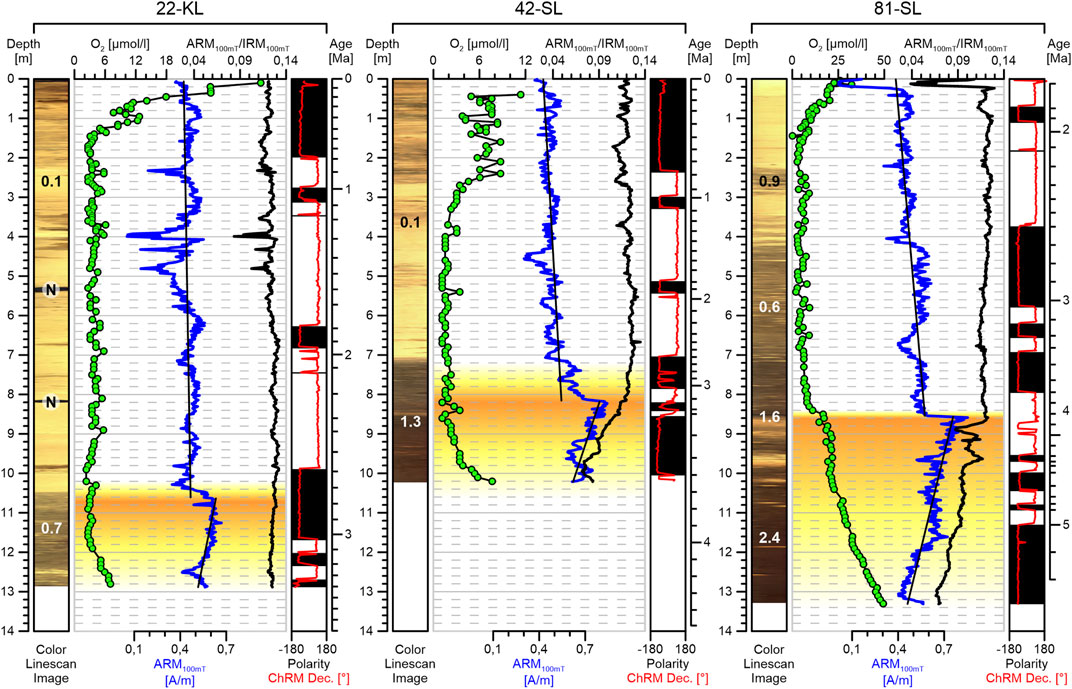
FIGURE 8. Depth plots of geochemical and rock magnetic parameter records from our three cores. Ex-situ oxygen measurements (green markers) for cores 22-KL and 81-SL are from Kuhn et al. (2017), Versteegh et al. (2021). The oxygen record of core 42-SL is from Versteegh et al. (2021). The bow shaped oxygen concentrations indicate upward directed oxygen diffusion along the sediment-crust interface and intermediate-depth oxygen depletion within the sediment column at all three sites. The ARM100mT record shows a pronounced increase in fine magnetite content at the lower oxygen boundaries. The grain size sensitive ARM100mT/IRM100mT ratio suggests a downward coarsening of magnetic grain size in the lower oxygenated zones at sites 42-SL and 81-SL. Calibrated linescan images are displayed at the left of each core. The numbers along the core images indicate the solid phase manganese contents (in wt%) in the corresponding sections of the cores as well as the location of buried manganese nodules (marked with an encircled N) after Kuhn et al. (2015). ChRM polarity and declination at right show regular (black and white) and irregular (grey with arrow) patterns.
The depicted intermediate suboxic interval, confined between an upper and a lower oxic zone, may enable or entail alteration of redox-sensitive magnetic minerals affecting the integrity of paleomagnetic data. Such processes may involve the dissolution of terrigenous and biogenic magnetic iron-oxide minerals as well as (re-)precipitation of secondary biogenic or authigenic Fe-(oxyhydr)oxides at the oxic/suboxic redox boundaries (Karlin, 1990; Tarduno, 1994; Roberts et al., 1999; Funk et al., 2004). Chemoremanent magnetization (CRM) of authigenic Fe (oxyhydr)oxides can alter magnetostratigraphic records by overprinting with later or modern fields (e.g., Just et al., 2019). A sharp increase in ARM below the lower oxic/suboxic redox boundary is observed in all three sediment cores (Figure 8). This indicates an upward increase or formation of fine, ferrimagnetic remanence carriers and a sharp decrease at the lower oxic/suboxic redox boundary. Above this pronounced shift, we find nearly steady, slightly decreasing ARM values all the way up to the core tops, with some, already above mentioned, short and episodical ARM minima. The magnetostratigraphic peculiarities and puzzles of cores 42-SL and 81-SL are both located exactly at this very sharp ARM shift at the lower oxic/suboxic redox boundary and nowhere else, which strongly supports a linkage between this redox boundary and the remagnetization.
Although deep CRM formation is a common explanation for polarity artifacts, it would also provoke several questions in our specific case. For instance, it would be important to know the origin of corresponding free Fe2+ or Fe3+ for the supposed precipitates. Pore-water analysis performed during cruise SO240 (Kuhn et al., 2015) - as well as previous geochemical investigations in the study area (Mewes et al., 2014; Volz et al., 2018; Volz et al., 2020b) did not reveal any dissolved Fe2+ in the pore water. Korff et al. (2016) raised evidence for cyclic magnetite dissolution coupled to changes in the ventilation conditions in the northwest Pacific. However, the lack of pronounced ARM minima in our records makes systematic magnetite dissolution by carbon trapping an unlikely scenario for our cores 42-SL and 81-SL. Core 22-KL indeed shows some partial ARM losses at ∼4.0–4.8 m depth, but this core does not exhibit spurious normal overprint during the respective reverse subchron C1r.3r. The characteristic ARM record with its sudden ARM increase exactly below the present day lower oxic/suboxic redox boundary cannot be explained by upward diffusion of Fe2+ from below which also excludes that the crustal fluids may have acted as a source for free Fe2+ in the past. The previous question about sources for free Fe2+ therefore finds no satisfying answer.
Another problem of CRM hypotheses is the well-proven magnetic mineralogy itself. The ARM records (Figure 8), the FORC distributions (Figure 2), and the SEM micrographs (Figure 3) all strongly support the idea that fine, non-interacting SD and probably biogenic magnetite is the primary magnetization carrier in the sediments at all three sites. The bulk magnetic properties, therefore, give no hint of significantly altered magnetic mineral compositions. Vertically changing but constantly present contents of this SD magnetite particle fraction can be clearly inferred from our data and explain the good paleomagnetic recording qualities of the sediment. Likewise, the vector end-point data do not indicate a coercivity change of the remanence-carrying particles. This would be expected in the case of authigenic magnetic Fe (oxyhydr)oxide precipitates which have much higher coercivity than magnetite (Dunlop and Özdemir, 1997). In the presence of Fe sulfides such as greigite we would expect to find FORC distributions as shown by Roberts et al. (2011), far different from those displayed in Figure 2. If redoxomorphic diagenesis had been responsible for magnetic overprinting, it could only have occurred in the form of authigenic SD magnetite formation.
Reports of abiotic magnetite authigenesis in marine sediments are rare. A recent study of Lin et al. (2020) provides a possible pathway for authigenic magnetite formation but requires the initial formation of Fe sulfides as well as changing methane fluxes. The associated FORC distributions of the study by Lin et al. (2020) show much stronger magnetic interactions between the precipitated particles and have no similarity to those observed in this study (Figure 2), which basically exclude significant changes in the bulk magnetic properties and magnetic carrier mineralogy.
Secondary Biogenic Magnetite Formation
While both sedimentary and diagenetic mechanisms cannot satisfactorily explain the formation of the observed remagnetization patterns found in core 42-SL and 81-SL, this lack of reason has inspired us to a new alternative hypothesis assuming secondary biogenic magnetite formation (Figure 9):
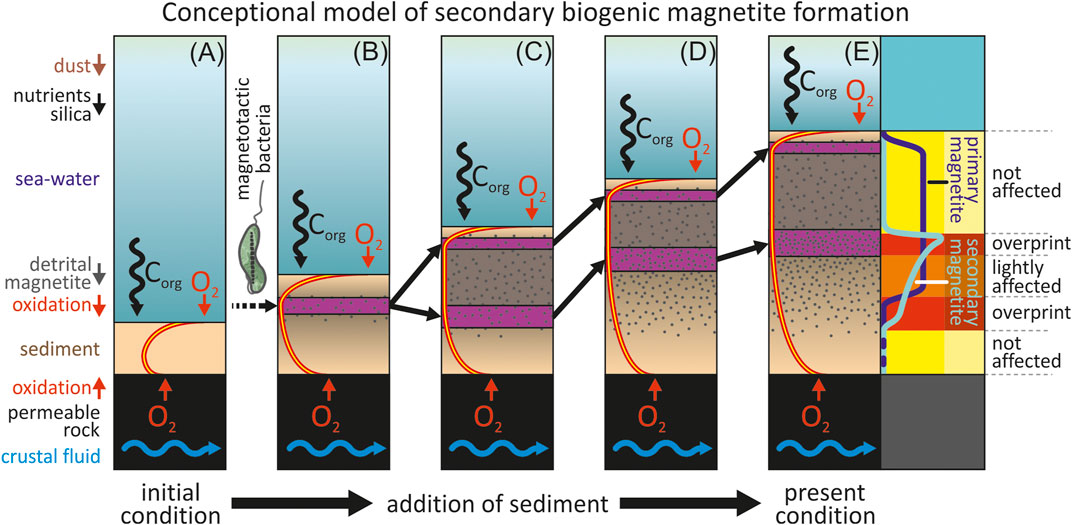
FIGURE 9. Conceptual model of secondary biogenic magnetite formation in inversely oxygenated sediments. (A) The thin sediment layer on young crust is still fully oxic and no magnetotactic bacteria exist. (B) Magnetotactic bacteria start to populate the increasingly oxygen-starved layer in the sediment subsurface and start magnetite biomineralization. (C) Increasing oxygen consumption by organic matter burial and enlarging diffusion lengths leads to the formation of a suboxic zone splitting the population of microaerophilic magnetotactic bacteria into an upper and a lower community. (D) Secondary biogenic magnetite is formed along the lower oxic/suboxic redox boundary that slowly propagates upwards through the sediment column. (E) Stagnation of the upward movement of the lower oxic/suboxic redox boundary leads to an increasingly arrested lower zone of biogenic magnetite biomineralization. At right: Magnetic overprinting (red and orange areas) occurs where the concentration and natural remanence of the secondary biogenic magnetite (turquoise curve) exceeds the concentration of primary biogenic plus detrital magnetite (dark blue curve).
This hypothetical and not previously described process can be divided into five subsequent stages:
1) (Figure 9A) With the onset of sedimentation upon the newly formed ocean crust, the thin initial sediment cover is patchy and fully oxygenated. Oxygen consumed by remineralization of buried organic matter is sufficiently compensated by short oxygen diffusion lengths. Steep oxygen gradients and high flux rates, therefore, sustain oxic conditions throughout the thin sediment column. Modern O2 profiles of this area indicate that this upper oxic zone should have 1–3 m thickness (Kuhn et al., 2015). With upward oxygen diffusion from the sediment-crust interface similar to present-day levels, the lowermost/basal few meters of ridge flank sediment would be permanently oxygenated. In such conditions, microaerophilic magnetotactic bacteria (MTB) should be absent or just occurring in minimal numbers. Consequently, biogenic magnetite would not add much to the sediment’s NRM at this point.
2) (Figure 9B) With ongoing sedimentation, the diffusive oxygen flux to the deeper sediment column would be progressively diminished by increasing diffusion lengths and respiratory consumption (e.g., Mogollón et al., 2016; Versteegh et al., 2021). At some point, the oxygen concentration inside the sediment would lower to habitable levels for microaerophilic bacteria (e.g., Petermann and Bleil, 1993; Faivre and Schüler, 2008). MTB would live and move within both oxygen gradient zones, and their fossil magnetosomes should become the dominant NRM carriers. Some species of MTB such as Magnetospirillum magneticum AMB-1 have been shown to excrete siderophores (e.g., Calugay et al., 2003; Calugay et al., 2006; Faivre and Schüler, 2008) allowing them to uptake mineral-bound Fe to biomineralize magnetite. As no free Fe2+ could be detected in our cores (Kuhn et al., 2015), MTB may have therefore built their magnetosomes from iron obtained from detrital (titano-)magnetite (Figure 3) or other iron-bearing oxide or silicate minerals.
(3) (Figure 9C) The bidirectional oxygen fluxes to the increasingly distant center of the growing sediment drape can no longer compensate for the O2 depletion, e.g. facilitated by the activity of microaerophilic bacteria. This leads to the formation of a suboxic zone in the center of the sediment column. Release, outward migration, and re-oxidation of Mn2+ at the oxygen boundaries further reduce oxygen availability below the Mn precipitation layers (Mogollón et al., 2016; Volz et al., 2020b; Versteegh et al., 2021). These effects result in an initial retreat of the lower and upper oxic/suboxic redox boundaries. At this point, MTB communities could split into upper and lower communities. The upper community stays with the upper oxic/suboxic redox boundary at a constant depth below the sediment-water interface (Petermann and Bleil, 1993). The lower community, however, would follow the retreating lower oxic/suboxic redox boundary. Both communities are now separated by an intermediate suboxic zone that does not support aerophilic life and effectively inhibits the exchange between both communities. The initial retreat of the lower oxic/suboxic redox boundary towards the sediment-crust interface would allow MTBs to enter the deeper parts of the sediments that were initially too oxic for their survival. The corresponding release of biogenic magnetite may now lead to biogenic NRM overprinting of the so far weakly magnetic and magnetized sediments.
(4) (Figure 9D) The upper oxic/suboxic redox boundary is moving along with the sediments surface, followed by the upper MTB community. Buried organic matter in the sediment column is now increasingly oxidized from below by O2 diffusing upward from the sediment-crust interface. Consequentially the lower oxic/suboxic redox boundary also slowly propagates upwards, accompanied by the lower MTB community. Thereby secondary biogenic magnetite is released into higher layers of the sediment but overprinting may not occur as long as the concentration of primary magnetite exceeds the concentration of secondary magnetite.
(5) (Figure 9E). With continuing sediment build-up and progressive flattening of the lower oxygen gradient, oxygen “burn-up” can no longer keep up with sediment accumulation. This stage would lead to near-stagnation, broadening, and eventually fluctuation of the lower oxic/suboxic redox boundary, widening the lower habitable zone of MTBs. Their (secondary) biogenic magnetite would be enriched near the present-day location of the lower oxic/suboxic redox boundary. The release of primary biogenic magnetite by the upper, slowly upwards migrating MTB community should be nearly constant throughout the sediment column.
This conceptional “inverse redox zone biomineralization” model explains the peculiar upward increase of SD magnetite concentration towards the present-day lower oxic/suboxic boundary that is inferred by the ARM records at all three coring sites. It also delivers a straight-forward explanation for paleomagnetic artifacts of cores 42-SL and 81-SL as overprinting of primary by secondary biogenic magnetite. Where the concentration of secondary magnetite exceeds the concentration of the primary magnetite their modern (i.e. Brunhes-normal) orientation predominates. The prominent double reversal at ∼8.8 m (4.2–4.3 Ma) in core 81-SL and the shortened C2An.2r subchron at 8.5 m (∼3.3 Ma) in core 42-SL coincide exactly with the ARM maxima at the present lower oxic/suboxic redox boundary. Here, ARM values indicate an almost double concentration of biogenic magnetite compared to that directly above the lower oxic/suboxic redox boundary.
Following our model, the ARM shift is a simple consequence of adding secondary to primary biogenic magnetite. The expanded C3n.4n subchron zone of core 81-SL should originate from biomineralization during the initial drawdown of the lower oxic/suboxic redox boundary (stage 3). The time-shifted formation of secondary biogenic magnetite would also explain the lower pre-Gauss RPI amplitudes. When primary PDRM carriers with primary NRM orientation (corresponding roughly to sediment age) are complemented by secondary SD particles of potentially opposite orientation, the cumulative NRM of primary and secondary magnetite would decrease by partial cancellation; the orientation-independent ARM normalizer would increase instead, reducing the respective RPI amplitudes. Since primary and secondary biogenic magnetite is undistinguishable, our model can also explain why the FORC data was unobtrusive.
Two inversely magnetized samples ∼7.4 m and ∼7.6 m (2.8 Ma and 2.9 Ma) within the normal upper Gauss (C2An.1n) section of core 42-SL lie just above the pronounced step of the ARM record. Our hypothetical model would presently not infer biogenic directional overprinting in this zone. However, this could have occurred during a past reverse epoch, when secondary biogenic magnetite content overcame a low local primary magnetite content. This could have happened, when the lower oxic/suboxic redox boundary had been slightly further up during a past reverse polarity period, e.g. the Matuyama. Such vertical fluctuations of the lower oxic zone above the present-day lower oxic/suboxic redox boundary are suggested by a brownish layer of manganese precipitates (Kuhn et al., 2015).
The hypothesis of secondary biogenic magnetite formation is also supported by the circumstance that intact fossil magnetosome chains were found in samples from depths just below the present-day location of the lower oxic/suboxic redox boundary in the sediments of cores 42-SL and 81-SL (Figures 3C,D,F). Well preserved biogenic magnetite was found on the surface of heavily altered titanomagnetite crystals (Figure 3D) suggesting that it was just recently formed.
This idealized model allows MTB to permanently live in a zone just above the upper oxic/suboxic redox boundary, in depths between 1.5 and 3 m in the three sediment cores. Further up, the oxygen concentration in the sediment should become unfavorably high for MTB, and their presence should decrease accordingly. However, such a trend is not found in the uppermost FORC diagrams (Figure 2) or the ARM/IRM ratios (Figure 8). Also the ARM data (Figure 8) only indicates a small decreases of biogenic magnetite towards the sediment surface. Magnetofossils can be found far into the upper oxic zone and potentially all the way up to the surface of the sediment. This inconsistency between the conceptual model and the observational data can be explained by the strong nonlinearity of the O2 concentration in the uppermost sediment layers and the resilience of MTB. At 30 cm sediment depth, the O2 concentration is already lowered to levels of less than 25 μmol/L in all three sediment cores. An in-situ study by Petermann and Bleil (1993) showed that MTB cells are indeed found just beneath the sediment surface, i.e. in much higher oxygen concentrations. It may therefore be expected that MTB can also be found close to the top of the sediment cores presented here. Intensive bioturbation in the first 6–13 cm below the sediment surface, as described by Volz et al. (2020a), may further blur the transitions of magnetofossil concentration in the uppermost sediment layers. The conceptual model should generally be applicable, but transitions of the magnetofossil concentration may follow more gradual patterns than indicated by the model.
The presented model can also not fully explain the decreasing trends of the ARM/IRM ratio in core 42-SL and 81-SL (Figure 8), which indicate magnetic grain size coarsening with sediment depth. Such a decrease of the ARM/IRM ratios could partly result from decreasing contents of fine-grained biogenic magnetite in the sediments. This would be consistent with the model as increasing O2 concentrations towards the sediment/crust interface should lead to increasingly unfavorable conditions for MTBs and therefore lowered magnetofossil content. However, ARM (Figure 8), and FORC (Figure 2) data indicates that presumably biogenic SD magnetite remains the main magnetic carrier all the way down towards the lower ends of the sediment cores. Therefore the magnetic grain size coarsening indicated by the ARM/IRM ratios should rather be attributed to elevated contents of coarser lithogenic, titanomagnetite particles in the lower sections of core 42-SL and 81-SL. A higher influx of lithogenic titanomagnetite can be expected during the early stages of sediment accumulation when larger areas of crustal rocks were exposed and the relief-related turbulence was higher in the study area. Since this temporal trend is totally independent from post-depositional biogenic magnetite production, it is not covered by the presented conceptual model.
Conclusions
Three 11.5–13.5 m long sediment cores collected from the relatively thin (20–30 m) sediment cover at the western ridge flank of the north equatorial East Pacific Rise exhibit characteristic bow-shaped oxygen profiles. These feature a steep oxygen gradient zone below the sediment surface and a much wider bottom-up oxygenated zone in the basal sediments overlying the oceanic crust. This upward oxygen supply has been reported previously for the sediments of the CCZ (Mewes et al., 2016; Kuhn et al., 2017) and is related to low-temperature hydrothermal bottom-water circulation through the underlying crust (Kuhn et al., 2017). The hydrothermal fluid transports dissolved oxygen to the crust/sediment interface, where it diffuses upwards into the basal sediments. A systematic and sharp increase of fine bacterial magnetite content is concomitant to the lower oxic/suboxic redox boundary in the sediments of all three investigated sites. It suggests that the sediments bulk magnetic properties are coupled to the diffusive upward oxygen flux emanating from the basal sediment-rock interface. Despite such adverse geochemical conditions, our magnetostratigraphic analyses obtained mostly well interpretable reversal and relative paleointensity data less than 10 m from the sediment-crust interface. The reliable magnetostratigraphic age-depth estimates go back to 3.4 Ma at sites 22 and 42 and back to 5.2 Ma at site 81. The derived sedimentation rates range between 0.1 and 0.8 cm/kyr, in good agreement with previously reported sedimentation rates in the area of the CCZ (Mewes et al., 2014; Volz et al., 2018) and illustrating pronounced sediment winnowing during the early phases of ridge flank sedimentation.
Some irregularities of the reversal records were observed for which no satisfactory explanation in terms of physical or chemical remagnetization could be provided. There was also no rock magnetic evidence for pronounced magnetite dissolution nor other significant changes in magnetic mineralogy—in line with previous geochemical studies in the area, which did not find indications for Fe reduction (Mewes et al., 2014; Kuhn et al., 2015; Volz et al., 2018; Volz et al., 2020b; Versteegh et al., 2021). Our novel conceptual model for secondary biogenic magnetite formation by inversely oriented magnetotactic bacteria living at the bottom of the suboxic zone agrees well with bulk magnetic properties (FORC and ARM) and provides specific and plausible reasons for all the observed magnetostratigraphic artifacts. Secondary magnetite biomineralization does not leave obvious traces in terms of magnetic mineralogy since it is—at least to our present knowledge - indistinguishable from primary biogenic magnetite. Rock magnetic methods based on magnetic hysteresis, coercivity, or thermomagnetics, therefore, deliver completely unobtrusive results as the here presented very uniform FORC distributions demonstrate.
The concept of “secondary magnetite biomineralization in inverse redox zones” is probably valid for all settings where oxygenated fluids circulate through sediment-covered permeable oceanic crust. Microaerophilic (magnetotactic) bacteria may possibly play an important role in iron mobilization and precipitation in the deeper biospheres of hydrothermally active mid-ocean ridge flanks or volcanic seamount margins. Future studies testing this hypothesis should aim to analyze biogenic magnetite preservation states at different sediment depths systematically, detect living magnetotactic bacteria, or search for their biomarkers near the upper and lower oxic/suboxic redox boundaries of such sediments.
Data Availability Statement
The raw data supporting the conclusion of this article will be made available by the authors, without undue reservation.
Author Contributions
The concept for the study was prepared by SK and TD. TK conceived the RV SONNE expedition SO-240 and aided in onboard analysis of the sediment core material. SK and the group members of the research section Marine Geochemistry at the Alfred Wegener Institute Helmholtz Centre for Polar and Marine Research conducted the onboard pore water analysis. AH carried out all rock- and paleo-magnetic measurements and the analytical work in the laboratories at the University of Bremen. AH developed the age-depth models with contributions by TK. The paper was prepared by AH with substantial contributions and revisions from all co-authors.
Conflict of Interest
The authors declare that the research was conducted in the absence of any commercial or financial relationships that could be construed as a potential conflict of interest.
Publisher’s Note
All claims expressed in this article are solely those of the authors and do not necessarily represent those of their affiliated organizations, or those of the publisher, the editors and the reviewers. Any product that may be evaluated in this article, or claim that may be made by its manufacturer, is not guaranteed or endorsed by the publisher.
Acknowledgments
We would like to thank Captain Lutz Mallon, the crew and the scientific party of RV Sonne cruise SO-240 for great support. We are especially gratefull to the group members of the research section Marine Geochemistry at the Alfred Wegener Institute Helmholtz Centre for Polar and Marine Research (AWI) for the execution of the shown on-board measurements. We owe many thanks to the Federal Institute for Geosciences and Natural Resources (BGR) for the access to sediment core material and laboratory space and equipment during the sampling procedure. The staff of the Marine Geophysics group at the University of Bremen provided extensive technical and scientific support during paleo- and rock-magnetic measurements as well as unelaborate access to laboratory space, equipment and instruments. Many thanks also to the Petrology group at the University of Bremen for the access to the scanning electron microscope equipment and the technical support. We gratefully acknowledge constructive discussions and illuminating input by Dr. Thomas Frederichs, Prof. Wolfgang Bach, Prof. Andreas Lüttge and Dr. Edoardo Dallanave. We owe many thanks to Kana Nagashima and the two reviewers Dhananjay Anant Sant and Toshitsugu Yamazaki for their great improvements of the manuscript. This study is funded via the “The Ocean Floor—Earth’s Uncharted Interface” Cluster of Excellence EXC 2077 (project-ID 390741601) at the MARUM Center for Marine Environmental Science at the University of Bremen. We acknowledge further financial support from the German Federal Ministry of Education and Research BMBF under grant 03G0240 in the framework of the project “FLUM” and the Alfred Wegener Institute Helmholtz Centre for Polar and Marine Research.
References
Barckhausen, U., Bagge, M., and Wilson, D. S. (2013). Seafloor Spreading Anomalies and Crustal Ages of the Clarion-Clipperton Zone. Mar. Geophys. Res. 34, 79–88. doi:10.1007/s11001-013-9184-6
Bender, M. L. (1983). The Manganese Nodule Program. Eos Trans. AGU. 64, 42–43. doi:10.1029/eo064i005p00042
Bischoff, J. L., and Piper, D. Z. (1979). Marine Geology and Oceanography of the Pacific Manganese Nodule Province. 1 ed. New York: Springer US.
Bleil, U., and von Dobeneck, T. (1999). “Geomagnetic Events and Relative Paleointensity Records - Clues to High-Resolution Paleomagnetic Chronostratigraphies of Late Quaternary Marine Sediments?” in Use of Proxies in Paleoceanography. Editors G. Fischer, and G. Wefer (Berlin Heidelberg: Springer).
Calugay, R. J., Miyashita, H., Okamura, Y., and Matsunaga, T. (2003). Siderophore Production by the Magnetic bacterium Magnetospirillum magneticum AMB-1. FEMS Microbiol. Lett. 218, 371–375. doi:10.1016/s0378-1097(02)01188-6
Calugay, R. J., Takeyama, H., Mukoyama, D., Fukuda, Y., Suzuki, T., Kanoh, K., et al. (2006). Catechol Siderophore Excretion by Magnetotactic Bacterium Magnetospirillum Magneticum AMB-1. J. Biosci. Bioeng. 101, 445–447. doi:10.1263/jbb.101.445
Calvert, S. E., and Price, N. B. (1977). Geochemical Variation in Ferromanganese Nodules and Associated Sediments from the Pacific Ocean. Mar. Chem. 5, 43–74. doi:10.1016/0304-4203(77)90014-7
Chun, C. (1908). Manganknollen, Wissenschaftliche Ergebnisse der Deutschen Tiefsee-Expedition auf dem Dampfer "Valdivia" 1898-1899. 1 ed. Jena: Verlag von Gustav Fischer, 111–114.
Coogan, L. A., and Gillis, K. M. (2018). Low-Temperature Alteration of the Seafloor: Impacts on Ocean Chemistry. Annu. Rev. Earth Planet. Sci. 46, 21–45. doi:10.1146/annurev-earth-082517-010027
Costa, K. M., McManus, J. F., Boulahanis, B., Carbotte, S. M., Winckler, G., Huybers, P. J., et al. (2016). Sedimentation, stratigraphy and physical properties of sediment on the Juan de Fuca Ridge. Mar. Geology 380, 163–173. doi:10.1016/j.margeo.2016.08.003
Dunlop, D. J., and Özdemir, Ö. (1997). Rock Magnetism: Fundamentals Anf Frontiers. Cambridge: Cambridge University Press.
Egli, R. (2006). Theoretical Aspects of Dipolar Interactions and Their Appearance in First-Order Reversal Curves of Thermally Activated Single-Domain Particles. J. Geophys. Res. 111, 1–18. doi:10.1029/2006jb004567
Faivre, D., and Schüler, D. (2008). Magnetotactic Bacteria and Magnetosomes. Chem. Rev. 108, 4875–4898. doi:10.1021/cr078258w
Fisher, A. T., Davis, E. E., Hutnak, M., Spiess, V., Zühlsdorff, L., Cherkaoui, A., et al. (2003). Hydrothermal Recharge and Discharge across 50 Km Guided by Seamounts on a Young ridge Flank. Nature 421, 618–621. doi:10.1038/nature01352
Fisher, A., and Wheat, C. G. (2010). Seamounts as Conduits for Massive Fluid, Heat, and Solute Fluxes on Ridge Flanks. Oceanog. 23, 74–87. doi:10.5670/oceanog.2010.63
Funk, J. A., von Dobeneck, T., and Reitz, A. (2004). “Integrated Rock Magnetic and Geochemical Quantification of Redoxomorphic Iron Mineral Diagenesis in Late Quaternary Sediments from the Equatorial Atlantic,” in The South Atlantic in the Late Quaternary. Editors G. Wefer, S. Mulitza, and V. Ratmeyer (Berlin: Springer), 237–260.
Harrison, R. J., and Feinberg, J. M. (2008). FORCinel: An Improved Algorith for Calculating First-Order Reversal Curve Distributions Using Locally Weighted Regression Smoothing. Geochem. Geophys. Geosystems. 9, 1–11. doi:10.1029/2008gc001987
Haxby, W. F., and Weissel, J. K. (1986). Evidence for Small-Scale Mantle Convection from Seasat Altimeter Data. J. Geophys. Res. 91, 3507–3520. doi:10.1029/jb091ib03p03507
Jahnke, R. A., Emerson, S. R., and Murray, J. W. (1982). A Model of Oxygen Reduction, Denitrification, and Organic Matter Mineralization in marine Sediments1. Limnol. Oceanogr. 27, 610–623. doi:10.4319/lo.1982.27.4.0610
Jeong, K. S., Kang, J. K., and Chough, S. K. (1994). Sedimentary Processes and Manganese Nodule Formation in the Korea Deep Ocean Study (KODOS) Area, Western Part of Clarion-Clipperton Fracture Zones, Northeast Equatorial Pacific. Mar. Geology 122, 125–150. doi:10.1016/0025-3227(94)90208-9
Just, J., Sagnotti, L., Nowaczyk, N. R., Francke, A., and Wagner, B. (2019). Recordings of Fast Paleomagnetic Reversals in a 1.2 Ma Greigite‐Rich Sediment Archive from Lake Ohrid, Balkans. J. Geophys. Res. Solid Earth. 124, 12445–12464. doi:10.1029/2019jb018297
Karlin, R. (1990). Magnetic mineral Diagenesis in Suboxic Sediments at Bettis Site W-N, NE Pacific Ocean. J. Geophys. Res. 95, 4421–4436. doi:10.1029/jb095ib04p04421
Korff, L., von Dobeneck, T., Frederichs, T., Kasten, S., Kuhn, G., Gersonde, R., et al. (2016). Cyclic Magnetite Dissolution in Pleistocene Sediments of the Abyssal Northwest Pacific Ocean: Evidence for Glacial Oxygen Depletion and Carbon Trapping. Paleoceanography 31, 600–624. doi:10.1002/2015pa002882
Kuhn, T., Bösel, J., Dohrmann, I., Filsmair, C., Fronzek, J., Goegens, R., et al. (2015). SO240 - FLUM: Low-Temperature Fluid Circulation at Seamounts and Hydrothermal Pits: Heat Flow Regime, Impact on Biogeochemical Processes and its Potential Influence on the Occurence and Composition of Manganese Nudules in the NE Pacific. RV SONNE SO240, Cruise Report. Hannover, 1–185. Available at: https://www.portal-forschungsschiffe.de/lw_resource/datapool/_items/item_126/so-240_fahrtbericht.pdf
Kuhn, T., Versteegh, G. J. M., Villinger, H., Dohrmann, I., Heller, C., Koschinsky, A., et al. (2017). Widespread Seawater Circulation in 18-22 Ma Oceanic Crust: Impact on Heat Flow and Sediment Geochemistry. Geology 45, 799–802. doi:10.1130/g39091.1
Li, J., Liu, Y., Liu, S., Roberts, A. P., Pan, H., Xiao, T., et al. (2000). Classification of a Complexly Mixed Magnetic Mineral Assemblage in Pacific Ocean Surface Sediment by Electron Microscopy and Supervised Magnetic Unmixing. Front. Earth Sci. 8, 1–18. doi:10.3389/feart.2020.609058
Lin, Z., Sun, X., Roberts, A. P., Strauss, H., Lu, Y., Yang, X., et al. (2020). A Novel Authigenic Magnetite Source for Sedimentary Magnetization. Geology 49, 360–365. doi:10.1130/g48069.1
Lodge, M., Johnson, D., Le Gurun, G., Wengler, M., Weaver, P., and Gunn, V. (2014). Seabed Mining: International Seabed Authority Environmental Management Plan for the Clarion-Clipperton Zone. A Partnership Approach. Mar. Pol. 49, 66–72. doi:10.1016/j.marpol.2014.04.006
Lurcock, P. C., and Wilson, G. S. (2012). PuffinPlot: A Versatile, User-Friendly Program for Paleomagnetic Analysis. Geochem. Geophys. Geosystems 13, 1–6. doi:10.1029/2012gc004098
Matthews, K. J., Müller, R. D., Wessel, P., and Whittaker, J. M. (2011). The Tectonic Fabric of the Ocean Basins. J. Geophys. Res. 116, 1–28. doi:10.1029/2011jb008413
Mewes, K., Mogollón, J. M., Picard, A., Rühlemann, C., Eisenhauer, A., Kuhn, T., et al. (2016). Diffusive Transfer of Oxygen from Seamount Basaltic Crust into Overlying Sediments: An Example from the Clarion-Clipperton Fracture Zone. Earth Planet. Sci. Lett. 433, 215–225. doi:10.1016/j.epsl.2015.10.028
Mewes, K., Mogollón, J. M., Picard, A., Rühlemann, C., Kuhn, T., Nöthen, K., et al. (2014). Impact of Depositional and Biogeochemical Processes on Small Scale Variations in Nodule Abundance in the Clarion‐Clipperton Fracture Zone. Deep Sea Res. Oceanographic Res. Pap. 91, 125–141. doi:10.1016/j.dsr.2014.06.001
Mogollón, J. M., Mewes, K., and Kasten, S. (2016). Quantifying Manganese and Nitrogen Cycle Coupling in Manganese-Rich, Organic Carbon-Starved marine Sediments: Examples from the Clarion-Clipperton Fracture Zone. Geophys. Res. Lett. 43, 7114–7123. doi:10.1002/2016gl069117
Müller, P. J., Hartmann, M., and Suess, E. (1988). The Chemical Environment of Pelagic Sediments, the Manganese Nodule Belt of the Pacific Ocean: Geological Environment, Nodule Formation, and Mining Aspects. Stuttgart: F. Enke.
Müller, P. J., and Mangini, A. (1980). Organic Carbon Decomposition Rates in Sediments of the pacific Manganese Nodule belt Dated by 230Th and 231Pa. Earth Planet. Sci. Lett. 51, 94–114. doi:10.1016/0012-821x(80)90259-9
Müller, R. D., Seton, M., Zahirovic, S., Williams, S. E., Matthews, K. J., Wright, N. M., et al. (2016). Ocean Basin Evolution and Global-Scale Plate Reorganization Events since Pangea Breakup. Annu. Rev. Earth Planet. Sci. 44, 107–138. doi:10.1146/annurev-earth-060115-012211
Newell, A. J. (2005). A High-Precision Model of First-Order Reversal Curve (FORC) Functions for Single-Domain Ferromagnets with Uniaxial Anisotropy. Geochem. Geophys. Geosystems 6, 1–14. doi:10.1029/2004gc000877
Ogg, J. G. (2020). “Geomagnetic Polarity Time Scale,” in Geologic Time Scale 2020. Editors F.M. Gradstein, J.G. Ogg, M.D. Schmitz, and G.M. Ogg (Amsterdam: Elsevier), 159–192. doi:10.1016/b978-0-12-824360-2.00005-x
Petermann, H., and Bleil, U. (1993). Detection of Live Magnetotactic Bacteria in South Atlantic Deep-Sea Sediments. Earth Planet. Sci. Lett. 117, 223–228. doi:10.1016/0012-821x(93)90128-v
Petersen, N., and Vali, H. (1987). Observation of Shrinkage Cracks in Ocean Floor Titanomagnetites. Phys. Earth Planet. Interiors. 46, 197–205. doi:10.1016/0198-0254(87)96003-1
Petersen, N., von Dobeneck, T., and Vali, H. (1986). Fossil Bacterial Magnetite in Deep-Sea Sediments from the South Atlantic Ocean. Nature 320, 611–615.
Roberts, A. P., Chang, L., Rowan, C. J., Horng, C.-S., and Florindo, F. (2011). Magnetic Properties of Sedimentary Greigite (Fe3S4): An Update. Rev. Geophys. 49, 1–46. doi:10.1029/2010rg000336
Roberts, A. P., Liu, Q., Rowan, C. J., Chang, L., Carvallo, C., Torrent, J., et al. (2006). Characterization of Hematite (α-Fe2O3), Goethite (α-FeOOH), Greigite (Fe3S4), and Pyrrhotite (Fe7S8) Using First-Order Reversal Curve Diagrams. J. Geophys. Res. 111, 1–16. doi:10.1029/2006jb004715
Roberts, A. P., Pike, C. R., and Verosub, K. L. (2000). First-order Reversal Curve Diagrams: A New Tool for Characterizing the Magnetic Properties of Natural Samples. J. Geophys. Res. 105, 28461–28475. doi:10.1029/2000jb900326
Roberts, A. P., Stoner, J. S., and Richter, C. (1999). Diagenetic Magnetic Enhancement of Sapropels from the Eastern Mediterranean Sea. Mar. Geology 153, 103–116. doi:10.1016/s0025-3227(98)00087-5
Rudnicki, M. D., Elderfield, H., and Spiro, B. (2001). Fractionation of Sulfur Isotopes during Bacterial Sulfate Reduction in Deep Ocean Sediments at Elevated Temperatures. Geochimica et Cosmochimica Acta. 65, 777–789. doi:10.1016/s0016-7037(00)00579-2
Rühlemann, C., Kuhn, T., Wiedicke, M., Kasten, S., Mewes, K., and Picard, A. (2011). Current Status of Manganese Nodule Exploration in the German Licence Area, in Proceedings of the Ninth (2011) ISOPE Ocean Mining Symposium, Maui, Hawaii, USA, June, 19-24. Maui: The International Society of Offshore and Polar Enginieers (ISOPE), 168–174.
Tarduno, J. A. (1994). Temporal Trends of Magnetic Dissolution in the Pelagic Realm: Gauging Paleoproductivity?. Earth Planet. Sci. Lett. 123, 39–48. doi:10.1016/0012-821x(94)90255-0
Tauxe, L., and Valet, J.-P. (1989). Relative Paleointensity of the Earth's Magnetic Field from marine Sedimentary Records: a Global Perspective. Phys. Earth Planet. Interiors 56, 59–68. doi:10.1016/0031-9201(89)90036-8
Vali, H., von Dobeneck, T., Amarantidis, G., Förster, O., Morteani, G., Bachmann, L., et al. (1989). Biogenic and Lithogenic Magnetic Minerals in Atlantic and Pacific Deep Sea Sediments and Their Paleomagnetic Significance. Geol. Rundsch. 78, 753–764. doi:10.1007/bf01829320
Versteegh, G. J. M., Koschinsky, A., Kuhn, T., Preuss, I., and Kasten, S. (2021). Geochemical Consequences of Oxygen Diffusion from the Oceanic Crust into Overlying Sediments and its Significance for Biogeochemical Cycles Based on Sediments of the NE Pacific. Biogeosciences 18, 4965–4984. doi:10.5194/bg-18-4965-2021
Volz, J. B., Haffert, L., Haeckel, M., Koschinsky, A., and Kasten, S. (2020a). Impact of Small-Scale Disturbances on Geochemical Conditions, Biogeochemical Processes and Element Fluxes in Surface Sediments of the Eastern Clarion-Clipperton Zone, Pacific Ocean. Biogeosciences 17, 1113–1131. doi:10.5194/bg-17-1113-2020
Volz, J. B., Liu, B., Köster, M., Henkel, S., Koschinsky, A., and Kasten, S. (2020b). Post-depositional Manganese Mobilization during the Last Glacial Period in Sediments of the Eastern Clarion-Clipperton Zone, Pacific Ocean. Earth Planet. Sci. Lett. 532, 1–12. doi:10.1016/j.epsl.2019.116012
Volz, J. B., Mogollón, J. M., Geibert, W., Arbizu, P. M., Koschinsky, A., and Kasten, S. (2018). Natural Spatial Variability of Depositional Conditions, Biogeochemical Processes and Element Fluxes in Sediments of the Eastern Clarion-Clipperton Zone, Pacific Ocean. Deep Sea Res. Part Oceanographic Res. Pap. 140, 159–172. doi:10.1016/j.dsr.2018.08.006
von Dobeneck, T., Petersen, N., and Vali, H. (1987). Bakterielle Magnetofossilien. Geowissenschaften in unserer Zeit. 5, 27–35. doi:10.2312/geowissenschaften.1987.5.27
Wang, W., von Dobeneck, T., Frederichs, T., Zhang, Y., Lembke-Jene, L., Tiedemann, R., et al. (2021). Dating North Pacific Abyssal Sediments by Geomagnetic Paleointensity: Implications of Magnetization Carriers, Plio- Pleistocene Climate Change, and Benthic Redox Conditions. Front. Earth Sci. 9, 1–27. doi:10.3389/feart.2021.683177
Wegorzewski, A. V., and Kuhn, T. (2014). The Influence of Suboxic Diagenesis on the Formation of Manganese Nodules in the Clarion Clipperton Nodule belt of the Pacific Ocean. Mar. Geology 357, 123–138. doi:10.1016/j.margeo.2014.07.004
Wheat, C. G., and Fisher, A. T. (2008). Massive, Low-Temperature Hydrothermal Flow from a Basaltic Outcrop on 23 Ma Seafloo of the Cocos Plate: Chemical Constraints and Implications. Geochem. Geophys. Geosystems. 9, 1–16. doi:10.1029/2008gc002136
Wheat, C. G., Mottl, M. J., and Rudnicki, M. (2002). Trace Element and REE Composition of a Low-Temperature ridge-flank Hydrothermal spring. Geochimica et Cosmochimica Acta 66, 3693–3705. doi:10.1016/s0016-7037(02)00894-3
Winslow, D. M., and Fisher, A. T. (2015). Sustainability and Dynamics of Outcrop-To-Outcrop Hydrothermal Circulation. Nat. Commun. 6, 7567. doi:10.1038/ncomms8567
Yamazaki, T., and Yamamoto, Y. (2018). Relative Paleointensity and Inclination Anomaly over the Last 8 Myr Obtained from the Integrated Ocean Drilling Program Site U1335 Sediments in the Eastern Equatorial Pacific. J. Geophys. Res. Solid Earth. 123, 7305–7320. doi:10.1029/2018jb016209
Ziebis, W., McManus, J., Ferdelman, T., Schmidt-Schierhorn, F., Bach, W., Muratli, J., et al. (2012). Interstitial Fluid Chemistry of Sediments Underlying the North Atlantic Gyre and the Influence of Subsurface Fluid Flow. Earth Planet. Sci. Lett. 323-324, 79–91. doi:10.1016/j.epsl.2012.01.018
Keywords: East Pacific Rise, Clarion-Clipperton Zone, magnetostratigraphy, inverse redox zonation, remagnetization, magnetotactic bacteria, ridge flank sediment, iron biomineralization
Citation: Höfken AF, von Dobeneck T, Kuhn T and Kasten S (2021) Impact of Upward Oxygen Diffusion From the Oceanic Crust on the Magnetostratigraphy and Iron Biomineralization of East Pacific Ridge-Flank Sediments. Front. Earth Sci. 9:689931. doi: 10.3389/feart.2021.689931
Received: 01 April 2021; Accepted: 09 September 2021;
Published: 18 October 2021.
Edited by:
Kana Nagashima, Japan Agency for Marine-Earth Science and Technology (JAMSTEC), JapanReviewed by:
Dhananjay Anant Sant, Maharaja Sayajirao University of Baroda, IndiaToshitsugu Yamazaki, The University of Tokyo, Japan
Copyright © 2021 Höfken, von Dobeneck, Kuhn and Kasten. This is an open-access article distributed under the terms of the Creative Commons Attribution License (CC BY). The use, distribution or reproduction in other forums is permitted, provided the original author(s) and the copyright owner(s) are credited and that the original publication in this journal is cited, in accordance with accepted academic practice. No use, distribution or reproduction is permitted which does not comply with these terms.
*Correspondence: Adrian Felix Höfken, YWhvZWZrZW5AdW5pLWJyZW1lbi5kZQ==