 Thomas Kadyk
 René Schenkendorf
 Sebastian Hawner
 Bekir Yildiz
 Ulrich Römer
- 1Institute of Energy and Process Systems Engineering, Technische Universität Braunschweig, Braunschweig, Germany
- 2Institute of Flight Guidance, Technische Universität Braunschweig, Braunschweig, Germany
- 3Institute of Dynamics and Vibrations, Technische Universität Braunschweig, Braunschweig, Germany
The global transition to a clean and sustainable energy infrastructure does not stop at aviation. The European Commission defined a set of environmental goals for the “Flight Path 2050”: 75% CO2 reduction, 90% NOx reduction, and 65% perceived noise reduction. Hydrogen as an energy carrier fulfills these needs, while it would also offer a tenable and flexible solution for intermittent, large-scale energy storage for renewable energy networks. If hydrogen is used as an energy carrier, there is no better device than a fuel cell to convert its stored chemical energy. In order to design fuel cell systems for passenger aircraft, it is necessary to specify the requirements that the system has to fulfill. In this paper, a statistical approach to analyze these requirements is presented, which accounts for variations in the flight mission profile. Starting from a subset of flight data within the desired class (e.g., mid-range inter-European flights) a stochastic model of the random mission profile is inferred. This model allows for subsequent predictions under uncertainty as part of the aircraft design process. By using Monte Carlo-based sampling of flight mission profiles, the range of necessary component sizes, as well as optimal degrees of hybridization with a battery, is explored, and design options are evaluated. Furthermore, Monte Carlo-based sensitivity analysis of performance parameters explores the potential of future technological developments. Results suggest that the improvement of the specific power of the fuel cell is the deciding factor for lowering the energy system mass. The specific energy of the battery has a low influence but acts in conjunction with the specific power of the fuel cell.
1. Introduction
The aviation sector is a significant player in the global energy crisis and toward climate change. Since the 1980s, CO2 emissions from aviation have increased by 3.6% per year, i.e., twice the world's total growth rate (International Energy Agency, 2017). As a result, aviation currently accounts for 12% of transport-related CO2 emissions and 2-3% of all anthropogenic emissions (Air Transport Action Group, 2016). In order to tackle this challenge, the European Commission formulated reduction targets in the “Flight Path 2050”: 75% CO2 reduction per passenger kilometer relative to the capabilities of typical new aircraft in 2000, as well as 90% NOx and 65% perceived noise reduction (Darecki et al., 2011). Similarly, two US government agencies, the International Air Transport Association (IATA) and the International Civil Aviation Organization (ICAO), pursue an average improvement in fuel efficiency of 1.5% per year until 2020, a cap on net aviation CO2 emissions from 2020 (carbon-neutral growth) and a 50% CO2 reduction until 2050 (Air Transport Action Group, 2016).
Considering the increasing amount of air travel, these goals are unlikely to be reached by evolutionary improvements of existing aviation technology. Recently, Müller et al. (2018) analyzed the influence of modern and fuel-efficient aircraft and retrofit options on fleet planning and fleet emissions. The latest generation of aircraft has a 15% lower fuel burn by using geared turbofans and composite materials. Retrofit options of existing aircraft yield 9–12% less fuel burn by using blended winglets, cabin weight reduction, electric taxing, or replacing the engine with a more efficient one. In their analysis, a low-cost carrier, as well as a full-service network carrier, were analyzed. While moderate CO2 emission reductions of 12% and 7% compared to the “business as usual” scenario could be achieved with such measures, the overall CO2 emissions are predicted to increase further until 2025.
A tenable solution would be the use of hydrogen as fuel, as already pointed out at the end of the 1970s by Bockris and Justi (1980) and references therein. Because of its three times higher gravimetric energy density (33.3 kWh/kg), using hydrogen can reduce the overall weight of the aircraft. This effect is pronounced in fuel-intensive aircraft like long-distance, large passenger number, or hypersonic aircraft (Brewer and Morris, 1976; Bockris and Justi, 1980; Khandelwal et al., 2013; Verstraete, 2013; Kadyk et al., 2018). However, the volumetric energy density of hydrogen is four times lower than hydrocarbons, giving some grievance for fitting the tanks into the aircraft. Nevertheless, aerodynamically volume efficient aircraft designs, such as the blended-wing-body or twin-tail-boom can compensate this effect (Guynn et al., 2004).
Once hydrogen is used as a fuel, there is no better converter than a fuel cell. The increased efficiency of a fuel cell leads to a further reduction of the fuel load. Fuel cells enable additional advantages of electric aircraft such as distributed propulsion, which increases the aerodynamic efficiency. Furthermore, multifunctional integration of the fuel cell into airplanes via harvesting by-products such as water, heat or oxygen-depleted exhaust air, allows using the fuel cell to provide vital processes like de-icing, cabin air conditioning, water supply or fire suppression of luggage compartment or fuel tanks (Friedrich et al., 2009). Polymer electrolyte fuel cells (PEFC) are the most promising fuel cell type due to their high power density, high efficiency, longevity, robustness, design flexibility, high technical maturity, and established use in similar applications (e.g., automotive). However, aircraft design studies during the early 2000s revealed that the gravimetric power density of PEFC is at least a factor of 3 too low for the usage in airplanes (Guynn et al., 2004). Since then the performance of electrocatalysts, which are the “heart” of a fuel cell, has increased by a factor of 10, with performance doubling about every 5.4 years (Eslamibidgoli et al., 2016). To unlock PEFC's potential, advances made on the materials level have to be transferred across the multiscale hierarchy, i.e., over the cell and stack levels toward the systems level. Fuel cell system (FCS) modeling and analysis, as employed in this study, can direct this transformation process and guide future research and development on the sub-levels (Kadyk et al., 2018).
Fuel cell systems are composed of various auxiliary components for media and heat management. These components and their arrangement influence efficiency as well as weight. A good system design minimizes weight, complexity, and the number of system components, while assuring operation over the whole load range and high efficiencies (Jenssen et al., 2017). Furthermore, robustness to the strongly changing environmental conditions, especially temperature and humidity of the inlet air is crucial. The model-based analysis allows a systematic evaluation and quantification of the effects of environmental conditions (Zenith et al., 2010) and process integration for weight minimization (Na et al., 2017).
1.1. Goal and Outline of the Paper
This work seeks to develop a methodology to guide the design process of fuel cell systems for aviation. As a first step, a design target needs to be specified. The main idea is to analyze existing flight data statistically to find a representative mission profile. The statistical modeling is done by filtering a subset of flight data within a desired class (e.g., flights of a specific aircraft type, a desired range or servicing a specific region) and inferring a discrete stochastic model. In the literature, such stochastic models were successfully used to describe track irregularities for dynamic train modeling (Perrin et al., 2011, 2013, 2015; Funfschilling et al., 2012; Lestoille et al., 2014) as well as the description of driving cycles for sizing of fuel cell electric vehicles (Ravey et al., 2010, 2011).
This stochastic model allows predicting mission profiles under uncertainty, which are then used in the energy system design process. By using Monte Carlo-based sampling of mission profiles, the design range (necessary component sizes, hybridization of multiple energy sources) is explored, and design options are evaluated. Furthermore, Monte Carlo-based sensitivity analyses are performed, starting with a simple one-factor-at-a-time approach toward a variance-based sensitivity analysis. In particular, the sensitivities of the most significant component performance parameters, i.e., the specific power of fuel cells and the specific energy of batteries, are analyzed. The sensitivity analysis allows to estimate the future potential of these technologies and derive advise for future research and development efforts.
Section 2 explains the methods used, starting with the generation of the flight mission profile data, the fuel cell system design including fuel cell and hydrogen tank model, the stochastic model of the flight mission profiles and finally the Monte Carlo sampling and sensitivity analysis. In section 3, the histogram-based analysis and design process are demonstrated on a single mission profile. Then, flight data for the two most relevant types of aircraft, the mid-range Airbus A320 and the long-range Boeing B772, are analyzed. After that, the stochastic model is applied to explore the range of energy system designs for A320 and B772. Finally, the sensitivity analysis of technology performance parameters discusses the influence and potential of future technology developments.
2. Methods
A MatLab implementation of the models, tools, and analyses used in this work is available from the repository BitBucket under https://bitbucket.org/rschenken/mc_paper/. This implementation includes the flight mission profile data as well as all parameter values used for the fuel cell, hydrogen tank, and hybrid energy system models. The implementation is free, open source software and allows the reproduction of all results in this paper. In the following sections, the models and methods are explained in detail.
2.1. Flight Mission Profiles
For the generation of the mission profiles a software tool was developed that calculates 4D aircraft flight trajectories using the EUROCONTROL Model 1 flight information. This information is captured in the Enhanced Tactical Flow Management System (ETFMS) and is the last saved flight plan from the airline after all the modifications with Initial Flight Plan Processing System (IFPS) messages (EUROCONTROL, 2018).
The software tool is based on a modular design and allows the operator to simulate and visualize different air traffic scenarios. A point-mass model of the forces applied to the center of gravity is utilized for modeling the aircraft dynamics. This model, sometimes called total energy model, requires knowledge of the aircraft state such as weight and thrust, which are obtained from data contained in the Base of Aircraft Data (BADA) family 3 (EUROCONTROL, 2012).
BADA specifies operation performance coefficients and airline procedure parameters for different aircraft types. These parameters include those used to calculate engine thrust, aerodynamic drag, and fuel consumption (Operation Performance Model) and those used to specify nominal cruise, climb and descent speeds (Airline Procedure Model). An atmosphere model provides atmospheric properties as a function of altitude. BADA is widely used within the domain of Air Traffic Management (ATM) for prediction and simulation of aircraft flight trajectories.
The set of input parameters for the software tool consists of aircraft type and weight, origin and destination, and the flight segments or waypoints (i.e., initial flight plan Model 1). Two data sets of 100 flight plans each were arbitrarily chosen for an Airbus A320-200 (A320) and a Boeing B777-200 ER (B772) on August 25, 2018 (see Figure 1A). For the calculation of the corresponding flight trajectories, the impact of wind was neglected, and an average reference mass for both aircraft types was assumed. Figure 1B shows an example of a calculated 4D flight trajectory associated with the initial flight plan (waypoints).
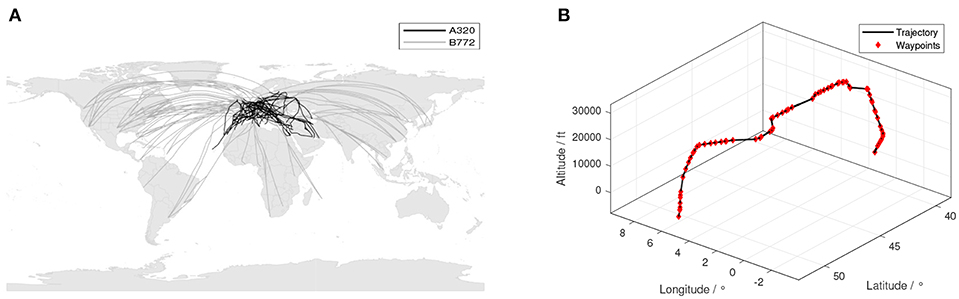
Figure 1. (A) Flight trajectories for two different aircraft types (August 25, 2018), (B) Calculated 4D aircraft flight trajectory using waypoints from initial flight plan.
2.2. Fuel Cell System Design
2.2.1. Fuel Cell Model
In this work, we employ a well-known fuel cell performance model and its analytical, approximated solution for the design process. In the model, the main losses of the fuel cell stem from the cathode catalyst layer (CCL). The anode losses are considered negligible. Additionally, ohmic losses like membrane, electric, and contact resistances are combined into one ohmic resistance, RΩ.
For the cathode performance, a well-known model based on pioneering works of Perry et al. (1998) as well as Eikerling and Kornyshev (1998) is used. The model consists of governing equations for the rate of the oxygen reduction reaction (ORR) in the cathode catalyst layer, i.e., electrochemical current generation,
Ohm's law for proton conduction,
as well as oxygen diffusion through gas diffusion layer (GDL) and CCL,
Here, j is the local proton current density, x is the distance from the membrane, i* is the volumetric exchange current density (per unit CCL volume, A cm−3), c is the local oxygen concentration, cref is its reference (inlet) concentration, η is the local overpotential, b is the Tafel slope, σt is the CCL proton conductivity, j0 = j(x = 0) is the applied current density (per electrode area, A cm−2), and η0 = η(x = 0) is the overpotential.
The boundary conditions for equations (1) – (3) are the applied current density (j(x = 0) = j0), no protons can flow into the GDL (j(x = L) = 0) and no oxygen flows into the membrane (Ddc/dx|x = 0 = 0), respectively.
The CCL model is 1D in the through-plane direction and assumes steady-state and isothermal conditions. It is valid for large overpotentials, η ≫ b. Since the diffusion coefficients in CCL and GDL, i.e., D and Db, are effective parameters, polarization curves for flooded conditions could be simulated if necessary. However, a changing water balance, i.e., a dependency of the diffusion coefficients on current, is not modeled in detail here. Under these assumptions, Kulikovsky (2014) was able to obtain the analytical solution for the polarization curve η0(j0),
with the three characteristic current densities
where lt and lb are the thickness of CCL and GDL, respectively. The constant of integration β is a solution to the equation β tan(β/2) = j0/j*, which can be accurately approximated (Kulikovsky, 2014) by
The first term on the right-hand side of Equation (4a) gives the overpotential due to the combined effect of ORR activation and proton transport. The second and third terms describe the potential losses due to oxygen transport in the CCL and GDL, respectively.
With Equation (4a), the cell voltage Vcell can be calculated as
where Voc is the effective open circuit voltage. Nernst losses are included in Voc, which is taken from experiments. The power density,
and electric efficiency,
complete the set of equations.
While the model solution, Equation (4a), looks rather complex, the model itself is relatively simple. It contains only seven parameters, all of which are effective and physically meaningful parameters that are intuitive to understand. The open circuit voltage Voc includes Nernst losses and hydrogen permeation through the membrane. Four parameters describe the transport properties of the fuel cell's materials, i.e., RΩ and σ describe the ability of the membranes and catalysts to transport protons, D and Db characterize the oxygen transportability of the catalyst and the gas diffusion layer, the Tafel slope b and the exchange current density i* give the activity of the catalyst. The parameter values in this paper are taken from the literature Kulikovsky (2014) and are based on experimental data of Dobson et al. (2012). This parameter set leads to a polarization curve with a moderate performance for a single cell, which is assumed to represent the performance of a state-of-the-art fuel cell stack.
Auxiliary components are included by reducing the specific power of the fuel cell system. This way, the weight and parasitic power demand of the auxiliary components are implicitly modeled in a very simplistic, linear way. More detailed modeling of auxiliary components is beyond the scope of this work, as we only seek to explain the approach and demonstrate its abilities and gain some first fundamental insights. Of course, the fuel cell design process can be extended to obtain more realistic results and include other important aspects like safety, maintenance, life-cycle, and cost.
2.2.2. Hydrogen Tank Model
In long-range aircraft with a high fraction of fuel weight, liquid hydrogen storage is the most viable option in terms of weight and volume, as explained in the literature (Brewer and Morris, 1976; Verstraete et al., 2010; Winnefeld et al., 2018). The first step for the design of the tank system is to determine the required mass of hydrogen and the minimum hydrogen mass flow rate from the generated flight mission histogram, as will be explained in Section 3.1. Subsequently, the densities of liquid and gaseous hydrogen are calculated, using the Equation of State of Leachman et al. (2009). We assume that the hydrogen is kept at a constant pressure of 1.2 bar. This slight overpressure prevents an oxygen inflow. Keeping the pressure constant during the flight, i.e., isobaric operation, prevents mechanical stress on the tank walls. Additionally, we assume isothermic conditions with hydrogen having boiling temperature.
Using the density of liquid hydrogen, the dimensions of the tank can be calculated. An additional gas ullage of 3% (Verstraete et al., 2010) is added. Based on the pressure of 1.2 bar, the thicknesses of the tank wall in the cylindrical section, swc, and the spherical section, sws, are determined, considering material specific safety factors and the design guidelines of the AD 2000 (Verband der TÜV e.V., 2014). For simplicity, only the bare tank structure is considered, i.e., peripherals like connectors, in- and outlets or transitions between the cylindrical and spherical sections, are neglected. Besides the tank wall and insulation, no additional fairing is considered, because a functional integration of the tank into the aircraft structure is assumed. Although venting of hydrogen can be used to reduce the required insulation (Winnefeld et al., 2018), the resulting weight gain is only small, while the vented hydrogen could lead to safety issues. Hence, we do not consider any venting strategy here.
For the design of the required insulation, we consider that the hydrogen is extracted from the tank in gaseous form and needs to be replenished by evaporating liquid hydrogen. In order to keep the pressure in the tank constant, the heat of evaporation has to be compensated by a heat flow into the tank. This required heat flow is supplied by the naturally occurring heat flow through the tank wall and insulation, , as well as an external heat flow, e.g., from a heater or orthohydrogen-parahydrogen catalysis (Leachman et al., 2012). To aid the design process, the heat flow share ω is introduced. This characteristic ratio gives the share of the natural heat flow in the entire heat flow required for hydrogen vaporization,
To avoid pressure increase in the tank, the insulation has to be designed such that ω ≤ 1 for all t. For the design process, it is sufficient to consider the worst case during the flight mission, i.e., the lowest hydrogen mass flow and . For this critical point, the insulation is designed such that ω = 1, i.e., for t = tcrit. Consequently, during all other flight phases, ω < 1 and an additional external heat flow is necessary to vaporize the required amount of hydrogen. The advantage of this design heuristic is its simplicity and computational efficiency, which makes it suitable for Monte Carlo simulations.
The following equations complete the insulation design. The required heat of evaporation, , can be calculated as
where = 451.9 J/g is the enthalpy of hydrogen evaporation. Furthermore, we consider a reduction of the required heat by a safety factor Sf due to vibration, stratification, and acceleration effects as well as heat input by pumps, in- and outlets (Verstraete et al., 2010). The heat flow into the tank through the metallic tank wall, the insulation, and the heat transfer zone at the in- and outside can be calculated as (Baehr and Stephan, 2013)
where s denotes the thickness, λ the heat conductivity, and A the surface area with the subscripts w for the metallic tank wall, i for insulation, c for the cylindrical section of the tank and s for the spherical tank section. The heat transfer coefficients on the inside and outside of the tank, αin and αout, depend on the Nusselt number, the heat conductivity of hydrogen (inside) and air (outside) and a specific characteristic length lch (Baehr and Stephan, 2013),
At the tank's inside, Nu = 17 (Verstraete et al., 2010), while at cylindrical outside surfaces Nu = 0.3 and at spherical surfaces Nu = 2 (Baehr and Stephan, 2013).
Equations (9–12) are solved for the insulation thickness sis/ic and, using the density of the insulation and wall materials, the tank mass is determined.
2.2.3. Fuel Cell and Hybrid System Model
The design target considered in this work is the total mass of the energy system, mtot. For a fuel cell system, mtot mainly consists of the fuel cell stack mass mfc, the mass of the fuel, mH2, and of the fuel tank, mtk. In case of a hybrid energy system, a part of the required power is supplied by a battery with mass mbat. For simplicity, further auxiliary components are included in the power or energy density of the fuel cell stack or battery and are not modeled explicitly. As hybridization strategy, simple peak shaving is applied, i.e., high power peaks are partially delivered by the battery. Hereby, the degree of hybridization is defined as the ratio of the maximum power of the fuel cell to the maximum total power required,
Thus, the total mass is
The mass of the battery is determined either by energy demand, and energy density ϱbat or by required power and power density ρbat. Whichever demand is higher determines the battery mass,
Similarly, the mass of the fuel cell is determined by the required power and the power density of the fuel cell system, .
2.3. Stochastic Model
A Monte Carlo analysis in the context of fuel cell design requires a stochastic computational model of the random flight mission profiles. To this end, we model the variability of the power consumption histograms between different flights as a random process and apply stochastic discretization techniques. The discretization will introduce a vector of uncorrelated, possibly dependent, random variables from which we can draw (pseudo)-random numbers for a subsequent Monte Carlo analysis. In the following, we describe the discretization procedure in a general setting, before relating it to the random flight mission profiles. Let f denote a general random process on a subinterval I on the real line with finite second moments. Our aim is to derive an approximation f ≈ fM(Y), where Y represents an M-dimensional random vector with known joint density function fY, such that we can draw random numbers from it. We denote with
the mean value and covariance function of f, where θ refers to a random outcome and P to a probability measure. We discretize f in space by introducing s1 < s2 < ⋯ < sN points in I, which are assumed to be equally-spaced, for simplicity. Then, by evaluating all the moments on this grid we obtain the vector of mean values and covariance matrix Covf with entries (Covf)ij = Covf(si, sj). Given real data, these quantities can be approximated as
where f(i), i = 1, …, K refers to the i-th realization of f on the grid. We omit the superscript K in the following, keeping in mind that the computations are always carried out with the sample covariance in practice. With this notation at hand, we use the decomposition
where L is obtained from decomposing the covariance matrix as . Such a decomposition can be obtained from a Cholesky factorization or from an eigendecomposition as L = VE1/2, where V stores the normalized eigenvectors column-wise and E is a diagonal matrix, containing the eigenvalues of Covf on the diagonal in decreasing order. It should be noted that the eigendecomposition is also referred to as principal component analysis, see Jones and Rice (1992). Since Covf is symmetric, positive-definite, the eigenvalues are real-valued and larger than zero. For a more detailed description, the reader is referred, e.g., to D'Elia and Gunzburger (2013).
If the process f is strongly correlated, a low-rank approximation may be obtained. For instance, in the case of an eigendecomposition of the covariance matrix, we may approximate , where EM, VM contain the data related to the first M eigenvalues and eigenfunctions only. The truncation is carried out such that the explained variance is sufficiently large. For the A320 and B772 data, we obtained satisfactory results with M = 75. No low-rank approximation is applied for the Cholesky factorization (which could be based, e.g., on coarse grid sampling) and hence, M = N = 100. In view of this large number of random input parameters, a Monte Carlo approach is a natural option.
For a Gaussian process, as (20) represents a linear transformation, Y consists of M independent, standard normal random variables. However, if f is non-Gaussian, modeling Y in this way, the higher order moments or the distribution of both sides of (20) are different, in general. Relying on the orthogonality of the eigenvectors one can infer the relation
which we will use to estimate the distribution of YM based on kernel density estimation. In particular, kernel density estimation can handle multiple modes in the distribution which we indeed observed for the present data. For the Cholesky decomposition, we simply assume a normal distribution for Y, which possibly introduces a modeling error.
In the context of this work, s can be identified with the power consumption, and f(s, ·) represents the (random) total amount of time that power s has to be provided. Figure 2 depicts the mean value and the standard deviation of the original B772 data and the decomposition (20) with a Cholesky factorization. Both moments are represented very accurately. It should be noted that negative powers occasionally arising in the stochastic model are cut-off. Similar results are obtained with the eigendecomposition, for which we additionally observed improved approximations of the distribution, which can mainly be attributed to the flexible kernel density estimation. Hence, the results of section 3 are based on principal component analysis.
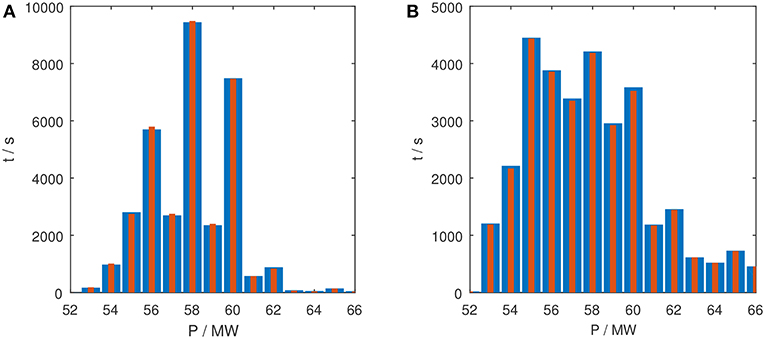
Figure 2. Mean value (A) and standard deviation (B) of original B772 data (blue) and random process (red) defined in (20).
2.4. Sensitivity Analysis
For a rigorous study of technology performance parameter effects on the Quantity of Interest (QoI) (e.g., degree of hybridization, total mass of the energy system, etc.), the analysis of parameter sensitivities is an effective tool (Laoun et al., 2016; Zhao and Howey, 2016; Lin et al., 2018; Zhou et al., 2018). As local sensitivity measures address the effect of individual parameters under the simplifying assumption of linear “cause-effect” relations (Campolongo et al., 2000; Morio, 2011), the global sensitivity analysis (GSA) is the method of choice in this study. GSA quantifies the variation of the QoI caused by individual parameters and parameter dependencies. In the literature, Sobol' indices are the standard for GSA (Campolongo et al., 2000).
Following Saltelli et al.'s (2010) work, Sobol' indices are derived from a decomposition of the variance. For a general QoI which depends on the random input vector Y of size M, there holds
where
and refers to the expected value with Yi fixed. More details and the corresponding higher order expressions can be found in Saltelli et al. (2010). This orthogonal functional decomposition translates to the following variance decomposition as
The first sum on the right-hand side of the previous equation contains the contribution of each individual input parameter to the overall variance . This is the basis for sensitivity analysis via Sobol's indices, which are defined as
Note that the sum of all SGSA[i] values is less than or equal to one
where δ accounts for joint parameter effects; i.e., δ = 0 means no parameter interaction, and δ > 0 correlates with parameter interaction.
For most practical problems, the multi-dimensional integrals in Equation (27) that are needed to calculate the expected value and the variances are approximated numerically. Here, Monte Carlo sampling is the standard (Kucherenko et al., 2009; Gong, 2015) and applied in this study. To perform the global sensitivity analysis, MatLab® and the UQLaB toolbox (Marelli and Sudret, 2014) are used.
2.5. Monte Carlo Sampling
This work employs Monte Carlo routines in two different contexts. First, Monte Carlo simulations of random flight profiles combined with model-based energy system design give the range of required energy system designs necessary to deliver the selected class of flights. In particular, no integration, i.e., averaging over the sample, is involved in this step. The distribution of these system designs is then analyzed in terms of the overall system mass, the mass of the systems component, and the degree of hybridization. Second, a Monte Carlo-based sensitivity analysis of selected system parameters (i.e., the performance parameters of battery and fuel cell, specific energy and specific power, respectively) allows the numerical approximation of the Sobol' indices as global sensitivity measures. Within this Monte Carlo method, for each sample of performance parameters, the average over the random flight missions is considered, i.e., the sensitivity analysis is based on the marginal distributions of the performance parameters.
3. Results and Discussion
3.1. Analysis of a Single Mission Profile
The fuel cell system is designed to deliver a required electrical power profile shown exemplarily in Figure 3A. For the design and analysis, this power profile is converted into the histogram of the required electric power, shown in Figure 3B. By transforming this histogram with the efficiency-power curve of the fuel cell (i.e., dividing the x-axis values by the corresponding efficiency), the histogram of the required hydrogen power (corresponding to a hydrogen mass flow) that needs to be fed into the fuel cell, is obtained. The resulting histogram in Figure 3B shows several power peaks, which can be attributed to different flight phases or maneuvers. By integrating the area under such a peak, the required fuel for the corresponding flight maneuver can be obtained. Integrating the whole histogram gives the total fuel consumption for the flight. The flight in Figure 3 can be distinguished into take-off and climb (3,445 kWh), two cruise phases at 2 different thrusts (2,762 and 1,357 kWh), descend (423 kWh), and approach (116 kWh).
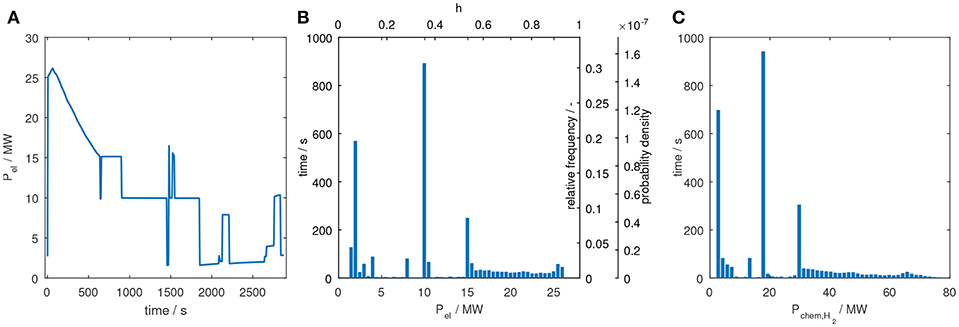
Figure 3. Transformation of a single mission profile of an Airbus A320 short-range flight (A) into the corresponding electric power histogram (B), and by including the fuel cell efficiency into the histogram of the required chemical power of hydrogen (C).
For other analyses it might be beneficial to use different normalization strategies of the histogram, as indicated by the secondary x- and y-axes in Figure 3. For the x-axis, it can be beneficial to normalize to the total power. This way, the degree of hybridization h can be directly read off the axis. For a desired hybridization, say 0.3, integrating the hydrogen power histogram below 0.3 gives the required energy for the fuel cell system (i.e., the hydrogen mass that needs to be stored in the tank). At the same time, integrating the electric power histogram above 0.3 gives the electric energy that needs to be supplied by the battery. By including the battery efficiency, the required battery capacity is obtained. Similarly, the y-axis can be normalized to the total time. This way, the relative time spent in each flight maneuver or power can be analyzed. Another typical normalization is such that the total area under the curve equals 1. This corresponds to normalizing the histogram to the total energy consumed in the flight. This way of normalization might be useful for comparing the relative fuel consumption in different flight phases for different flights (e.g., for different aircraft types, or specific flight connections).
3.2. Analysis of Mission Profile Data
Similar to the analysis of a single flight mission profile, it is possible to analyze a whole data set of flight mission profiles and convert them into the corresponding histogram as demonstrated in Figure 4. The resulting histogram can then be used to design the energy system that fulfills all the included flight missions. By selecting an appropriate data set, histograms for desired design applications can be found. For example, by filtering flight data of a specific aircraft, a histogram-based design of the energy system for that aircraft type can be performed. Similarly, it would be possible to select, e.g., all inner-European flights, transatlantic flights, flights with a desired range or servicing a specific region, etc. and design the energy system for an aircraft optimized for these flight missions.
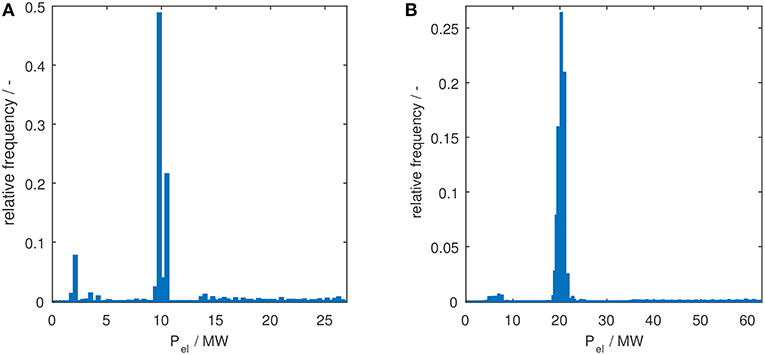
Figure 4. Histograms of the flight data of the A320 (A), and the B772 (B).
In Figure 4, 100 flight missions of Airbus A320 and Boeing B772 aircraft are analyzed. These aircraft are representative for mid-range and long-range aircraft, respectively, in which future hydrogen fuel cell technology is especially beneficial (Kadyk et al., 2018). As can be seen, most of the fuel is spent at partial load during the cruise phase. Comparatively, the long-range B772 is designed toward lower partial loads. Overall, the sample size may be insufficient for an accurate energy system design and resampling should be applied. Here, instead, a stochastic parameterized model as outlined in section 2.3 is inferred from the data set, and Monte Carlo sampling is subsequently used to generate a large number of flight mission profiles. In this way, in addition to a much more refined energy system design, parametric sensitivity analyses can be performed.
3.3. Stochastic Model and Monte Carlo Sampling of Histograms
Random mission profiles were drawn from the stochastic model. Subsequently, the fuel cell system design procedure described above was applied. The obtained system designs are analyzed statistically in Figures 5, 6. For these figures, the most interesting set of performance parameters was selected: for the fuel cell, a specific power of 1.6 kW/kg, corresponding to current automotive fuel cell systems (Yoshida and Kojima, 2015; Kadyk et al., 2018), and for the battery, a specific energy of 0.8 kWh/kg, achievable in the future with lithium sulfur battery systems (Zhang et al., 2017; Cerdas et al., 2018). An analysis of the full parameter space of future energy technologies will be discussed in the next section.
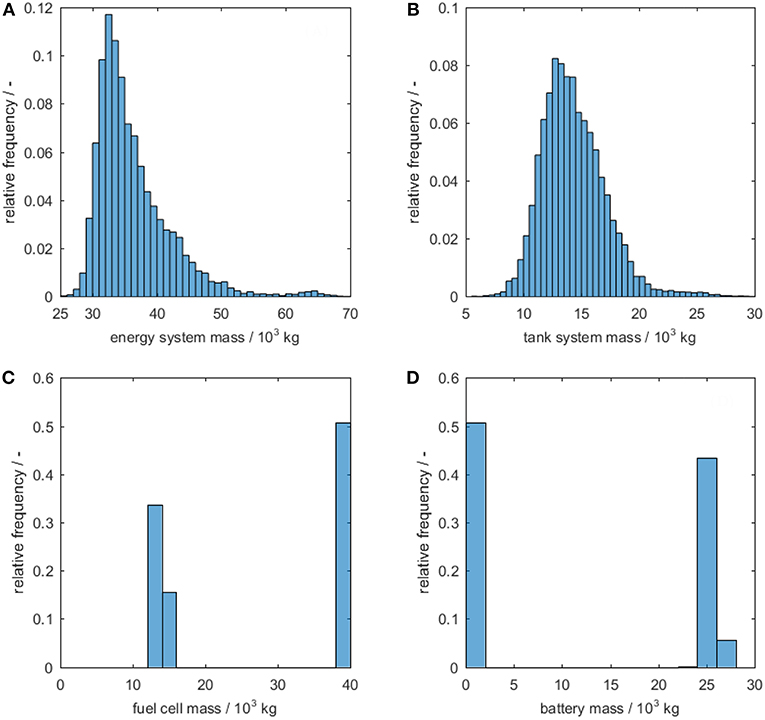
Figure 5. Energy system design for the B772 for current fuel cell systems with a specific power of 1.6 kW/kg and advanced batteries with a specific energy of 0.8 kWh/kg. Distribution of: (A) the total mass of the energy system. (B) mass of the tank system (tank+hydrogen), (C) fuel cell mass and (D) battery mass.
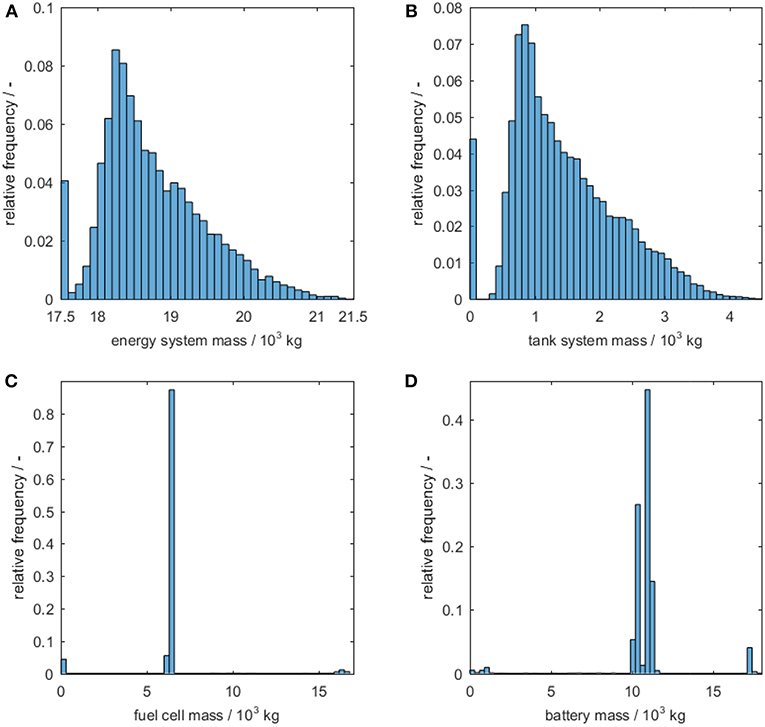
Figure 6. Energy system design for the A320 for current fuel cell systems with a specific power of 1.6 kW/kg and advanced batteries with a specific energy of 0.8 kWh/kg. Distribution of: (A) the total mass of the energy system, (B) mass of the tank system (tank+hydrogen), (C) fuel cell mass, and (D) battery mass.
For the long-range aircraft B772, the overall energy system mass in Figure 5A shows a relatively even distribution with a long but low tail. The distribution of the tank system in Figure 5B shows a similar characteristic, indicating that this tail is caused by a small number of flights that require an unusually high amount of fuel. In practice, one might consider to cut off this small number of flights and deliver them with the next larger aircraft class, rather than over-sizing the tank and energy system to be able to run this small number of flights, while delivering most flights in an off-design point.
The distribution of the fuel cell mass and battery mass in Figures 5C,D reveals that for about half the flights, hybridization with a battery is not beneficial (i.e., the optimum battery mass is zero). Correspondingly, Figure 5C shows a peak at about 40 t fuel cell mass for this fuel-cell-only design, whereas the remaining flights should be covered with a hybrid fuel cell + battery energy system, in which the fuel cell mass would be reduced to 12–15 t.
For the mid-range A320, the distribution of the system mass in Figure 6A shows a more asymmetric distribution, without a clear “tail” to cut off. However, it could still be considered to split the energy system design, e.g., one lightweight design to provide the lower 50% of flights and one heavier, more versatile design to deliver the upper, more distributed 50% of flights. Another remarkable feature is the single peak at the lower end. The comparison with Figures 6B–D shows that these ≈5% flights can be delivered with a battery-only design without fuel cell and tank. Figures 6C,D indicate further, that there are a small number of flights for which a fuel cell-only design is optimal, while for most of the flights a hybrid design with a reduced fuel cell size of 6.5 t has the lowest weight.
3.4. Sensitivity Analysis of Performance Parameters for Estimating Future Technology Potential
As mentioned above, it strongly depends on the technology performance parameters, which design routes emerge. The values of these parameters, i.e., the specific energy of the battery and specific power of the fuel cell, are determined by future research and development outcomes. Hence, a sensitivity analysis of these parameters can be used to explore the potential of future technology as well as set a course for research and development efforts.
As a first step, Figure 7 shows a parameter study of the specific energy of the battery for a fuel cell system with state-of-the-art power density. For the long-range aircraft B772, the optimum degree of hybridization in Figure 7A is 1 for specific energies up to about 0.8 kWh/kg. This shows that with lower performing batteries, hybridization is not beneficial, and a fuel cell-only system design should be used. This conclusion is in accordance with the expectation that fuel cell systems are especially beneficial in terms of weight for long-range aircraft (Kadyk et al., 2018). Only with high specific energy batteries, the degree of hybridization splits into two distinct values: part of the flights are covered with fuel cell-only energy systems, while some of the flights are best performed with a hybrid energy system. The latter has the advantage of a considerably reduced size of the fuel cell, i.e., the fuel cell size can be reduced by 70% while the battery shaves off the high power peak demands. The specific energies of the batteries required for this can be achieved in two ways: either with better battery technologies like lithium-sulfur or lithium-air batteries (Zhang et al., 2017; Cerdas et al., 2018) or by integrating batteries into the structure of the aircraft, e.g., the laminates of the skin (Adam et al., 2018). Corresponding to the degree of hybridization, the overall mass of the energy system shown in Figure 7B splits into a distribution with two peaks for specific battery energies above 0.8 kWh/kg. With an increasing specific energy, the peak of the fuel cell-only system declines and the hybrid system peak dominates.
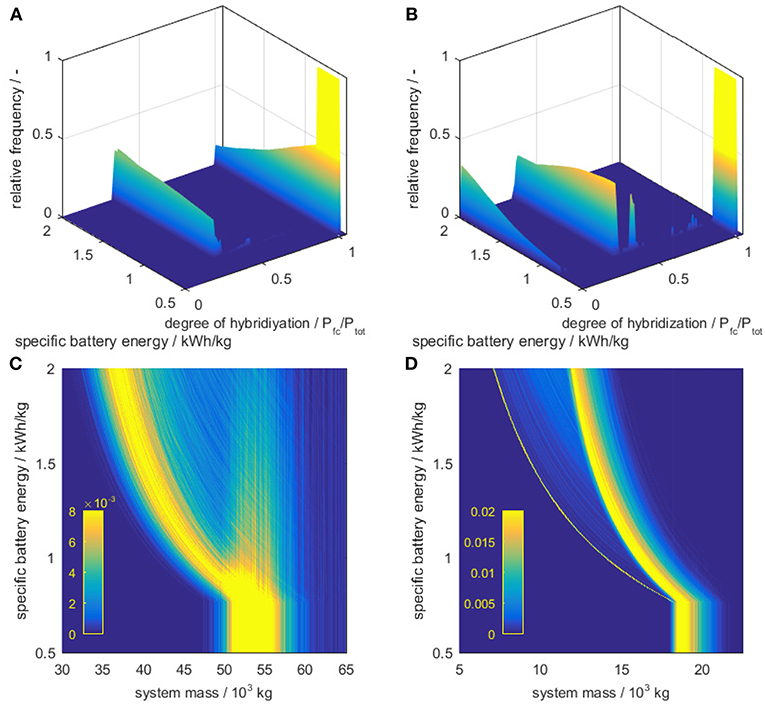
Figure 7. Parameter study of the specific energy of the battery. Left: A320, right B772. (A,B) Show the optimum degree of hybridization; (C,D) show the minimized mass of the energy system, where the color code indicates the relative frequency.
The analysis for the short range A320 in Figure 7 shows three distinct degrees of hybridization, as discussed in the last section: a fuel cell system, a hybrid system, and a battery system. Similar to the B772 study, the threshold for the decline of the fuel cell system is around 0.8 kWh/kg. However, for the A320 the fuel cell only option vanishes above this point, and the system design splits immediately into the hybrid system and battery-only option. Increasing the specific energy further leads to a more and more dominating battery option. For the design of future aircraft in this mid-range region, this has serious implications: depending on the development of fuel cell and battery performances, three very different energy system designs could be dominating. Each of these options leads to individual challenges for the overall design of the aircraft, like the integration of the energy system into the aircraft, electric networks, heat management and many more.
In the second step, a global sensitivity analysis for the two technology performance parameters, i.e., the specific fuel cell power and specific battery energy, was performed. Note that for both parameters uniform distributions over the considered ranges are used in Equation (27). The considered range of specific fuel cell power is from state-of-the-art fuel cell systems with 1.6 kW/kg up to possible future lightweight fuel cell systems with 8 kW/kg, as estimated by Kadyk et al. (2018). The considered range of specific energies of the battery is from current batteries with 0.5 kWh/kg up to the theoretical material limit of lithium-sulfur batteries of 2 kWh/kg (Zhang et al., 2017). As discussed above, a structural integration of the batteries could lead to “effective” specific energy surpassing this material limit. However, the battery capacity that can be integrated into the aircraft structure is limited.
Figure 8 shows the mean frequency of the minimized system mass with corresponding standard deviations given as error bars, i.e., the probability that the optimized energy system has a particular overall mass within the range of the performance parameters and its variation. It can be seen that there is a sharp lower limit at about 5 t, which cannot be undercut even by the best technologies. Above the peak at about 7.5 t, the relative frequency decreases steadily. It becomes unlikely that system masses above 15 t will be necessary to power the A320 for most flight missions and masses above 20 t are practically negligible.
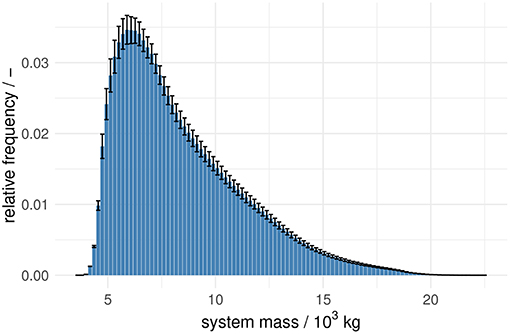
Figure 8. Averaged relative frequencies of the minimized system mass with corresponding standard deviations given as error bars.
The first order Sobol' indices in Figure 9 show that battery performance on its own has little influence on the system mass. Only for systems with high system mass, improving the battery is beneficial. This is because only heavy systems contain significant hybridization with batteries; lighter systems contain light fuel cell systems which cannot be undercut significantly by batteries in terms of specific performance. Moreover, for heavy systems (>10 · 103 kg) there is a strong dependency of two technology performance parameters, i.e., the sum of the Sobol' indices see Equation (28) is considerably below one. In this particular case, it might be an indicator that battery technology can play a significant role in conjunction with the specific fuel cell power. This role increases steadily toward systems with higher mass.
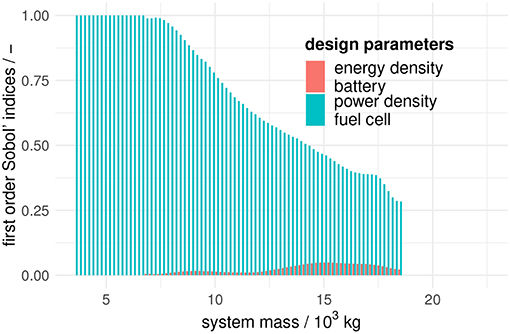
Figure 9. First order Sobol' indices of the two technology performance parameters for the minimized system mass.
4. Summary and Conclusion
In this work, the statistical analysis of flight mission profiles enabled a Monte Carlo-based design process of fuel cell energy supply systems for aircraft. The design target was defined by selecting a subset of flight data within a desired class. As an example, flights from two aircraft types (mid-range Airbus A320-200 and long-range Boeing B772-200 ER) were analyzed. However, other classifications like inner-European flights, flights with a desired range or servicing a specific region would be possible, leading to energy system designs optimized for these flight missions. From these flight data, a stochastic model was inferred, allowing for a large number of random flight mission profiles to be drawn for a Monte Carlo analysis.
The result of this Monte Carlo approach is not just a single design for one operating point but a distribution of designs, e.g., the distribution of component masses or the degree of hybridization. From these distributions, design decisions can be made to cover all or just part of the desired flights. For example, for the long-range B772, the distribution of the total mass has a “tail” toward higher masses, caused by a small fraction of unusually energy-intensive flights. If these flights are delivered with the next larger aircraft class, the overall energy system can be kept significantly smaller, and off-design aircraft operations can be reduced.
For mid-range A320, up to three distinct energy system designs could be relevant: for longer flights, a fuel cell-only energy system has the lowest mass, while in the mid-range a hybridization with a battery can be beneficial and low-range flights might be covered with a battery-only system. In the hybrid system, the battery supplies the peak load during start and ascend, which significantly reduces the size of the fuel cell. However, during the flight, the battery is “dead weight,” which makes hybridization less suitable for longer distances. The battery-only energy system could become optimal for short flights if in future batteries the high specific energy predicted in literature could be achieved.
In order to explore the influence of technological developments, a Monte Carlo-based sensitivity analysis of the performance parameters of fuel cells and batteries, namely the specific fuel cell power and the specific battery energy, were performed. The results seem to indicate that the overall system mass is more sensitive to the specific power of the fuel cell and that the specific energy of the battery is sensitive only in conjunction with the specific fuel cell power. This suggests that the battery has a more supportive role for the analyzed aircraft classes, which is in line with the expectation that fuel cell technology is especially suitable for long-range aircraft.
Overall, the presented design and analysis method is a valuable tool in the energy system design process, especially by supporting decision making and allowing assessment of future technology development trends.
A MatLab implementation of all models, tools, data, and parameter values is available on BitBucket (https://bitbucket.org/rschenken/mc_paper/) as free, open source software.
Author Contributions
TK conceived the idea and performed the flight mission histogram-based energy system design, implemented the fuel cell model and integrated all models and tools. RS conceived the idea, implemented and performed the sensitivity analyses. SH perceived the idea of the engineering physics-based design heuristics for hydrogen tanks as well as developed and implemented the tank model. BY conceived the idea and performed the flight mission profile generation. UR conceived the idea, developed and implemented the stochastic model for representative flight mission profile generation as well as their Monte Carlo simulation. All authors discussed the results, wrote their respective parts of the manuscript and revised the overall manuscript.
Funding
The authors would like to acknowledge the support of the Ministry for Science and Culture of Lower Saxony (Grant No. VWZN3177) for funding the research project Energy System Transformation in Aviation in the initiative Niedersächsisches Vorab.
Conflict of Interest Statement
The authors declare that the research was conducted in the absence of any commercial or financial relationships that could be construed as a potential conflict of interest.
Acknowledgments
The authors would like to acknowledge the discussions with Christopher Winnefeld from the Institute of Electric Power Systems at Leibniz University Hannover.
References
Adam, T. J., Liao, G., Petersen, J., Geier, S., Finke, B., Wierach, P., et al. (2018). Multifunctional composites for future energy storage in aerospace structures. Energies 11:335. doi: 10.3390/en11020335
Air Transport Action Group (2016). Aviation Benefits Beyond Borders. Technical Report July, Air Transport Action Group.
Baehr, H. D., and Stephan, K. (2013). Wärme- und Stoffübertragung. Berlin; Heidelberg; New Yor: Springer-Verlag.
Bockris, J., and Justi, E. W. (1980). Wasserstoff - Energie für alle Zeiten. München: Pfriemer Verlag.
Brewer, G., and Morris, R. (1976). Study of LH2 Fueled Subsonic Passenger Transport Aircraft. Technical report, NASA CR-144935.
Campolongo, F., Tarantola, S., and Saltelli, A. (2000). Sensitivity analysis as an ingredient of modeling. Stat. Sci. 15, 377–395. doi: 10.1214/ss/1009213004
Cerdas, F., Titscher, P., Bognar, N., Schmuch, R., Winter, M., Kwade, A., et al. (2018). Exploring the effect of increased energy density on the environmental impacts of traction batteries: a comparison of energy optimized lithium-ion and lithium-sulfur batteries for mobility applications. Energies 11:150. doi: 10.3390/en11010150
Darecki, M., Edelstenne, C., Enders, T., Fernandez, E., Hartman, P., Herteman, J.-P., et al. (2011). Flightpath 2050. Technical report, European Commission.
D'Elia, M., and Gunzburger, M. (2013). Coarse-grid sampling interpolatory methods for approximating gaussian random fields. SIAM/ASA J. Uncertain. Quantificat. 1, 270–296. doi: 10.1137/120883311
Dobson, P., Lei, C., Navessin, T., and Secanell, M. (2012). Characterization of the pem fuel cell catalyst layer microstructure by nonlinear least-squares parameter estimation. J. Electrochem. Soc. 159, B514–B523. doi: 10.1149/2.041205jes
Eikerling, M., and Kornyshev, A. (1998). Modelling the performance of the cathode catalyst layer of polymer electrolyte fuel cells. J. Electroanalyt. Chem. 453, 89–106. doi: 10.1016/S0022-0728(98)00214-9
Eslamibidgoli, M. J., Huang, J., Kadyk, T., Malek, A., and Eikerling, M. (2016). How theory and simulation can drive fuel cell electrocatalysis. Nano Energy 29, 334–361. doi: 10.1016/j.nanoen.2016.06.004
EUROCONTROL (2012). User Manual for the Base of Aircraft Data (bada) Revision 3.10. Technical Report 12/04/10-45.
EUROCONTROL (2018). Demand Data Repository - Historical Page. Available online at: https://www.eurocontrol.int/ddr (accessed October 18, 2018).
Friedrich, K. A., Kallo, J., Schirmer, J., and Schmitthals, G. (2009). Fuel cell systems for aircraft application. ECS Trans. 25, 193–202. doi: 10.1149/1.3210571
Funfschilling, C., Perrin, G., and Kraft, S. (2012). Propagation of variability in railway dynamic simulations: application to virtual homologation. Vehicle Syst. Dyn. 50(Suppl. 1):245–261. doi: 10.1080/00423114.2012.676757
Gong, W. (2015). An intercomparison of sampling methods for uncertainty quantification of environmental dynamic models. J. Environ. Informat. 28, 11–24. doi: 10.3808/jei.201500310
Guynn, M. D., Freh, J. E., and Olson, E. D. (2004). Evaluation of a Hydrogen Fuel Cell Powered Blended-Wing-Body Aircraft Concept for Reduced Noise and Emissions. NASA/TM-2004-212989.
International Energy Agency (2017). CO2 Emissions From Fuel Combustion: Highlights 2017. Technical report, OECD/IEA.
Jenssen, D., Berger, O., and Krewer, U. (2017). Improved PEM fuel cell system operation with cascaded stack and ejector-based recirculation. Appl. Energy 195, 324–333. doi: 10.1016/j.apenergy.2017.03.002
Jones, M. C., and Rice, J. A. (1992). Displaying the important features of large collections of similar curves. Amer. Stat. 46, 140–145.
Kadyk, T., Winnefeld, C., Hanke-Rauschenbach, R., and Krewer, U. (2018). Analysis and design of fuel cell systems for aviation. Energies 11:357. doi: 10.3390/en11020375
Khandelwal, B., Karakurt, A., Sekaran, P. R., Sethi, V., and Singh, R. (2013). Hydrogen powered aircraft: the future of air transport. Prog. Aerospace Sci. 60, 45–59. doi: 10.1016/j.paerosci.2012.12.002
Kucherenko, S., Rodriguez-Fernandez, M., Pantelides, C., and Shah, N. (2009). Monte Carlo evaluation of derivative-based global sensitivity measures. Reliabil. Eng. Syst. Safety 94, 1135–1148. doi: 10.1016/j.ress.2008.05.006
Kulikovsky, A. A. (2014). A physically-based analytical polarization curve of a PEM fuel cell. J. Electrochem. Soc. 161, F263–F270. doi: 10.1149/2.028403jes
Laoun, B., Naceur, M. W., Khellaf, A., and Kannan, A. M. (2016). Global sensitivity analysis of proton exchange membrane fuel cell model. Int. J. Hyd. Energy. 41, 9521–9528. doi: 10.1016/j.ijhydene.2016.04.046
Leachman, J. W., Jacobsen, R. T., Penoncello, S. G., and Lemmon, E. W. (2009). Fundamental equations of state for parahydrogen, normal hydrogen, and orthohydrogen. J. Phys. Chem. Reference Data 38, 721–748. doi: 10.1063/1.3160306
Leachman, J. W., Street, M. J., and Graham, T. M. (2012). Catalytic pressurization of liquid hydrogen fuel tanks for unmanned aerial vehicles. AIP Conf. Proc. 1434, 1261–1267. doi: 10.1063/1.4707049
Lestoille, N., Soize, C., and Fünfschilling, C. (2014). “Stochastic modeling of train dynamics under effect of track irregularities and experimental comparisons,” in International Conference on Uncertainty in Structural Dynamics (Leuven), 1–9.
Lin, N., Xie, X., Schenkendorf, R., and Krewer, U. (2018). Efficient global sensitivity analysis of 3D multiphysics model for Li-Ion batteries. J. Electrochem. Soc. 165, A1169–A1183. doi: 10.1149/2.1301805jes
Marelli, S., and Sudret, B. (2014). “UQLab: a framework for uncertainty quantification in Matlab,” in Vulnerability, Uncertainty, and Risk, eds M. Beer, S.-K. Au, and J. W. Hall (Liverpool: ASCE Press). doi: 10.1061/9780784413609.257
Morio, J. (2011). Global and local sensitivity analysis methods for a physical system. Eur. J. Phys. 32, 1577–1583.
Müller, C., Kieckhäfer, K., and Spengler, T. S. (2018). The influence of emission thresholds and retrofit options on airline fleet planning: an optimization approach. Energy Policy 112, 242–257. doi: 10.1016/j.enpol.2017.10.022
Na, Y., Zenith, F., and Krewer, U. (2017). Highly integrated direct methanol fuel cell systems minimizing fuel loss with dynamic concentration control for portable applications. J. Process Control 57, 140–147. doi: 10.1016/j.jprocont.2017.06.014
Perrin, G., Duhamel, D., Soize, C., and Funfschilling, C. (2015). Quantification of the influence of the track geometry variability on the train dynamics. Mech. Syst. Signal Process 60-61, 945–957. doi: 10.1016/j.ymssp.2015.01.004
Perrin, G., Funfschilling, C., and Sudret, B. (2011). “Propagation of variability in railway dynamics simulations,” in Applications of Statistics and Probability in Civil Engineering, eds M.H. Faber, J. Köhler, and K. Nishijima (London: CRC Press), 712–718. doi: 10.1201/b11332-107
Perrin, G., Soize, C., Duhamel, D., and Funfschilling, C. (2013). Track irregularities stochastic modeling. Probabil. Eng. Mech. 34, 123–130. doi: 10.1016/j.probengmech.2013.08.006
Perry, M. L., Newman, J., and Cairns, E. J. (1998). Mass transport in gas-diffusion electrodes: a diagnostic tool for fuel-cell cathodes. J. Electrochem. Soc. 145:5. doi: 10.1149/1.1838202
Ravey, A., Watrin, N., Blunier, B., Bouquain, D., and Miraoui, A. (2011). Energy-source-sizing methodology for hybrid fuel cell vehicles based on statistical description of driving cycles, IEEE Trans. Veh. Technol. 60, 4164–4174. doi: 10.1109/tvt.2011.2158567
Ravey, A., Watrin, N., Blunier, B., and Miraoui, A. (2010). “Energy sources sizing for hybrid fuel cell vehicles based on statistical description of driving cycles,” in 2010 IEEE Vehicle Power and Propulsion Conference (Lille: IEEE), 1–6.
Saltelli, A., Annoni, P., Azzini, I., Campolongo, F., Ratto, M., and Tarantola, S. (2010). Variance based sensitivity analysis of model output. design and estimator for the total sensitivity index. Comput. Phys. Commun. 181, 259–270. doi: 10.1016/j.cpc.2009.09.018
Verband der TÜV e.V. (2014). Ad 2000 - merkblätter. Technical report, Arbeitsgemeinschaft Druckbehälter, Berlin.
Verstraete, D. (2013). Long range transport aircraft using hydrogen fuel. Int. J. Hyd. Energy 38, 14824–14831. doi: 10.1016/j.ijhydene.2013.09.021
Verstraete, D., Hendrick, P., Pilidis, P., and Ramsden, K. (2010). Hydrogen fuel tanks for subsonic transport aircraft. Int. J. Hyd. Energy. 35, 11085–11098. doi: 10.1016/j.ijhydene.2010.06.060
Winnefeld, C., Kadyk, T., Krewer, U., and Hanke-Rauschenbach, R. (2018). Modelling and designing cryogenic hydrogen tanks in terms of aircraft applications. Energies 11:105. doi: 10.3390/en11010105
Yoshida, T., and Kojima, K. (2015). Toyota MIRAI fuel cell vehicle and progress toward a future hydrogen society. Interface Mag. 24, 45–49. doi: 10.1149/2.F03152if
Zenith, F., Weinzierl, C., and Krewer, U. (2010). Model-based analysis of the feasibility envelope for autonomous operation of a portable direct methanol fuel-cell system. Chem. Eng. Sci. 65, 4411–4419. doi: 10.1016/j.ces.2010.03.055
Zhang, H., Li, X., and Zhang, H. (2017). Li-S and Li-O2 Batteries with High Specific Energy. Singapore: Springer.
Zhao, S., and Howey, D. A. (2016). “Global sensitivity analysis of battery equivalent circuit model parameters,” in 2016 IEEE Vehicle Power and Propulsion Conference (VPPC) (Hangzhou: IEEE), 1–4.
Keywords: stochastic model, fuel cell, aviation, sensitivity analysis, hydrogen storage, flight mission profile, energy system design, Monte Carlo analysis
Citation: Kadyk T, Schenkendorf R, Hawner S, Yildiz B and Römer U (2019) Design of Fuel Cell Systems for Aviation: Representative Mission Profiles and Sensitivity Analyses. Front. Energy Res. 7:35. doi: 10.3389/fenrg.2019.00035
Received: 10 December 2018; Accepted: 12 March 2019;
Published: 09 April 2019.
Edited by:
Glenn Christopher Mather, Spanish National Research Council (CSIC), SpainReviewed by:
Kas Hemmes, Delft University of Technology, NetherlandsAntonio Martínez Chaparro, Centro de Investigaciones Energéticas, Medioambientalesy Tecnológicas, Spain
Copyright © 2019 Kadyk, Schenkendorf, Hawner, Yildiz and Römer. This is an open-access article distributed under the terms of the Creative Commons Attribution License (CC BY). The use, distribution or reproduction in other forums is permitted, provided the original author(s) and the copyright owner(s) are credited and that the original publication in this journal is cited, in accordance with accepted academic practice. No use, distribution or reproduction is permitted which does not comply with these terms.
*Correspondence: Thomas Kadyk, dC5rYWR5a0B0dS1icmF1bnNjaHdlaWcuZGU=