 Michelle Y. Quigley
 Wakene C. Negassa
 Andrey K. Guber1,3
 Alexandra N. Kravchenko
- 1Department of Plant, Soil and Microbial Sciences, Michigan State University, East Lansing, MI, United States
- 2Faculty of Agriculture and Environmental Science, University of Rostock, Rostock, Germany
- 3Department of Agricultural Soil Science, University of Göttingen, Göttingen, Germany
- 4Argonne National Lab, Center for Advanced Radiation Sources, University of Chicago, Argonne, IL, United States
Pores create a transportation network within a soil matrix, which controls the flow of air, water, and movement of microorganisms. The flow of air, water, and movement of microbes, in turn, control soil carbon dynamics. Computed microtomography (μCT) allows for the visualization of pore structure at micron scale, but quantitative information on contribution of pores to the fate and protection of soil carbon, essential for modeling, is still lacking. This study uses the natural difference between carbon isotopes of C3 and C4 plants to determine how the presence of pores of different sizes affects spatial distribution patterns of newly added carbon immediately after plant termination and then after 1-month incubation. We considered two contrasting soil structure scenarios: soil with the structure kept intact and soil for which the structure was destroyed via sieving. For the experiment, soil was collected from 0–15 cm depth at a 20-year continuous maize (Zea mays L., C4 plant) experiment into which cereal rye (Secale cereale L., C3 plant) was planted. Intact soil fragments (5–6 mm) were procured after 3 months rye growth in a greenhouse. Pore characteristics of the fragments were determined through μCT imaging. Each fragment was sectioned and total carbon, total nitrogen, δ13C, and δ15N were measured. The results indicate that, prior to incubation, greater presence of 40–90 μm pores was associated with higher levels of C3 carbon, pointing to the positive role of these pores in transport of new C inputs. Nevertheless, after incubation, the association became negative, indicating greater losses of newly added C in such pores. These trends were statistically significant in destroyed-structure soil and numerical in intact-structure soil. In soils of intact-structures, after incubation, higher levels of total carbon were associated with greater abundance of 6.5–15 and 15–40 μm pores, indicating a lower carbon loss associated with these pores. The results indicate that, in the studied soil, pores of 40–90 μm size range are associated with the fast influx of new C followed by its quick decomposition, while pores <40 μm tend to be associated with C protection.
Introduction
Soils contain twice as much carbon as the atmosphere and have the potential to store even more, especially in agricultural soils (Lal, 1999; Swift, 2001; Dungait et al., 2012; Kell, 2012). Soil carbon content is an important component of soil fertility as it drives several defining criteria of soil quality, including cation exchange capacity, soil aggregation, and water holding capacity (Dou et al., 2014). This makes utilization of agricultural management practices that increase and/or conserve soil carbon vitally important to sustainability (Grandy and Robertson, 2007).
One such practice is the utilization of cover crops, a crop that is planted between main crops for the purpose of preventing erosion, decreasing weeds, and increasing soil fertility. The activity of cover crop roots may benefit the physical protection of new carbon inputs. Physical protection of soil carbon occurs when physical disconnections separate decomposers from carbon sources (Dungait et al., 2012). This disconnect is not limited to access of decomposers and their enzymes to soil carbon, but also includes availability of other components necessary for decomposition, such as oxygen and water (Schmidt et al., 2011; Keiluweit et al., 2017).
Long-term cover crop based management increases soil aggregation (Tiemann and Grandy, 2015), and soil carbon is known to be better protected within soil aggregates (Six et al., 2000; Grandy and Robertson, 2007). Yet, mechanistically, it is the soil pore-space that controls not only movement of soil microbes, but also air and water fluxes and transport of nutrients necessary for decomposition (Young and Crawford, 2004; De Gryze et al., 2006; Negassa et al., 2015). Pores within the soil matrix serve as planes of breakage along which the aggregates form; and their sizes and spatial positions not just define soil aggregate-size distributions but determine micro-environmental conditions driving physical carbon protection within the aggregates (Young et al., 2001; Ekschmitt et al., 2005, 2008; Kravchenko and Guber, 2017; Rabot et al., 2018).
Pores of different sizes have different origins, accessibilities, and hydraulic properties. As pore size decreases, higher suction is required to drain the pore. This means that while pores of >10 μm sizes may only require gravity to fully or partially drain, under normal soil moisture regimes, pores <10 μm remain water filled (Marshall et al., 1996).
Plant root diameters are typically >40 μm and, therefore, roots can only access and/or create pores exceeding that size (Wiersum, 1957; Cannell, 1977). Root pores are formed by compressing the soil matrix radially as the root pushes through the soil and then their walls are stabilized through mucilage (Gray and Lissmann, 1938; Greacen and Oh, 1972; Greacen and Sands, 1980; Czarnes et al., 2000; Ruiz et al., 2017). Fungal hyphae are known to create pores of 20–30 μm size by pushing aside silt particles and exuding binding agents to buttress the pores (Dorioz et al., 1993; Bearden, 2001; Emerson and McGarry, 2003). However, fungi are typically excluded from pores <10 μm (Six et al., 2006).
Roots provide carbon into the soil system in two ways: as a source of biomass when they die and as a source of easily decomposable carbon via root exudates. Roots tend to consist of more difficult to decompose molecules (such as lignin and tannin), which, in addition to being harder to decompose, are easier to adsorb to mineral surfaces, sequestering them (Rasse et al., 2005; Jackson et al., 2017). Root exudates, on the other hand, tend to be small, soluble, and easily decomposable materials, such as organic acids, carbohydrates, and amino acids (Dungait et al., 2012) or water insoluble materials, such as mucilage (Brimecombe et al., 2001). The easily decomposable materials stimulate microbial growth, which increases decomposition of native soil organic matter (SOM) (Kuzyakov and Blagodatskaya, 2015). There is some indication that microorganisms can also stimulate root growth and exudation (Neumann et al., 2014).
Agricultural management influences pore size distributions. Wang et al. (2012) showed that soil under long-term conventional tillage had more pores of 37.5–97.5 μm, while primary succession agricultural management had greater proportions of >97.5 and <15 μm pores. Kravchenko et al. (2014) found that organic management with cover crops had fewer 32–58 μm pores and a greater amount of >188 μm pores than conventional tillage management. In that study, the difference in pores from organic cover crop management were attributed to increased root activity, while conventional management promoted 32–58 μm pores created through wetting/drying cycles. Ananyeva et al. (2013) found that higher carbon concentrations were found in sections of soil aggregates with an increased presence of 15–37.5 μm pores. The presence of 37.5–97.5 μm pores was associated with aggregate sections containing less carbon.
Stable carbon isotopic signatures can be used to track carbon within a system. Plants preferentially incorporate 12C into their tissues, but the extent of 12C incorporation depends on which metabolic pathway the plant utilizes. Plants that utilize the C3 photosynthetic pathway incorporate more 12C than plants utilizing the C4 photosynthetic pathway. Therefore, it is possible to differentiate between carbon derived from C3 and C4 plants isotopically due to this natural isotopic difference. Stable carbon isotopes are reported in δ notation as per mil (%0) differences between the 13C/12C ratio of the sample compared to a standard:
SOM and particulate organic matter (POM) δ13C values reflect the δ13C values of the original plant material source. Therefore, the measured δ13C of a soil reflects the C3/C4 history of the soil (Ehleringer et al., 2000; Bowling et al., 2008). Experiments that utilize C3/C4 transitions have been used extensively for determination of soil C turnover rates (Bernoux et al., 1998; Derrien and Amelung, 2011) and for analyses of the fresh carbon input distribution within soil aggregates (Smucker et al., 2007; Urbanek et al., 2011).
The goal of this study was to determine how the abundance of different pore sizes relates to the preservation or loss of newly added carbon. We utilized a C3/C4 natural abundance greenhouse experiment with soil collected from a long term C4 cropping system and planted a C3 plant, cereal rye (Secale cereale L.), which is one of the most commonly used cover crops in the US Midwest. The first objective of this study was to examine the relationships between newly added carbon and soil pores of different sizes. We used δ13C to “track” newly added C3 carbon and determined pore characteristics via computed microtomography (μCT). The second objective was to examine the relationships between the decomposition of carbon and soil pores sizes after incubating the studied soil.
Materials and Methods
Greenhouse Experimental Setup
Soil for the greenhouse study was obtained in the summer of 2013 from the Living Field Lab (LFL) experiment established in 1993 at W. K. Kellogg Biological Station, Hickory Corners, MI (42°24′N, 85°24′W). The soil is a fine-loamy, mixed mesic Typic Hapludalf (Oshtemo and Kalamazoo series) developed on glacial outwash. Soil was collected from the LFL's conventional management continuous maize (Zea mays L.) treatment. This treatment has been planted with maize, a C4 plant, and no other crop since 1993. Detailed management and site information is available at http://lter.kbs.msu.edu/Data/LTER and https://lter.kbs.msu.edu/research/long-term-experiments/living-field-lab/.
Six soil blocks of 40 × 26 × 15 cm size were collected at 0 to 15 cm depth. Three of the blocks were placed directly into plastic bins with as little disturbance as possible to retain intact soil structure, and are referred to hereafter as intact-structure treatment. However, we were concerned that, due to the tendency of roots to follow existing pore structure, the root effects generated during out experiment might be masked by the legacy of the existing pores. Therefore, soil from the other three blocks was crushed and sieved through a 1 mm sieve to destroy the existing soil structure, and is referred to hereafter as destroyed-structure treatment. One of the intact soil bins was left unplanted as a control, and the remaining bins had cereal rye (S. cereale L.) hand planted at a depth of 3 cm and a plant density of ~23.5 plants per m2. Rye was grown in the greenhouse for 3 months and watered daily to allow for the development of a good stand of rye biomass; the control bin was watered along with the rest. Soil bulk density was taken in each tub using a 7.5 cm brass ring.
After 3 months of rye growth, approximately an eighth of the soil was taken from a random side in each bin was removed using a trowel and allowed to air dry. The soil was allowed to break along natural planes of weakness through manual crushing. Intact soil fragments of 5 mm size were hand selected (n = 5, 11, and 11 for control, destroyed-structure and intact-structure treatments, respectively) for analyses and incubation. Soil fragments were selected based on proximity to rye roots to best determine the effect of rye root growth on the aggregates. Two rye roots per bin were hand collected for isotope analysis from intact plants from the soil used for soil fragment selection. Selected intact soil fragments were mounted on top of plastic stands using rubber cement for subsequent scanning and incubation.
The experiment and data collection are briefly summarized here and then described in detail in the sections below. First, all intact soil fragments were air-dried and subjected to μCT scanning (section μCT Image Collection and Analysis). Then half of the intact soil fragments were physically cut into ~0.5–1 mm3 sections, with the physical positions of the procured sections matching their virtual positions in 3D μCT images (section Soil Fragment Cutting and Chemical Analyses). In each cut section, we measured δ13C, δ15N, total C (%C), and total N (%N). These intact soil fragments are hereafter referred to as Pre for preincubation soil. The remaining intact fragments were subjected to a 28 day incubation during which respired CO2 was measured and collected for δ13C analysis (section Incubation Experimental Set Up). After incubation, the intact soil fragments were re-scanned and also cut into sections, then δ13C, δ15N, total C (%C), and total N (%N) measurements were taken. These intact soil fragments are hereafter referred to as Post for post incubation soil.
μCT Image Collection and Analysis
The μCT images for both Pre and Post intact soil fragments were obtained on the bending magnet beam line, station 13-BM-D of the GeoSoilEnvironCARS (GSECARS) at the Advanced Photon Source (APS), Argonne National Laboratory (ANL), IL. Images were collected with the Si (111) double crystal monochromator tuned to 28 keV incident energy, the distance from sample to source was ~55 m, and the X-ray dose is estimated to be 1 kGy. Two-dimensional projections were taken at 0.25° rotation angle steps with a 1 s exposure and combined into a three-dimensional image consisting of 1,040 slices with 1,392 by 1,392 pixels per slice for Pre scans, resulting in a voxel size of 6.5 μm, while Post scans had 1,100 slices with 1,920 by 1,920 pixels, resulting in a voxel size of 6.2 μm. The data were pre-processed by correcting for dark current and flat field and reconstructed using the GridRec fast Fourier transform reconstruction algorithm (Rivers, 2012).
Pore/solid segmentation of the images was conducted using the indicator kriging method in 3DMA-Rock software (Oh and Lindquist, 1999; Wang et al., 2011). Based on the analysis of the segmented data we obtained the total porosity of the intact soil fragments, the total image porosity (pores > 6.5 μm in diameter), and the size distribution of >6.5 μm diameter pores. Total porosity of each intact fragment was calculated using the dry weight of the fragment and its volume as determined from the μCT images. The total image porosity was calculated as the percent of pore voxels within the total intact soil fragment's voxels. Size distribution of image identified pores was determined using the burn number distribution approach in 3DMA-Rock software (Lindquist et al., 2000; Ananyeva et al., 2013). Briefly, the burn number represents the shortest distance from the pore medial axis to the pore wall. For clarity, burn numbers have been converted into pore diameters. We specifically focused the data analyses on the pores of the following four diameter size ranges: 6.5–15, 15–40, 40–95, and >95 μm. These pore sizes were chosen to match pore sizes previously studied in macro-aggregates and which demonstrated strong associations with carbon (Wang et al., 2012, 2013; Ananyeva et al., 2013; Kravchenko et al., 2014, 2015).
Incubation Experimental Set Up
The soil fragments used in incubation (Post soil) consisted of two intact soil fragments from control treatment, 6 intact soil fragments from destroyed-structure treatment, and 5 intact soil fragments from intact-structure treatment. Water was added to the fragments to achieve 60% of water filled pore space. The fragments were then placed into 10 ml vacutainers (BD Franklin Lakes NJ, USA) with 1 mL of de-ionized water added to the bottom to maintain high humidity. Incubations were carried out for 28 days at 22.4 ± 0.1°C. CO2 emission measurements were taken on days 1, 2.5, 4, 8, 13, 19, and 28. Gas samples for isotope analysis were collected on days 13, 19, and 28 only. The CO2 emission measurements were conducted using an LI-820 CO2 infrared gas analyzer (Lincoln, Nebraska, USA). After each sampling, the remaining gas in the headspace was flushed with CO2-free air. Flushing was found to dry out the soil, so de-ionized water (~10–20 μL) was added directly to the fragments to maintain the moisture level after day 4. One intact-structure fragment and four destroyed-structure fragments broke during the incubation and, while chemical analyses were possible, the broken fragments could not be re-scanned.
Soil Fragment Cutting and Chemical Analyses
To assess patterns of δ13C, δ15N, total C, and total N and their relationship to pore characteristics, each intact soil fragment was cut into 5–13 sections. This was done to account for variation between the soil fragments. The number of sections into which the fragment was cut depended on its size and shape. To facilitate cutting, de-ionized water was added to fill 30% of the pore volume immediately prior to cutting. Cutting was performed with a #11 scalpel and a 24x magnifying glass. The relative position of each cut was recorded. Then, the relative positions were used to virtually cut the 3D μCT image to match the physical cutting. Virtual cutting yielded regions in the three-dimensional tomographic images that corresponded to the physically cut sections. Image based porosity and pore size distributions were determined in each virtual section of each soil fragment.
Prior to chemical analyses, visibly identifiable particulate organic matter (POM) was separated from physically cut sections and analyzed separately. The identifiable POM consisted primarily of plant root remains, but occasional plant residue fragments of unknown origin were also observed. Soil from cut sections, POM from cut sections, and separately collected rye roots were analyzed for δ13C, δ15N, total C, and total N at the Stable Isotope Facility at the University of California Davis. Fragment sections were analyzed using an Elementar Vario EL Cube or Micro Cube elemental analyzer (Elementar Analysensysteme GmbH, Hanau, Germany) interfaced to a PDZ Europa 20-20 isotope ratio mass spectrometer (Sercon Ltd., Cheshire, UK). POM material and rye roots were analyzed using a PDZ Europa ANCA-GSL elemental analyzer interfaced to a PDZ Europa 20-20 isotope ratio mass spectrometer (Sercon Ltd., Cheshire, UK).
Gas samples were analyzed for δ13C at the Stable Isotope Facility at the University of California Davis. Gas samples were analyzed using a ThermoScientific GasBench system interfaced to a ThermoScientific Delta V Plus isotope ratio mass spectrometer (ThermoScientific, Bremen, Germany).
The carbon isotopes are reported relative to Vienna PeeDee Belemnite (VPDB) with a 0.1%0 standard deviation for solid samples and 0.02%0 standard deviation for gas samples. The nitrogen isotopes are reported relative to AIR and had a standard deviation of 0.1%0.
Grayscale Gradients
Grayscale gradients were used to identify spatial patterns in the soil matrix adjacent to root pores of 40–90 μm size. The grayscale value of an individual voxel from a μCT image is a function of the atomic number and relative density of the material within the voxel. Higher atomic number elements, such as iron, have higher grayscale values on images, while lower atomic number elements, such as carbon and nitrogen, have lower grayscale values on images. Therefore, the value of each grayscale voxel reflects elements present within it. Quigley et al. (2018) showed that spatial gradients in grayscale values adjacent to the pores formed through plant root activities matched well SOM gradients determined by the osmium staining method (Peth et al., 2014; Rawlins et al., 2016). Thus, in this study we will use the grayscale gradients adjacent to the root pores as indicators of SOM distributions.
Three root pores of 40–90 μm size range were identified on Pre and Post images from 4 soil fragments. The root pores were then 3D dilated by one voxel to exclude any voxels containing both pore and solid material. Voxels were averaged in ~13 μm layers around the pore to a distance of 194 μm and the grayscale gradients were obtained by averaging the grayscale values of each layer (Figure 1). Averages excluded 0 values that represented the background and 255 values to prevent skewing the gradients by the occasional presence of inclusions of high atomic number elements, e.g., Fe. For direct comparison of the images, the values were normalized such that the lowest average grayscale value within the gradient was 0 and the highest average grayscale value within the gradient was 1.
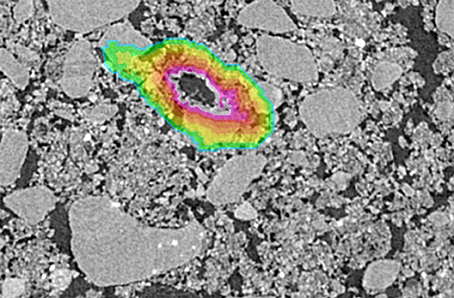
Figure 1. Example of a selected root used for grayscale gradient analyses. The color overlay indicates the extent of the grayscale gradient with the colors indicating each individual 13 μm layer.
Statistical Analysis
Comparisons between intact- and destroyed-structure treatments as well as between Pre and Post in terms of pore characteristics and δ13C, δ15N, total C, and total N were conducted using the mixed model approach implemented in the PROC MIXED procedure of SAS Version 9.4 (SAS, 2009). The statistical model for the analyses consisted of the fixed effects of treatment, Pre and Post, and their interaction; and a random effect of soil fragments nested within treatment and Pre and Post. The normality was visually assessed using normal probability plots and stem-and-leaf plots, while equal variances was assessed using Levene's test. Where the equal variance assumption was violated, analysis with unequal variances was conducted (Milliken and Johnson, 2009).
For analysis of δ13CO2 and CO2 data obtained during soil fragment incubations, the statistical model consisted of the fixed effects of treatment, time, and their interaction. Time was treated as a repeatedly measured fixed factor using the REPEATED statement of PROC MIXED. Comparisons between the δ13CO2 and the δ13C of the fragments prior to incubation were conducted by defining the δ13C of the soil in each treatment as a control and analyzed using Dunnett's comparison-with-control test. The significant differences at the 0.05 level were reported, while trends are reported at the 0.1 level.
Regression analyses between pore characteristics and δ13C and total C were conducted using the PROC REG procedure in SAS Version 9.4 (SAS, 2009). The significant slopes at the 0.05 level were reported.
To investigate the correlation between the pore sizes (6.5–15, 15–40, 40–90, and >90 μm) and chemical measures (δ13C, total C, and total N), canonical correlation analysis was conducted using the cancor function in R (R Core Team, 2013). Canonical correlation compares how one set of variables is correlated to another set of variables in multidimensional space. The correlations are described through axes, which can be represented as orthogonal planes of maximum correlation, known as correlation axes. Each correlation axis is defined by canonical variates. Canonical variates are latent variables, which are not observed, but derived from a combination of the observed variables. Collinearity within the observed variables was checked through the calculation of the determinant prior to canonical correlation analysis. As canonical correlations requires a larger data set, only the Pre data set was used for canonical correlations due to the small sample size of the Post data set.
Results
Soil and Plant Characteristics
Soil bulk density was lower in the treatments with rye as compared to control treatment (Table 1). The average δ13C values of particulate organic matter (POM), that is, the visible root remains and unidentifiable plant fragments isolated from intact soil fragments during their cutting, showed that the control treatment had significantly more C4 POM than the destroyed-structure treatment and numerically more C4 POM than the intact-structure treatment (Table 1). The destroyed-structure and intact-structure treatments were significantly different from each other at α = 0.1, but not α = 0.05. The δ13C of rye roots grown in destroyed-structure soil were depleted by ~1.5%0 more than rye roots grown in intact-structure soil, while the δ15N of rye roots in destroyed-structure was depleted by ~3.3%0 as compared to intact (Table 1).
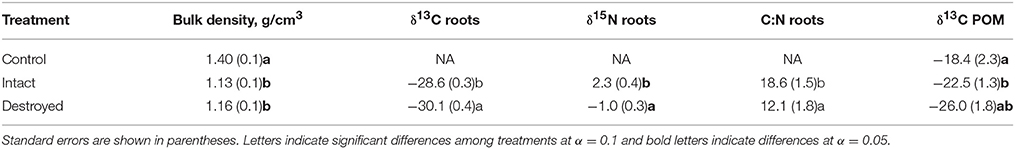
Table 1. Means of soil bulk density (n = 2) and characteristics of rye roots (n = 4) from the studied treatments.
Prior to incubation, intact-structure and destroyed-structure soil had significantly higher total C than the control soil (Table 2). However, after incubation, this significance disappeared. The C:N ratio was significantly lower for control soil fragments than for the fragments from the intact-structure treatment both in Pre and Post. The δ13C values in destroyed-structure soil significantly increased, indicating losses in C3 carbon during incubation. The numerical trend in δ15N of Destroyed>Intact>Control observed in the Pre increased and became statistically significant post-incubation. The total N was not affected by either treatment or incubation.
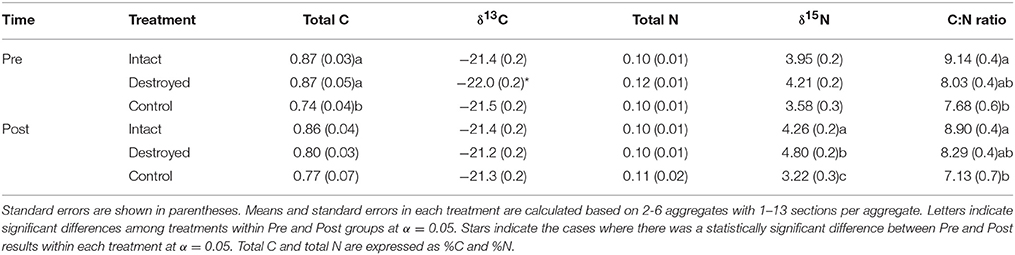
Table 2. Means of soil carbon and nitrogen characteristics for the three studied treatments Pre and Post.
Pore Characteristics
Total porosity of individual soil fragments ranged from 10 to 30% for all three treatments. The average image porosity, that is presence of pores >6 μm in diameter, was around 12% in fragments from control and 20% in fragments from rye treatments (Figure 2). After incubation, pore abundances tended to numerically increase in soils from all three treatments (Figure 3), however, the increases were only statistically significant for the pores from the 6.5–15 μm size group (Figure 2). Pores with diameters >90 μm tended to be the least abundant in the control treatment, followed by the intact-structure and destroyed-structure soils. This tendency was observed in the soils prior to incubation and remained after incubation. Differences between treatments were only observed for the >90 μm pores.
Figure 2. Relative abundances of 6.5–15, 15–40, 40–95, >95 μm pores, and porosity in the soil fragments of the three studied treatments before and after incubation. Relative pore abundance refers to the percent of medial axes per total soil volume as determined from 3DMA-Rock software. Bars represent standard errors. Letters indicate significant differences between treatments, across Pre and Post (α = 0.05). Stars indicated significant differences between Pre and Post within each treatment at α = 0.05.
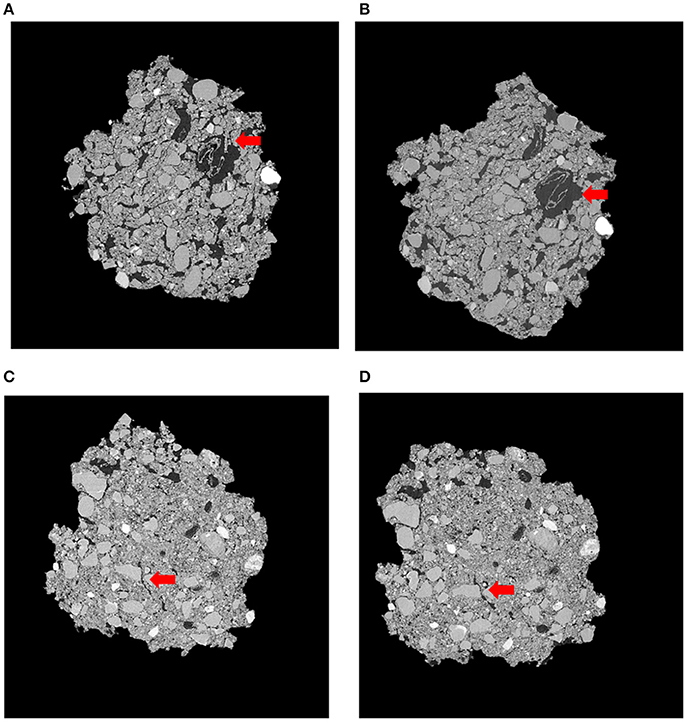
Figure 3. Representative slices of the same soil fragment for Pre-Intact (A), Post-Intact (B), Pre-Destroyed (C), and Post-Destroyed (D). Red arrows highlight an area where porosity visibly increased during incubation. Each soil fragment is approximately 5 mm across.
Associations Between Pores and Chemical Characteristics
In soil from the control treatment there were no significant correlations observed between the two studied carbon characteristics (total C and δ13C) and pore abundances of any of the studied sizes, either before or after incubation. There was also no correlation observed between the two nitrogen characteristics (total N and δ15N) and pore abundances (results not shown).
An interesting pattern emerged in the correlation of δ13C and abundance of pores of different sizes in the Pre destroyed-structure treatment. Correlation with 6.5–15 μm pores was positive, no correlation was observed with 15–40 μm pores, and correlation was negative with 40–90 μm pores (Figure 4, Table 3). This indicates that in the soil from destroyed-structure treatment prior to its incubation, the sections with greater abundance of 6.5–15 μm pores tended to have less C3 carbon while the sections with greater abundance of 40–90 μm tended to have more C3 carbon. Post δ13C was positively correlated with 6.5–15, 15–40, and 40–90 μm pores, indicating that the sections with greater abundance of pores of all three sizes tended to have less C3 carbon after incubation. The trend of negative correlations Pre and positive correlations Post between δ13C and 40–90 μm pores was statistically significant in destroyed-structure soil and numeric in intact-structure soil. In the soil from the intact-structure treatment, δ13C was positively correlated to 6.5–15 and 15–40 μm pores Post.
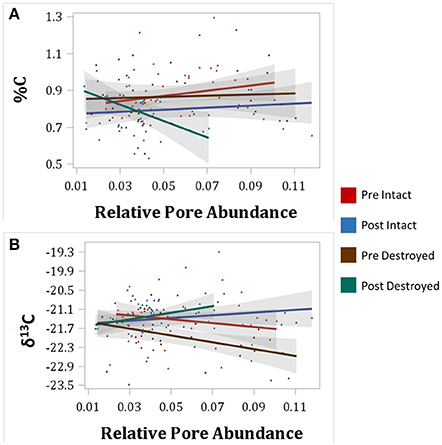
Figure 4. Correlations between total C (%C) and relative abundances of 40–95 μm pores (A) and between δ13C and 40–90 μm pores (B) for intact-structure treatment and destroyed-structure treatment for both Pre and Post. Relative pore abundances refer to the percent of medial axes per total soil volume as determined from 3DMA-Rock software. Gray area indicates 95% confidence interval. Correlation coefficients are shown in Table 3.
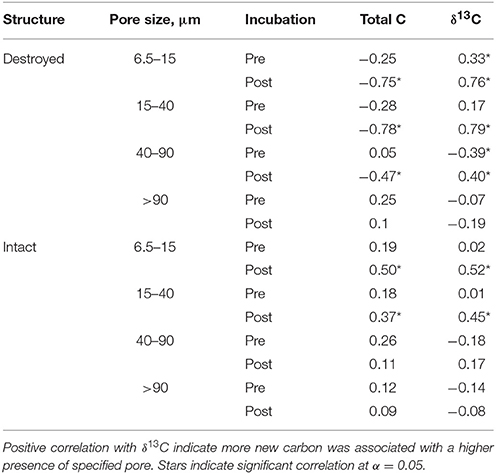
Table 3. Correlation coefficients for Pre and Post soil for total C and δ13C with relative abundances of 6.5–15 μm, 15–40 μm, 40–90 μm, and >90 μm pores for intact and destroyed-structure treatments.
There was no significant correlations between total C and any pore sizes in either intact-structure or destroyed-structure soils Pre (Table 3). In Post intact-structure soil total C was positively correlated with 6.5–15 μm pores and 15–40 μm pores. However, in destroyed-structure soil total C was negatively correlated with these pores.
Incubation CO2
The cumulative amount of CO2 emitted from the soil fragments during the 28-day incubation was the highest in the soil from the intact-structure treatment, followed by the destroyed-structure and control treatments (Figure 5A). The δ13C values of the CO2 emitted during the incubation indicate that microorganisms preferentially used more C3 carbon in the destroyed-structure and intact-structure treatments than in the control, but the difference was only statistically significant on day 28 (Figure 5B).
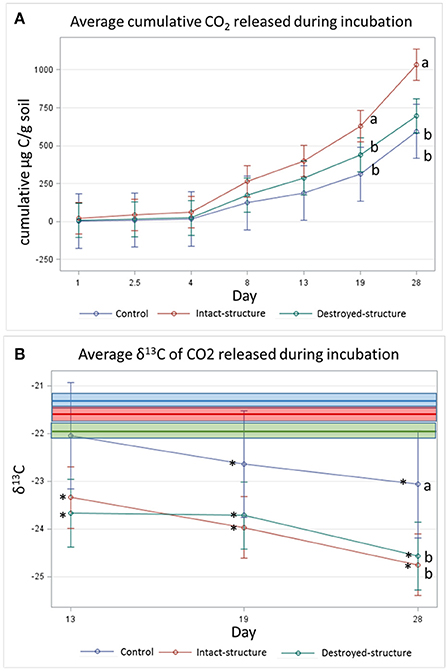
Figure 5. (A) Cumulative CO2 and (B) average isotopic signature of CO2 respired during 28 day incubation experiment. Bars represent standard errors. Bold lines indicate the mean δ13C values of the soil fragment sections prior to incubation for each treatment while boxes indicate the standard errors (−22.0 ± 0.1, −21.4 ± 0.1, and −21.6 ± 0.1%0 for destroyed-structure, intact-structure, and control, respectively). Letters indicate significant differences among treatments at α = 0.05. Stars indicate significant differences between the δ13C of the emitted CO2 and the soil sections Pre at α = 0.05.
The δ13C values of the CO2 emitted during the incubation indicate that during the last three measurements (days 13, 19, and 28), the CO2 gas became more depleted for all three treatments.
Grayscale Gradients
Both intact- and destroyed-structure Pre and Post soils had similar general patterns of very high grayscale values directly adjacent to the pores, followed by a sudden decrease (Figure 6). Then, the grayscale values slowly increased until reaching a plateau at 120–140 μm distances from the pore. The plateau grayscale value roughly corresponded to the background grayscale value. However, the differences in Pre and Post grayscale gradients had opposite signs in the two treatments. In destroyed-structure soil, Pre soils had lower grayscale values than Post at the same distance, while Pre intact-structure soil had higher grayscale values than the Post soil.
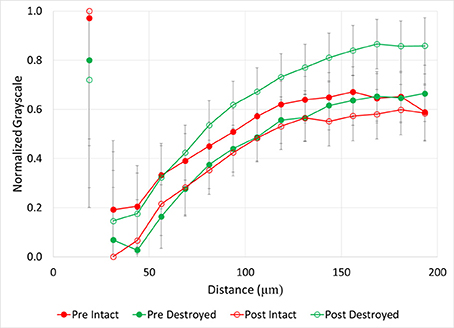
Figure 6. Normalized grayscale values from μCT images of soil fragments as a function of distance from 40 to 90 μm pores for intact-structure and destroyed-structure at Pre and Post. Error bars indicate standard error. Note that values of the normalized grayscale reflect a combination of contributors, including atomic numbers of the elements and density of the material located within an image voxel. Specifically, lower normalized values here correspond to lower atomic number elements and lower densities, while higher values correspond to higher atomic number elements and higher densities. As such, lower values roughly represent more carbon in the soil matrix, while higher values represent less carbon in the soil matrix and/or denser soil matrix.
Canonical Correlations
The first two canonical correlation axes were significant at the 0.05 level (Figure 7). The first canonical variates can be described by the relationship between total C (negatively correlated) and total N (positively correlated) with 6.5–15 μm (negatively correlated) and 15–40 μm (positively correlated) pores. This indicates that pores of 6.5–15 μm were associated with higher C:N ratios while 15–40 μm pores were associated with lower C:N ratios. There was a treatment difference observed in this axis between destroyed-structure and intact-structure soils: the destroyed-structure soil contained more carbon with lower C:N ratios and a higher abundance of 15–40 μm pores than intact-structure soil.
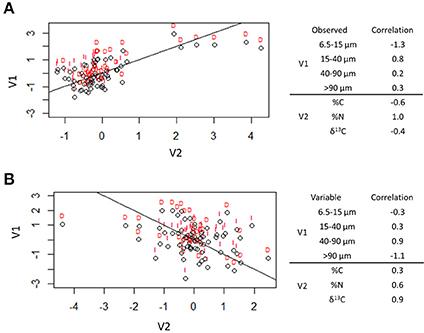
Figure 7. Canonical correlation of pore sizes with total C (%C), total N (%N), and δ13C. The first two canonical correlations were significant at α = 0.05 and are shown. The correlation factors that define the latent variables for each axes are shown on the right. The sign indicates the direction of correlation and the number indicates the amount each observed variable contributes to the latent variable. Lines indicate the (0, 1) line (A) and (0, −1) line (B), while letters indicate treatment [destroyed-structure (D) and intact-structure (I)].
The second canonical variates can be described by the relationship between δ13C (positive correlation) and total N (positive correlation) with 40–90 μm pores (positive correlation) and >90 μm pores (negative correlation). This indicates that 40–90 μm pores tend to have newer carbon with higher nitrogen concentrations, while >90 μm pores tend to have older carbon with lower nitrogen concentrations. There was no effect of treatment observed in the second canonical correlation axis.
Discussion
Three months of rye growth increased total C and the C:N ratio within both the intact-structure and destroyed-structured soils. However, in the subsequent incubation, gains of total C tended to disappear. As indicated by the δ13C results, the carbon losses, at least in the destroyed-structure fragments, were dominated by losses in C3 carbon. Gains and losses of C3 and of total carbon were associated with presence of soil pores. However, the relationships between carbon and pores differed for different pore sizes, suggesting different microscale mechanisms by which these pores contribute to carbon accrual processes.
Relationship Between C3 Carbon and 40–90 μm Pores
The correlations between δ13C and pores of the studied size ranges had similar signs in both intact- and destroyed-structure soils, but in the intact-structure soil, the correlations were not statistically significant (Table 3). This is likely the outcome of the legacy of soil pore architecture of the intact-structure soil, which contributed to greater variability, thus lowering statistical significance in that treatment, as well as differences in decomposability of plant root material in the two treatments (as discussed below).
Negative correlation between δ13C and 40–90 μm pores, indicated that greater levels of C3 were associated with the presence of 40–90 μm pores (Figure 4, Table 3). It is assumed that the increase in C3 carbon is associated with the newly added carbon. We surmise that a possible cause for this association is that many of the 40–90 μm pores, especially those in the destroyed-structure soil, were created by fine plant roots. Since old root pores were destroyed during the sieving process, any 40–90 μm pores in the destroyed-structure soil, which were of root origin, would have been directly produced by the growth of the rye. On the contrary, in the intact-structure treatment such pores could have been produced by both new and historically grown plants, increasing variability that weakened the correlation.
After incubation, the gains in new carbon in the destroyed-structure soil in relation to the abundance of 40–90 μm pores were quickly lost. The 40–90 μm pores went from being positively correlated with new carbon in Pre to being negatively correlated with new carbon in Post. The grayscale gradients in the Post destroyed-structure soil had higher grayscale values than in the Pre (Figure 6). This further supports the notion that, while prior to incubation the SOM levels in the vicinity of such newly formed pores were relatively high, in samples subjected to incubation the SOM levels adjacent to 40–90 μm pores were low.
Greater decomposition of newly added carbon in 40–90 μm pores could result both from a more labile nature of the new carbon and from greater microbial activites in these pores. The second canonical correlation axis (Figure 7) shows that the 40–90 μm pores tend to have newer carbon and a higher concentration of nitrogen, thus possibly, containing more decomposable organic compounds. Indeed, the small plant roots located within such pores could have been more easily decomposable since fine roots tend to have less lignin and a lower lignin:N ratio is an indication of root decomposability (Rasse et al., 2005). Bailey et al. (2017) observed that water extracted from pores between 20 and 200 μm contained more lipids, which are more easily decomposable, than lignin and tannin, which are more difficult to decompose. Moreover, the increased decomposition/carbon loss in such pores was reported as related to greater microbial presence, transport, and activity in 40–90 μm pores (Strong et al., 2004; Wang et al., 2013; Kravchenko et al., 2014).
Some of the differences between the intact- and destroyed-structure treatments in terms of pore associations with new carbon might be related to differences in root decomposability. The intact-structure roots had a higher C:N ratio, as well as δ15N and δ13C (Table 1). The δ15N of plant roots is controlled by the nitrogen use efficiency. Large differences between root and shoot δ15N values can result from pooling of nitrate in plant roots (Kalcsits et al., 2015; Kalcsits and Guy, 2016). The shoot δ15N was 2.08%0 for rye samples collected from both intact-structure and destroyed-structure soils, but, while the intact-structure roots were similar to the shoot values, destroyed-structure roots were ~3%0 more depleted. This suggests that pooling of nitrate could have taken place in the destroyed-structure roots, lowering C:N ratio and increasing decomposability. In addition, more depleted δ13C values of roots from the destroyed-structure soil would make it slightly easier for microorganisms to decompose them than intact-structure roots. The differences in the δ13C of C3 plants are related to water availability with more depleted values occurring where water is more plentiful (Farquhar et al., 1989; Stewart et al., 1995). The differences in overall pore size distributions of the two treatments could be the cause for the differences in nitrate and water availability. However, since the normal range of values for C3 plants is from −24 to −34%0, the difference between intact-structure and destroyed-structure roots observed in this study can be regarded as relatively small.
Relationship Between Carbon and 6.5–15, 15–40, and >90 μm Pores
After incubation, there was a notably decreased association with C3 carbon in both intact-structure and destroyed-structure soil. This implies a preferential utilization of newer carbon in these pores. This preference could be the result of anaerobic conditions that existed within the soil. During incubation, the soil moisture level was kept at 60% water filled porosity, which would have resulted in water filling the majority of both the 6.5–15 and 15–40 μm pores during the incubation, resulting in anaerobic conditions prevailing there during incubation. Keiluweit et al. (2017) observed that in anaerobic microsites within upland soils, decomposition rates were reduced by a factor of 10, which may also explain the slower decomposition of materials from these pores as seen in the association with increased amounts of carbon. The anaerobic conditions may also explain why newer carbon was preferentially used in association with these pores. Newer carbon would likely contain more oxidized functional groups than older carbon. These functional groups would be quickly used under anaerobic conditions, resulting in biased decomposition of newer carbon in relation to pores of 6.5–15 and 15–40 μm sizes.
The association between total C and 15–40 μm pores (Figure 8) was identical to those observed by Ananyeva et al. (2013). The two data sets, while of the same soil type and collected from the same geographic area, were of two completely different agricultural managements. This study is from a 20 year conventional management continuous corn treatment, while Ananyeva et al. (2013) used aggregates from a 19 year native succession management, which was essentially unmanaged. This seems to suggest a universal mechanism for the relationship between soil carbon and the presence of 15–40 μm pores. One possible driver of this relationship might be the presence of fungi in these pores. The first canonical correlation axis (Figure 7), shows a difference in the C:N ratio of the two pore sizes. This potentially could signal a difference in decomposability between 6.5–15 and 15–40 μm pores. Bailey et al. (2017) and Smith et al. (2017) both observed that pores of >6 μm contained more easily decomposable material, while pore < 6 μm contained more difficult to decompose material. They attributed this difference to accessibility of fungi, which preferential decompose more complex organic materials, but, as fungal hyphae are typically 10 μm in size, cannot access pores smaller than 10 μm (Six et al., 2006). Fungi are also known to create pores of 20–30 μm size by pushing aside silt particles and extruding binding agents, which would create micro-environments with more decomposable material in these created pores (Dorioz et al., 1993; Bearden, 2001; Emerson and McGarry, 2003). Another potential explanation might be the presence of root hairs. Root hairs are also 10 μm in size and therefore, would also occur in the 15–40 μm pore range. More research is necessary to explore the cause of this correlation between total C and 15–40 μm pores.
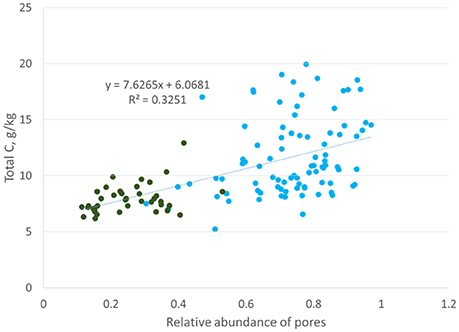
Figure 8. Correlation between total carbon and abundance of 15–37.5 μm pores (Ananyeva et al., 2013, blue reproduced with permission from Elsevier) or 15–40 μm pores (this study, green). The y-axis is presented as total C, g/kg instead of %C to align with the original Ananyeva et al. (2013) graph.
Additional Considerations
The CO2 results seem to indicate a different story than the soil fragment data. In the soil fragment data, destroyed-structure soil lost the most carbon during incubation, while the intact-structure soil losing a negligible amount of carbon during incubation. The CO2 data, on the other hand, indicates that the intact-structure lost the most carbon as CO2. This discrepancy is due to the removal of POM from the soil fragments prior to total C, total N, δ13C, and δ15N measurements. The amount of POM removed from the intact-structure soil was almost twice as large as the amount of POM removed from the destroyed-structure soil. This means that the discrepancy between the CO2 data and soil fragments was most likely due to the difference in the amount of POM.
We recognize that in terms of exploring associations between carbon and soil pores our work is, in essence, an observational study. Thus, it possesses a limitation common to all observational studies, that is, an inability to unequivocally declare cause and effect relationships. Yet, we posit that, at present it is impossible to recreate soil environments with specific pore characteristics for controlled cause-effect determination. Even though creation of artificial soil materials with contrasting pore architecture by either using soil fractions of different sizes or by soil compaction is possible (De Neve and Hofman, 2000; Stenger et al., 2002; Thomson et al., 2010; Sleutel et al., 2012; Negassa et al., 2015) such constructions fail to recreate biological conditions. By biological conditions, we refer to the structure and abundance of resident microbial communities, formed in pores of different sizes in situ and acclimated to specific microenvironments existing there. Since it is microbial activities that largely drive carbon processing, failure to correctly represent them will likely mislead findings. This leaves no alternative, but observational studies, such as this study, to explore the role of pores within soil micro-environments.
Conclusion
Our findings confirm previous results on the importance of pores in tens of microns size range for processing of organic carbon in soil, specifically in regards to fate and distribution of newly added carbon. We demonstrated that pores of 40–90 μm size range play a particularly intriguing role in new carbon gains as well as its subsequent losses. Such pores seem to be “easy come easy go” locations which receive the greatest amounts of new carbon from growing plant roots, but then rapidly loose that newly added carbon. On the other hand, both 6.5–15 and 15–40 μm pores are associated with preferential use of newer carbon. Carbon protection associated with the 6.5–15 μm pores could be associated with lack of accessibility by fungal hyphae and pervasiveness of anaerobic conditions when soils are near field capacity. Pores of 15–40 μm pore size are also associated with a prevalence of anaerobic conditions when soils are above field capacity, but fungal hyphae are not excluded and are potential drivers of carbon dynamics in pores of this size.
Author Contributions
MQ developed concepts, conducted data analyses and wrote the paper. AK contributed to the development of research concepts, research conduct, and writing. WN contributed to the design of the experiment. AG contributed to the development of research concepts. MR contributed to research conduct.
Funding
Support for this research was provided in part by the USDA-NIFA, Award No. 2016-67011-24726 Using stable isotopes and computer tomography to determine mechanisms of soil carbon protection in cover crop based agricultural systems, USDA-NIFA, Award No. 2011-68002-30190 Cropping Systems Coordinated Agricultural Project (CAP): Climate Change, Mitigation, and Adaptation in Corn-based Cropping Systems sustainablecorn.org, and by the US National Science Foundation Long-Term Ecological Research Program (DEB 1027253) at the Kellogg Biological Station and by Michigan State University AgBioResearch. Portions of this work were performed at GeoSoilEnviroCARS (The University of Chicago, Sector 13), Advanced Photon Source (APS), Argonne National Laboratory. GeoSoilEnviroCARS is supported by the National Science Foundation—Earth Sciences (EAR−1634415) and Department of Energy- GeoSciences (DE-FG02-94ER14466). This research used resources of the Advanced Photon Source, a U.S. Department of Energy (DOE) Office of Science User Facility operated for the DOE Office of Science by Argonne National Laboratory under Contract No. DE-AC02-06CH11357. We acknowledge support by the German Research Foundation and the Open Access Publication Funds of the Göttingen University.
Conflict of Interest Statement
The authors declare that the research was conducted in the absence of any commercial or financial relationships that could be construed as a potential conflict of interest.
Acknowledgments
The authors would like to thank Emily McKay for her help in analyze the 3DMA data. Also the three reviewers for their comments and insight.
References
Ananyeva, K., Wang, W., Smucker, A. J. M., Rivers, M. L., and Kravchenko, A. N. (2013). Can intra-aggregate pore structures affect the aggregate's effectiveness in protecting carbon? Soil Biol. Biochem. 57, 868–875. doi: 10.1016/j.soilbio.2012.10.019
Bailey, V. L., Smith, A. P., Tfaily, M., Fansler, S. J., and Bond-Lamberty, B. (2017). Differences in soluble organic carbon chemistry in pore waters sampled from different pore size domains. Soil Biol. Biochem. 107, 133–143. doi: 10.1016/j.soilbio.2016.11.025
Bearden, B. N. (2001). Influence of arbuscular mycorrhizal fungi on soil structure and soil water characteristics of vertisols. Plant Soil 229, 245– 258. doi: 10.1023/A:1004835328943
Bernoux, M., Cerri, C. C., Neill, C., and de Moraes, J. F. L. (1998). The use of stable carbon isotopes for estimating soil organic matter turnover rates. Geoderma 82, 43–58. doi: 10.1016/S0016-7061(97)00096-7
Bowling, D. R., Pataki, D. E., and Randerson, J. T. (2008). Carbon isotopes in terrestrial ecosystem pools and CO2 fluxes. New Phytol. 178, 24–40. doi: 10.1111/j.1469-8137.2007.02342.x
Brimecombe, M. J., de Leij, F., and Lynch, J. M. (2001). “The effect of root exudates on rhizosphere microbial populations,” in The Rhizosphere: Biochemistry and Organic Substances at the Soil-Plant Interface, eds R. Pinton, Z. Varanini and P. Nannipieri (New York, NY: Marcel Dekker), 95–140.
Cannell, R. Q. (1977). Soil aeration and compaction in relation to root growth and soil management. Appl. Biol. 2, 1–86.
Czarnes, S., Hallett, P. D., Bengough, A. G., and Young, I. M. (2000). Root- and microbial-derived mucilages affect soil structure and water transport. Eur. J. Soil Sci. 51, 435–443. doi: 10.1046/j.1365-2389.2000.00327.x
De Gryze, S., Jassogne, L., Six, J., Bossuyt, H., Wevers, M., and Merckx, R. (2006). Pore structure changes during decomposition of fresh residue: X-ray tomography analyses. Geoderma 134, 82–96. doi: 10.1016/j.geoderma.2005.09.002
De Neve, S., and Hofman, G. (2000). Influence of soil compaction on carbon and nitrogen mineralization of soil organic matter and crop residues. Biol. Fertil. Soils 30, 544–549. doi: 10.1007/s003740050034
Derrien, D., and Amelung, W. (2011). Computing the mean residence time of soil carbon fractions using stable isotopes: impacts of the model framework. Eur. J. Soil Sci. 62, 237–252. doi: 10.1111/j.1365-2389.2010.01333.x
Dorioz, J. M., Robert, M., and Chenu, C. (1993). The role of roots, fungi and bacteria on clay particle organization. An experimental approach. Geoderma 56, 179– 194. doi: 10.1016/0016-7061(93)90109-X
Dou, F., Hons, F. M., Wright, A. L., Boutton, T. W., and Yu, X. (2014). Soil carbon sequestration in sorghum cropping systems: evidence from stable isotopes and aggregate-size fractionation. Soil Sci. 179, 68–74. doi: 10.1097/SS.0000000000000045
Dungait, J. A. J., Hopkins, D. W., Gregory, A. S., and Whitmore, A. P. (2012). Soil organic matter turnover is governed by accessibility not recalcitrance. Global Change Biol. 18, 1781–1796. doi: 10.1111/j.1365-2486.2012.02665.x
Ehleringer, J. R., Buchmann, N., and Flanagan, L. B. (2000). Carbon isotope ratios in belowground carbon cycle processes. Ecol. Appl. 10, 412–422. doi: 10.1890/1051-0761(2000)010[0412:CIRIBC]2.0.CO;2
Ekschmitt, K., Kandeler, E., Poll, C., Brune, A., Buscot, F., Friedrich, M., et al. (2008). Soil-carbon preservation through habitat constraints and biological limitations on decomposer activity. J. Plant Nutr. Soil Sci. 171, 27–35. doi: 10.1002/jpln.200700051
Ekschmitt, K., Liu, M., Vetter, S., Fox, O., and Wolters, V. (2005). Strategies used by soil biota to overcome soil organic matter stability – why is dead organic matter left over in soil? Geoderma 128, 167–176. doi: 10.1016/j.geoderma.2004.12.024
Emerson, W. W., and McGarry, D. (2003). Organic carbon and soil porosity. Aust. J. Soil Res. 41, 107–118. doi: 10.1071/SR01064
Farquhar, G. D., Ehleringer, J. R., and Hubick, K. T. (1989). Carbon isotope discrimination and photosynthesis. Annu. Rev. Plant Physiol. Plant Mol. Biol. 40, 503–537. doi: 10.1146/annurev.pp.40.060189.002443
Grandy, A. S., and Robertson, G. P. (2007). Land-use intensity effects on soil organic carbon accumulation rates and mechanisms. Ecosystems 10, 58–73. doi: 10.1007/s10021-006-9010-y
Gray, J., and Lissmann, H. W. (1938). An apparatus for measuring the propulsive forces of the locomotory muscles of the earthworm and other animals. J. Exp. Biol. 15, 518–521.
Greacen, E. L., and Oh, J. S. (1972). Physics of root growth. Nat. New Biol. 235, 24–25. doi: 10.1038/newbio235024a0
Greacen, E. L., and Sands, R. (1980). Compaction of forest soils. A review. Aust. J. Soil Res. 18, 163–189. doi: 10.1071/SR9800163
Jackson, R. B., Lajtha, K., Crow, S. E., Hugelius, G., Kramer, M. G., and Piñeiro, G. (2017). The ecology of soil carbon: pools, vulnerabilities, and biotic and abiotic controls. Annu. Rev. Ecol. Evol. Syst. 48, 419–445. doi: 10.1146/annurev-ecolsys-112414-054234
Kalcsits, L. A., and Guy, R. D. (2016). Variation in fluxes estimated from nitrogen isotope discrimination corresponds with independent measures of nitrogen flux in Populus balsamifera L. Plant Cell Environ. 39, 310–319. doi: 10.1111/pce.12614
Kalcsits, L. A., Min, X., and Guy, R. D. (2015). Interspecific variation in leaf-root differences in δ15N among three tree species grown with either nitrate or ammonium. Trees 29, 1069–1078. doi: 10.1007/s00468-015-1186-3
Keiluweit, M., Wanzek, T., Kleber, M., Nico, P., and Fendorf, S. (2017). Anaerobic microsites have an unaccounted role in soil carbon stabilization. Nat. Commun. 8:1771. doi: 10.1038/s41467-017-01406-6
Kell, D. B. (2012). Large-scale sequestration of atmospheric carbon via plant roots in natural and agricultural ecosystems: why and how. Philos. Trans. R. Soc. B 367, 1589–1597. doi: 10.1098/rstb.2011.0244
Kravchenko, A. N., and Guber, A. K. (2017). Soil pores and their contributions to soil carbon processes. Geoderma 287, 31–39. doi: 10.1016/j.geoderma.2016.06.027
Kravchenko, A. N., Negassa, W. C., Guber, A. K., Hildebrandt, B., Marsh, T. L., and Rivers, M. L. (2014). Intra-aggregate pore structure influences phylogenetic composition of bacterial community in macroaggregates. Soil Sci. Soc. Am. J. 78, 1924–1939. doi: 10.2136/sssaj2014.07.0308
Kravchenko, A. N., Negassa, W. C., Guber, A. K., and Rivers, M. L. (2015). Protection of soil carbon within macro-aggregates depends on intra-aggregate pore characteristics. Sci. Rep. 5:16261. doi: 10.1038/srep16261
Kuzyakov, Y., and Blagodatskaya, E. (2015). Microbial hotspots and hot moments in soil: concept & review. Soil Biol. Biochem. 83, 184–199. doi: 10.1016/j.soilbio.2015.01.025
Lal, R. (1999). Soil management and restoration for carbon sequestration to mitigate the accelerated greenhouse effect. Prog. Env. Sci. 1, 307–326.
Lindquist, W. B., Venkatarangan, A., Dunsmuir, J., and Wong, T. (2000). Pore and throat size distributions measured from synchrotron X-ray tomographic images of Fontainebleau sandstornes. J. Geophys. Res. 105, 21509–21527. doi: 10.1029/2000JB900208
Marshall, T. J., Holmes, J. W., and Rose, C. W. (1996). Soil Physics, 3rd Edn. Cambridge: Cambridge University Press.
Milliken, G. A., and Johnson, D. E. (2009). Analysis of Messy Data Volume I: Designed Experiments, 2nd Edn. Boca Raton, FL: CRC Press.
Negassa, W. C., Guber, A. K., Kravchenko, A. N., Marsh, T. L., Hildebrandt, B., and Rivers, M. L. (2015). Properties of soil pore space regulate pathways of plant residue decomposition and community structure of associated bacteria. PLoS ONE 10:e0123999 doi: 10.1371/journal.pone.0123999
Neumann, G., Bott, S., Ohler, M. A., Mock, H.-P., Lippmann, R. R., Grosch, et al. (2014). Root exudation and root development of lettuce (Lactuca sativa L. cv. Tizian) as affected by different soils. Front. Microbol. 5:2. doi: 10.3389/fmicb.2014.00002
Oh, W., and Lindquist, W. B. (1999). Image thresholding by indicator kriging. IEEE Trans. Pattern Anal. Mach. Intell. 21, 590–602. doi: 10.1109/34.777370
Peth, S., Chenu, C., Leblond, N., Mordhorst, A., Garnier, P., Nunan, N., et al. (2014). Localization of soil organic matter in soil aggregates using synchrotron-base X-ray microtomography. Soil Biol. Biochem. 78, 189–194. doi: 10.1016/j.soilbio.2014.07.024
Quigley, M. Y., Rivers, M. L., and Kravchenko, A. N. (2018). Patterns and sources of spatial heterogeneity in soil matrix from contrasting long term management practices. Front. Environ. Sci. 6:28. doi: 10.3389/fenvs.2018.00028
Rabot, E., Wiesmeier, M., Schlüter, S., and Vogel, H.-J. (2018). Soil structure as an indicator of soil functions: a review. Geoderma 314, 122–137. doi: 10.1016/j.geoderma.2017.11.009
Rasse, D. P., Rumpel, C., and Dignac, M.-F. (2005). Is soil carbon mostly root carbon? Mechanisms for a specific stablisation. Plant Soil 269, 341–356. doi: 10.1007/s11104-004-0907-y
Rawlins, B. G., Wragg, J., Reinhard, C., Atwood, R. C., Houston, A., Lark, R. M., et al. (2016). Three-dimensional soil organic matter distribution, accessibility and microbial respiration in macroaggregates using osmium staining and synchrotron X-ray computed tomography. Soil 2, 659–671. doi: 10.5194/soil-2-659-2016
R Core Team (2013). R: A Language and Environment for Statistical Computing. Vienna: R Foundation for Statistical Computing. Available online at: http://www.R-project.org/
Rivers, M. L. (2012). “tomoRecon: High-speed tomography reconstruction on workstations using multi-threading,” in Proceedings of SPIE - The International Society for Optical Engineering (San Diego, CA), 8506:85060U.
Ruiz, S., Schymanski, S. J., and Or, D. (2017). Mechanics and energetics of soil penetration by earthworms and plant roots: higher rates cost more. Vadose Zone J. 16:8. doi: 10.2136/vzj2017.01.0021
Schmidt, M. W., Torn, M. S., Abiven, S., Dittmar, T., Guggenberger, G., Janssens, I. A., et al. (2011). Persistence of soil organic matter as an ecosystem property. Nature 478, 49–56. doi: 10.1038/nature10386
Six, J., Elliott, E. T., and Paustian, K. (2000). Soil macroaggregate turnover and microaggregate formation: a mechanism for C sequestration under no-tillage agriculture. Soil Biol. Biochem. 32, 2099–2103. doi: 10.1016/S0038-0717(00)00179-6
Six, J., Frey, S. D., Thiet, R. K., and Batten, K. M. (2006). Bacterial and fungal contributions to carbon sequestration in agroecosystems. Soil Sci. Soc. Am. J. 70, 555–569. doi: 10.2136/sssaj2004.0347
Sleutel, S., Bouckaert, L., Buchan, D., Van Loo, D., Cornelis, W. M., and Sanga, H. G. (2012). Manipulation of the soil pore and microbial community structure in soil mesocosm incubation studies. Soil Biol. Biochem. 45, 40–48. doi: 10.1016/j.soilbio.2011.09.016
Smith, A. P., Bond-Lamberty, B., Benscoter, B. W., Tfaily, M. M., Hinkle, C. R., Liu, C., et al. (2017). Shifts in pore connectivity from precipitation versus groundwater rewetting increases soil carbon loss after drought. Nat. Commun. 8:1335. doi: 10.1038/s41467-017-01320-x
Smucker, A. J. M., Park, E.-J., Dorner, J., and Horn, R. (2007). Soil micropore development and contributions to soluble carbon transport within macroaggregates. Vadose Zone J. 6, 282–290. doi: 10.2136/vzj2007.0031
Stenger, R., Barkle, G. F., and Burgess, C. P. (2002). Mineralisation of organic matter in intact versus sieved/refilled soil cores. Aust. J. Soil Res. 40, 149–160. doi: 10.1071/SR01003
Stewart, G. R., Turnbull, M. H., Schmidt, S., and Erskine, P. D. (1995). 13C natural abundance in plant communities along a rainfall gradient: a biological integrator of water availability. Aust. J. Plant Physiol. 22, 51–55. doi: 10.1071/PP9950051
Strong, D. T., De Wever, H., Merckx, R., and Recous, S. (2004). Spatial location of carbon decomposition in the soil pore system. Eur. J. Soil Sci. 55, 739–750. doi: 10.1111/j.1365-2389.2004.00639.x
Swift, R. S. (2001). Sequestration of carbon by soil. Soil Sci. 166, 858–871. doi: 10.1097/00010694-200111000-00010
Thomson, B. C., Ostle, N. J., McNamara, N. P., Whiteley, A. S., and Griffiths, R. I. (2010). Effects of sieving, drying and rewetting upon soil bacterial community structure and respiration rates. J. Microbiol. Methods 83, 69–73. doi: 10.1016/j.mimet.2010.07.021
Tiemann, L. K., and Grandy, A. S. (2015). Mechanisms of soil carbon accrual and storage in bioenergy cropping systems. Glob. Change Biol. Bioenergy 7, 161–174. doi: 10.1111/gcbb.12126
Urbanek, E., Smucker, A. J. M., and Horn, R. (2011). Total and fresh organic carbon distribution in aggregate size classes and single aggregate regions using natural 13C/12C tracer. Geoderma 164, 164–171. doi: 10.1016/j.geoderma.2011.05.020
Wang, W., Kravchenko, A. N., Johnson, T., Srinivasan, S., Ananyeva, K. A., Smucker, A. J. M., et al. (2013). Intra-aggregate pore structures and Escherichia coli distribution by water flow within and movement out of soil macroaggregates. Vadose Zone J. 12:4. doi: 10.2136/vzj2013.01.0012
Wang, W., Kravchenko, A. N., Smucker, A. J. M., Liang, W., and Rivers, M. L. (2012). Intra-aggregate pore characteristics: X-ray computed microtomography analysis. Soil Sci. Soc. Am. J. 76, 1159–1171. doi: 10.2136/sssaj2011.0281
Wang, W., Kravchenko, A. N., Smucker, A. J. M., and Rivers, M. L. (2011). Comparison of image segmentation methods in simulated 2D and 3D microtomographic images of soil aggregates. Geoderma 162, 231–241. doi: 10.1016/j.geoderma.2011.01.006
Wiersum, L. K. (1957). The relationship of the size and structural rigidity of pores to their penetration by roots. Plant Soil 9, 75–85. doi: 10.1007/BF01343483
Young, I. M., and Crawford, J. W. (2004). Interactions and self-organization in the soil-microbe complex. Science 304, 1634–1637. doi: 10.1126/science.1097394
Keywords: computed microtomography, soil carbon dynamics, soil organic matter, soil structure, stable carbon isotopes
Citation: Quigley MY, Negassa WC, Guber AK, Rivers ML and Kravchenko AN (2018) Influence of Pore Characteristics on the Fate and Distribution of Newly Added Carbon. Front. Environ. Sci. 6:51. doi: 10.3389/fenvs.2018.00051
Received: 08 March 2018; Accepted: 23 May 2018;
Published: 13 June 2018.
Edited by:
Maria Luz Cayuela, Centro de Edafología y Biología Aplicada del Segura (CEBAS), SpainReviewed by:
Ana Maria Tarquis, Universidad Politécnica de Madrid (UPM), SpainBalwant Singh, University of Sydney, Australia
Steffen Schlüter, Helmholtz-Zentrum für Umweltforschung (UFZ), Germany
Copyright © 2018 Quigley, Negassa, Guber, Rivers and Kravchenko. This is an open-access article distributed under the terms of the Creative Commons Attribution License (CC BY). The use, distribution or reproduction in other forums is permitted, provided the original author(s) and the copyright owner are credited and that the original publication in this journal is cited, in accordance with accepted academic practice. No use, distribution or reproduction is permitted which does not comply with these terms.
*Correspondence: Michelle Y. Quigley, bXlxdWlnbGV5QGdtYWlsLmNvbQ==