 Takeshi Ise
 Shigeki Ikeda3
 Shuntaro Watanabe
 Kazuhito Ichii
- 1Field Science Education and Research Center, Kyoto University, Kyoto, Japan
- 2PRESTO, Japan Science and Technology Agency, Tokyo, Japan
- 3Graduate School of Agriculture, Kyoto University, Kyoto, Japan
- 4Center for Environmental Remote Sensing, Chiba University, Chiba, Japan
- 5Center for Global Environmental Research, National Institute for Environmental Studies, Tsukuba, Japan
Model optimization using data assimilation is an effective tool for reliable projections of environmental changes. To date, however, data assimilation has not been widely applied for terrestrial ecosystem models, especially in large-scale studies, owing to specific difficulties including heterogeneity and abruptness in terrestrial processes. To overcome the difficulties arising from the complex and abrupt behavior of the terrestrial ecosystem model, the data assimilation by particle filter, a non-parametric and computationally intensive parameter optimization method, was applied in this study. We simultaneously optimized nine model parameters of a terrestrial ecosystem model with a satellite-based leaf area index. The optimized model successfully reproduced the leaf onset and offset phenology of temperate deciduous forests in mainland Japan. We formulated the relationship between local climate and leaf onset and offset timings which indicates that warmer temperatures were required for leaf onset in the warmer southern parts of Japan, and the northern forests retained their leaves under much colder temperatures, relative to southern forests. Unlike the findings of conventional phenology models using crude estimation with limited local data, the results of this study were based on regional big data and objective optimization. This research thus shows that data assimilation can be used to optimize complex terrestrial ecosystem models.
Introduction
Terrestrial ecosystems play an important role in the earth system and thus influence the global climate (Heimann and Reichstein, 2008; Arneth et al., 2010). The terrestrial biosphere is characterized by a two-way feedback process with climate: climatic conditions affect the biosphere, and the biosphere in turn affects the climate by way of biogeochemical and biophysical changes on land surfaces (Arneth et al., 2010). This feedback process is believed to be significant because of terrestrial surface sizes and biogeochemical budgets.
In deciduous forests, in particular, leaf phenological cycles (i.e., leaf onset and offset) delimit the plant growing season and thus have a large impact on terrestrial ecosystems (Richardson et al., 2013). In addition, changes in land surface albedo due to leaf phenology affect the regional climate through biophysical changes (Peñuelas et al., 2009). The annual cycle of spring leaf onset and fall senescence in temperate deciduous forests is controlled by plant traits, in addition to climatic conditions such as air temperature (White et al., 1997). Phenology also varies from species to species with large inter-annual and spatial variations (Richardson et al., 2010). Variation in leaf phenology reflect an evolutionary strategy that maximizes the long-term ecological fitness of a phenotype under a given climate (Bennie et al., 2010). Thus, understanding how phenological cycles react to climate change is important for decreasing the uncertainty in projections of the terrestrial carbon cycle (Richardson et al., 2012) and elucidating the behaviors of ecosystem dynamics under climate change.
Although simulation of terrestrial ecosystems is critical for making projections on the future climate, the uncertainties in terrestrial ecosystem models remain considerable, especially in phenology (Richardson et al., 2012; Murray-Tortarolo et al., 2013). Since phenological cycles have high inter-annual variability, phenological parameters obtained by short-term geographically limited data have limited utility in predicting future phenological cycles (Richardson et al., 2012). Thus, accurate prediction of phenology requires a method that effectively summarizes observations in large scales in both space and time.
Various phenology models (e.g., Cannell and Smith, 1983; Murray et al., 1989; Hanninen, 1990; Kramer, 1994; Chuine, 2000; reviewed by Chuine et al., 2003), have been proposed and incorporated into terrestrial ecosystem models (Botta et al., 2000; Sitch et al., 2003; Arora and Boer, 2004; Krinner et al., 2005). However, direct measurements of phenological parameters are rarely possible (Chuine et al., 2003), and a recent study reported that current models of vegetation phenology contain considerable uncertainties and consequently caused large biases in the estimation of ecosystem carbon balances (Richardson et al., 2012).
To this end, data assimilation (DA), which incorporates observation data into models in a systematic manner, has been applied to phenology model in the terrestrial ecosystem models, and uncertainties in the state variables and model parameters have been partially reduced (Viskari et al., 2015; Arakida et al., 2017). In recent years, DA has been used in many fields of ecological research (reviewed by Luo et al., 2011), including palaeology (Peng et al., 2011), ecosystem ecology (Xiao and Friedrichs, 2014; Arakida et al., 2017) and community ecology (Massoud et al., 2018).
Nevertheless, DA applications for terrestrial ecosystem models are not currently sufficient because of characteristics of terrestrial ecosystems. Terrestrial ecosystem models are highly nonlinear and driven by abrupt events, such as leaf onset/offset, mortality, and reproduction, which are difficult to mathematically handle in conventional DA methods. For instance, using the ensemble Kalman filter, Williams et al. (2005) applied DA to a terrestrial ecosystem model. However, the model is a so-called “big leaf model” that does not account for abrupt behavior. Moreover, to date, DA applications to terrestrial ecosystem models are mainly limited to specific sites because large-scale DA applications require a considerable amount of computational resources. In addition, despite the increasing abundance of remotely sensed data, significant uncertainties remain that are associated with predicting changing leaf phenology and the resulting ecological consequences under future climate changes (Polgar and Primack, 2011).
In this study, we applied DA to a terrestrial ecosystem model for a large spatial scale using a particle filter (PF). Unlike conventional DA methods such as the Kalman filter, PF is a non-parametric approach with the flexibility of optimizing models with abrupt ecological behaviors. Using DA and satellite observations of the leaf area index (LAI), we formulated a new phenology model in an objective manner. Our study is the first DA approach for a regional-scale terrestrial ecosystem model with abrupt behavior.
The following aspects have been discussed in this paper: (1) optimizing the phenology parameters in the terrestrial ecosystem model using DA, (2) investigating the geographic variation of phenology parameters on a regional scale, and (3) revealing intra- and interspecific variations of the regional phenological differences. Because this approach using DA is novel, we intentionally utilized a simple model optimization system in order to highlight the performance and robustness of DA.
Methods
Study Area
This regional simulation study was conducted on the four main islands of Japan (approximately 30–50 N; 125–150 E). In this region, there are 600 × 750 grids (ca. 3-km spatial resolution). Among them, our target grids, covered by >30% deciduous forests, were 13,739.
The Target Model for Optimization
In this study, we employed the Super-Simple Stochastic Ecosystem Model (SSSEM) framework (Dietze, 2017), a simple terrestrial ecosystem model (Figure 1). SSSEM was chosen for this study because it has a built-in DA system using a particle filter, and its simplicity was desirable for this computer-intensive experiment on a regional scale. SSSEM simulates the basic carbon stock and flow of the terrestrial ecosystem and estimates the related amount of gross primary production, autotrophic respiration, and net primary production. The amount of net primary production (NPP) is partitioned into plant active and structural tissue pools with specific turnover rates. The model thereby calculates the basic C stock and flow of an ecosystem. These ecophysiological dynamics are calculated every 30 min.
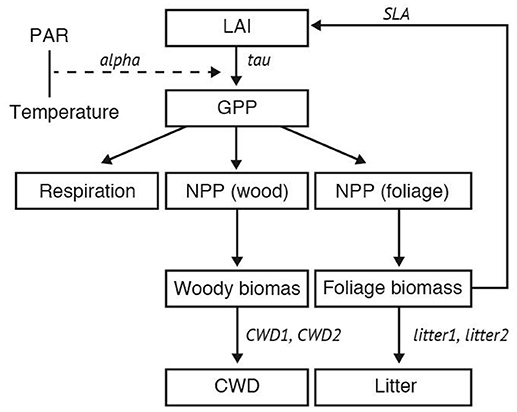
Figure 1. Schematic diagram of SSSEM. Parameters for optimization were listed in Table 1.
However, the original SSSEM is unable to reproduce deciduousness. We thus added a leaf onset and offset phenology to the model. For leaf onset, we used the relationship between the growing degree day (GDD) and the leaf flush progress (Murray et al., 1989). The leaf onset coefficient (Conset) is calculated by the following relationship:
where Tday is the daily mean temperature, Tonset represents the base temperature for GDD summation for leaf onset. This is a threshold value for GDD summation. GDDmax denotes the accumulated temperature required for the complete leaf onset. Following a previous study (Sitch et al., 2003), we set GDDmax to 200 in our target area.
Then, the leaf area index (LAI) is calculated by the following relationship:
where Bleaf is the leaf biomass (kg m−2), SLA is the specific leaf area (m2 kg−1) and Conset is the leaf onset coefficient (dimensionless). In this model, LAI represents canopy level green leaf area per unit ground surface area (a 3-km spatial resolution). To illustrate the leaf fall phenology, we assume that leaf fall starts when the 7-day mean temperature falls below a threshold, and leaf fall is completed after 14 days from the start. In this model, we set the leaf fall coefficient (Cfall), defined by the following equations.
where Dayschilling represents the number of days that have passed after the 7-day running mean temperature (Tweek) falls below the threshold (Toffset). Daysoffset denotes the days required for the leaves to completely fall from the tree after experiencing a low temperature below Toffset. In this model, we assume Daysoffset is 14.
In this DA experiment, we identified and analyzed phenology parameters Tonset and Toffset, which are simultaneously optimized with other parameters (Table 1). Historically, these parameters have often been set based on local observations without quantitative validation in large scale (Richardson et al., 2012). Our aim was to determine objective values that can be widely applied.
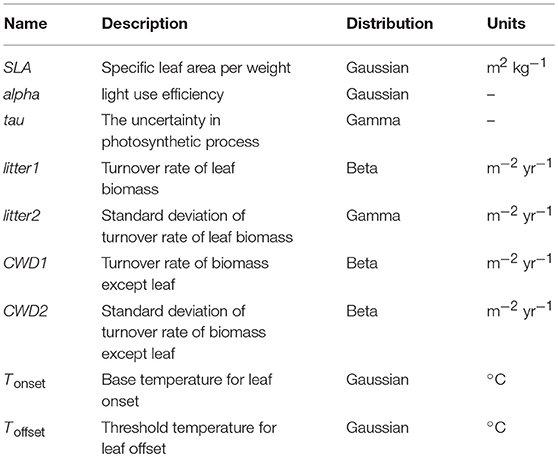
Table 1. List of parameters used in SSSEM.
Model Input Data
The mean daily temperature data of this resolution were obtained from the Japanese Automated Meteorological Data Acquisition System (AMeDAS) climate data network based on linear interpolation with elevation correction that assumes a lapse rate of 0.0065 km−1 (Ichii et al., 2010). Photosynthetically active radiation (PAR) is estimated from surface shortwave radiation data (Ichii et al., 2010). Extraterrestrial solar radiation is geometrically calculated from the latitude of the given grid. We estimated the attenuation rate from cloudiness data and then converted the shortwave radiation into PAR (Sato et al., 2007).
We used both Aqua and Terra Moderate Resolution Imaging Spectroradiometer (MODIS; MCD15A2) global LAI (Myneni et al., 2002) from 2003 to 2006, which were provided by the United States Geological Survey (Land Processes Distributed Active Archive Center) in a 1-km spatial resolution and 8-day composite frequency. The LAI data were re-projected onto the geographic coordinate system and converted into a 3-km spatial grid. Despite application of a quality check; somewhat questionable data remained (see Figure 2).
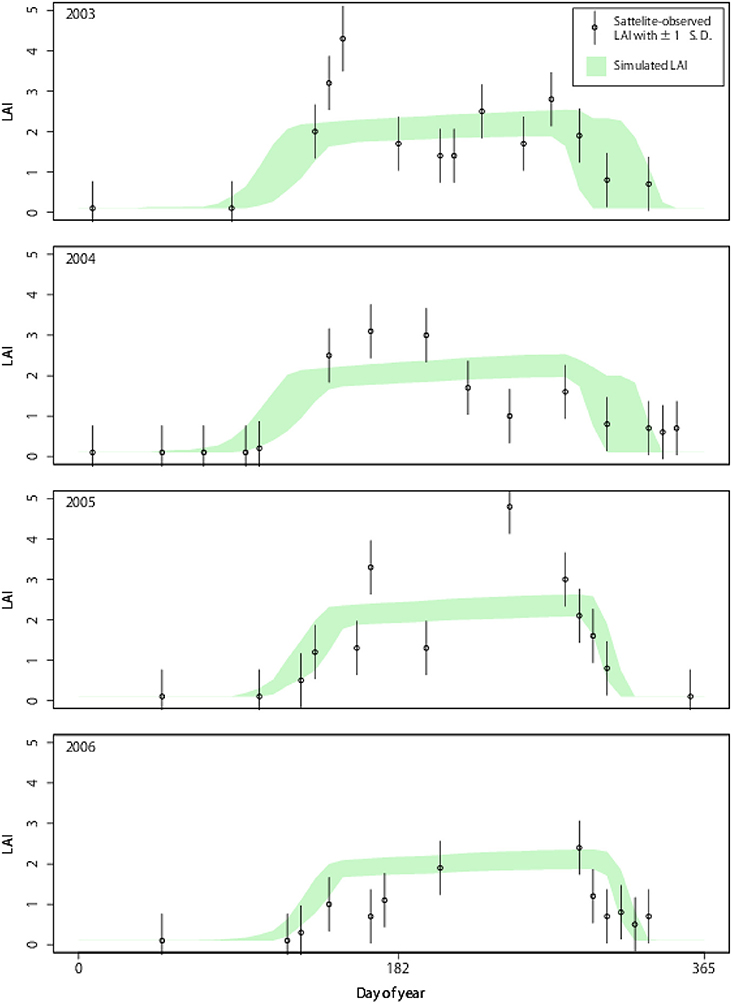
Figure 2. Point simulation for LAI dynamics from 2003 to 2006 in mid-eastern Japan (36.933 N; 139.066 E). Simulated LAI shows the 5th to 95th percentile range of the 5,000 simulation particles.
To extract the broadleaf deciduous forests from the Japanese main islands, we used the vector data of a Japanese vegetation map obtained from the National Surveys on the Natural Environment (Biodiversity Centre of Japan, 1999). We converted the vegetation map vector data into raster data of a 100-m spatial resolution. Then, we calculated the percentages of deciduous tree areas in each grid and extracted grid cells having a broadleaf deciduous tree coverage of more than 30%.
Data Assimilation
We adopted the particle filter approach known as sequential importance resampling (Gordon et al., 1993). This approach runs numerous independent parallel simulations, or particles, to optimize the target parameter set. Each particle has a likelihood weight assigned to it that represents the probability of that particle being sampled from the probability density function. These particles are propagated through the system dynamics, and their weights are sequentially updated based on the likelihood of the observed data. By using this method, we were able to optimize nine parameters of this model simultaneously (Table 1).
In this study, the number of particles was set to 5,000. For each particle, a randomly generated value was set from the probability density distribution of each SSSEM parameter. After setting the initial value, a simulation was executed every 0.5 h for each particle. Then, at the point when the observation value of LAI was produced (every 8 days), the likelihood of each particle with respect to the observation value was calculated using the Gaussian likelihood function:
where is a likelihood of the ith particle at time t, denotes the simulated LAI of the ith particle at time t from the previous time step t−1, yt represents the observed LAI at time t, and σ is the standard deviation of the observed LAI. Random sampling based on the value of as the extraction probability was performed 5,000 times. The particles with a high likelihood (i.e., large ) were selected for resampling, and those with a low probability (i.e., small ) were removed.
Statistical Analysis
To investigate dependencies of Tonset and Toffset on local climatic conditions, we conducted linear regression analysis. Additionally, we analyzed the optimized phenology parameters separating several broadleaf deciduous species to address whether the temperature dependency of phenology parameters reflects (1) a difference in the distribution range among the species, or (2) intraspecific phenological differences. First, we selected four dominant deciduous tree species (Fagus crenata, Quercus crispula, Quercus serrata, and Quercus acutissima) from the Japanese Archipelago. We extracted the grid dominated by more than 90% of these tree species using data of the National Surveys on the Natural Environment (Biodiversity Centre of Japan, 1999). Second, we conducted regression analysis for each species to investigate the relationship between Tonset or Toffset and the mean annual temperature. Third, we performed analyses of covariance (ANCOVA) to compare regression slopes between species with the mean annual temperature for Tonset or Toffset. Analyses were conducted using R 3.2.4 (R Development Core Team, 2015).
Results
To verify the system performance, we applied DA to a grid in the mid-eastern region of Japan with 100% coverage of broadleaf deciduous forests. In this point experiment, the DA system effectively incorporated the satellite observation and the resultant state variable, LAI, which well matched the observation (Figure 2). While the estimated LAI without DA had broad ranges (gray shades), the LAI optimized by DA was converged (green shades), and the range became narrower gradually throughout the 4 years. The optimized model effectively reproduced the timings of leaf onset and offset. The simulated dynamics of LAI were robust against somewhat questionable data (e.g., near-zero LAI in mid-summer likely due to cloud coverage and an ineffective quality check). Robustness is a desirable characteristic of a mechanistic model and DA. If “normal” observations occurred after an irregular one, the DA system effectively penalized unrealistic observations, such as near-zero LAI in mid-summer.
In this local experiment, nine model parameters were simultaneously optimized by DA. For parameters of the phenology control (Tonset and Toffset) after DA, the distributions of parameters became narrower, showing that parameters were adjusted for optimal estimations (Figure 3).
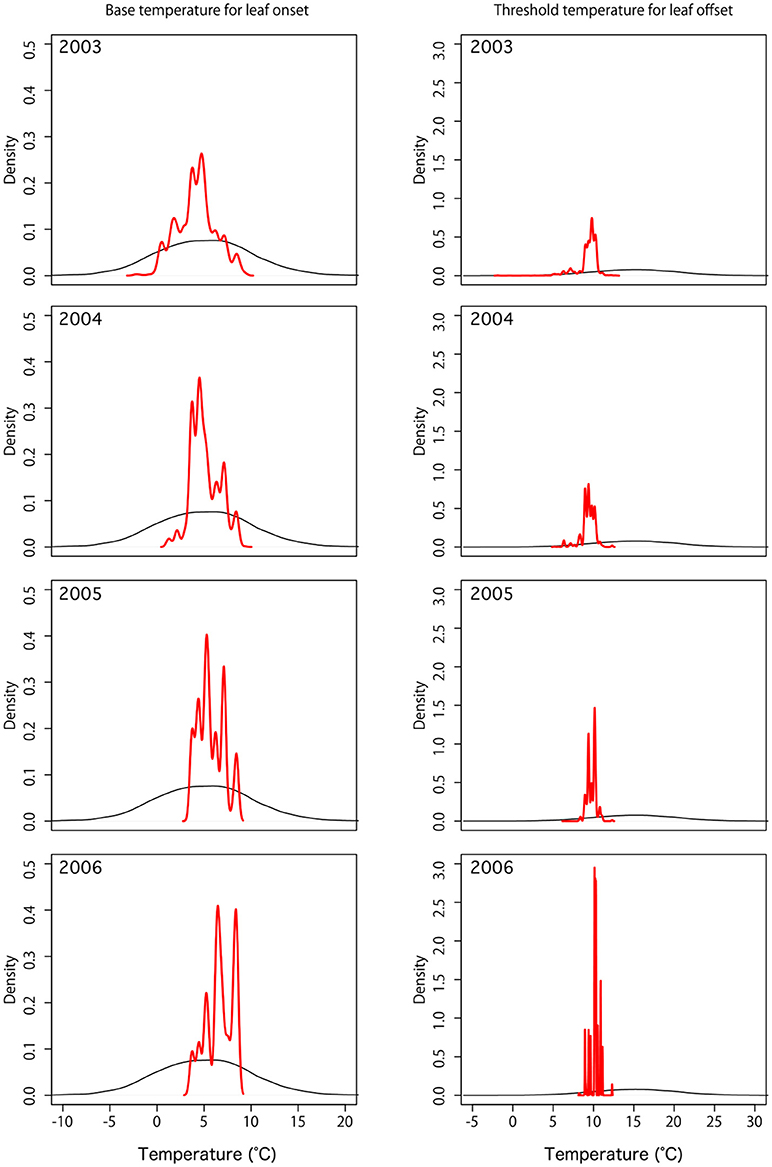
Figure 3. Probability distribution of default (black) and optimized (red) phenology parameters: base temperature for leaf onset (Tonset) and threshold temperature for leaf offset (Toffset).
The parameter distributions showed gradual convergence during the simulation years of 2003 to 2006, showing the effectiveness of DA. For full parameter estimations, see Supplementary Figure 1.
Next, for regional simulation, we estimated the optimal phenological parameters Tonset and Toffset for each grid cell spanning the main islands of Japan. The results showed a general pattern of the phenological parameters (Figure 4). In the southern region, warmer temperature is generally required for leaf onset compared to the northern forests. Similarly, in the southern region, forests tend to drop leaves with mildly cold temperatures, whereas northern forests tend to retain leaves despite the cold. These general patterns are statistically significant (Figure 5: two-dimensional plots of (a) Tonset, and (b) Toffset against the mean annual temperature). We constructed the following new model:
where Tyear is the mean annual temperature. With DA, we found a significant temperature dependency of phenology parameters, which suggests plant physiological adaptations to the environmental gradient (i.e., temperature). This finding overrides conventional phenological models (e.g., reviewed by Chuine et al., 2003) that are based on limited data.
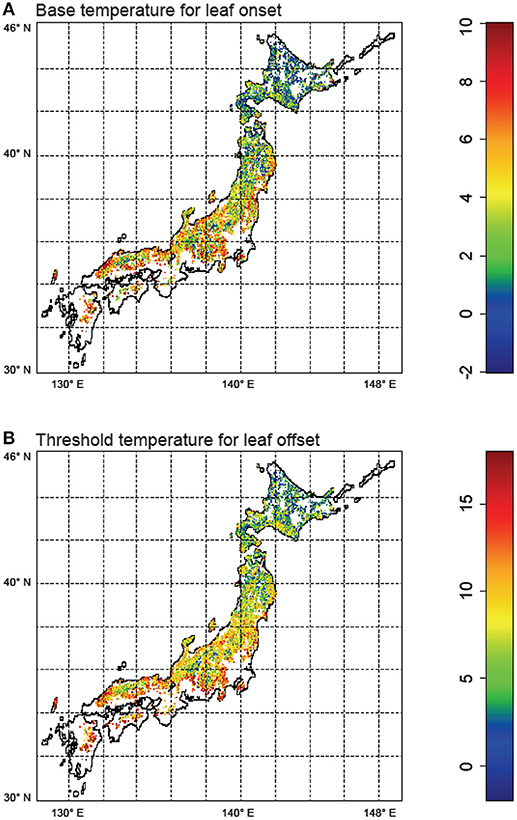
Figure 4. Results of data assimilation using the particle filter for Japanese broadleaf deciduous forests. (A) Optimized base temperature (°C) for leaf onset (Tonset), and (B) Optimized threshold temperature (°C) for leaf offset (Toffset). The maps were created by R 3.2.4 software.
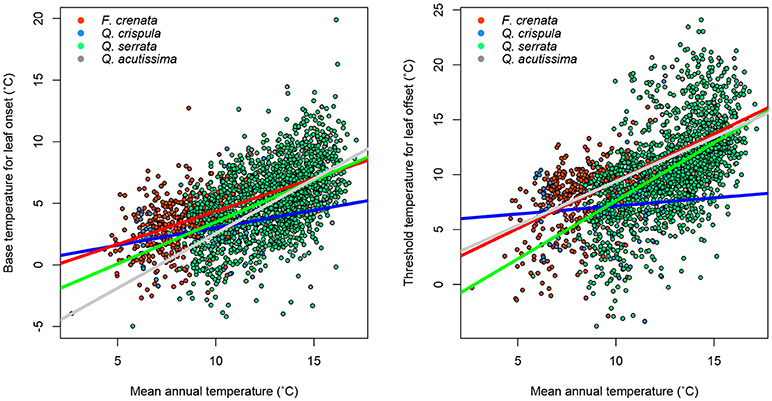
Figure 5. Relationship between mean annual temperature and phenology parameters. The color of dots and lines corresponds to each species. Regression statistics are shown in Supplementary Table 1.
Intra- and Inter-Specific Variations of Phenology Parameters
We identified a difference in the species distribution range according to the temperature gradient. In the cool temperate area, cold temperate species, such as F. crenata and Q. crispula, dominated the ecosystem, whereas Q. serrata and Q. acutissima were predominantly distributed in the warm temperate area (Figure 4). In general, cold temperate species had lower Tonset and Toffset. This indicated that the temperature dependency in phenology reflected the species distribution difference. Thus, the relationships in Equations (6) and (7) are partly due to the interspecific variation in phenology.
For each species, we performed regression analysis to find intraspecific variations in the environmental gradient (i.e., mean annual temperature). Significant correlations between the mean annual temperature and both Tonset and Toffset for most of the species were identified (Figure 5, Supplementary Table 1). This result indicates that the variation in phenology is partly intraspecific; that is, individuals growing in a cold environment tend to show lower Tonset and Toffset than individuals of the same species growing in a warm environment. This is likely due to adaptation to the environment. Interestingly, for Q. crispula, the temperature dependency of the phenology parameter was weak, especially for the leaf offset parameter (Supplementary Table 2), suggesting that the phenological adaptation is different among species. In summary, we found both intra- and interspecific variations in phenology.
Discussion
In this study, we clearly showed that data assimilation (DA) using a particle filter (PF) can be applied to terrestrial ecosystem models with abrupt changes. By means of this computational and statistical breakthrough concerning DA and PF, better phenology models based on satellite-based big data are now possible. In our model, simulated LAI successfully converged to reasonable ranges according to observation, and uncertainties in estimated parameters were reduced over four simulation years. Our results suggest that DA is useful to understand and reproduce the ecological dynamics such as phenology. This is particularly meaningful because, during the past few decades, increasingly large number of ecological data have become available thanks to advances in measurement techniques.
To date, numerous phenology models have been proposed (Cannell and Smith, 1983; Murray et al., 1989; Hanninen, 1990; Kramer, 1994; Chuine, 2000), and some studies calibrated phenology models using ground-based phenological records and then extended the model to regional scale (Schwartz et al., 2006; Yang et al., 2012; Jeong et al., 2013). However, unclear mechanisms underlying the leaf-out process still exists, and thus, linking species level physiological responses to an ecosystem process is still difficult (Liu et al., 2018). DA would be a promising tool to overcome such difficulties because this method can objectively optimize model parameters using satellite-based big data.
Improvements in phenology models can help terrestrial ecosystem models project effects of climate change, because it is anticipated that the climate change will disrupt phenological dynamics (Richardson et al., 2012). The change in phenology will have immense impacts on ecosystem dynamics. It can change carbon balances of vegetation and soil organic matter. These biogeochemical changes can in turn affect the atmospheric carbon balance (Peñuelas et al., 2009; Richardson et al., 2013). We employed PF as the method for DA because this computational technique can explicitly optimize a model with abrupt changes. This can particularly informative when the model is concerning global changes because, other than phenological changes, terrestrial ecosystems can experience abrupt changes in gap dynamics, succession, and species composition under the climate change (Luo et al., 2011).
Our result also suggests that DA contributes to optimize the model parameters with considerations for spatial and temporal heterogeneity. A major difficulty encountered in phenology models is that the parameters often have several local optima and identifying a global optimum is non-trivial. Our regional DA optimization reasonable estimations of base temperature for leaf onset (Tonset), and threshold temperature for leaf offset (Toffset) and reveal the existence of the latitudinal gradients in Tonset and Toffset. We formulated new relationships between local climatic conditions vs. phenological parameters. It was determined that, in a cold climate, deciduous trees tend to have lower temperature thresholds for both leaf onset (Tonset) and offset (Toffset), which is likely due to adaptation to the environment. A recent empirical study (Zohner and Renner, 2014) reports that species that are adapted to warmer climate flushed significantly later than natives at cool temperate region. This is consistent with our result and supports validity of our estimation and indicates that our results may represents adaptive strategy of trees. Our findings might reflect evolutionary strategy of tree species underling latitudinal gradient of leaf phenology. In future, we will estimate the leaf onset and offset date from our simulation result and plan to reveal the geographical trends and inter- specific differences.
One of the innovative points of this study is that phenological parameters successfully converged through the DA process although the MODIS LAI data sometimes contained considerable uncertainties. Prior researches pointed out that the MODIS LAI contains some anomalous data owing to a limitation of atmospheric correction (Yang et al., 2006) and it is difficult to eliminate these using a quality control process. Phenological dynamics of MODIS LAI were not fully synchronized with field observation (Viskari et al., 2015). Despite such imperfect data quality, our DA process using PF robustly simulated reasonable dynamics of LAI (Figure 2). This is one of advantages of DA because, in contrast to statistical optimizations, DA explicitly incorporates biological processes to penalize anomalous data that provoke biologically incorrect results. Recently, integration of multiple techniques (field observation, experiment, and modeling) to understand phenological responses under global change is mentioned (Cleland et al., 2007), and our study suggests that DA would promotes the integration of data from various sources.
Furthermore, the temperature dependency of phenology parameters differed among species (Figure 5). Interestingly, the temperature dependency of Q. crispula was lower than the other species. This result indicates that intraspecific adaptation is weak for Q. crispula and the response of leaf onset and offset phenology to global warming may differ. Some prior studies report a considerable relationship between interspecific variation in leaf-out phenology and phylogenetic relatedness, whereas leaf offset timing was not phylogenetically conserved (Panchen et al., 2014, 2015). In the present study, despite three of four target species belonging to the same genus, intraspecific adaptation was significantly different among the species. Our results infer that phenological timing in response to global climate change may differ among closely related species. Our findings may be important in predicting changes in phenological timing in response to global climate change. To elucidate biological mechanisms of the adaptation, the further research will be needed. At this point we can suggest that DA is a powerful tool to provide important study questions because it is able to summarize the spatiotemporally big data into simple quantitative relationships such as Equations (6, 7).
In this study, we only optimized model parameters, and the phenology models themselves were the same as those used in conventional studies. In future work, we will strive to find a better model itself. Moreover, in this study, we assumed GDDmax was 200. Because values of Tonset converged to reasonable value, GDDmax is also considered to be reasonable but GDDmax should also be optimized using DA simultaneously with other parameters. However, GDDmax is not independent to Tonset. For this reason, it is difficult to optimize GDDmax simultaneously with Tonset and this is limitation of DA. How to optimize the not independent parameters in the model is a future task.
Conclusion
In this paper, we proposed an effective model optimization system combining satellite-based big data, high performance computing, and advancements in computer and statistical sciences. Our model reveals temperature dependencies of phenology. This capability may provide novel quantitative insights into ecological studies. We successfully optimized the parameters of a terrestrial ecosystem model for a large spatial scale and successfully modeled abrupt behavior of leaf phenology. The results highlight the performance of data assimilation to optimize parameters of a terrestrial ecosystem model and better future forecasting; in addition, they can provide a valuable contribution to both basic and applied science.
Author Contributions
TI designed the study. TI and SI constructed the simulation model and implemented the data assimilation process. SW prepared the observed LAI and vegetation map data. KI prepared the meteorological data. SI and SW analyzed the data. TI and SW wrote the manuscript. All authors contributed to the final version of the manuscript.
Conflict of Interest Statement
The authors declare that the research was conducted in the absence of any commercial or financial relationships that could be construed as a potential conflict of interest.
Acknowledgments
We thank two reviewers for constructive comments. This work was supported by JST PRESTO, Japan (Grant No. JPMJPR15O1).
Supplementary Material
The Supplementary Material for this article can be found online at: https://www.frontiersin.org/articles/10.3389/fenvs.2018.00095/full#supplementary-material
References
Arakida, H., Miyoshi, T., Ise, T., Shima, S., and Kotsuki, S. (2017). Non-Gaussian data assimilation of satellite-based leaf area index observations with an individual-based dynamic global vegetation model. Nonlin. Process. Geophys. 24, 553–567. doi: 10.5194/npg-24-553-2017
Arneth, A., Harrison, S. P., Zaehle, S., Tsigaridis, K., Menon, S., Bartlein, P. J., et al. (2010). Terrestrial biogeochemical feedbacks in the climate system. Nat. Geosci. 3, 525–532. doi: 10.1038/ngeo905
Arora, V. K., and Boer, G. J. (2004) A parameterization of leaf phenology for the terrestrial ecosystem component of climate models. Glob. Change Biol. 11, 39–59. doi: 10.1111/j.1365-2486.2004.00890.x
Bennie, J., Kubin, E., Wiltshire, A., Huntley, B., and Baxter, R. (2010). Predicting spatial and temporal patterns of bud-burst and spring frost risk in north-west Europe: the implications of local adaptation to climate. Glob. Chang. Biol. 16, 1503–1514. doi: 10.1111/j.1365-2486.2009.02095.x
Biodiversity Centre of Japan (1999). Report of Vegetation Survey on 3rd National Basic Survey on Natural Environment. Biodiversity Center of Japan, Ministry of the Environment. Available online at: http://www.biodic.go.jp/copyright/index_e.html
Botta, A., Viovy, N., Ciais, P., Friedlingstein, P., and Monfray, P. (2000). A global prognostic scheme of leaf onset using satellite data. Glob. Chang. Biol. 6, 709–725. doi: 10.1046/j.1365-2486.2000.00362.x
Cannell, M. G. R., and Smith, R. I. (1983). Thermal time, chill days and prediction of budburst in Picea sitchensis. J. Appl. Ecol. 20, 951–963. doi: 10.2307/2403139
Chuine, I. (2000). A unified model for budburst of trees. J. Theor. Biol. 207, 337–347. doi: 10.1006/jtbi.2000.2178
Chuine, I., Kramer, K., and Hänninen, H. (2003). “Plant development models,” in Phenology: An Integrative Environmental Science, ed M. D. Schwartz (Dordrecht: Kluwer Academic Publishers), 217–235.
Cleland, E. E., Chuine, I., Menzel, A., Mooney, H. A., and Schwartz, M. D. (2007). Shifting plant phenology in response to global change. Trends Ecol. Evol. 22, 357–365. doi: 10.1016/j.tree.2007.04.003
Gordon, N. J., Salmond, D. J., and Smith, A. F. M. (1993). Novel approach to nonlinear/non-Gaussian Bayesian state estimation. Radar Signal Process IEEE Proc. F. 140, 107–113. doi: 10.1049/ip-f-2.1993.0015
Hanninen, H. (1990). Modelling bud dormancy release in trees from cool and temperate regions. Acta Forestalia Fennica 213, 1–47. doi: 10.14214/aff.7660
Heimann, M., and Reichstein, M. (2008). Terrestrial ecosystem carbon dynamics and climate feedbacks. Nature 451, 289–292. doi: 10.1038/nature06591
Ichii, K., Suzuki, T., Kato, T., Ito, A., Hajima, T., Ueyama, M., et al. (2010). Multi-model analysis of terrestrial carbon cycles in Japan: limitations and implications of model calibration using eddy flux observations. Biogeosciences 7:2061. doi: 10.5194/bg-7-2061-2010
Jeong, S. J., Medvigy, D., Shevliakova, E., and Malyshev, S. (2013). Predicting changes in temperate forest budburst using continental-scale observations and models. Geophys. Res. Lett. 40, 359–364. doi: 10.1029/2012Gl054431
Kramer, K. (1994). A modelling analysis of the effects of climatic warming on the probability of spring frost damage to tree species in The Netherlands and Germany. Plant Cell Environ. 17, 367–377. doi: 10.1111/j.1365-3040.1994.tb00305.x
Krinner, G., Viovy, N., De Noblet-Ducoudre, N., Ogee, J., Polcher, J., Friedlingstein, P., et al. (2005). A dynamic global vegetation model for studies of the coupled atmosphere–biosphere system. Global Biogeochem. Cycles 19. doi: 10.1029/2003GB002199
Liu, Q., Fu, Y. H., Liu, Y., Janssens, I. A., and Piao, S. (2018). Simulating the onset of spring vegetation growth across the Northern Hemisphere. Glob. Change Biol. 24, 1342–1356. doi: 10.1111/gcb.13954
Luo, Y., Ogle, K., Tucker, C., Fei, S., Gao, C., LaDeau, S., et al. (2011). Ecological forecasting and data assimilation in a data-rich era. Ecol. Appl. 21, 1429–1442. doi: 10.1890/09-1275.1
Massoud, E. C., Huisman, J., Benincà, E., Dietze, M. C., Bouten, W., et al. (2018). Probing the limits of predictability: data assimilation of chaotic dynamics in complex food webs. Ecol. Lett. 21, 93–103. doi: 10.1111/ele.12876
Murray, M. B., Cannell, M. G. R., and Smith, R. I. (1989). Date of budburst of fifteen tree species in Britain following climatic warming. J. Appl. Ecol. 26, 693–700. doi: 10.2307/2404093
Murray-Tortarolo, G., Anav, A., Friedlingstein, P., Sitch, S., Piao, S., Zhu, Z., et al. (2013). Evaluation of land surface models in reproducing satellite-derived LAI over the high-latitude northern hemisphere. Part I: Uncoupled DGVMs. Remote Sens. 5, 4819–4838. doi: 10.3390/rs5104819
Myneni, R. B., Hoffman, S., Knyazikhin, Y., Privette, J. L., Glassy, J., Tian, Y., et al. (2002). Global products of vegetation leaf area and fraction absorbed PAR from year one of MODIS data. Remote Sens. Environ. 83, 214–231. doi: 10.1016/S0034-4257(02)00074-3
Panchen, Z. A., Primack, R. B., Gallinat, A. S., Nordt, B., Stevens, A.-D., Du, Y., et al. (2015). Substantial variation in leaf senescence times among 1360 temperate woody plant species: implications for phenology and ecosystem processes. Ann. Bot. 116, 865–873. doi: 10.1093/aob/mcv015
Panchen, Z. A., Primack, R. B., Nordt, B., Ellwood, E. R., Stevens, A.-D., Renner, S. S., et al. (2014). Leaf out times of temperate woody plants are related to phylogeny, deciduousness, growth habit and wood anatomy. New Phytol. 203, 1208–1219. doi: 10.1111/nph.12892
Peng, C., Guiot, J., Wu, H., Jiang, H., and Luo, Y. (2011). Integrating models with data in ecology and palaeoecology: advances towards a model–data fusion approach. Ecol. Lett. 14, 522–536. doi: 10.1111/j.1461-0248.2011.01603.x
Peñuelas, J., Rutishauser, T., and Filella, I. (2009). Phenology feedbacks onclimate change. Science 324, 887–888. doi: 10.1126/science.1173004
Polgar, C. A., and Primack, R. B. (2011). Leaf-out phenology of temperate woody plants: from trees to ecosystems. New Phytol. 191, 926–941. doi: 10.1111/j.1469-8137.2011.03803.x
R Development Core Team (2015). R: A Language and Environment for Statistical Computing. Vienna: The R Foundation.
Richardson, A. D., Anderson, R. S., Arain, M. A., Barr, A. G., Bohrer, G., Chen, G., et al. (2012). Terrestrial biosphere models need better representation of vegetation phenology: results from the North American carbon program site synthesis. Glob. Chang. Biol. 18, 566–584. doi: 10.1111/j.1365-2486.2011.02562.x
Richardson, A. D., Black, T. A., Ciais, P., Delbart, N., Friedl, M. A., Gobron, N., et al. (2010). Influence of spring and autumn phenological transitions on forest ecosystem productivity. Philos. Trans. R. Soc. B Biol. Sci. 365, 3227–3246. doi: 10.1098/rstb.2010.0102
Richardson, A. D., Keenan, T. F., Migliavacca, M., Ryu, Y., Sonnentag, O., and Toomey, M. (2013). Climate change, phenology, and phenological control of vegetation feedbacks to the climate system. Agric. For. Meteorol. 169, 156–173. doi: 10.1016/j.agrformet.2012.09.012
Sato, H., Itoh, A., and Kohyama, T. (2007). SEIB–DGVM: A new Dynamic Global Vegetation Model using a spatially explicit individual-based approach. Ecol. Modell. 200, 279–307. doi: 10.1016/j.ecolmodel.2006.09.006
Schwartz, M. D., Ahas, R., and Aasa, A. (2006). Onset of spring starting earlier across the Northern Hemisphere. Glob. Chang. Biol. 12, 343–351. doi: 10.1111/j.1365-2486.2005.01097.x
Sitch, S., Smith, B., Prentice, I. C., Arneth, A., Bondeau, A., Cramer, W., et al. (2003). Evaluation of ecosystem dynamics, plant geography and terrestrial carbon cycling in the LPJ dynamic global vegetation model. Glob. Chang. Biol. 9, 161–185. doi: 10.1046/j.1365-2486.2003.00569.x
Viskari, T., Hardiman, B., Desai, A. R., and Dietze, M. C. (2015). Model-data assimilation of multiple phenological observations to constrain and predict leaf area index. Ecol. Appl. 25, 546–558. doi: 10.1890/14-0497.1
White, M. A., Thornton, P. E., and Running, S. W. (1997). A continental phenology model for monitoring vegetation responses to interannual climatic variability. Global Biogeochem. Cycles 11, 217–234. doi: 10.1029/97GB00330
Williams, M., Schwarz, P. A., Law, B. E., Irvine, J., and Kurpius, M. R. (2005). An improved analysis of forest carbon dynamics using data assimilation. Glob. Chang. Biol. 11, 89–105. doi: 10.1111/j.1365-2486.2004.00891.x
Xiao, Y., and Friedrichs, M. (2014). The assimilation of satellite-derived data into a one-dimensional lower trophic level marine ecosystem model. J. Geophys. Res. Oceans 119, 2691–2712. doi: 10.1002/2013JC009433
Yang, W., Shabanov, N. V., Huang, D., Wang, W., Dickinson, R. E., Nemani, R. R., et al. (2006). Analysis of leaf area index products from combination of MODIS terra and aqua data. Remote Sens. Environ. 104, 297–312. doi: 10.1016/j.rse.2006.04.016
Yang, X., Mustard, J. F., Tang, J., and Xu, H. (2012). Regional-scale phenology modeling based on meteorological records and remote sensing observations. J Geophy. Res. Biogeosci. 117. doi: 10.1029/2012JG001977
Keywords: data assimilation, terrestrial ecosystem model, remote sensing, leaf phenology, leaf area index
Citation: Ise T, Ikeda S, Watanabe S and Ichii K (2018) Regional-Scale Data Assimilation of a Terrestrial Ecosystem Model: Leaf Phenology Parameters Are Dependent on Local Climatic Conditions. Front. Environ. Sci. 6:95. doi: 10.3389/fenvs.2018.00095
Received: 11 January 2018; Accepted: 17 August 2018;
Published: 06 September 2018.
Edited by:
Juergen Pilz, Alpen-Adria-Universität Klagenfurt, AustriaReviewed by:
Alfredo Huete, University of Technology Sydney, AustraliaKonstantinos Demertzis, Democritus University of Thrace, Greece
Copyright © 2018 Ise, Ikeda, Watanabe and Ichii. This is an open-access article distributed under the terms of the Creative Commons Attribution License (CC BY). The use, distribution or reproduction in other forums is permitted, provided the original author(s) and the copyright owner(s) are credited and that the original publication in this journal is cited, in accordance with accepted academic practice. No use, distribution or reproduction is permitted which does not comply with these terms.
*Correspondence: Takeshi Ise, aXNlQGthaXMua3lvdG8tdS5hYy5qcA==