 Soizic Morin
 Betty Chaumet
 Nicolas Mazzella
- Irstea, UR EABX, Cestas, France
Contamination by herbicides is reported in most freshwater environments. These biologically active compounds may impact the non-target biota such as benthic biofilms, at the base of the trophic chain. In agricultural watersheds, herbicides occur as pulses in the system, and traditional dose-response analysis performed at a given duration of exposure (hours to days) may not predict accurately the risk of adverse impacts at shorter temporal scales (minutes to hours) corresponding to pulse exposures. To assess the time-response relationship in biofilms exposed to herbicides, we used diuron, an inhibitor of photosynthesis, to perform bioassays (time-response curves) with the aim of characterizing the initial steps of photosynthesis decrease after exposure to the herbicide (from seconds to hours), for different concentrations of exposure. Diuron-induced inhibition of photosynthesis reflects blockage of electron transfer in PSII, therefore we defined the time lag to reach the threshold of 50% photosynthesis inhibition (t1/2) as the time for diuron to reach its target site (adsorption, distribution). We found a rapid decrease in photosynthetic efficiency: t1/2 values were dose-dependent and ranged from < 30 s (highest concentration of exposure) to 7′20′′ (lowest concentration). While dose-response curves are influenced by the initial biomass or nature of biofilms, time-response curves yielded similar t1/2 for contrasted biofilms, making this parameter a unique response to be valuably incorporated into an ecotoxicology framework. We also assessed the variability of the response as a function of previous short-term (3 h) exposure to diuron. The t1/2 values obtained were consistent with those obtained on non-exposed biofilms, but repeated pulses of diuron exacerbated the decrease in photosynthetic yields. This time-response approach highlighted that diuron reaches its cellular target almost instantaneously (< 1 min), independently of biological parameters (chlorophyll a concentration, adaptation related to exposure history). Reversibility of toxic impacts a few hours after diuron removal was not fully demonstrated, suggesting that the kinetics of diuron release from cells to uncontaminated medium are much slower than binding rates. Our results confirm that repeated exposure is very likely to impair freshwater biofilms, in particular if pulses occur at high frequency.
Introduction
Contamination of European waterbodies by pesticides is generalized: in France, pesticides were detected in 92% of the water samples collected within the 2013 surveillance program, with a clear dominance of herbicide substances (>80% of detections, SOeS, 2015). In agricultural watersheds, these substances typically reach the aquatic ecosystems as pulses (Rabiet et al., 2010) following runoff events. As herbicides may impact the non-target biota (i.e., algae), the risk associated with these substances has to be quantified. To this aim, several ecotoxicity tests have been developed based on microalgae (including standardized tests such as OECD, 1984; AFNOR, 2012). Ecotoxicity assessment based on periphytic microbial communities (biofilms) is also increasing (Ghiglione et al., 2014), given their sensitive, specific, and early responses to toxic pollution (Sabater et al., 2007; Guasch et al., 2016). Traditional dose-response analysis predicts the risk of adverse impacts of herbicides toward biofilms or microalgae for a given duration of exposure, based on endpoints such as the inhibition of growth or of photosynthesis (see review in Pesce et al., 2011). Toxic effects at environmentally relevant concentrations are generally demonstrated, but the tests are performed at temporal scales on the order of days to weeks of exposure that are disconnected from real field exposure, of much shorter time spans (minutes to hours). Therefore, the duration of standard tests may be inappropriate to predict the hazard associated to pulse exposures.
It has been demonstrated that pulse exposure has functional and structural impacts (e.g., Tlili et al., 2008). In turn, changes in community structure will have consequences for higher trophic levels and ultimately, for ecosystem functioning. As herbicide exposure in the aquatic environment is fluctuating, and the manifestation of toxic symptoms is a time (and substance)-dependent process, it is thus desirable to take the temporal factor into account to improve pesticide risk assessment. Among the herbicides of topical concern, diuron (N-(3, 4-dichlorophenyl)-N, N-dimethylurea) is considered a Priority Hazardous Substance by the European Commission (Water Framework Directive, 2000/60/EC). This chemical substance acts as a photosystem II (PSII) inhibitor and is contained in many phytopharmaceutical products aiming to fight against undesirable weeds in crop protection or in road/railway maintenance, as well as for antifouling purposes, and is frequently reported in freshwater environments (Okamura et al., 2003; Murray et al., 2010). In plant cells, diuron binds to a specific niche on the D1 protein of PSII, replacing the plastoquinone Qb. This substitution decreases the electron flow within PSII (Rutherford and Krieger-Liszkay, 2001), and consequently inhibits photosynthetic efficiency (φPSII). The diuron-EC50 (Effective Concentration causing a 50% inhibition) for microalgal growth inhibition, over the 72-h test period recommended by ISO and OECD guidelines (OECD, 1984; AFNOR, 2012), ranges from 7 to 36 μg.L−1 for freshwater algae. For ecotoxicity assessments based on the PSII inhibition of periphytic microalgae, the EC50 is generally assessed after 1 to 4-h exposures of biofilm suspensions to increasing herbicide concentrations. These non-standard durations have generally been established following preliminary developments; however the toxicity values always fall within the same range, i.e., between 5 and 25 μg.L−1 for pristine biofilms (with a min-max range: 2–486 μg.L−1: McClellan et al., 2008; Pesce et al., 2010a). In fact, Francoeur et al. (2007) demonstrated that 5–10 min of exposure to high diuron concentrations are enough to ensure that photosynthesis inhibition is complete. This quick onset of inhibition may be due to the fact that diuron reaches its binding site within minutes (Schreiber et al., 2007; Nestler et al., 2012).
Pharmaceutical studies aiming to assess the efficiency of healthcare products (e.g., antimicrobial drugs, VanMeter and Hubert, 2016) provide time-response based concepts that may be fruitfully implemented to assess the temporal features of diuron inhibitory impact on PSII in an ecotoxicology framework. As shown in Figure 1, we can expect a rapid decrease in photosynthetic efficiency from the time of diuron exposure. The onset of time response, t1/2, is defined as the time lag to reach the threshold of 50% inhibition based on the difference between optimal and minimum achievable φPSII values.
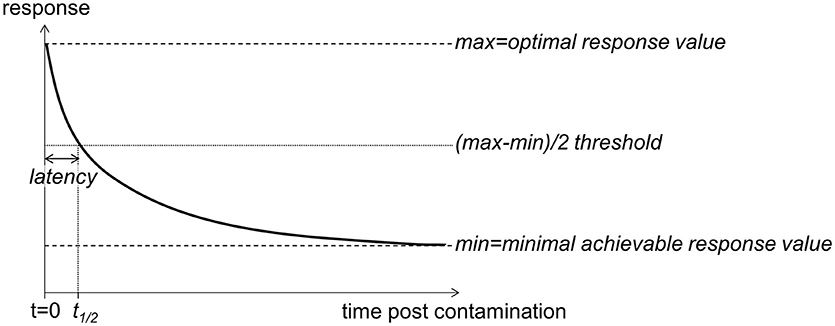
Figure 1. Schematic representation of the time-response (here, φPSII) relationship expected to occur following PSII inhibitor exposure (contamination on t = 0). φPSII is anticipated to decrease after herbicide exposure, from its optimal value to a minimal achievable value (maximal inhibition). The latency is defined as the time the PSII inhibitor takes to cause a 50% inhibition of the response. All the toxicological values are susceptible to change depending on the concentration of exposure.
In this context, we performed bioassays (called time-response curves) using suspensions of mature freshwater biofilms, to characterize the initial steps of photosynthesis decrease after exposure to diuron. Specifically our objectives were to:
i) quantify exposure time to diuron needed to reach significant photosynthesis inhibition,
ii) determine if exposure time depends on exposure test concentration, and
iii) assess the variability of the response as a function of biofilm composition and previous pulse exposure to diuron.
Materials and Methods
Mature Biofilm Collection
Glass slides (156 cm2) were used as artificial substrates for biofilm growth. Plastic racks equipped with glass slides were installed in the photic zone of Gazinet-Cestas pond (geographical coordinates: 44°46′30.1′′N, 0°41′44.3′′W), near Bordeaux, SW France. The pond is free of pesticides, in particular diuron concentrations are below the detection limit of 0.2 μg.L−1 (n = 10 measurements in winter 2016–2017).
One-month old biofilms, settled on the glass slides, were collected in August and December 2016. Before preforming the assays (2.3), the slides were scraped carefully and separated into two aliquots before being suspended in 40 mL of Dauta (1982) medium.
Diuron
Diuron (CAS reg. 330-54-1, purity = 98%) was purchased from Dr. Ehrenstorfer GmbH (Augsburg). Stock solutions were prepared in acetonitrile, at a concentration of 200 mg.L−1. They were analyzed by UPLC-ToF (Ultra-Performance Liquid Chromatography—Time of Fight Mass Spectrometry, Xevo G2-S ToF, Waters) and the different exposure concentrations were calculated. Diuron analyses in the water samples (pond: 2.1, laboratory mesocosms: 2.4.2) were performed with the same method after filtration of the samples through 0.45 μm Whatman filters. Briefly, 990 μL samples were spiked with eight internal standards (10 μL, i.e., 10% final volume). Of these, 20 μL were injected with a solvent gradient (98% ammonium acetate, 2% methanol). Chromatographic separation was achieved by passing through a 5-cm C18 column (Waters). Pesticide concentrations were calculated from calibration curves (10 points, from 0 to 50 μg.L−1) realized during the same period. Detection and quantification limits were of 0.1 and 0.2 μg.L−1, respectively.
Time-Response Curves
We used a Phyto-PAM (Heinz Walz GmbH, Germany) and measurements were performed in quartz cuvettes fed with 3 mL of agitated biofilm suspension.
We determined the chlorophyll a concentration in the biofilm suspensions and the proportion of algal groups present to roughly characterize the biofilms.
Time-response assessment of diuron acute toxicity was performed following the response of the effective quantum yield of PSII (φPSII) over time following the addition of a drop of diuron (expressed as time post contamination). Experiment 1 was performed with biofilms collected in summer and Experiment 2 with biofilms collected in winter. In each time-response curve, the diuron concentration was kept constant and the response was assessed as a function of exposure time. φPSII was measured every 5 s after diuron addition, then measurements were spaced out and performed every 10 s until φPSII values stabilized.
Experimental Setup
Experiment 1: Time-Response Curves of Pristine Biofilms Exposed to Increasing Diuron Concentrations (August, 2016)
Triplicate slides collected on August 4th, 2016 were used to perform time-response curves on biofilm suspensions.
Dose-response curves established using these biofilms prior to the experiment (Supplementary Information, SI1) allowed the selection of five increasing diuron concentrations to be used for the time-response curves. The following nominal concentrations were used: no diuron (0 μg.L−1; no inhibition), “low” (5.2 μg.L−1; corresponding to EC25), “intermediate” (17.4 μg.L−1; slightly above EC50), “high” (166.6 μg.L−1; higher than the concentration leading to maximal achievable inhibition) and “max” (332 μg.L−1; i.e., double the “high” concentration).
Time-dependent photosynthetic inhibition was assessed over a ~1 h exposure, and t1/2 were extracted from the three time-response curves established for each diuron exposure concentration (except for the highest concentration: only two replicates available).
Experiment 2: Time-Response Curves of Biofilms Pulsed With Contrasted Diuron Concentrations (December, 2016)
On December 6th, 2016, 16 mature biofilms were sampled. Four slides were immediately used to perform time-response curves of “non-pulsed” biofilms, under “high” diuron exposure.
The remaining slides were exposed in laboratory mesocosms to three levels of diuron pulses (0.3, 19.1, and 102.4 μg.L−1 measured concentrations), each in quadruplicate. Pulse duration was 3 h of exposure, such as in Tlili et al. (2008). The slides were collected and prepared as described above. The suspensions were allowed to recover from pulse exposure in uncontaminated Dauta medium for 4 to 8 h before performing the time-response curves, assessed using a “high” diuron exposure. The duration of the recovery period was based on the results of Laviale et al. (2011). More details on the protocol are provided in Supplementary Information SI2.
Statistical Analyses
To model dose-response-curves (DRC), the φPSII values measured at specific times were plotted against nominal exposure concentrations and fitted to a Hill model using RegTox macro for Microsoft ExcelTM (version 7.0.7, Eric Vindimian, 2001). DRC were performed for each replicate biofilm suspension, then the optimized parameters of the model (500 bootstrap simulations), in particular EC50, were averaged and standard deviations were calculated.
To draw time-response curves (TRC), the decrease over time in φPSII was modeled (each replicate individually) with RegTox, using a classical Hill equation, where the optimal response value measured before the addition of the diuron drop was set as upper limit. The optimal parameters derived from the individual TRC models after 500 bootstrap simulations are given as mean ± standard deviation (Table 1).
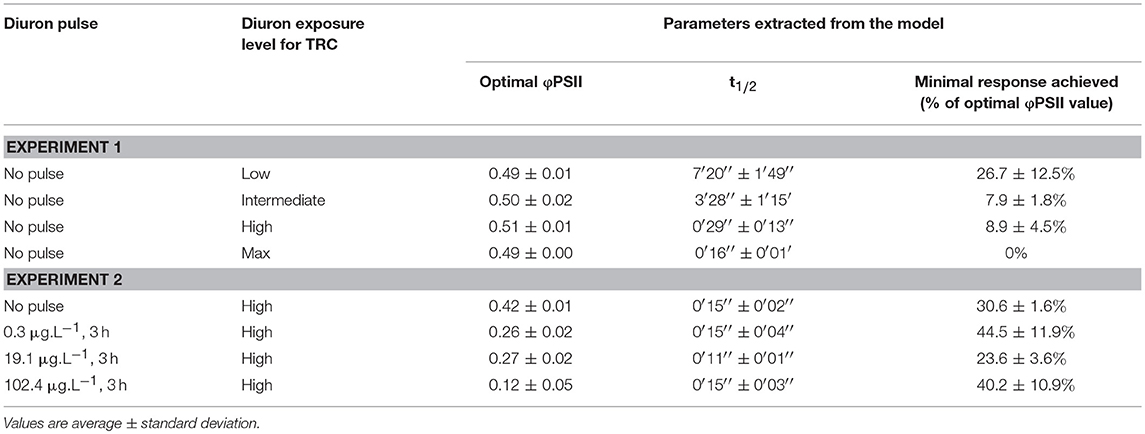
Table 1. Summary of the time-response curves results.
One-way ANOVA was used to highlight significant differences in biological responses. Linear regressions (after transformation of the data to achieve normality, when necessary) were calculated to assess correlations between biological responses (EC50, φPSII), time and concentration of exposure. In both cases, the α-level was set at 0.01.
Results and Discussion
Dose Dependency of the Time-Response Relationship
When no diuron drop was added, biofilm suspensions from Experiment 1 displayed φPSII of 0.51 ± 0.02 (n = 367), with a slight increase over time (Figure 2A). With diuron addition, time-response curves for the four concentrations tested here highlighted that the efficiency of diuron increased gradually with increasing exposure concentrations. At the “low” exposure level, photosynthesis was inhibited down to 26.7 ± 12.5% of the optimal value, while the highest concentrations led to a complete inhibition of photosynthesis. Total inhibition of photosynthesis at diuron concentrations higher than 100 μg.L−1 is consistent with the findings of McClellan et al. (2008) for freshwater biofilms and Magnusson et al. (2010) for microalgal species.
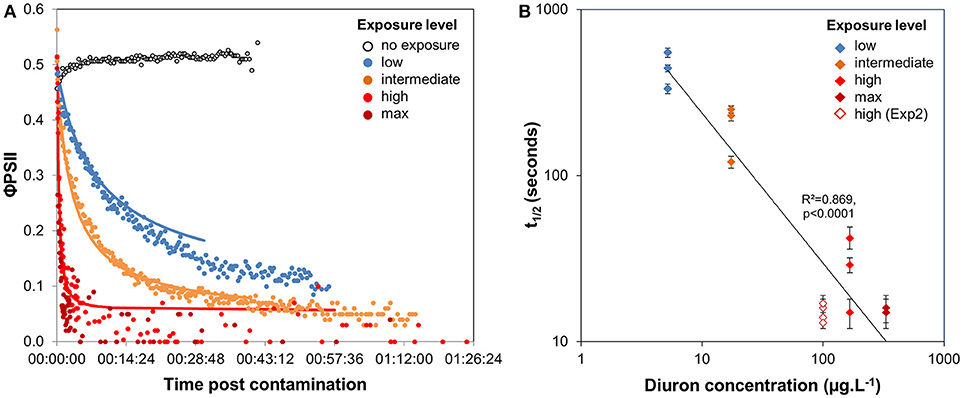
Figure 2. (A) Time-response curves based on φPSII decrease post diuron addition (Experiment 1); values are average of 3 replicates, except for the highest concentration (2 replicates available). A summary of the ecotoxicity parameters extracted from the curves are provided in Table 1. (B) Variation of t1/2 with diuron exposure concentration. Error bars indicate t1/2 confidence intervals (95%) for the individual time-response models.
Diuron-induced inhibition of photosynthesis reflects herbicide binding to the electron acceptor of Qb within the thylakoid membrane and subsequent blockage of electron transfer in PSII. We defined latency as the time diuron took to cause a 50% photosynthesis inhibition on biofilm suspensions (Figure 1), postulating that t1/2 values expressed the time for diuron to reach its target site (adsorption, distribution). Our results (Figure 2A, and Table 1) show that inhibitory effects are very rapid: t1/2 ranged between < 30 s (for the highest concentrations of exposure) to 7′20′′ (exposure to “low” concentration). Using diatom cultures, Magnusson et al. (2010) also showed that maximal inhibition of photosynthesis (ca. 50%), in response to a single dose of 2.4 μg.L−1 diuron, was reached within minutes. Such rapid action confirms the high affinity of diuron for microalgal binding sites and almost instantaneous intracellular uptake, in agreement with Nestler et al. (2012). As for maximal inhibition, the time-lag to reach a 50% inhibition (t1/2) was also dose-dependent; the lower the exposure concentration, the higher the t1/2. Figure 2B evidences that the estimated t1/2 decreased with increasing diuron concentrations (R2 = 0.869, F = 87.56, p < 0.0001). However, for the “high” and “max” concentrations of exposure, the overlap between the 95% confidence intervals suggests that binding sites were saturated above 100 μg.L−1.
Surprisingly, the maximal inhibition achieved for the “low” and “intermediate” concentrations tested was higher than expected, based on the dose-response curves performed with the same biofilm (SI1). Indeed, after this 3-h exposure to increasing diuron concentrations, φPSII was inhibited by 25 and 60% at concentrations of 5.2 μg.L−1 (“low”) and 17.4 μg.L−1 (“intermediate”), respectively (vs. in TRC: by 73.3 ± 12.5 and 92.1 ± 1.8%). Two complementary hypotheses may explain these differences, as discussed below: the influence of the duration of diuron exposure (section Time Dependency of Ecotoxicity Parameters) and/or of microalgal concentrations in the suspensions tested (section Consistency in t1/2 Values From Biofilm of Contrasted Composition).
Time Dependency of Ecotoxicity Parameters
Using the data from the time-response curves shown in Figure 2A, we extracted the φPSII values measured at several durations post exposure, from 15 s to 20 min. Dose response curves were fitted to the data (Figure 3A) and their respective EC50 estimated, together with 95% confidence intervals (Figure 3B). Figure 3B corresponds to a time-to-event analysis of the data (Newman and McCloskey, 1996). The relationship between EC50 and time post contamination was significant (R2 = 0.997, F = 1762.42, p < 0.0001), and from 5 to 10 min of exposure the EC50 was on the order of magnitude of environmental peaks of diuron (Rabiet et al., 2010).
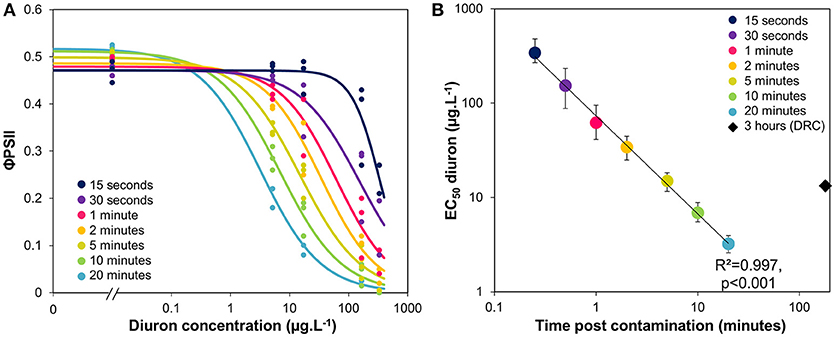
Figure 3. (A) Experimental φPSII inhibition curves with increasing diuron concentrations, after different durations of exposure. (B) Variation of EC50 values (± CI, 95%) with duration of exposure, given by the models fitted in Figure 3A. The black diamond shows the EC50 previously obtained with a 3-h exposure for comparison (dose-response curve–DRC–presented in SI1).
We plotted in Figure 3B the EC50-diuron obtained initially for a longer exposure (3 h, dose-response curve illustrated in Supplementary Information Figure SI1). This value, though obtained with the same biofilm, was higher than those calculated for 10 and 20 min of exposure. This is in line with the findings of Nestler et al. (2012) who also observed a 40% increase in EC50 value between 2 and 6 h of diuron exposure (from 17.9 to 25.6.L−1). The difference can be attributable to slight differences in suspended biomass (“dilution effect,” as discussed in section Consistency in t1/2 Values From Biofilm of Contrasted Composition), to decreasing blockage of Qb binding sites, and/or to the initiation of physiological processes on the 3-h scale. In fact, the partial recovery (see also SI2) could correspond to physiological adaptation (acclimation), cellular detoxification processes, and/or biodegradation of diuron as the result of cytochrome P450-mediated N-demethylation. Cytochrome P450 is produced by a wide range of microorganisms, and degradation can be fast (e.g., biodegradation up to 20% after the 3 first hours of incubation with 250 ppm diuron, in Sharma et al., 2010).
This marginal increase in tolerance that we observed after 3 h highlights that diuron exposure is non-lethal, and that complete recovery can be expected under non-contaminated conditions. This is confirmed by the study of Vallotton et al. (2008), who demonstrated the rapid reversibility of toxic effects of PSII inhibitors after herbicide removal, through rapid recovery of φPSII (within 4 h) and of algal growth, using cultures of Scenedesmus vacuolatus. Even if one pulse is unlikely to induce long-lasting effects (but see section Influence of Pulse Exposure History on TRC), impacts on biofilms are highly plausible under fluctuating herbicide exposures, i.e., repeated pulses. Indeed, diuron binding to PSII interferes in the essential turnover and repair mechanisms of damaged D1 proteins (Draber et al., 1991), and repeated pulse exposure may lead to delayed irreversible damages of the photosystem. For example, Tlili et al. (2008) found that two consecutive pulses (3 h each) of 7 μg.L−1 of diuron impacted biofilm growth (dry weight, chlorophyll a concentration) much more than one single pulse, on the long term. Copin et al. (2015) experimentally assessed and modeled the cumulative effects of isoproturon pulses on the growth of S. vacuolatus. Testing five scenarios, with different magnitudes (from EC10 to EC80) and durations (4–24 h) of exposure, they found in all cases an overall inhibition of growth, from 15 to 44% compared to control cell densities.
The time-dose-response model proposed in this study to analyze short-term photosynthesis inhibition induced by diuron provides input data (EC50 as a function of time) that could be incorporated into models predicting the impacts of repeated exposure to herbicide pulses (e.g., Copin et al., 2015).
Consistency in t1/2 Values From Biofilm of Contrasted Composition
We compared the time-response relationships after a “high” diuron exposure for biofilms collected in August (Experiment 1) and December (Experiment 2). Microalgal biomass differed between biofilms, with chlorophyll a concentrations of 6.8 ± 3.4 μg.L−1 in the biofilm suspensions tested in August, vs. 80.5 ± 12.54 μg.L−1 in December. The proportions of algal groups also varied between seasons. Indeed, the PhytoPAM signal revealed that summer (August) biofilms were dominated by chlorophytes (59 ± 6%), followed by similar proportions of cyanophytes (21 ± 1%) and diatoms (20 ± 4%). Contrastingly, biofilms collected in December had more diatoms (41 ± 3%) than chlorophytes (31 ± 2%) and cyanophytes (27 ± 1%).
The time-response curves obtained for both biofilms (Figure 4) yielded comparable t1/2 values (Table 1), confirming the rapid binding kinetics of diuron. This result suggests that the transport of diuron into periphytic cells was not particularly hindered by higher biomass (no apparent boundary layer effect). This result partly contradicts the assumption that the periphytic matrix exerts a protective role against toxic chemicals (Sabater et al., 2007); however it has to be noted that we did not use intact biofilms, but a suspension of biofilm which was, therefore, destructured.
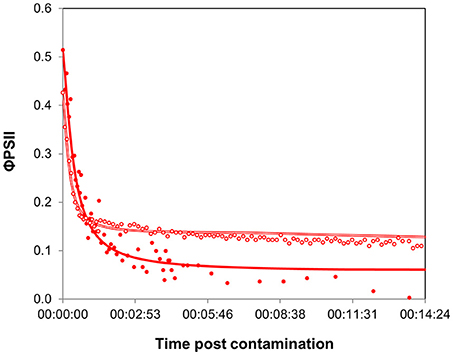
Figure 4. Time-response curves based on φPSII decrease for contrasted biofilms, after contamination at “high” concentration. Full symbols correspond to biofilms collected in August (Experiment 1, average of 3 replicates), empty symbols to biofilms sampled in December (Experiment 2, average of 4 replicates). Parameters extracted from curve modeling are shown in Table 1.
The maximal inhibition achieved was more pronounced in summer biofilms. As the maximal effect is determined by the rate of internalization of diuron within microalgal cells, we can hypothesize that these differences resulted from the differences in biofilm biomass. Diuron uptake experiments performed with different microalgal species showed that the rate of binding depends on chlorophyll a concentration (Laasch et al., 1981; Allen et al., 1983). Yet, biofilm binding capacities were certainly exceeded here: though the amount of chlorophyll a was about 12-fold higher in winter biofilms than in summer ones, in both cases the “high” concentration provided far higher diuron amounts than those estimated to saturate the binding sites (in green microalgae: about 3 nmol of diuron per mg of chlorophyll a, Laasch et al., 1981). Besides biomass, seasonal differences in the proportions of algal groups also probably accounted for the differences in direct PSII inhibition reflected by the minimal φPSII values. The presence of substantial amounts of chlorophytes in summer biofilms might have contributed to the higher impact observed: chlorophytes have been shown to be more sensitive to PSII inhibitors (Tang et al., 1997; Lockert et al., 2006) than cyanophytes or diatoms (but see Schreiber et al., 2007). Diatoms, which were dominant in winter, contain carotenoids and xanthophylls that are involved in managing oxidative stress (Pinto et al., 2003); therefore diatoms can be expected to have enhanced tolerance to diuron-induced oxidative damages. Moreover, the relatively greater abundance of cyanophytes in winter biofilms can also be involved in the residual PSII yield. Indeed, a signal attributed to cyanobacterial fluorescence of photosystem I, independent of PSII, was also observed under biofilm exposure to diuron by Francoeur et al. (2007).
To sum up, our results lead to the same conclusion reached by Lambert et al. (2015) that there is a considerable influence of biofilm biomass in the outputs of ecotoxicity tests with biofilms, which complicates between-sample comparisons. However, both time-response curves, for very different biofilms, yielded comparable t1/2 values, making the latency parameter a unique response favoring between-date comparisons. These results support further potential use of time-response curves in ecotoxicology studies, as time responses were more dose-dependent than biofilm-dependent.
Influence of Pulse Exposure History on TRC
Initial φPSII values of the pulsed biofilms were significantly lower than in non-pulsed ones (Table 1; ANOVA: F = 588.3, p < 0.0001), irrespective of the concentration of exposure. This decrease suggests physiological stress induced by diuron pulses, even at low dose (0.3 μg.L−1), as shown for longer exposures by Ricart et al. (2009). This effect could have been exacerbated by the “translocation” to laboratory conditions. After the highest concentration pulse (~100 μg.L−1), the biofilms were in poor physiological state. Their φPSII was 0.12 ± 0.05, matching strongly with the minimal φPSII values obtained for non-pulsed biofilms from 5 min after addition of the diuron drop: 0.12 ± 0.00 (n = 215). No differences in optimal φPSII were found for the biofilms pre-exposed to the lowest pulse concentrations tested (0.3 and 19.1 μg.L−1) at this time point.
The shape of the time-response curves (Figure 5) obtained for the pulsed biofilms suggest a trend in φPSII decline post diuron drop, as a function of the pulse intensity. It is worth noting that the TRC of the biofilms pulsed with the highest concentration were hardly comparable with the other data, due to their very low initial φPSII resulting from a poor recovery (see below). Differences in the maximal inhibition achieved cannot be considered significant, because the percentages were calculated based on variations from very small absolute values of initial φPSII. Besides, no significant differences in t1/2 values were highlighted between pulsed conditions (Table 1). These t1/2 fell into the same range of latency values found for pristine biofilms collected in summer or in winter without preexposure (Table 1, and Figure 4). We can conclude from this result that, whatever the pulse intensity, the diuron binding sites were probably not saturated when the TRC were performed. A possible explanation lies in the fact that part of the diuron bond to the cells may have been released during the recovery period in uncontaminated medium. This was checked by modeling recovery curves, i.e., φPSII increase over the period subsequent to diuron exposure (SI2). We assumed that φPSII recovery only depends on the reversibility of diuron binding and dilution in the uncontaminated water used for recovery. Previous studies pointed out a progressive recovery in φPSII as time post herbicide removal increased (Vallotton et al., 2008; Laviale et al., 2011; Nestler et al., 2012). Our data show, as observed with φPSII inhibition post contamination, that diuron release kinetics are dependent on the concentration of preexposure. The biofilms exposed to the lowest pulses (0.3 and 19.1 μg.L−1) recovered faster: φPSII returned within 5 h to half the optimal value of the non-pulsed biofilms (0.42 ± 0.01: Table 1). In contrast, the biofilms exposed to the higher pulses recovered poorly (no more than 35 % of the optimal values after more than 8 h post diuron removal). This is not surprising; exposure to such extreme concentrations for 3 h probably induced irreversible cellular damage in periphytic organisms.
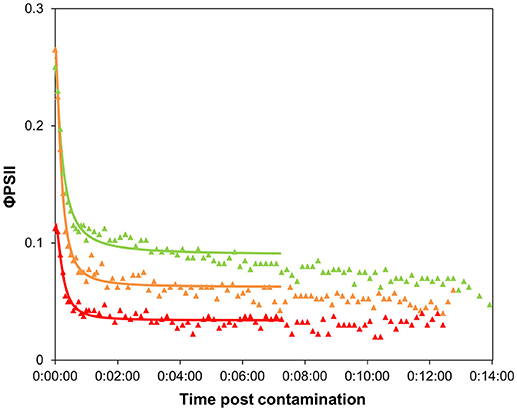
Figure 5. Time-response curves based on φPSII decrease for biofilms pre-exposed to 3-h diuron pulses, after contamination at “high” concentration (Experiment 2). Values are average of 4 replicates. Pulse concentration: 0.3 μg.L−1: green triangles, 19.1 μg.L−1: orange triangles, 102.4 μg.L−1: red triangles.
On the 3-h scale of pulse duration, we would expect that adaptation and detoxification mechanisms likely occurred as described in section Time Dependency of Ecotoxicity Parameters, rather than species selection. With this study, we show that biofilm adaptation to a 3-h pulse, even at low dose, has a cost for the community. The time taken to (incompletely) recover photosynthetic efficiency reflects that the individuals were weakened. Interestingly, Pollution-Induced Community Tolerance (PICT, Blanck et al., 1988) was not observed when exposing our biofilms for 3 days to 5 μg.L−1 of diuron (unpublished data). EC50 were similar between control and exposed biofilms (respectively, EC50 = 12.7 ± 2.0 and 13.6 ± 1.7 μg.L−1) but some effect was visible on the photosynthetic efficiency (φPSII = 0.51 ± 0.02 vs. 0.43 ± 0.01) confirming that diuron had some effect. Therefore, the fact that PICT is often observed in diuron-contaminated streams (McClellan et al., 2008; Pesce et al., 2010a,b; Tlili et al., 2010) suggests that repeated, and a fortiori high frequency, pulses are likely to have dramatic observable impacts on riverine primary production. Indeed, the cumulative effects of pulses likely decrease the fitness of the individuals and, on longer time scales, eliminate the most sensitive organisms from the initial community. PICT acquisition would thus result from this selection of tolerant organisms after repeated pulses (even for low concentrations, Ricart et al., 2009), rather than from physiological adaptation.
Conclusions and Perspectives
This time-response curve approach allowed to estimate two important parameters for assessing the risk associated to fluctuating exposure to herbicides: the maximal achievable inhibition (= maximal impact of a particular concentration of exposure) and the latency parameter t1/2, reflecting the time to reach 50% of the maximal effect. t1/2 was dose-dependent but apparently not influenced by the biofilms we tested, nor by prior short-term (pulse) exposure. This result highlights that diuron reaches its cellular target almost instantaneously (< 1 min), independently from biological parameters (chlorophyll a concentration, adaptation related to exposure history).Characterizing diuron accumulation kinetics within biofilms, considering their microbial composition, would allow confirming this immediate internalization.
Reversibility of the impacts of pulses a few hours after diuron removal was not fully demonstrated. The kinetics of diuron release from cells to uncontaminated medium appeared to be much slower than binding rates and the assessment of diuron desorption over time would be worth studying in the future. Therefore, repeated exposure is very likely to impair freshwater biofilms, in particular if pulses occur at a high frequency.
Because photosynthesis is directly associated with growth and primary production, it is necessary to better understand the consequences of short-term exposure to herbicide in real-world conditions, as well as the recovery mechanisms after toxic pressure is removed. This refinement can play a significant role in herbicide risk assessment, such as prediction of the duration, intensity and frequency of exposure leading to non-negligible effects on the primary production in aquatic ecosystems. Future research should also consider the simultaneous accumulation kinetics of different organic compounds, as contaminants rarely occur alone in the field.
Author Contributions
SM, BC, and NM contributed to the conception and design of the study; SM and BC performed the experiments. SM performed the statistical analysis and wrote the first draft of the manuscript. BC and NM revised the manuscript. All authors contributed to manuscript revision, read and approved the submitted version.
Funding
This study was carried out with financial support from the French National Research Agency (ANR) in the framework of the Investments for the future Program, within the Cluster of Excellence COTE (ANR-10-LABX-45).
Conflict of Interest Statement
The authors declare that the research was conducted in the absence of any commercial or financial relationships that could be construed as a potential conflict of interest.
Acknowledgments
We warmly acknowledge Gwilherm Jan (Irstea) for his technical help in field implementation and channels setup, Mélissa Eon and Brigitte Delest (Irstea) for complementary water analyses. They also thank Emilie Saulnier-Talbot for correcting English spelling and grammar of the manuscript.
Supplementary Material
The Supplementary Material for this article can be found online at: https://www.frontiersin.org/articles/10.3389/fenvs.2018.00131/full#supplementary-material
References
AFNOR (2012). Water Quality. Fresh water algal growth inhibition test with unicellular green algae - European standard NF EN ISO 8692.
Allen, M. M., Turnburke, A. C., Lagace, E. A., and Steinback, K. E. (1983). Effects of photosystem II herbicides on the photosynthetic membranes of the Cyanobacterium Aphanocapsa 6308. Plant Physiol. 71, 388–392. doi: 10.1104/pp.71.2.388
Blanck, H., Wängberg, S. A., and Molander, S. (1988). “Pollution-induced community tolerance - a new ecotoxicological tool,”in Functional Testing of Aquatic Biota for estimating Hazards of Chemicals, eds J. Cairns Jr and J. R. Pratt (Philadelphia: American Society for Testing and Materials), 219–230.
Copin, P.-J., Coutu, S., and Chèvre, N. (2015). Modelling the effect of fluctuating herbicide concentrations on algae growth. Ecotoxicol. Environ. Saf. 113, 214–222. doi: 10.1016/j.ecoenv.2014.12.010
Dauta, A. (1982). Conditions de développement du phytoplancton. Etude comparative du comportement de huit espèces en culture. I. Détermination des paramètres de croissance en fonction de la lumière et de la température. Ann. Limnol. 18, 217–262. doi: 10.1051/limn/1982005
Draber, W., Tietjen, K., Kluth, J. F., and Trebst, A. (1991). Herbicides in Photosynthesis Research. Angew. Chem. Int. Edn. Eng. 30, 1621–1633. doi: 10.1002/anie.199116211
Francoeur, S. N., Johnson, A. C., Kuehn, K. A., and Neely, R. K. (2007). Evaluation of the efficacy of the photosystem II inhibitor DCMU in periphyton and its effects on nontarget microorganisms and extracellular enzymatic reactions. J. North Am. Benthol. Soc. 26, 633–641. doi: 10.1899/06-051.1
Ghiglione, J.-F., Martin-Laurent, F., Stachowski-Haberkorn, S., Pesce, S., and Vuilleumier, S. (2014). The coming of age of microbial ecotoxicology: report on the first two meetings in France. Environ. Sci. Pollut. Res. 21, 14241–14245. doi: 10.1007/s11356-014-3390-x
Guasch, H., Artigas, J., Bonet, B., Bonnineau, C., Canals, O., Corcoll, N., et al. (2016). “The use of biofilms to assess the effects of chemicals on freshwater ecosystems,”in Aquatic Biofilms: Ecology, Water Quality and Wastewater Treatment, eds A. M. Romaní, H. Guasch, and M. D. Balaguer (Girona: Caister Academic Press), 125–144.
Laasch, H., Pfister, K., and Urbach, W. (1981). Comparative binding of Photosystem II-herbicides to isolated thylakoid membranes and intact green algae. Zeitschr. Naturforschung 36c, 1041–1049. doi: 10.1515/znc-1981-11-1223
Lambert, A.-S., Pesce, S., Foulquier, A., Gahou, J., Coquery, M., and Dabrin, A. (2015). Improved short-term toxicity test protocol to assess metal tolerance in phototrophic biofilms: toward standardization of PICT approaches. Environ. Sci. Pollut. Res. 22, 4037–4045. doi: 10.1007/s11356-014-3505-4
Laviale, M., Morin, S., and Créach, A. (2011). Short term recovery of periphyton photosynthesis after pulse exposition to the photosystem II inhibitors atrazine and isoproturon. Chemosphere 84, 731–734. doi: 10.1016/j.chemosphere.2011.03.035
Lockert, C. K., Hoagland, K. D., and Siegfried, B. D. (2006). Comparative sensitivity of freshwater algae to atrazine. Bull. Environ. Contam. Toxicol. 76, 73–79. doi: 10.1007/s00128-005-0891-9
Magnusson, M., Heimann, K., Quayle, P., and Negri, A. P. (2010). Additive toxicity of herbicide mixtures and comparative sensitivity of tropical benthic microalgae. Mar. Pollut. Bull. 60, 1978–1987. doi: 10.1016/j.marpolbul.2010.07.031
McClellan, K., Altenburger, R., and Schmitt-Jansen, M. (2008). Pollution-induced community tolerance as a measure of species interaction in toxicity assessment. J. Appl. Ecol. 45, 1514–1522. doi: 10.1111/j.1365-2664.2008.01525.x
Murray, K. E., Thomas, S. M., and Bodour, A. A. (2010). Prioritizing research for trace pollutants and emerging contaminants in the freshwater environment. Environ. Pollut. 158, 3462–3471. doi: 10.1016/j.envpol.2010.08.009
Nestler, H., Groh, K. J., Schönenberger, R., Behra, R., Schirmer, K., Eggen, R. I. L, and Suter, M. J. F. (2012). Multiple-endpoint assay provides a detailed mechanistic view of responses to herbicide exposure in Chlamydomonas reinhardtii. Aquat. Toxicol. 110–111, 214–224. doi: 10.1016/j.aquatox.2012.01.014
Newman, M. C., and McCloskey, J. T. (1996). Time-to-event analyses of ecotoxicity data. Ecotoxicology 5, 187–196. doi: 10.1007/BF00116339
Okamura, H., Aoyama, I., Ono, Y., and Nishida, T. (2003). Antifouling herbicides in the coastal waters of western Japan. Mar. Pollut. Bull. 47, 59–67. doi: 10.1016/S0025-326X(02)00418-6
Pesce, S., Bouchez, A., and Montuelle, B. (2011). “Effects of organic herbicides on phototrophic microbial communities in freshwater ecosystems,” in Whitacre, Reviews of Environmental Contamination and Toxicology, ed D. M. (New York, NY: Springer), 87–124.
Pesce, S., Lissalde, S., Lavieille, D., Margoum, C., Mazzella, N., Roubeix, V., et al. (2010a). Evaluation of single and joint toxic effects of diuron and its main metabolites on natural phototrophic biofilms using a pollution-induced community tolerance (PICT) approach. Aquat. Toxicol. 99, 492–499. doi: 10.1016/j.aquatox.2010.06.006
Pesce, S., Margoum, C., and Montuelle, B. (2010b). In situ relationships between spatio-temporal variations in diuron concentrations and phototrophic biofilm tolerance in a contaminated river. Water Res. 44, 1941–1949. doi: 10.1016/j.watres.2009.11.053
Pinto, E., Sigaud-Kutner, T. C. S., Leitao, M. A. S., Okamoto, O. K., Morse, D., and Colepicolo, P. (2003). Heavy metal-induced oxidative stress in algae. J. Phycol. 39, 1008–1018. doi: 10.1111/j.0022-3646.2003.02-193.x
Rabiet, M., Margoum, C., Gouy, V., Carluer, N., and Coquery, M. (2010). Assessing pesticide concentrations and fluxes in the stream of a small vineyard catchment - Effect of sampling frequency. Environ. Pollut. 158, 737–748. doi: 10.1016/j.envpol.2009.10.014
Ricart, M., Barceló, D., Geiszinger, A., Guasch, H. M. L. D., Alda, Romaní, A. M, Villagrasa, M., et al. (2009). Effects of low concentrations of the phenylurea herbicide diuron on biofilm algae and bacteria. Chemosphere 76, 1392–1401. doi: 10.1016/j.chemosphere.2009.06.017
Rutherford, A. W., and Krieger-Liszkay, A. (2001). Herbicide-induced oxidative stress in photosystem II. Trends Biochem. Sci. 26, 648–653. doi: 10.1016/S0968-0004(01)01953-3
Sabater, S., Guasch, H., Ricart, M., Romaní, A., Vidal, G., Klünder, C., and Schmitt-Jansen, M. (2007). Monitoring the effect of chemicals on biological communities. The biofilm as an interface. Anal. Bioanal. Chem. 387, 1425–1434. doi: 10.1007/s00216-006-1051-8
Schreiber, U., Quayle, P., Schmidt, S., Escher, B. I, and Mueller, J. F. (2007). Methodology and evaluation of a highly sensitive algae toxicity test based on multiwell chlorophyll fluorescence imaging. Biosens. Bioelectron. 22, 2554–2563. doi: 10.1016/j.bios.2006.10.018
Sharma, P., Chopra, A., Cameotra, S. S, and Suri, C. R. (2010). Efficient biotransformation of herbicide diuron by bacterial strain Micrococcus sp. PS-1. Biodegradation 21, 979–987. doi: 10.1007/s10532-010-9357-9
Tang, J. X., Hoagland, K. D., and Siegfried, B. D. (1997). Differential toxicity of atrazine to selected freshwater algae. Bull. Environ. Contam. Toxicol. 59, 631–637. doi: 10.1007/s001289900526
Tlili, A., Bérard, A., Roulier, J-L., Volat, B., and Montuelle, B. (2010). PO dependence of the tolerance of autotrophic and heterotrophic biofilm communities to copper and diuron Aquat. Toxicol. 98, 165–177. doi: 10.1016/j.aquatox.2010.02.008
Tlili, A., Dorigo, U., Montuelle, B., Margoum, C., Carluer, N., Gouy, V., et al. (2008). Responses of chronically contaminated biofilms to short pulses of diuron. an experimental study simulating flooding events in a small river. Aquat. Toxicol. 87, 252–263. doi: 10.1016/j.aquatox.2008.02.004
Keywords: bioassay, herbicide, microbial ecotoxicology, periphyton, photosynthesis, pulse, TRC
Citation: Morin S, Chaumet B and Mazzella N (2018) A Time-Dose Response Model to Assess Diuron-Induced Photosynthesis Inhibition in Freshwater Biofilms. Front. Environ. Sci. 6:131. doi: 10.3389/fenvs.2018.00131
Received: 14 June 2018; Accepted: 16 October 2018;
Published: 02 November 2018.
Edited by:
Fabrice Martin-Laurent, Institut National de la Recherche Agronomique (INRA), FranceReviewed by:
Pablo Campo, Cranfield University, United KingdomAhmed Tlili, Swiss Federal Institute of Aquatic Science and Technology, Switzerland
Copyright © 2018 Morin, Chaumet and Mazzella. This is an open-access article distributed under the terms of the Creative Commons Attribution License (CC BY). The use, distribution or reproduction in other forums is permitted, provided the original author(s) and the copyright owner(s) are credited and that the original publication in this journal is cited, in accordance with accepted academic practice. No use, distribution or reproduction is permitted which does not comply with these terms.
*Correspondence: Soizic Morin, c29pemljLm1vcmluQGlyc3RlYS5mcg==