 Jeroen P. van Leeuwen1Rachel E. Creamer2Daniel Cluzeau3
 Marko Debeljak4Fabio Gatti5Christian B. Henriksen6Vladimir Kuzmanovski4
 Cristina Menta5
 Guénola Pérès7Calypso Picaud8Nicolas P. A. Saby9
 Aneta Trajanov4
 Isabelle Trinsoutrot-Gattin10
 Giovanna Visioli5
 Michiel Rutgers11*
- 1Mathematical and Statistical Methods Group, Department of Plant Sciences, Wageningen University and Research, Wageningen, Netherlands
- 2Soil Biology Group, Department of Environmental Sciences, Wageningen University and Research, Wageningen, Netherlands
- 3UMR EcoBio, University of Rennes, Paimpont, France
- 4Department of Knowledge Technologies, Jozef Stefan Institute, Ljubljana, Slovenia
- 5Department of Chemistry, Life Sciences and Environmental Sustainability, University of Parma, Parma, Italy
- 6Department of Plant and Environmental Sciences, Faculty of Science, University of Copenhagen, Taastrup, Denmark
- 7UMR SAS, Agrocampus Ouest, INRA Rennes, Rennes, France
- 8INRA Observatoire du Développement Rural, Toulouse, France
- 9INRA Infosol, Orléans, France
- 10UniLaSalle, AGHYLE, Rouen, France
- 11National Institute for Public Health and the Environment, Bilthoven, Netherlands
Soil biodiversity and habitat provisioning is one of the soil functions that agricultural land provides to society. This paper describes assessment of the soil biodiversity function (SB function) as a proof of concept to be used in a decision support tool for agricultural land management. The SB function is defined as “the multitude of soil organisms and processes, interacting in an ecosystem, providing society with a rich biodiversity source and contributing to a habitat for aboveground organisms.” So far, no single measure provides the full overview of the soil biodiversity and how a soil supports a habitat for a biodiverse ecosystem. We have assembled a set of attributes for a proxy-indicator system, based on four “integrated attributes”: (1) soil nutrient status, (2) soil biological status, (3) soil structure, and (4) soil hydrological status. These attributes provide information to be used in a model for assessing the capacity of a soil to supply the SB function. A multi-criteria decision model was developed which comprises of 34 attributes providing information to quantify the four integrated attributes and subsequently assess the SB function for grassland and for cropland separately. The model predictions (in terms of low—moderate—high soil biodiversity status) were compared with expert judgements for a collection of 137 grassland soils in the Netherlands and 52 French soils, 29 grasslands, and 23 croplands. For both datasets, the results show that the proposed model predictions were statistically significantly correlated with the expert judgements. A sensitivity analysis indicated that the soil nutrient status, defined by attributes such as pH and organic carbon content, was the most important integrated attribute in the assessment of the SB function. Further progress in the assessment of the SB function is needed. This can be achieved by better information regarding land use and farm management. In this way we may make a valuable step in our attempts to optimize the multiple soil functions in agricultural landscapes, and hence the multifaceted role of soils to deliver a bundle of ecosystem services for farmers and citizens, and support land management and policy toward a more sustainable society.
Introduction
Soil is an extremely valuable resource for life on our planet. Soils contribute essentially to agricultural productivity, the environmental cycling of energy, carbon and nutrients, water regulation, climate regulation, disease suppressiveness, natural attenuation and purification, and the provision of biodiverse communities below–and aboveground. Ongoing human activities form severe threats to our soils, in terms of land use change, soil contamination, soil degradation, desertification, and soil sealing leading to the loss of the soils functionality for ecosystems and mankind (JRC, 2010a; FAO ITPS, 2015; Orgiazzi et al., 2016).
In the last decades, starting with a monodimensional view on soil health (e.g., Doran and Zeiss, 2000), soil quality has been increasingly approached by expressing it in terms of the capacity of the soil to deliver multiple ecosystem services (e.g., Lavelle et al., 2006; Dominati et al., 2010; Mulder et al., 2011; Robinson et al., 2013; Schulte et al., 2014; Baveye et al., 2016; Keesstra et al., 2016; Vogel et al., 2018). The reason to do so lies in our ambition to use, protect and manage our soils in such a way that the soil sustainably delivers the ecosystem services we request. This approach implies that in order to make our soil management effective and successful, we should have measurable indicators of the soil's contribution to independently deliver a suite of ecosystem services, in this study we use the term soil functions. For some soil functions relatively easy indicators can be used, for example agricultural yield for the agricultural productivity service. For other soil functions it becomes more difficult. For example, soil as environmental buffer for nutrients should be based on the multidimensional complex of nutrient pools and fluxes present in soil at several spatial and temporal scales, and the interplay among them.
A soil function that poses also a challenge for defining measurable and understandably indicators of the provision of ecosystem services by the soil is the so-called habitat function, i.e., the provision of habitats for species rich communities, below as well as aboveground. Belowground, soils harbor an incredible amount of organisms with a vast diversity exceeding that in all other environmental compartments (Orgiazzi et al., 2016). The soil biota are seen as key players in many soil functions, such as nutrient cycling and carbon sequestration, but are thought to be also important for the soil as habitat for aboveground biological diverse communities (Lavelle et al., 2006; Mulder et al., 2011).
In the H2020 project LANDMARK (Land Management: Assessment, Research, Knowledge base), “Soil biodiversity and habitat provision” (SB) is one of the five soil functions that is considered as part of sustainable land management (Schulte et al., 2014). One of the aims of the LANDMARK project is to come up with science based sustainable soil management schemes, with the development of five indicators for the various soil functions. In this issue, these indicators are presented in a set of articles.1 The fifth soil function indicator was published earlier (Schröder et al., 2016). Up until now no formula or index to quantify soil biodiversity that is universally accepted and applicable (Bastida et al., 2006; Bünemann et al., 2018) and no comprehensive decision-support model for the assessment of SB is available (Havlicek, 2012). This is due to the lack of a clear and accepted definition of the SB function, to the low standardization in soil biological methods, and to the difficulties in addressing spatial scale (Bastida et al., 2006). Hence we lack affordable, yet robust and reliable, proxy-indicator systems for the SB function that capture the different dimensions of the SB function, such as presence, abundance and activity of the soil organisms, soil ecosystem process rates, and the provision of habitats for aboveground species rich communities (Maes et al., 2016; Yu et al., 2017). Many contributions in the field of soil ecology have only focused on separate species of functional groups of organisms, for instance earthworms (Lavelle et al., 2006), micro-arthropods (Parisi et al., 2005; Menta et al., 2011, 2018), nematodes (Yeates et al., 1997), microorganisms (Winding et al., 2005; Bloem et al., 2006; Romaniuk et al., 2011). On the other side of the scientific spectrum, there have been built complex models for soil functioning and biodiversity which need a vast amount of essential soil attribute information, making these models less appropriate for routine analysis (De Ruiter et al., 1993; Mulder et al., 2011). An exception is the approach by Lima et al. (2013) who showed practical options to reduce the number of indicators while retaining enough discriminatory power to assess soil quality. This analysis did however only include a small part of soil biodiversity (microbes, earthworms) neglecting the presence and abundance of e.g., nematodes and micro-arthropods, which makes it, in our view, less appropriate for the assessment of the SB function. In addition, important aspects of soil management were not assessed in the analysis.
The present paper describes a novel approach to assess the SB function and its first application on two soil datasets covering information on soil biodiversity, soil ecosystem functioning, and soil management. These datasets comprise of 137 grassland soils in the Netherlands and 52 soils in France (Brittany), of which 29 grasslands and 23 croplands.
Basic in the proposed approach is our working definition of SB as “the multitude of soil organisms and processes, interacting in an ecosystem, providing society with a rich biodiversity source and contributing to a habitat for above ground organisms” (Box 1).
Box 1. The multitude of soil organisms and processes, interacting in an ecosystem, making up a significant part of the soil's natural capital and providing society with a wide range of ecosystem services.
Dissecting the definition:
1. Multitude of soil organisms: this comprises communities, populations, species, genes, molecules and enzymes. It is focusing specifically on the living parts of the soil.
2. Processes: this comprises ecological processes.
3. Interacting in an ecosystem: together with 1 and 2 this comprises dynamics, food webs, trophic interactions, non-trophic interactions, and soil habitat characteristics.
4. Natural capital: this links the soil function to the stocks of soil biodiversity and to contributions to the habitat for above ground organisms (Maes et al., 2013).
5. Providing society with soil-related ecosystem services: this configures the soil function for usage in National Ecosystem Assessments (Maes et al., 2013), and contributes to solving the Sustainable Development Goals (Dominati et al., 2010; Mulder et al., 2011; Robinson et al., 2013; Baveye et al., 2016; Keesstra et al., 2016).
The approach toward the SB function will be specifically focused on the community of soil organisms, including trophic and non-trophic interactions of soil organisms, together with habitat modifying properties such as nutrient availability, and physical and chemical soil conditions. In this way the definition of the SB function also captures aboveground biodiversity, e.g., in terms of diversity in plant communities (e.g., De Deyn and Van Der Putten, 2005), or bird populations (e.g., Roodbergen et al., 2008).
The search for an indicator for the SB function has recently gained momentum given the goals of the Convention on Biological Diversity (CBD) and the Sustainable Development Goals (SDGs) (Keesstra et al., 2016). In addition, the recently held UN-CBD meeting (COP 14) has requested the FAO to perform a world-wide assessment of soil biodiversity by 2020.
Our methodology will approach the SB function by gathering information on soil biodiversity in a multi-attribute manner. In our approach we assembled attributes for an indicator system of the SB function using a hierarchical structure of four integrated attributes: (1) soil nutrient status, (2) soil biological status, (3) soil structure, and (4) soil hydrological status, following Van Leeuwen et al. (2017). The total amount of soil information provided by these four integrated attributes was used to assess the SB function together with the assessment of four other soil functions using partly the same input data in order to support farmers and farm advisors at local scale and policymakers at regional scales.
The proposed approach is meant to be seen as a first attempt and as a proof of concept. Upon further development additional attributes may foster an improved soil function assessment. As a first attempt we have restricted our concept to focus on belowground biodiversity and soil ecosystem processes, excluding information on aboveground biodiversity. As proof of concept we will compare the outcome of the proposed methodology with an alternative assessment of the soil SB function based on expert judgement for 137 grasslands in the Netherlands (Mulder et al., 2005b; Rutgers et al., 2009; Schouten et al., 2014) as well as for 52 sites in Brittany France (Cluzeau et al., 2012; Ponge et al., 2013; Villenave et al., 2013).
Materials and Methods
Structure of the Decision Model (DEX Model)
We developed a decision model according to the DEX (decision expert) model structure (Bohanec et al., 2007) to quantify the capacity of a soil to supply the function soil biodiversity and habitat provision (SB function). The model quantifies the capacity of a soil to support the supply SB function at three levels, i.e., low, moderate or high. The structure of the model has the form of a Multi-Criteria Decision Analysis, including quantifiable or measurable “attributes” of the soil combined with expert judgement (Debeljak et al., this issue). Within the DEX model we developed two sub-models, one for grassland and one for cropland, as they function very differently with respect to the management attributes. Approaching grasslands and croplands in the same way would reduce the versatility and sensitivity of the model for the SB function and limit the provisioning of useful advice to farmers and other stakeholders.
In total, 32 (grassland model) or 31 (cropland model) attributes (Table 1, Figure 1), were combined in a hierarchical DEX model to make a first-tier assessment of the SB function. Data availability may sometimes be limited (especially for the biological attributes) leading to an incomplete set of attributes to make an assessment. For this reason, we implemented a no data category for these attributes, to ensure that the model is able to provide a performance estimate despite incomplete input data, responsibly addressing the amount of information that is available in the remaining quantified attributes. Obviously, the model output improves considerably, the more input data are available.
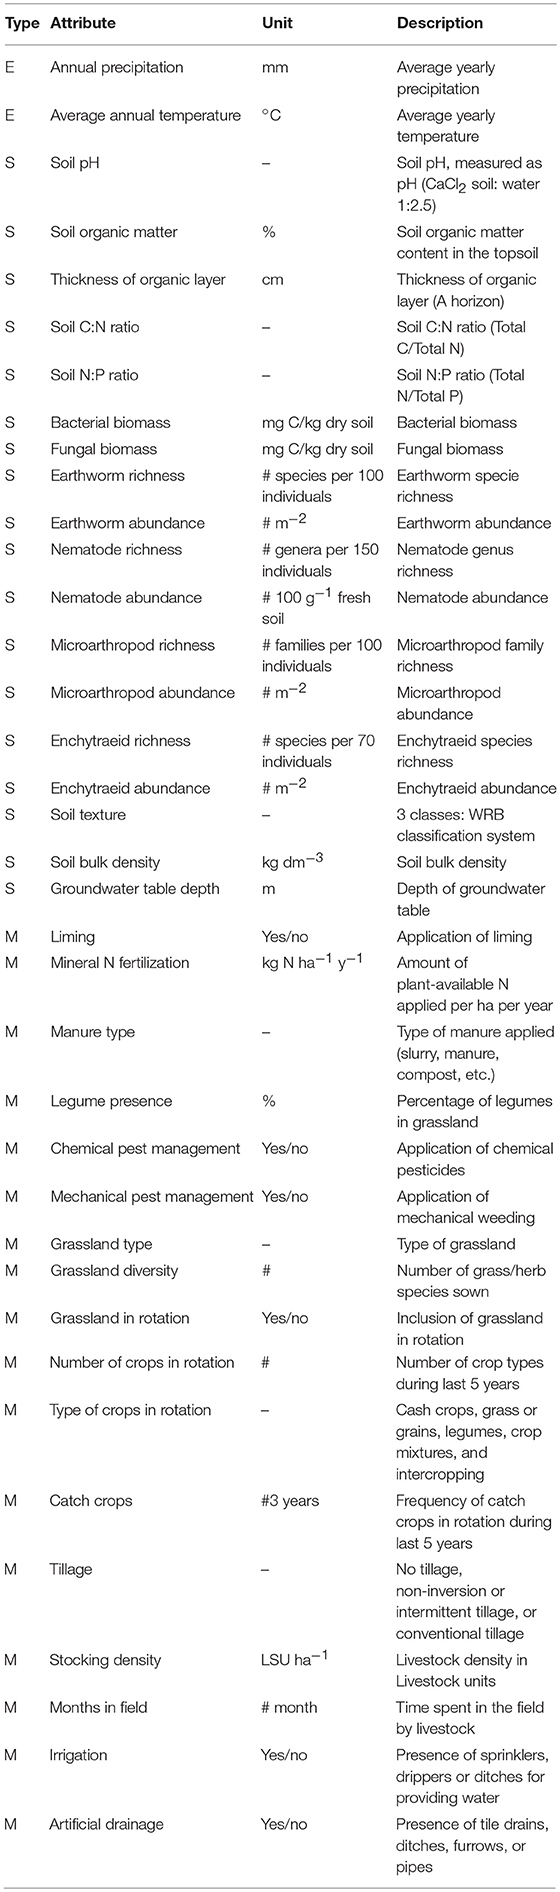
Table 1. Description of attributes used in the decision model of soil biodiversity and habitat provisioning and their respective units used.
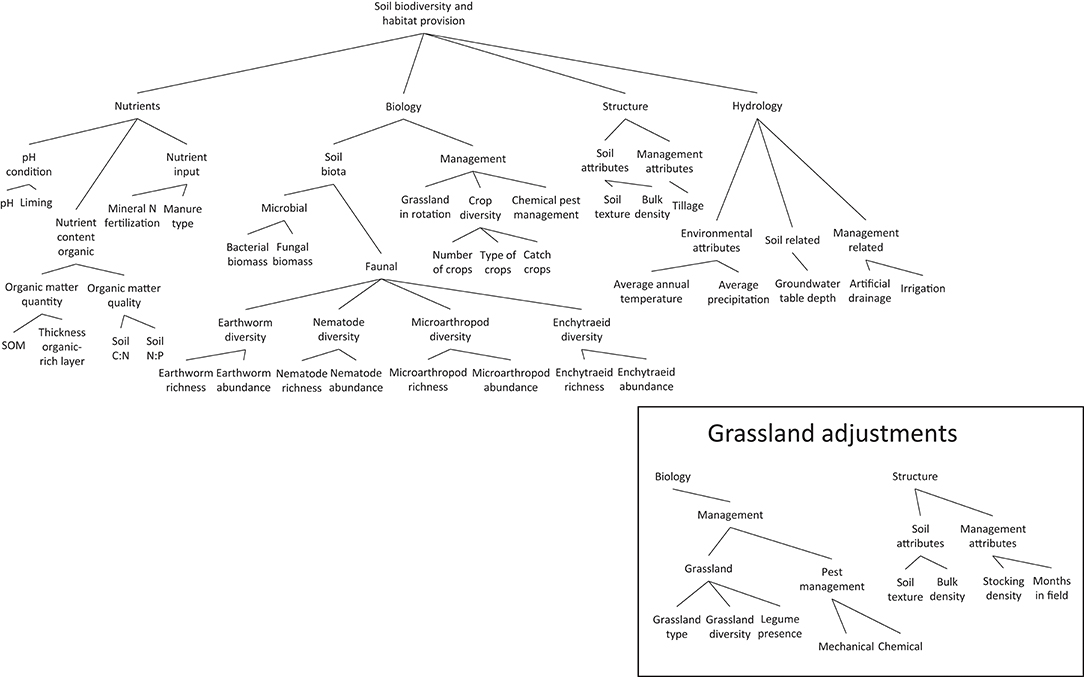
Figure 1. Cropland model structure, showing the build-up of the soil function from basic attributes, via one or more aggregation steps, into four “integrated attributes” and finally to the holistic assessment of the SB function. Some of the management attributes in the integrated attributes biology and structure were changed to adjust the model to grassland cases (inset).
An attribute is defined as a piece of quantifiable information of the ecosystem, including the information from the environment, climate, hydrology, geographic characteristics, land and soil management and which can be used to quantify and to assess the SB function. Only attributes that can be linked in a statistical or mechanistic way to the SB function were used in these models. The models distinguish attributes in three categories, i.e., soil properties (S), environmental factors (E), and management practices (M). These attributes together fill the S × E × M matrix (Turbé et al., 2010; Schulte et al., 2014; Vogel et al., 2018). This three-dimensional matrix addresses the interrelationships between the various attributes. Soil properties (S) include static attributes such as soil texture, and dynamic attributes, such as soil biological attributes (e.g., soil organism abundance, richness) and soil organic matter content. S attributes can have a different effect on the SB function depending on the value of environmental (E), for example climatic zone, and management (M) attributes, for example application of manure or tillage. Similarly, particular management practices can be highly valued in one climatic zone, but may have little influence in other climatic zones. These differences in the model between climatic zones are not visible in the model structure, but threshold values have been created (based on available literature and expert knowledge) for each climatic zone separately, marking model responses as low, moderate or high per attribute (Table 2). Hence, the absolute value for any one attribute, may fall into category “high” in one climatic zone but “moderate” or even “low” in another climatic zone (for example, a soil pH(CaCl2) of 5 is considered “moderate” in the Atlantic zone, but “low” in the Mediterranean zone) (JRC, 2010b).
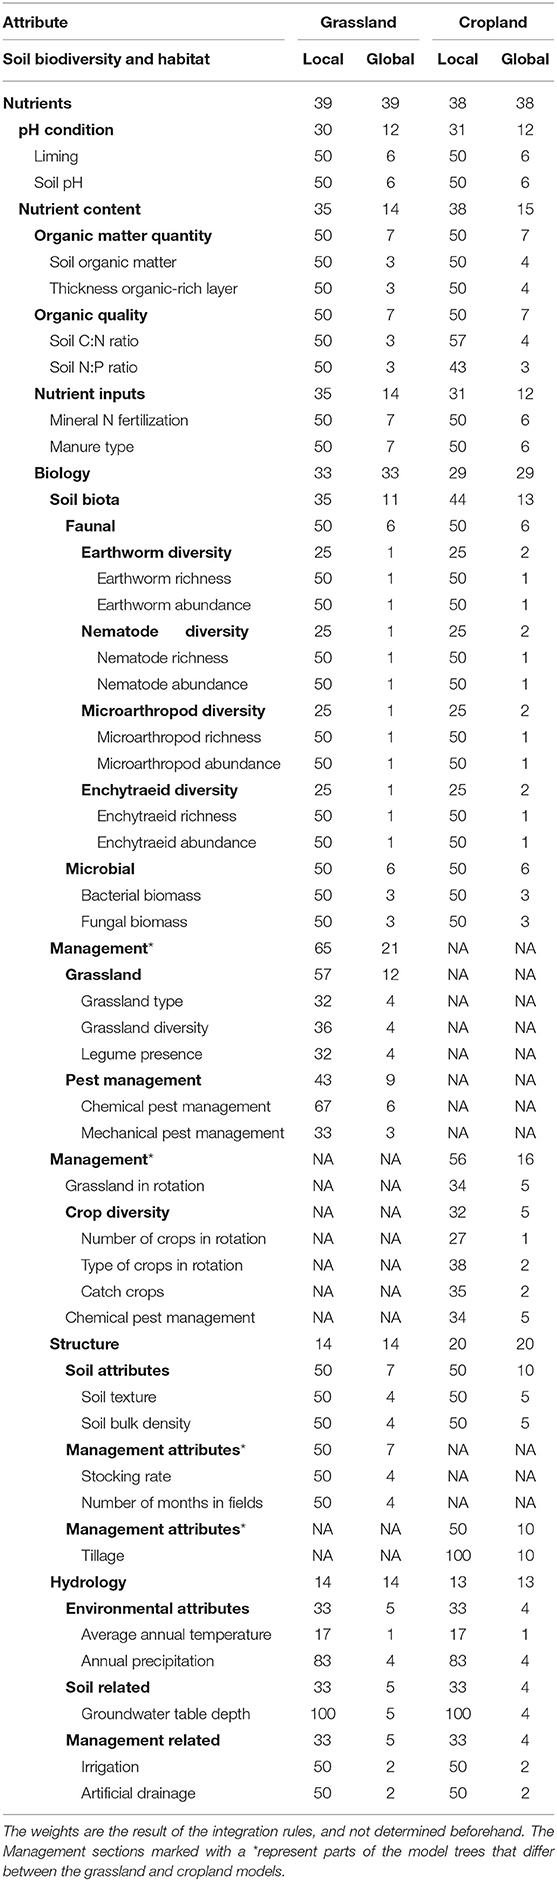
Table 2. Weights of attributes in grassland and cropland models.
Following decision rules according to the method described by Bohanec et al. (2007) and Debeljak et al. (this issue) the basic attributes appear as the leaves of a decision tree and these are aggregated at multiple steps into small branches and then larger branches. The largest branches of the decision tree are referred to as “integrated attributes” (Figure 1). Four integrated attributes exist in the DEX model: (1) soil nutrient status: representing the pools and fluxes and availability of nutrients for plants and soil organisms (including C, N, P, K, and micronutrients); (2) soil biodiversity status: representing diversity, abundance, and activity of soil organisms and related management practices; (3) soil structure: representing information on soil structure, ranging from mesoscale (coarse fractions, soil texture classes, organic matter, air and water-filled space, density, and compaction) to macroscale (soil layers, terrain, slope); and (4) soil hydrological status: representing all processes and elements that contain information on the hydrological status of the soil, such as humidity, the flows of water, and drainage status. The combination of these four integrated attributes together provide the information for the assessment of the SB function in terms of “low,” “moderate,” and “high.”
The decision rules of the model were defined by soil ecology experts (i.e., the authors of this paper, with the exception of Guenola Pérès who was an independent expert for the French sites). The threshold and categorical values of attributes to be used in the decisions rules can be found in Table S1 (Supplementary section). At each stage of branching of the model, integration rules apply, for example, a “high” earthworm abundance and “low” earthworm richness lead to “moderate” earthworm diversity (Rutgers et al., 2016). Another example is that in acidic soils liming leads to a higher soil biodiversity, in particular for earthworms (McCallum et al., 2016). In this process of integrating attributes, some attributes were considered as more important than others, and thereby having a larger effect in the decision rules. The weights (importance) of attributes are presented in Table 2. There are two types of weights. Local weights represent the importance of an attribute for the following (or next) aggregated attribute, for example earthworm abundance and richness each count for 50% of earthworm diversity, at the next level of attributes, which by itself counts for 25% of the next level attribute “faunal.” Global weights represent the importance of the attribute in the overall model, for example earthworm abundance then only determines 1% of the overall model output.
Two sub-models were developed, one for croplands (Figure 1) and one for grasslands (Figure 1-inset), which differed in incorporation of specific management practices, e.g., tillage and crop rotation characteristics in the cropland model, grazing and grass management characteristics in the grassland model. Also the threshold values of some attributes classifying data in low, moderate, or high classes are different between models. For example, in grassland most values of biological attributes (abundances, richness) are higher than in cropland due to the often lower agricultural land use intensity (Eggleton et al., 2005; Plassart et al., 2008; Rutgers et al., 2009; Cluzeau et al., 2012; Tsiafouli et al., 2015), and threshold values were set accordingly (higher in grasslands).
Netherlands Soil Monitoring Network Expert Assessment
As comparison for the DEX model we used a soil biodiversity/quality assessment obtained by expert judgements. The outcome of the DEX model for the 137 Dutch sites were compared with the expert ranking of the data from the Netherlands Soil Monitoring Network [NSMN; (Mulder et al., 2005a; Rutgers et al., 2009)]. In the NSMN biological and chemical soil attributes and land management attributes were analyzed in a routine procedure, each year with a sampling period in the spring (March–June) at approximately 40 sites. The monitoring and sampling design is described in Rutgers et al. (2009). In total, data from 137 grasslands (for dairy farming) on sand were selected from the first monitoring cycle from 1999 to 2003. This set was selected because some additional data on land management were also available. Four types of grasslands of dairy farms were present in the dataset: organic, conventional, intensive, and extensive dairy farms with an additional livestock system (pigs and/or poultry).
Eight professionals involved in the NSMN with track records in soil quality assessment were asked to use their expertise in soil and land management attributes and independently rank this set of 137 sites according to their estimation of the performance of the SB function. The judgements were based on biological information, including presence, abundance, activity and diversity of enchytraeids, earthworms, nematodes, micro-arthropods, bacteria, and soil management, including percentage of grassland and livestock density. For more details regarding the methods for analyzing the underlying data in the NSMN see Rutgers et al. (2009).
The following rules were applied for the ranking (between brackets the weight factor of the information contributing to the attribute score) (Schouten et al., 2014):
• Enchytraeid community: number of genera (2), abundance (4), percentage of Friderica species (1), Functional group diversity [1/ sum (0.0001+N∧2)] (2)
• Earthworm community: abundance (4), number of taxa (2) percentage of litter decomposers (2) percentage of anecic earthworms (2), functional group diversity (1)
• Nematode community: abundance (1), Shannon diversity (3), Maturity index 2–5 (3), plant parasitic index (2), 1-NCR (nematode channel ratio) (2), percentage of CP1 nematodes (2), abundance of carnivore plus omnivore nematodes (1)
• Micro-arthropod community: total abundance (1), abundance of a-sexual long living micro-arthropods (1), abundance of phoretic species (1), abundance of nematode predators (1), abundance of general predators (1), abundance of parasite micro-arthropods (1), abundance of fungivore browsers (1)
• Bacterial processes: bacterial biomass (1), potential N mineralization rate (2)
• Bacterial metabolic diversity: hillslope of the community level physiological profile (CLPP) (1)
• Management attributes: percentage of grassland (1), 1/(livestock density) (1)
First, the 137 sites were ranked for each sub attribute. Subsequently the ranking score was multiplied by a weighting factor (also based on expert judgement) leading to a total score for all attributes and their weighting factors. Although the NSMN methodology includes valuation on the basis of management, information regarding management was sometimes missing, hence this was in this case not taken into account for the final ranking. The final ranking was used as an expert driven dataset with information on soil quality for the evaluation of the DEX model.
French (Brittany) Soil Biodiversity Monitoring Network Expert Assessment
A second dataset used for the comparison with output from the DEX model was obtained from the Soil Biodiversity Monitoring Network (RMQS-BioDiv) which is part of the French Soil Monitoring Network (RMQS). The RMQS was established to provide a national framework for observing changes in soil quality across France (Arrouays et al., 2002) and consisted of 2,200 sites located at the nodes of a 16-km grid that covered the French Metropolitan Territory. The RMQS-BioDiv is part of the RMQS but limited to the region of Brittany (West of France) and consisted of a total of 109 sites (https://ecobiosoil.univ-rennes1.fr/page/programme-rmqs-biodiv). Biological attributes were collected in 2006 or 2007 during the spring season, with sampling design and sampling protocol as described in (Cluzeau et al., 2012). Chemical and physical attributes correspond to the topsoil samples (0–30 cm) from Atlantic Central (Metzger et al., 2005) that were sampled as described previously in Martin et al. (2009). For environmental attributes, climatic data were obtained by interpolating observational data using the SAFRAN model (Quintana-Segui et al., 2008). The RMQS-BioDiv data were linked to the climatic data by finding for each RMQS site the closest node within the 12 × 12 km2 climatic grid and then averaged for the 1990–2016 period. Altitude and slope information were derived from a digital elevation model (USGS, 2004). The crop attributes and management practices from the last 5 years, including the year in which the biodiversity was studied, were collected by an agricultural survey with the farmers. Due to differences in management information from one site to another, the percentage of legumes and catch crops in the rotation were calculated on maximum 5 years or less (if less information was available). In total, from the 109 sites, 52 sites (29 grasslands, 23 croplands) were selected where both biological attributes and other attributes were available.
The expert judgement of RMQS-BioDiv was carried out independently by one of the co-authors (GP) in order to evaluate this set of 52 sites. The evaluation was done following a separate expert judgement using an a priori approach. The judgments were based on (i) biological information including presence, abundance, and richness of earthworms, nematodes, bacteria, (ii) management attributes including fertilization (mineral vs. organic, solid vs. liquid), grazing and mowing intensity, percentage of grassland, tillage, type of crops, (iii) soil properties including pH, organic matter content, bulk density and organic layer thickness. The thresholds used were independent from those used for the NSMN sites.
The following rules were applied for the evaluation (between brackets the weight of factor of the information contributing to the attributes score, based on expert judgement):
• Earthworm community: abundance (4), number of taxa (2)
• Nematodes community: abundance (1), Shannon diversity (3)
• Bacterial processes: bacterial biomass (1)
• Management attributes: fertilization (3), grazing and mowing intensity (1), percentage of grassland (3), tillage (3), type of crop (1)
• Soil properties: pH (1), organic matter content (1), bulk density (1) and organic layer thickness (1).
The sites were ranked based on the sum of weighted attributes, and the cut-off between high, moderate and low evaluations was based on quantiles, i.e., the highest 13 sites (1st quantile), were ranked as “high,” the lowest 13 sites (4th quantile) were ranked as “low,” and the 26 sites in between as “moderate.”
Statistical Comparison
The analyses of the two test datasets both produced values of the performance of the SB function in terms of “low,” “moderate” and “high.” For the Netherlands dataset we made two comparisons between the output of the two approaches, one for the full set of 137 farms, and one for a subset of 50 farms (top and bottom 25 farms from the ranked list). The two stage process was adopted because we expected a large variation in the assessments which resulted in moderate and low performance (see discussion section). For the French data-set we made one comparison of the two approaches using all 52 soils and by distinguishing the SB is the three categories “low,” “moderate” and “high.” For all comparisons, we calculated three measures of similarity in output. First, we calculated the Pearson correlation coefficients between the two outputs (DEX model and expert weighted ranking) (scoring low as “1,” moderate as “2” and high as “3”). Second, we quantified a similarity index in output by assigning values to the fit, i.e., a score of “+1” when both outputs had the same performance, a score of “0” when the two outputs gave different, but not contrasting performance, i.e., “low” vs. “moderate,” or “moderate” vs. “high,” and a score of “−1” when the two outputs predict contrasting performance, i.e., “low” vs. “high.” When both outputs produced completely random results, the overall value is slightly positive (0.11). Third, we counted the number of perfect fits, i.e., the percentage of “+1” scores. With random models this percentage would be 33.3%.
In addition, we performed a sensitivity analysis of the DEX model for missing data and for the contribution of each category of attributes. For each of the sensitivity runs we calculated all three values of similarity between the results of the DEX model in comparison to the expert weighted rankings.
Results
A multi-attribute DEX model was built for quantifying the SB function with two sub-models for grassland and cropland management systems. To complement the assemblage of DEX models for three other soil functions (described elsewhere in this issue). Together with the nutrient cycling and regulation function of soils (Schröder et al., 2016) this set of five soil functions embraces the major contributions of soils to deliver a coherent set of most important ecosystem services to society.
Model Performance
The comparison between the DEX model and the ranking based on expert judgement was made for both the 137 grassland soils from the Netherlands (Schouten et al. (2014) and for the 52 soils from Brittany France. For the Dutch soils, two comparisons were made, one using all 137 sites, using the categories “low,” “moderate,” and “high” (Figure 2), and one using the 25 “low” ranked and 25 “high” ranked sites. For the French soil only a comparison using all 52 sites was made, and using the same categories as the Dutch sites, i.e., “low,” “moderate,” and “high” (Figure 3).
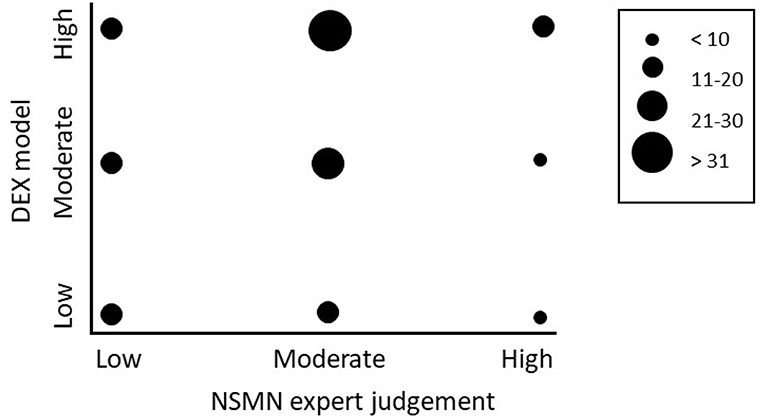
Figure 2. Comparison of the output of the DEX model with the expert judgements on 137 sites in the NSMN in the Netherlands. In the ranking of the sites, the top 25 was classified as “high performance,” the bottom 25 sites were scored as “low performance” and all in between as “moderate.” Bubbles represent the number of sites scoring a particular combination.
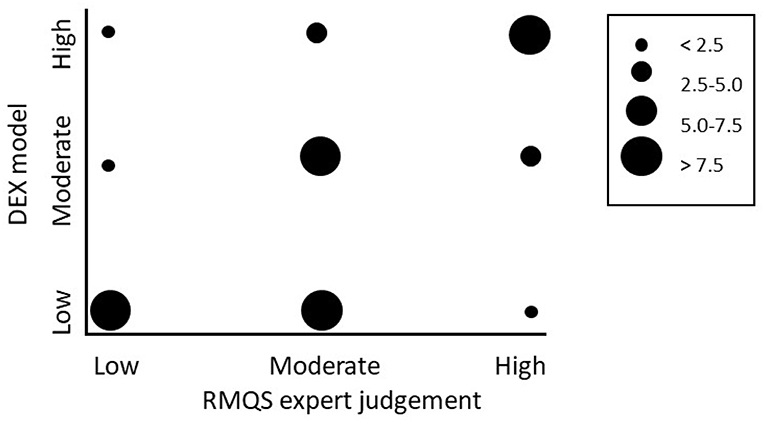
Figure 3. Comparison of the output of the Decision support model with the expert judgements on the 52 soils from sites in the RMQS in Brittany France. In the ranking of the sites, 13 sites were classified as “high” performance, 13 sites were scored as “low” performance and all in between (26 sites) as “moderate.” Bubbles represent the number of sites scoring a particular combination.
For the 137 sites from The Netherlands we found a statistically significant positive Pearson correlation coefficient between the model and the expert weighted ranking (r = 0.35, p < 0.01), with 43% correctly evaluated (Table 3B). Restricting the analyses to the 25 “low” and 25 “high” sites, we found a higher statistically significant positive Pearson correlation coefficient between the model and the expert weighted ranking (r = 0.53, p < 0.001), with 54% correctly evaluated (Table 3A).
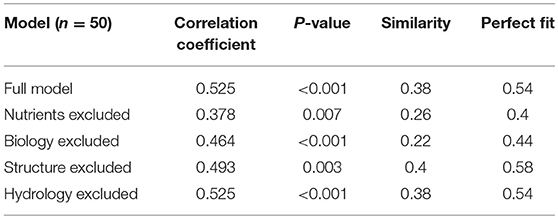
Table 3A. Outcome of the sensitivity analysis using the 25 “low” and 25 “high” sites.
The similarity index value of goodness of fit was made by assigning the value of −1 to sites with a contrasting prediction, the value of 0 to sites that had different predictions, i.e., “low” vs. “moderate” or “moderate” vs. “high, and +1 when both approaches gave the same prediction. Hence, with a random generated model the goodness of fit parameter should be (around) 0 (zero), while if the DEX model predictions and expert weighted rankings always result in the same prediction, the similarity index has a value of 1. Using the 25 “low” ranked and 25 “high” ranked sites we found a similarity index of 0.38 and using the 137 sites a similarity index of 0.37.
For the set of 52 grassland soils from Brittany France we found a significant positive Pearson correlation coefficient between the outcome of the DEX model and the expert weighted rankings (r = 0.57, p < 0.001), with 58% correctly evaluated (Table 3C).
It should be noted that when we had used random models the percentages predicted correctly would have been 33.3% using all sites divided over the three categories, and 50% using the 50 Dutch sites divided over two categories. This means that we have an improved prediction of 4 and 10% for the two analyses of the Dutch sites and an improved prediction of 25% for the French soils.
Sensitivity Analysis
To assess the sensitivity of the model to data inputs we excluded data for each of the four integrated attributes one by one, where the decrease in correlation coefficient gives an indication how much the data is needed for model accuracy. We performed this sensitivity analysis for the Dutch dataset of 25 “low” and 25 “high” sites, for the Dutch sites including all 137 sites, and for the French sites including all 52 sites.
For the 25 “low” and 25 “high” sites the results are given in Table 3A, for the 137 sites in Table 3B, and for the 52 French sites in Table 3C. The clearest conclusion from all analyses is that information on nutrients is critical. This includes dominant attributes such as pH, SOM content, C-N ratio. Also, the high global weight of this integrated attribute explains the relative dominance of information on the nutrient status on the SB function. From the comparison with the French data also the presence of data on soil organisms came out as important. Furthermore, all analyses showed that parameters in the integrated attribute hydrology that were excluded and didn't have any effect were average temperature and average annual precipitation. Excluding data for these parameters leads to default values that are quite similar and did not change the model performance.
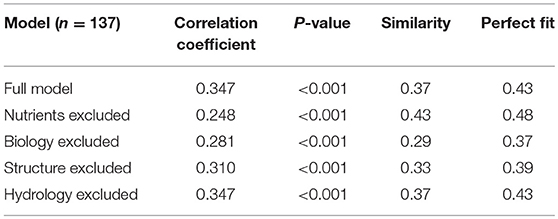
Table 3B. Outcome of the sensitivity analysis using the 137 Dutch sites.

Table 3C. Outcome of the sensitivity analysis using the 52 French sites.
Data for irrigation and drainage were not available for the full model in the Netherlands, but information for these attributes was included for many of the French soils. An important remark here: when data for some attributes is not provided, the model assumes default values, which often represent the moderate category. Hence, if the dataset used for validation contains many farms in the category moderate, removing input values leads to a better fit (the more input values are missing, the higher the change that the model output will be moderate). Therefore, we consider the sensitivity analysis presented in Table 3A as the better assessment, as no moderate farms were included here.
Discussion
The results show that the proposed DEX model for the SB function was meaningful, i.e., the outputs were positively and statistically significant correlated with the rankings based on independent expert judgements on the status of the SB function at 137 grasslands in the Netherlands (sandy soils, Atlantic climate) and 52 sites in France, 29 grasslands and 23 croplands. Yet, in a substantial number of cases the two approaches predicted different performance. When we look at the similarity indices we found values of 0.38 (50 Dutch sites), 0.37 (137 Dutch sites) and 0.54 (52 French sites), all clearly above 0 (zero).
For the Dutch soils, the percentage of correct predictions were relatively low. Using all 137 soil this percentage was 43%, which is 10% higher than the random null model (which would have been 33% correctly predicted by chance), and using the 50 sites it was 58%, again only 8% higher than a random null model (which would have been 50% correctly predicted by chance). The percentage of correct prediction was much higher using the 52 French sites, i.e., 58% which is 25% higher than with a random null model. Overall, we therefore conclude that both the DEX model and the expert weighted ranking seem in line when it comes to the assessment of the SB function.
The differences between the performance of the model with respect to the Dutch and French datasets may arise from three circumstances:
First, looking at the data available for the French sites we might assume that the significantly higher correct prediction is at least partly due to the available information regarding land use and soil management. In the Netherlands, this information had limited availability and was not used for the expert weighted ranking of the sites. Consequently, the ranking in the Netherlands was only based on information from soil biological attributes, which were collected over a larger time span of time (6 years) and from a somewhat larger geographically area which adds to the variation in the observations.
Differences in the methodological approaches can also explain the differences. Differences in sampling protocols can be a reason for differences in performance. For instance, in the Netherlands the samples in the NSMN were mixed at the farm level (Rutgers et al., 2009), while in France the samples in the RMQS were mixed according to small plots with a fixed orientation (Cluzeau et al., 2012).
Interestingly, it seems that soils which were assessed as having a “high” biodiversity were more often predicted right (i.e., as similar in both approaches), than soils with “low” or “moderate” performances. Probably disturbed soils with respect to the SB function are more different from each other than soils with a healthy soil life. One aspect might be the variability in types and levels of disturbances, resulting in differences in disturbed soils, which are more difficult to predict correctly.
The most important category of attribute in the assessment of the SB function was found to be the nutrient status of the soil. This was found for especially the Dutch soils. This clearly shows the interrelationship between the SB function and the nutrient cycling function (Schröder et al., 2016), and the importance of soil pH for soil biodiversity (Griffiths et al., 2016). Although the goodness of fit clearly dropped when leaving out information on soil organisms from the French data, it is interesting to note that the predictions of the DEX model, without information on soil biological attributes, were still significantly positively correlated with the expert judgements based on soil biological information.
The DEX model for the SB function was developed for a European-wide application to assess five soil functions in agricultural soils. However, the present results with the SB function suggest some caution, as there were several major restrictions in this study. First, the comparison was restricted to one climatic zone (Atlantic). Unfortunately, no better independent datasets were available that could have been used as a tool for validation for the other climatic zones. Although the present comparisons were not ideal for testing of the DEX model, we think it is based on the currently best available data and can therefore be seen as a first step of testing the performance of the model. As such it can be a starting point of our future aim to build a comprehensive model for Europe, fully including cropland, all different soil types and climatic zones. Although for some countries detailed data for a large number of attributes is available (for example from the Netherlands, Ireland, and France, dominant in the Atlantic climatic zone), testing the model properly throughout Europe requires data from all (climatic zone × soil type × land use) categories. Recently, the introduction of the General Data Protection Regulation of the EU has however added another complicating factor in gathering and storing management information from farms, limiting the available data sources to be used in European wide biodiversity assessments.
Second, the approach distinguished only three broad output categories (i.e., in “low,” “moderate,” and “high” categories), starting from quantitative data. This has two consequences; on the one hand, the categorization makes the data input less critical, as only classes of values are needed as an input, which is easier to provide, and the output is an estimate of the soils' capacity to support the SB function. On the other hand, the categorization requires a lot of expert knowledge and reference data for setting the threshold values for each attribute within each climatic zone. For example, the soil pH is on average higher in the Mediterranean area than in the Atlantic area, while soil organic matter content shows the opposite pattern (JRC, 2010a).
Furthermore, with only three output categories, the DEX model is insensitive to small changes in the values of the input data for the attributes. Only if a sufficient number of thresholds is passed, a switch to another performance can be expected. Debeljak et al. (this issue) discussed advantages and disadvantages of this. For instance semi-quantitative modeling makes the model easier to run with a simple interface for farmers and farm advisors, the “Soil Navigator.” With the Soil Navigator and the outputs of the DEX models, it is possible to set preferences for soil functions, and explore management options to reach these targets. Finally it is possible to build continuous quantitative models based on the DEX trees for the five soil functions, in order to improve sensitivity.
Third, all the data collected in the datasets used were collected for other reasons than validation of the DEX model (both were part of soil monitoring programs) and therefore present incomplete data inputs which were not optimally designed to test a holistic assessment of the soil biodiversity function, with a broad set of attributes such as compiled in the DEX model. In general, soil data are collected without a solid basis in analyzing soil biological attributes, and very often with no or poor information on soil management attributes, in particular for the Dutch sites. The Dutch soil monitoring system was designed to capture the biological soil attributes, with few attributes for nutrient condition, structure, and hydrologic condition.
The performance of the DEX model might be significantly improved when more data are available about land use and farm management, as can be seen from the results obtained for the French sites. The more data that exists at field, farm or local level and that can be fed into the model, the better the accuracy of the output will be. For example, when more detailed data on soil texture or organic matter quality is available, this can be easily implemented and will most likely improve the model output through reducing uncertainty. Ultimately, the data provided by the farmer, on for example management practices or plant available nutrients at the plot scale, will also lead to better predictions.
The conceptual structure of the DEX model for the SB function is based on the notion that we have to deal with a multidimensional concept for which no unified proxy-indicator system exists, and that we have very few standardized and reliable data for producing quantitative predictions for the SB function. Consequently, any source of information which could be plausibly linked to quantification of the SB function was appreciated, even if the data is of chemical (such as pH, nutrients, water) or physical (such as temperature, slope, soil structure) origin. The idea to use all information there is to quantify soil functions, was also applied in other contributions (Rutgers et al., 2012; Van Wijnen et al., 2012; Wagg et al., 2014). The structure of the decision tree of the DEX model represents an improvement to the former studies, as four integrated attributes were agreed and combined: nutrient status, soil biology status, structure and hydrological status. In this way information from different origins can be transparently processed in a quantification system for the SB function, and new environmental data can also be implemented easier, and reduce uncertainty in the assessment.
Progress in monitoring and improving the SB function of soils will most strongly depend on the farmers' and stakeholders' acceptance of the importance of this function. Even though primary productivity, high yields and short term profitability is bound to be the main focus for contemporary agriculture, there is acknowledgment in the farming community that our intensive way of farming is not sustainable when environmental and public health trade-offs are not taken into account. In order to combat the loss of fertile soil and to counteract these trade-offs, many farmer initiatives are adopted in all EU member states, such as the ‘Initiative Agriculture de conservation in France (https://agriculture-de-conservation.com) and Veldleeuwerik in the Netherlands (www.veldleeuwerik.nl). Based on the LANDMARK stakeholder workshops (Sturel et al., 2018) it is evident that the SB function has a positive connotation for most farmers and is even associated with the concept of life itself, i.e., in Germany and Austria the soil function is recognized as “Soil life” in France as “Living soil” and in Ireland as “Active and healthy soil.” Furthermore, the same stakeholders associate soil biodiversity often to sustaining aboveground biodiversity, thereby adopting the concept of a system approach with living soils as an integral part of healthy ecosystems. For instance, earthworms are the staple feed for some field birds, like the black-tailed godwit in the Netherlands. High metal (Pb, Cu) concentrations in peatland had negative effects on the earthworm community (lower average body weight, and total biomass) with effects accumulating in the bird population (Klok et al., 2006; Roodbergen et al., 2008). Future developments in the assessment of the SB function should addressing this aspect of habitat provision in a broad sense, as in its present form the assessment has no specific linkage to any aboveground biodiversity target (protection of a species, a nature target type, etc.).
In conclusion, the present DEX model predictions of the SB function are converging to the current and combined expert judgements of the SB function. In this way, quantification of the SB function, together with the quantification of the other four soil functions (Schröder et al., 2016; Sandén et al., 2019; and described elsewhere in this issue) is better placed in our attempts to optimize the multiple soil functions in agricultural landscapes, and hence the multifaceted role of soils to deliver a bundle of ecosystem services for farmers and citizens, and supporting land management and policy toward a more sustainable society.
Data Availability
Requests to access the raw data supporting the conclusions of this manuscript should be directed to the corresponding author.
Author Contributions
JvL: model development, validation, and writing. RC: conceptual framework, writing. CP, DC and GP: acquisition and analysis of French data. MD, AT, VK and GV: model development. FG, CM, and IT-G: conceptual framework. CH: development of decision support system. NS: database management. MR: conceptual framework, acquisition and analysis of Dutch data, writing.
Conflict of Interest Statement
The authors declare that the research was conducted in the absence of any commercial or financial relationships that could be construed as a potential conflict of interest.
Acknowledgments
The work was done within the EU H2020 project LANDMARK (grant number 635201). We thank LANDMARK consortium members for their valuable contributions to the discussions on the modeling of soil functions during several round table meetings.
We thank Peter de Ruiter for his contributions in discussions and commenting to the many versions of this manuscript. The work in the NSMN was partly done within the RIVM projects with the Biological Indicator for Soil Quality (BiSQ) and the Netherlands Soil Monitoring Network (NSMN). The RIVM projects M/607604 and M/607406 were commissioned by the ministry of Infrastructure and Water Management. We thank Jaap Bloem, Wim Dimmers, Nick van Eekeren, Ron de Goede, Gerard Jagers op Akkerhuis, Harm Keidel, Christian Mulder, and Ton Schouten for scientific support with the data from the NSMN.
The RMQS-BioDiv project (N° 0775C0035) was part of the Bioindicator projects funded by ADEME (Agence de l'environnement et de la maîtrise de l'énergie). RMQS soil sampling and physico-chemical analyses were supported by the GIS Sol, with participation from the Ministry for ecology and sustainable development, the Ministry of agriculture, the National forest inventory (IFN), ADEME, IRD (Institut de recherche pour le développement), and INRA (Institut national de la recherche agronomique). Daniel Cylly, Cécile Villenave, and Claudy Jolivet are thanked for their work and scientific support with data from the RMQS-BioDiv.
Supplementary Material
The Supplementary Material for this article can be found online at: https://www.frontiersin.org/articles/10.3389/fenvs.2019.00113/full#supplementary-material
Footnotes
1. ^This issue of Frontiers in Environmental Science will contain all or a selection of the following papers on soil function models from the H2020 LANDMARK project: Debeljak et al. (2019), Sandén et al. (2019), Delgado et al. (submitted), Van de Broek et al. (submitted).
References
Arrouays, D., Jolivet, C., Boulonne, L., Bodineau, G., Saby, N., and Grolleau, E. (2002). A new projection in France: a multi-institutional soil quality monitoring network. Comptes Rendus de l'Académie d'Agriculture de France (France) 88, 93–103. Available online at: http://agris.fao.org/agris-search/search.do?recordID=FR2003001516
Bastida, F., Luis Moreno, J., Hernandez, T., and García, C. (2006). Microbiological degradation index of soils in a semiarid climate. Soil Biol. Biochem. 38, 3463–3473. doi: 10.1016/j.soilbio.2006.06.001
Baveye, P. C., Baveye, J., and Gowdy, J. (2016). Soil “ecosystem” services and natural capital: critical appraisal of research on uncertain ground. Front. Environ. Sci. 4:41. doi: 10.3389/fenvs.2016.00041
Bloem, J., Schouten, A. J., Sørensen, S. J., Rutgers, M., Van Der Werf, A., and Breure, A. M. (2006). “Monitoring and evaluating soil quality,” in Microbiological Methods for Assessing Soil Quality, eds J. Bloem, D. W. Hopkins and A. Benedetti. (Wallingford, UK: CABI Publishing, 23–49.
Bohanec, M., Cortet, J., Griffiths, B., Žnidaršič, M., Debeljak, M., Caul, S., et al. (2007). A qualitative multi-attribute model for assessing the impact of cropping systems on soil quality. Pedobiol. 51, 239–250. doi: 10.1016/j.pedobi.2007.03.006
Bünemann, E. K., Bongiorno, G., Bai, Z., Creamer, R. E., De Deyn, G., De Goede, R., et al. (2018). Soil quality–A critical review. Soil Biol. Biochem. 120, 105–125. doi: 10.1016/j.soilbio.2018.01.030
Cluzeau, D., Guernion, M., Chaussod, R., Martin-Laurent, F., Villenave, C., Cortet, J., et al. (2012). Integration of biodiversity in soil quality monitoring: Baselines for microbial and soil fauna parameters for different land-use types. Eur. J. Soil Biol. 49, 63–72. doi: 10.1016/j.ejsobi.2011.11.003
De Deyn, G. B., and Van Der Putten, W. H. (2005). Linking aboveground and belowground diversity. Trends Ecol. Evolut. 20, 625–633. doi: 10.1016/j.tree.2005.08.009
De Ruiter, P. C., Van Veen, J. A., Moore, J. C., Brussaard, L., and Hunt, H. W. (1993). Calculation of nitrogen mineralization in soil food webs. Plant Soil 157, 263–273. doi: 10.1007/BF00011055
Debeljak, M., Trajanov, A., Kuzmanovski, V., Schröder, J., Sandén, T., Spiegel, H., et al. (2019). A field-scale decision support system for assessment and management of soil functions. Front. Environ. Sci. 7:115. doi: 10.3389/fenvs.2019.00115
Dominati, E., Patterson, M., and Mackay, A. (2010). A framework for classifying and quantifying the natural capital and ecosystem services of soils. Ecol. Econ. 69, 1858–1868. doi: 10.1016/j.ecolecon.2010.05.002
Doran, J. W., and Zeiss, M. R. (2000). Soil health and sustainability: managing the biotic component of soil quality. Appl. Soil Ecol. 15, 3–11. doi: 10.1016/S0929-1393(00)00067-6
Eggleton, P., Vanbergen, A. J., Jones, D. T., Lambert, M. C., Rockett, C., Hammond, P. M., et al. (2005). Assemblages of soil macrofauna across a Scottish land use intensification gradient: influences of habitat quality, heterogeneity and area. J. Appl. Ecol. 42, 1153–1164. doi: 10.1111/j.1365-2664.2005.01090.x
FAO and ITPS (2015). Status of the World's Soil Resources (SWSR) – Main Report. Rome: Food and Agriculture Organization of the United Nations and Intergovernmental Technical Panel on Soils, Food and Agriculture Organization of the United Nations.
Griffiths, R. I., Thomson, B. C., Plassart, P., Gweon, H. S., Stone, D., Creamer, R. E., et al. (2016). Mapping and validating predictions of soil bacterial biodiversity using European and national scale datasets. Appl. Soil Ecol. 97, 61–68. doi: 10.1016/j.apsoil.2015.06.018
Havlicek, E. (2012). Soil biodiversity and bioindication: from complex thinking to simple acting. Eur. J. Soil Biol. 49, 80–84. doi: 10.1016/j.ejsobi.2012.01.009
JRC (2010a). European atlas of Soil Biodiversity. Luxembourg: Publication office of the European Union.
JRC (2010b). Map of Soil pH in Europe. Luxembourg: Land Resources Management, Institute for Environment & Sustainability, European Commission.
Keesstra, S. D., Quinton, J. N., Van Der Putten, W. H., Bardgett, R. D., and Fresco, L. O. (2016). The significance of soils and soil science towards realization of the united nations sustainable development goals. Soil 2:111. doi: 10.5194/soil-2-111-2016
Klok, C., Van Der Hout, A., and Bodt, J. (2006). Population growth and development of the earthworm Lumbricus rubellus in a polluted field soil: possible consequences for the godwit (Limosa limosa). Environ. Toxicol. Chem. 25, 213–219. doi: 10.1897/05-286R.1
Lavelle, P., Decaëns, T., Aubert, M., Barot, S., Blouin, M., Bureau, F., et al. (2006). Soil invertebrates and ecosystem services. Eur. J. Soil Biol. 42(Suppl 1), S3–S15. doi: 10.1016/j.ejsobi.2006.10.002
Lima, A., Brussaard, L., Totola, M., Hoogmoed, W., and De Goede, R. (2013). A functional evaluation of three indicator sets for assessing soil quality. Appl. Soil Ecol. 64, 194–200. doi: 10.1016/j.apsoil.2012.12.009
Maes, J., Liquete, C., Teller, A., Erhard, M., Paracchini, M. L., Barredo, J. I., et al. (2016). An indicator framework for assessing ecosystem services in support of the EU biodiversity strategy to 2020. Ecosyst. Services 17, 14–23. doi: 10.1016/j.ecoser.2015.10.023
Maes, J., Teller, A., Erhard, M., Liquete, C., Braat, L., Berry, P., et al. (2013). Mapping and Assessment of Ecosystems and their Services. An analytical framework for ecosystem assessments under action 5 of the EU biodiversity strategy to 2020. Luxembourg: Publications of the European Union.
Martin, M. P., Wattendbach, M., Smith, P., Meersmans, J., Jolivet, C., Boulonne, L., et al. (2009). Spatial distribution of soil organic carbon stocks in France. Biogeosciences 8, 1053–1065. doi: 10.5194/bg-8-1053-2011
McCallum, H. M., Wilson, J. D., Beaumont, D., Sheldon, R., O'brien, M. G., and Park, K. J. (2016). A role for liming as a conservation intervention? earthworm abundance is associated with higher soil pH and foraging activity of a threatened shorebird in upland grasslands. Agri. Ecosys. Environ. 223, 182–189. doi: 10.1016/j.agee.2016.03.005
Menta, C., Conti, F. D., Pinto, S., and Bodini, A. (2018). Soil biological quality index (QBS-ar): 15 years of application at global scale. Ecol. Indicat. 85, 773–780. doi: 10.1016/j.ecolind.2017.11.030
Menta, C., Leoni, A., Gardi, C., and Conti, F. D. (2011). Are grasslands important habitats for soil microarthropod conservation? Biodiv. Conserv. 20, 1073–1087. doi: 10.1007/s10531-011-0017-0
Metzger, M. J., Bunce, R. G. H., Jongman, R. H., Mücher, C. A., and Watkins, J. W. (2005). A climatic stratification of the environment of Europe. Global Ecol. Biogeography. 14, 549–563. doi: 10.1111/j.1466-822X.2005.00190.x
Mulder, C., Boit, A., Bonkowski, M., De Ruiter, P. C., Mancinelli, G., Van der Heijden, M. G., et al. (2011). A belowground perspective on Dutch agroecosystems: how soil organisms interact to support ecosystem services. Adv. Ecol. Res. 44, 277–357. doi: 10.1016/B978-0-12-374794-5.00005-5
Mulder, C., Cohen, J. E., Setälä, H., Bloem, J., and Breure, A. M. (2005a). Bacterial traits, organism mass, and numerical abundance in the detrital soil food web of Dutch agricultural grasslands. Ecol. Lett. 8, 80–90. doi: 10.1111/j.1461-0248.2004.00704.x
Mulder, C., Van Wijnen, H. J., and Van Wezel, A. P. (2005b). Numerical abundance and biodiversity of below-ground taxocenes along a pH gradient across the Netherlands. J. Biogeography 32, 1775–1790. doi: 10.1111/j.1365-2699.2005.01321.x
Orgiazzi, A., Bardgett, R. D., and Barrios, E. (2016). Global Soil Biodiversity Atlas. Luxembourg: European Commission.
Parisi, V., Menta, C., Gardi, C., Jacomini, C., and Mozzanica, E. (2005). Microarthropod communities as a tool to assess soil quality and biodiversity: a new approach in Italy. Agr. Ecosys. Environ. 105, 323–333. doi: 10.1016/j.agee.2004.02.002
Plassart, P., Vinceslas, M. A., Gangneux, C., Mercier, A., Barray, S., and Laval, K. (2008). Molecular and functional responses of soil microbial communities under grassland restoration. Agr. Ecosys. Environ. 127, 286–293. doi: 10.1016/j.agee.2008.04.008
Ponge, J-F., Pérès, G., Guernion, M., Ruiz-Camacho, N., Cortet, J., Pernin, C., et al. (2013). The impact of agricultural practices on soil biota: a regional study. Soil Biol. Biochem. 67, 271–284. doi: 10.1016/j.soilbio.2013.08.026
Quintana-Segui, P., Le Moigne, P., Durand, Y., Martin, E., Habets, F., Baillon, M., et al. (2008). Analysis of near-surface atmospheric variables: validation of the SAFRAN analysis over France. J. Appl. Meteor. Climat. 47, 92–107. doi: 10.1175/2007JAMC1636.1
Robinson, D., Hockley, N., Cooper, D., Emmett, B., Keith, A., Lebron, I., et al. (2013). Natural capital and ecosystem services, developing an appropriate soils framework as a basis for valuation. Soil Biol. Biochem. 57, 1023–1033. doi: 10.1016/j.soilbio.2012.09.008
Romaniuk, R., Giuffré, L., Costantini, A., and Nannipieri, P. (2011). Assessment of soil microbial diversity measurements as indicators of soil functioning in organic and conventional horticulture systems. Ecol. Indicat. 11, 1345–1353. doi: 10.1016/j.ecolind.2011.02.008
Roodbergen, M., Klok, C., and Van Der Hout, A. (2008). Transfer of heavy metals in the food chain earthworm Black-tailed godwit (Limosa limosa): comparison of a polluted and a reference site in The Netherlands. Sci. Tot. Environ. 406, 407–412. doi: 10.1016/j.scitotenv.2008.06.051
Rutgers, M., Orgiazzi, A., Gardi, C., Römbke, J., Jänsch, S., Keith, A. M., et al. (2016). Mapping earthworm communities in Europe. Appl. Soil Ecol. 97, 98–111. doi: 10.1016/j.apsoil.2015.08.015
Rutgers, M., Schouten, A., Bloem, J., Van Eekeren, N., De Goede, R., Jagers op Akkerhuis, G., et al. (2009). Biological measurements in a nationwide soil monitoring network. Eur. J. Soil Sci. 60, 820–832. doi: 10.1111/j.1365-2389.2009.01163.x
Rutgers, M., Van Wijnen, H. J., Schouten, A. J., Mulder, C., Kuiten, A. M. P., Brussaard, L., et al. (2012). A method to assess ecosystem services developed from soil attributes with stakeholders and data of four arable farms. Sci. Tot. Environ. 415, 39–48. doi: 10.1016/j.scitotenv.2011.04.041
Sandén, T., Trajanov, A., Spiegel, H., Kuzmanovski, Saby, N. P. A., Picaud, C, Henriksen, C. B., Schwarz, M., et al. (2019). Development of an agricultural primary productivity decision support model: a case study in France. Front. Environ. Sci. 7:58. doi: 10.3389/fenvs.2019.00058
Schouten, T., De Goede, R., Eekeren, N. V., and Rutgers, M. (2014). De schoonheid van een duurzaam beheerde bodem: leidt biologische landbouw tot een gezondere bodem? Bodem 6, 14–16.
Schröder, J. J., Schulte, R. P. O., Creamer, R. E., Delgado, A., Van Leeuwen, J., Lehtinen, T., et al. (2016). The elusive role of soil qualityin nutrient cycling: a review. Soil Use Manag. 32, 476–486. doi: 10.1111/sum.12288
Schulte, R. P., Creamer, R. E., Donnellan, T., Farrelly, N., Fealy, R., O'donoghue, C., et al. (2014). Functional land management: a framework for managing soil-based ecosystem services for the sustainable intensification of agriculture. Environ. Sci. Pol. 38, 45–58. doi: 10.1016/j.envsci.2013.10.002
Sturel, S., Bampa, F., Sandén, T., Spiegel, H., Madena, K., Brunet, A., et al. (2018). Optimised Suites of Soil Functions, as Prioritised by Stakeholder Groups. LANDMARK Report 1.2. Available online at: www.landmark2020.eu
Tsiafouli, M. A., Thébault, E., Sgardelis, S. P., De Ruiter, P. C., Van Der Putten, W. H., Birkhofer, K., et al. (2015). Intensive agriculture reduces soil biodiversity across Europe. Glob. Change Biol. 21, 973–985. doi: 10.1111/gcb.12752
Turbé, A., De Toni, A., Benito, P., Lavelle, P., Lavelle, P., Camacho, N. R., et al. (2010). Soil Biodiversity: Functions, Threats and Tools for Policy Makers. bio intelligence service, IRD, and NIOO, report for European Commission. Brussels: DG Environment, 250.
USGS (2004). Shuttle Radar Topography Mission, 1 Arc Second Scene SRTM_u03_n008e004, Unfilled Unfinished 2.0, Global Land Cover Facility. University of Maryland, College Park, Maryland (February 2000).
Van Leeuwen, J. P., Saby, N., Jones, A., Louwagie, G., Micheli, E., Rutgers, M., et al. (2017). Gap assessment in current soil monitoring networks across Europe for measuring soil functions. Environ. Res. Lett. 12:124007. doi: 10.1088/1748-9326/aa9c5c
Van Wijnen, H. J., Rutgers, M., Schouten, A. J., Mulder, C., De Zwart, D., and Breure, A. M. (2012). How to calculate the spatial distribution of ecosystem services across the Netherlands. Sci. Tot. Environ. 415, 49–55. doi: 10.1016/j.scitotenv.2011.05.058
Villenave, C., Jimenez, A., Guernion, M., Pérès, G., Cluzeau, D., Mateille, T., et al. (2013). Nematodes for soil quality monitoring: results from the RMQS BioDiv programme. Open J. Soil Sci. 3, 30–45. doi: 10.4236/ojss.2013.31005
Vogel, H.-J., Bartke, S., Daedlow, K., Helming, K., Kögel-Knabner, I., Lang, B., et al. (2018). A systemic approach for modeling soil functions. Soil 4, 83–92. doi: 10.5194/soil-4-83-2018
Wagg, C., Bender, S. F., Widmer, F., and Van Der Heijden, M. G. A. (2014). Soil biodiversity and soil community composition determine ecosystem multifunctionality. Proc. Natl. Acad. Sci. USA. 111, 5266–5270. doi: 10.1073/pnas.1320054111
Winding, A., Hund-Rinke, K., and Rutgers, M. (2005). The use of microorganisms in ecological soil classification and assessment concepts. Ecotoxicol. Environ. Saf. 62, 230–248. doi: 10.1016/j.ecoenv.2005.03.026
Yeates, G., Bardgett, R., Cook, R., Hobbs, P., Bowling, P., and Potter, J. (1997). Faunal and microbial diversity in three Welsh grassland soils under conventional and organic management regimes. J. Appl. Ecol. 34, 453–470. doi: 10.2307/2404890
Keywords: ecosystem service, soil function, soil biodiversity, land management, qualitative modeling, Europe, habitat provisioning
Citation: van Leeuwen JP, Creamer RE, Cluzeau D, Debeljak M, Gatti F, Henriksen CB, Kuzmanovski V, Menta C, Pérès G, Picaud C, Saby NPA, Trajanov A, Trinsoutrot-Gattin I, Visioli G and Rutgers M (2019) Modeling of Soil Functions for Assessing Soil Quality: Soil Biodiversity and Habitat Provisioning. Front. Environ. Sci. 7:113. doi: 10.3389/fenvs.2019.00113
Received: 05 March 2019; Accepted: 01 July 2019;
Published: 22 August 2019.
Edited by:
Philippe C. Baveye, AgroParisTech Institut des Sciences et Industries du Vivant et de L'environnement, FranceReviewed by:
Daniela Businelli, University of Perugia, ItalyEstelle Couradeau, Lawrence Berkeley National Laboratory, United States
Copyright © 2019 van Leeuwen, Creamer, Cluzeau, Debeljak, Gatti, Henriksen, Kuzmanovski, Menta, Pérès, Picaud, Saby, Trajanov, Trinsoutrot-Gattin, Visioli and Rutgers. This is an open-access article distributed under the terms of the Creative Commons Attribution License (CC BY). The use, distribution or reproduction in other forums is permitted, provided the original author(s) and the copyright owner(s) are credited and that the original publication in this journal is cited, in accordance with accepted academic practice. No use, distribution or reproduction is permitted which does not comply with these terms.
*Correspondence: Michiel Rutgers, bWljaGllbC5ydXRnZXJzQHJpdm0ubmw=