- 1School of Engineering, Institute for Infrastructure and Environment, The University of Edinburgh, Edinburgh, United Kingdom
- 2Department of Water Resources Engineering, College of Engineering and Technology, University of Dar es Salaam, Dar es Salaam, Tanzania
In management of helminth infections and transmission, the correct prediction of sludge accumulation patterns in waste stabilization ponds (WSP) is important as sedimented eggs are associated with sludge depth. However, sedimentation in WSP is complicated by the non-stationary nature of the inputs and environmental factors such as weather variables, that are mostly site specific. This paper investigates sludge accumulation patterns in the Buguruni WSP (in Dar es Salaam, Tanzania) and the role that wind and increased run-off during rainy season play. Sludge depths were measured twice; in January 2017 and January 2018. Higher sludge depths were observed close to the inlet, indicating that more helminth eggs may be recovered in the sludge around this area. A sedimentation model set in Delft3D successfully reproduced the sludge accumulation pattern near the inlet, with wind and inflow characteristics as the major driving factors. The pond inlet receives more solids and water during the rain season as a result of defective pipes and manholes, and simulations show that this has significant impacts on sludge accumulation. Improved sludge depth measurement and wind and discharge data will improve modeled sludge accumulation patterns to capture those away from the inlet. Our research has shown that neglecting maintenance of the pond, as well as the sewer system has potential severe health and environmental effects, impacting communities downstream of the WSP. This research also shows the important role that numerical modeling can play in sustainable management of WSP.
1. Introduction
Waste stabilization ponds (WSPs) are a common low- maintenance low-cost technology used to treat waste water by biological action, and are excellent in helminth eggs removal through sedimentation. The system is most popular in sub-Saharan Africa, USA, France and Germany, and is also used to a small extent in other industrialized countries (Mara, 2009). In these systems, large and heavy particle pollutants are removed from water by sedimenting to the bottom of the pond, as well as through biological action of micro-organisms and algae (Mara, 2004). The sedimented particles and products of biological action form a layer at the bottom of the pond known as sludge. Further biological digestion of the pollutants occurs in sludge since it is rich in micro-organisms. With time, the sludge layer consolidates and decreases in volume as the sludge materials get more compacted. It is estimated that a primary facultative pond may operate for at-least 10 years before accumulating enough sludge to require desludging (Mara, 2004), although some ponds, especially when under-loaded may take a longer time to fill (Passos et al., 2014a).
Sludge accumulation patterns impact the pond hydraulics directly as a result of reduction in the effective pond volume and modified pond bottom surface (Alvarado et al., 2012a; Murphy, 2012; Rodrigues et al., 2015; Coggins et al., 2017). Although some research suggest that sludge accumulations result into longer HRT (Alvarado et al., 2012a) and do not cause any significant reduction in organic pollutants removal (Passos et al., 2014a), nutrients removal especially nitrogen seem to be significantly affected by the presence of sludge (Passos et al., 2014a). Also, helminth eggs content of sludge is associated with its distribution in the pond; that is, areas with higher sludge depth tend to contain more helminth eggs (von Sperling et al., 2003; Nelson et al., 2004). Therefore, the correct prediction of sludge accumulation patterns is important not only for the proper functioning of the pond, but also for identification of areas with sludge containing helminth eggs as well as a tool during design to select the best design option. Helminth eggs are resistant to inactivation and can survive for several years in the environment, hence proper handling of sludge in which they are present is important to prevent environmental contamination. Lack of information on sludge accumulation rates and distribution is a major factor for the poor management of sludge from WSP (Nelson et al., 2004). It is thought that, correct prediction of areas with sludge containing helminth eggs can contribute to reduction of sludge treatment cost, as only the contaminated sludge will be treated through thermophilic sludge digestion at temperatures above 45°C that ensures their destruction.
Sedimentation and hence sludge accumulation patterns in WSP is complicated by the non-stationary nature of the inputs and environmental factors such as weather variables, that are mostly site specific. Sludge accumulation depends on hydraulic factors including pond geometry, inlet and outlet characteristics, mixing conditions, dead-zones, etc. (Nelson et al., 2004; Abis and Mara, 2005; Alvarado et al., 2012a; Murphy, 2012; Ouedraogo et al., 2016; Coggins et al., 2017). Wind pattern and magnitude can be dominant driving forces of WSP hydraulics (Gu and Stefan, 1995; Brissaud et al., 2003; Badrot-Nico et al., 2009), therefore a strong influence of these variables in sludge accumulation is expected but there is no research exploring this. Ponds with single inlets as well as facultative ponds tend to have highest sludge deposits at the proximity of the inlet while those with multiple inlets and maturation ponds have uniformly distributed sludge patterns throughout their bottoms (Nelson et al., 2004; Abis and Mara, 2005; Coggins et al., 2017). Also in facultative ponds, sludge accumulation patterns follow flow velocity distribution, with higher flow velocities areas having higher sludge depths (Alvarado et al., 2012a). Changes in sludge levels and patterns are also linked to environmental factors such as climate and secondary sources of particles including plants that shed seeds and leaves, and algal and bacteria populations in the pond (Papadopoulos et al., 2003; Abis and Mara, 2005). Climatic and environmental factors are site specific and result into spatial differences in sludge accumulation rates and patterns between ponds.
The reviewed studies for sedimentation in shallow ponds involved experimental modeling in laboratory scale ponds, where the impact of environmental factors is minimal (Kantoush et al., 2008; Dufresne et al., 2010; Camnasio et al., 2013). The numerical model studies such as that of (Alvarado et al., 2012a; Ouedraogo et al., 2016; Coggins et al., 2017) looked at the impact of sludge accumulations in pond hydraulics, without accounting much for what influences the sludge accumulations. Therefore this study fills the gap between these two sets of studies by setting up a numerical sedimentation model that simulates the sludge accumulation patterns in the primary facultative pond of an operational Buguruni WSP in Tanzania. Also, the role of the different factors such as wind, influent discharge and suspended solids concentration is investigated.
This manuscript is organized as outlined below. The first part is the introduction which gives the state-of-the-art research in sludge accumulation in waste stabilization ponds. Also, the existing gaps which this research is going to fill are identified. The second part materials and methods describes the data sets used in this study and how they were obtained. The results and discussion section describes the results obtained as well as the comparison with similar and the last part are the conclusions made from the results of this study.
2. Materials and Methods
The methodology for this research included on-site data collection and setting up of a sedimentation model in Delft3D. A very important step in sedimentation modeling is the setting up of a hydraulic model for the system. However, Delft3D has an option for including sedimentation as a process in the hydraulic model, an option which was used in this research. The data sets needed to set-up and calibrate the hydraulic and sedimentation model in Delft3D are described below. These are categorized into pond data (discharge, sludge levels, suspended solids concentration and pond geometry) and the hydrometry data that describes the climate of the area (if it is anticipated that it will have influence on the pond hydraulics) and may include rainfall, wind and temperature.
2.1. Study Area, Sludge, and Discharge Data
The Buguruni WSP (Figure 1a) is among the nine (9) waste stabilization pond systems servicing the city of Dar es Salaam, Tanzania. The city is the industrial, educational, and cultural center of the nation, hosting about 8% of the nation's population. The pond system, consisting of one (1) facultative pond and two (2) maturation ponds, receives domestic waste water from the nearby areas of Buguruni and Tazara. The design discharge is 0.0077 m3/s but random measurement of discharge during the study period between December 2016 and December 2018 showed discharge ranging between 0.0044 m3/s and 0.0085 m3/s. The inlet channel is fitted with a V-notch weir for discharge measurement, with a maximum capacity of 0.06 m3/s, equivalent to a head of 30 cm which is the maximum height of the weir. About 5 random discharge measurements were done during the different data collection campaigns. For sludge data, the 90 m × 183 m × 1.1 m WSP was gridded into 30 × 30 m cells and sludge level measurements were done twice (January 2017 and January 2018) at the nodes given in Figure 1b, using the white towel method as described in Mara (2004). In the white towel method, a white towel (in this case a white muslin cloth) is wound on a long straight pole up to the height of the total pond depth. The pole is then dipped into the pond until it reaches the hard consolidated sludge and can no longer be pushed further. Upon pulling the pole out, sludge deposits will stick on the white cloth showing the end of deposited material. This was recorded as the sludge depth at that location. A clean muslin cloth was used for every node. Despite its simplicity, the white towel method will have a vertical error of about ± 5 cm due to presence of slurry close to the pond bottom, capillarity and the towel absorption. The sludge depths were then processed in MATLAB to convert them to spatial data.
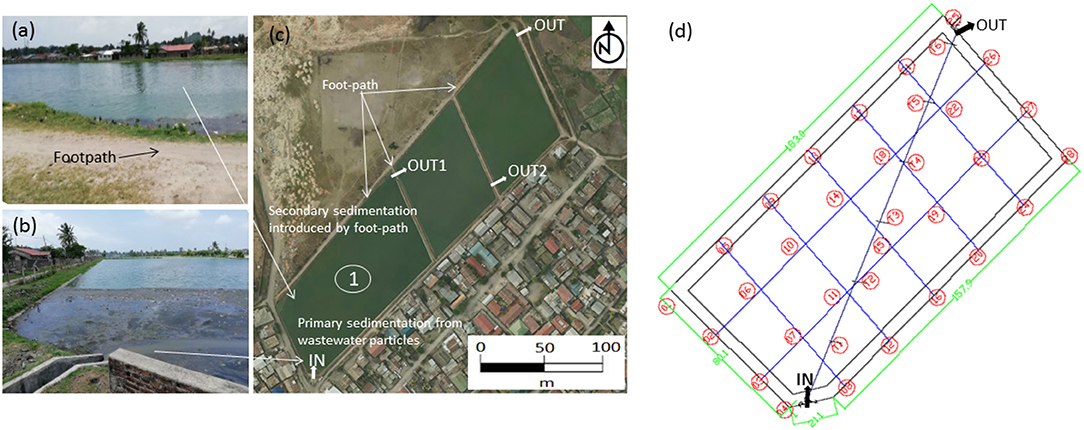
Figure 1. Non-orthorectified pictures of the Buguruni WSP showing (a) a popular footpath that introduce debris into the pond. (b) Areas where sedimentation of incoming materials occur. (c) The whole pond system where the first pond (facultative pond, indicated by number (1)) is where data for this study was collected and (d) the data collection points inside the pond.
2.2. Hydro-Meteorological Data
Dar es Salaam has an equatorial climate which is hot and humid, influenced by the North-East monsoon winds from October to March and the South-East monsoon winds from May to September. The area has two seasons with regard to precipitation, wet and dry. The wet season is further divided into three rainy sub-seasons, the Vuli (short) rains in late October-late December, Masika (Long) rains in mid-March to mid-May and an intermediate season in January-February receiving reduced rainfall amounts compared to Vuli and Masika seasons. The short rains season receives between 75 and 100 mm of rainfall per month which increases to 150–300 mm per month during the long rains. The average annual rainfall is about 1,000 mm which peaks in April and December, with very random rainy days. The remaining period which is from mid-May to October is normally dry.
On the other hand, the study for the Tanzania coastal region that covered 30 years between 1977 and 2006, showed that the region has also two wind seasons according to the wind orientation (Mahongo et al., 2012). The first season lasts from November through to March during which period wind blows mainly in the North-East direction (45°), with average speed of 4.5 ms−1. The second season is from April to October during which wind blows in the South-West direction (225°) in the morning and South-East direction (135°) in the afternoon, with an average speed of 2.5 ms−1. Lowest winds are recorded in the afternoons of March to April, a period that coincides with high rainfalls (Ndetto and Matzarakis, 2013).
The annual average temperature is around 30°C. Highest temperatures are recorded in January and February with an average maximum of 32.5°C and average minimum of 24°C. The lowest temperature are in July with an average maximum temperature of 29.5°C and an average minimum of 19°C. The diurnal change in temperature is around 9°C.
2.3. Hydro-Morphodynamic Model
The simulation was set up in the multi-dimensional Delft3D open source software supplied by Deltares. The software consists of different fundamental sub-modules for environmental hydraulic simulations: flow, water quality, wave generation and propagation, morphology and sediment transport. This study utilized the hydrodynamic and sediment transport modules. The Delft3D hydraulic model was used to simulate velocity vectors of water in the pond in response to a variety of conditions and input parameters. The model domain was defined by grid and bathymetry created using the pond dimensions and water levels. The magnitude and extent of velocity are solved on a square or rectangular grid covering the area of interest. The program offers pre-processing tools for creation of orthogonal grids (RGFGRID) and for preparation of grid data such as bathymetry (QUICKIN). The hydrodynamic model solves the Navier-Stokes equation for incompressible fluid under shallow water and Boussinesq assumptions, integrated over the vertical to describe the velocity variations and other hydraulic parameters such as water depth and hydrostatic pressure in two horizontal dimensions. The equations are solved by implicit finite difference techniques. The resulting velocity vectors are used to generate travel path-lines by the STREAMLINE function in MATLAB. The STREAMLINE function uses Forward Euler Prediction, which is a first order numerical procedure to solve ordinary differential equations, to predict the position of an object when the previous position is known.
In the sedimentation model, the mass balance (advection-diffusion) equation for sediment transport is solved using velocity and eddy diffusivities from the hydraulic model. The simulation was run for a period of 2 years at a 1 min time-step to keep the Courant number less than the required minimum of 4, with an initial water level of 1.2 m and suspended solids concentration of 0.35 kgm−3. Discharge values ranging from the design discharge of 0.0077 m3s−1 (taken to represent the dry weather discharge in this study), up to the maximum of 0.02 m3s−1 and average suspended solid concentrations ranging from the measured average value of 0.35 kgm−3 to a maximum of 5 kgm−3 were used in different combinations to represent the contribution of storm run-off inflow into the pond due to defective system.
3. Results and Discussion
3.1. Spatial-Temporal Sludge Distribution
Measured sludge depth ranged from about 0.2–0.8 m in 2017 and 0.2–1.1 m in 2018. Measurements show that most sludge is deposited near the single inlet similar to observations from Abis and Mara (2005), Alvarado et al. (2012a), Coggins et al. (2017), Ouedraogo et al. (2016), Murphy (2012), and Nelson et al. (2004) (Figure 2). The sludge depth decreases gradually along the inlet- outlet path. In 2017, there are less deposits around the inlet but deposits extend more along the inlet- outlet path and along the inlet side bank. These extensions disappear in 2018 although their traces can be seen for example by the small island in the middle of Figure 2B. Profiles along the X-axis and Y-axis are presented in Figures 3, 4 to get a detailed view on the sludge depth variations. For clarity, the longer edges will be referred to as banks and the shorter ones where the inlet and outlet are located will be referred to as inlet and outlet edges. The profiles are presented standing upstream of the inlet hence the inlet is on the right hand side (RHS) and the outlet on the left hand side (LHS).
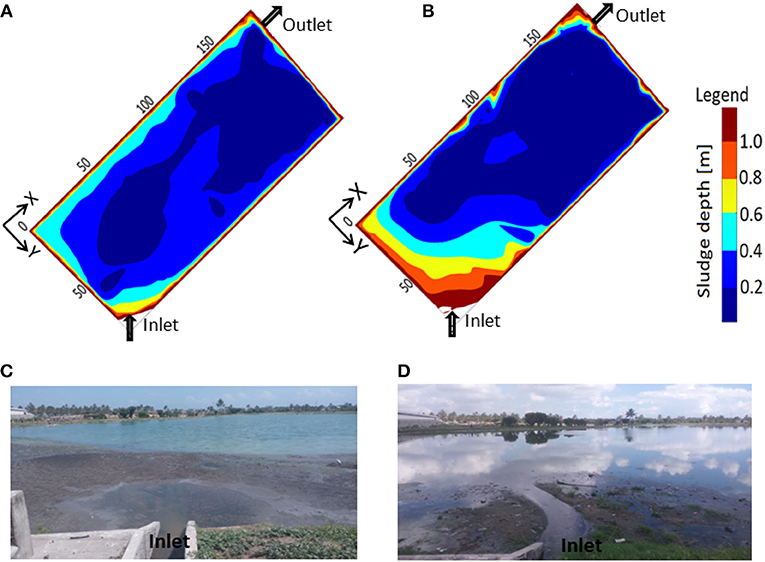
Figure 2. Measured sludge depth contours for (A) January 2017 (B) January 2018 and their corresponding pictures taken on-site for (C) January 2017 (D) January 2018. The outermost straight brown edges in the sludge contour pictures represent pond sides.
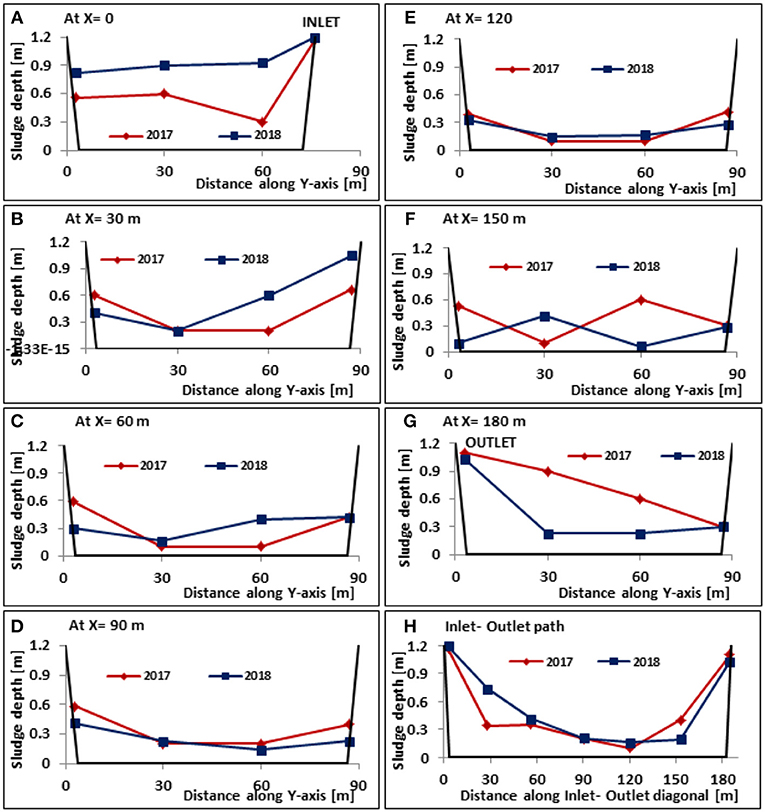
Figure 3. Sludge depth variations in sections across the pond width, standing upstream of the inlet making the inlet on the RHS (A–G) and along the inlet-outlet path (H).
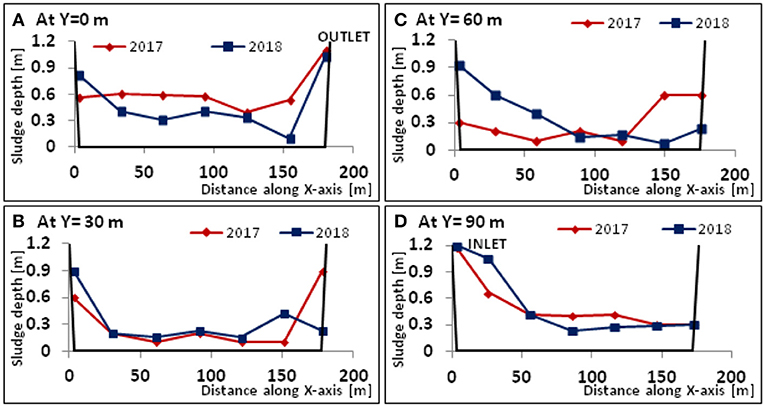
Figure 4. Sludge depth variations in sections across the pond length at 30 m intervals from the outlet edge (A–D).
The increase in sludge depth from 2017 to 2018 was obvious during data collection at the field as sludge deposits could be seen on the pond surface (see pictures on Figures 2C,D). The change in sludge depth as well as sludge distribution for the two periods is not uniform except at the inlet where there is consistent increase in sludge depth (Figure 2). The pond experienced serious sludge re-distribution in 2018, losing materials along both banks while gaining materials along the inlet edge.
The measured sludge profiles across the pond width show a mixture of both increased and reduced sludge depths for the period between January 2017 and January 2018 (Figure 3). The inlet edge (X=0 m) has the highest increase in sludge depth extending the whole pond width while there is a decrease in depth throughout the outlet edge (Figures 3A,G, respectively). For profiles inside the pond away from the X-axis boundary edges, there is an increase in sludge depth close to the inlet edge up to about 60 m from the inlet (X = 60 m, Figure 3C), after which a decrease in sludge depth across the whole pond width dominates up to the outlet edge. Sludge deposit around the inlet for systems with a single inlet is typical, multiple inlets give a distributed sludge deposition pattern.
The sludge profiles along the pond length generally show high sludge deposits around the inlet edge which decreases along the pond length and then picks up again around the outlet edge (Figure 4). The LHS bank (close to the outlet) had a decrease in sludge depth in 2018 (Figure 4A), except for areas close to the inlet where the sludge depth has increased. The rest of the profiles (Figures 4B–D) show sludge depth increase in 2018 in areas close to the inlet while decreasing toward the outlet, with the highest decrease observed at the outlet edge for the profile at Y= 30 m (Figure 4B). The general trend is sludge accumulates progressively from the inlet, with the RHS (the inlet side bank) progressing faster and receiving more sludge than the LHS bank.
A popular foot-path runs along the LHS bank (Figures 1a,c). This foot-path results in a lot of debris materials being thrown into and deposited inside the pond on that side which could explain the observed high sludge depth along the outlet bank. Also, during the rainy season, there is a potential of run-off coming into the pond through this path as it is badly worn-out in some areas such as the corner photographed in Figure 1a. Therefore the LHS bank may have secondary sedimentation resulting from materials that are not related to incoming domestic wastewater. As a result, areas where sedimentation of wastewater particles occur should be regarded as concentrated around the inlet.
The pond has not been dredged recently and assuming the observed sludge depth in the January 2017 has been accumulating since the pond was last de-sludged, possibly in the 2000s, then the pond received incredibly higher amounts of sludge between January 2017 and January 2018. But there were no changes such as a lot of new connections which may result into increased sludge inflow. Given the nature of the system (sewered to households only), the increased flow must have originated outside the system, most likely from rainfall run-off, entering through the defective sewerage system and roof leakage and seepage into the connected toilets. This is supported by the pattern of sludge in the year 2017 where there seemed to be an extension of sludge deposits along the inlet-outlet line (Figure 2A); indicating sludge is pushed toward the outlet by increased discharge. Also, attempt to do particle size analysis immediately after a rainy day, in one of the sampling campaigns of this study failed as the pond water was too diluted for analysis using the Malvern masterizer2000, as it depends on light scattering and can only work when the sample has certain obscurity. The dilution of the pond water could only come from rain and it seems to be high enough to reach the pond bottom. The re-suspension of settled sludge during the rain period in the Buguruni WSP has been reported in our previous research, as supported by particle size distribution data (Izdori et al., 2018) and simulation results not included in this manuscript.
3.2. Hydraulic and Morphodynamic Model Results
Simulated flow velocity magnitudes and directions without wind and with different wind scenarios are represented in Figure 5. The hydraulic model is considered plausible since the computed average travel time to the outlet (28.8 days) is similar to the pond theoretical retention time of 29.1 days. For the case without wind, velocity magnitudes are highest (in the order of 10−2m/s) in the proximity to both the inlet and outlet, most likely due to smaller cross-section areas of both the inlet and outlet (Figure 5A). Inside the pond, flow velocities are in the order of 10−4m/s which is similar to what is reported in other researches (Shilton, 2001) and provides ideal conditions for sedimentation of wastewater particles. Inlet velocity is responsible for the flow and hence streamlines in shallow ponds due to the momentum derived from the inlet jet (Kantoush et al., 2008; Dufresne et al., 2010; Camnasio et al., 2013; Ouedraogo et al., 2016). The absence of recirculation could therefore mean that the inlet jet at Buguruni WSP is so small that its influence doesn't reach far into the pond, and that flow progresses steadily mainly due to difference in elevation between the inlet and outlet. Changing flow magnitude up to maximum capacity of the weir (the inlet channel is fixed with a V-notch weir) only increased the flow velocity magnitudes but the directions remained the same.
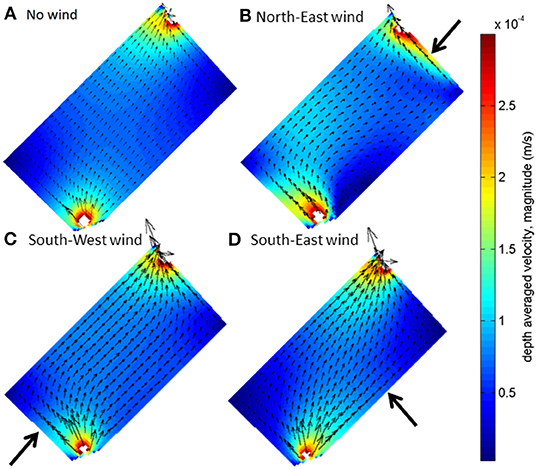
Figure 5. Flow magnitudes and vectors as simulated by a 3D-Delft3D simulation for different scenarios (A–D), with arrows showing the wind directions.
Introduction of wind in the simulation resulted in modification of flow for the different wind scenarios (Figures 5B–D). Wind blowing in the North-East direction is in the opposite direction as that of flow, that is it blows from the outlet edge toward the inlet edge, parallel to the pond banks. The wind pushes the main flow path toward the outlet side (LHS) bank, resulting in higher flow velocities along this side (Figure 5B). The wind also introduces some flow re-circulation close to the inlet on the RHS bank. The South-West wind is in the opposite direction to the North-East wind and blows from the inlet edge toward the outlet edge, parallel to the banks. This wind pushes the main flow path toward the inlet side (RHS) bank, resulting into higher flow velocities on this side (Figure 5C). Lastly, the South-East wind blows from the outlet side (LHS) bank toward the inlet side (RHS) bank, parallel to the pond edges. This wind seems to accentuate flow velocities along the main flow path-line i.e., inlet-outlet line (Figure 5D).
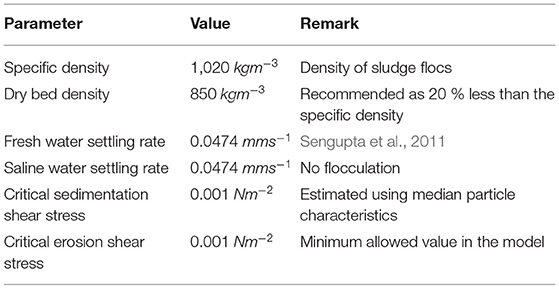
Sedimentation patterns were simulated using cohesive sediment formulation with parameters in Table 1, starting with an empty pond (bed level = 0 m). In the cohesive sediment formulation, sediment exchange between the bed and flow is calculated by the Partheniades- Krone formulations which uses the maximum bed shear stress derived from the hydraulic model (Deltares, 2016). Maximum bed shear stress in the pond is 10−5Nm−2 at the inlet and between 10−7Nm−2 and 10−8Nm−2 inside the pond to as low as 10−10Nm−2 at the corners, resulting into calculation of only the deposition flux while the erosion flux becomes zero. Since materials are transported and eventually deposited along the main flow path-line, it is expected that the different wind scenarios will result into modified sedimentation patterns, most likely different to the case without wind.
Simulation of sludge accumulation without wind resulted into accumulations mostly around the inlet (Figure 6A). Introduction of wind modified sludge accumulation patterns since the main flow path is changed (Figures 6B–D). The North-East and South-West winds result into sludge deposits being pushed toward the inlet side (RHS) bank (Figures 6B,C) while the South-East wind results into accumulation along the inlet edge (Figure 6D). This confirms that sludge accumulation in WSP tend to follow the areas of high flow velocities hence main flow path-line similar to previously reported ones (Alvarado et al., 2012a).
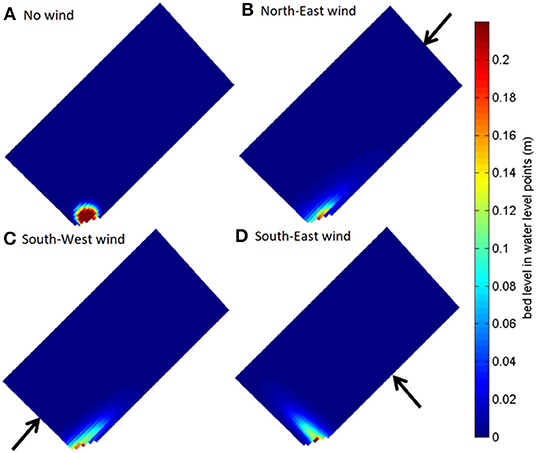
Figure 6. Sedimentation patterns from Delft3D simulations for a period of 6 months, using the design discharge of 0.0077 m3s−1, average measured suspended solids concentation of 350 mgL−1 Arrows show wind directions (A-D).
Wind scenarios from Figure 6, as well as discharge and suspended solids concentration were run in Delft3D simulation to find the set that gives similar sludge accumulation patterns to on-site sludge measurements (Figure 2). The best results (Figures 7C,D) are obtained by imposing a combination of the observed average wind characteristics, and monthly variable discharge of up to 0.03 m3s−1 and suspended solids concentration as high as 5 kgm−3 (Figure 7B), whose magnitudes were set to follow the rainfall pattern as displayed in Figures 7A,B. A combination of different wind scenarios were tested to check for their contribution. Since the South-East and South-West winds occur in one season, the combinations tested were (i) North-East and South-East and (ii) North-East and South-West. Although the combination of North-East and South-East produce sludge distribution pattern similar to those observed in Figure 2, it is more concentrated around the inlet. Introduction of the South-West wind spread the sludge further into the pond, making it more comparable to the observed patterns. The high discharge and suspended solids concentration used in these simulations indicate the important contribution of the storm run-off, resulting from defective system as confirmed by the local technician in-charge of pond maintenance. The use of constant discharge and suspended solids concentration (the design discharge of 0.0077 m3s−1 and suspended solids concentration of 0.35 kgm−3) resulted in sludge accumulation at the inlet only, not spreading further into the pond and neither reaching the measured sludge depths (Figures 7E,F).
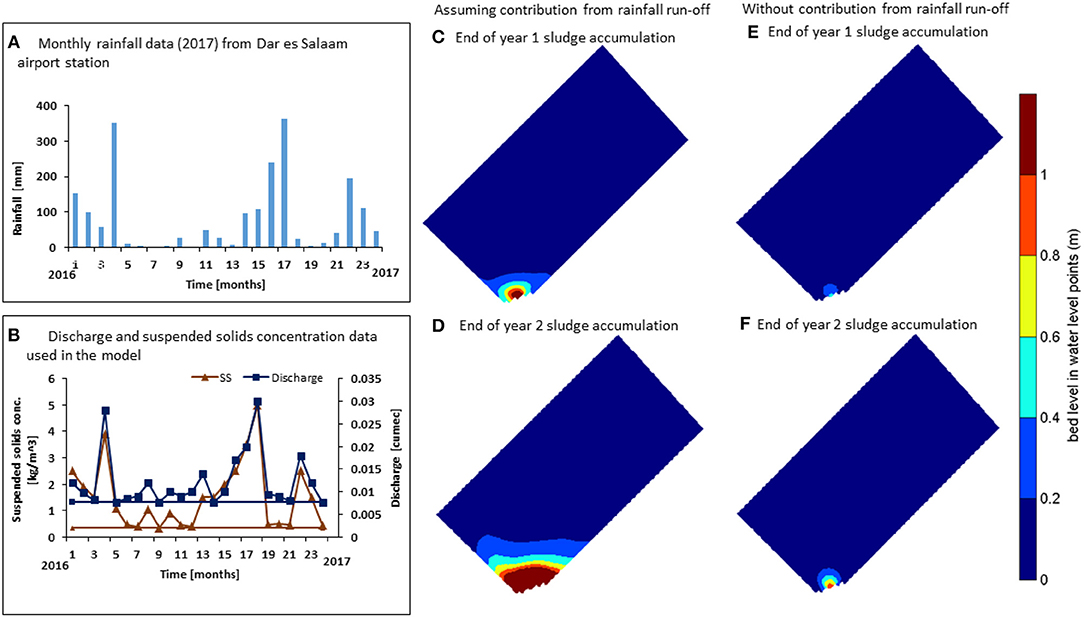
Figure 7. (A) Rainfall data for Dar es Salaam airport (2016–2017). (B) Stochastic discharge and suspended solids data, solid horizontal lines represent design data which is taken to be dry season data. Sedimentation patterns from Delft3D using stochastic discharge and suspended solids data (C,D) and with only the design discharge and suspended solids data (E,F).
Generally the morphodynamic model seemed to fit well, simulating patterns very similar to the observed ones (Figure 8A) as well as those reported in literature for facultative ponds (Nelson et al., 2004; Abis and Mara, 2005; Alvarado et al., 2012a; Passos et al., 2014a; Coggins et al., 2017). However, it can be seen that the lower sludge depths are underestimated, severely in some locations (Figure 8A), values circled in red). Most of the underestimated depths are measured at nodes located on the LHS bank of the pond which is shown in Figure 1a, and is thought to have secondary sedimentation that is not simulated by the model as it is more likely due to contribution from the footpath. The values circled in red in Figure 8A are for nodes 1 and 2 which as seen in Figures 1a,d are at the corner where the path is well worn. Also, both simulated and measured sludge depths follow a negative power function (Figure 8B), in which sludge depths decrease with the length of the hydrodynamic path-line from the inlet (the determination of the hydrodynamic path-line is not included in this manuscript). The power function for modeled sludge depth reduces to low numbers (~0) at around 50 m from the inlet, but that for measured sludge depth plateaus to values around 0.3 m hence the observed difference in matching. Although we do not have a clear explanation for this, one reason could be that the measured sludge depths are overestimated by the white towel method, in which visual observation is used to detect the sludge layer thickness on the white cloth. Since water at the bottom of the pond is muddy, the observed sludge depth may actually represent the depth of the “muddy water” and not settled sludge.

Figure 8. Comparison between measured and modeled sludge level (A) their correlation and (B) w.r.t hydrodynamic path length.
Eventually, sludge accumulation patterns seems to be affected mostly by wind flow and incoming discharge characteristics, which are influenced by rainfall in the Buguruni WSP. Wind seem to push and spread the sludge deposits sideways away from the inlet-outlet path. On the other hand, increased discharge enabled sludge to spread further into the pond along the inlet-outlet path, not concentrating around the inlet only. Although temperature is important in the biodegration of sludge and hence the change in sludge volume in the pond (Papadopoulos et al., 2003), it was not included in this research and could be considered among the avenues to improve the model. Also, the wind scenarios used are long term average of Dar es Salaam city (Mahongo et al., 2012), and the discharge variations were simulated to follow the rainfall trend of Dar es Salaam as it had been observed that there was an increased flow during rain season which is thought to result from damaged sewer pipes and manholes. Therefore proper representation of the wind and discharge conditions should improve the simulated profiles to fit the observed. We believe that on-site recording of wind and discharge will greatly improve the model.
On the other hand, the increased discharge during the rainy season results into sludge re-suspension and re-distribution, hence pond self-cleaning through discharge of previously settled sludge particles at the outlet. This poses a health risk as it may result in environmental contamination especially with helminth eggs, as well as other pollutants. In fact, the discharge of re-suspended sludge could be one of the factors for the outbreak of water-borne diseases such as cholera common during the rainy season. A research by Ndyomugyenyi and Minjas (2001) observed high prevalence of urinary schistosomiasis among school children living in Kigogo area, where the river Msimbazi passes. The prevalence of this disease was linked to water related recreational activities. Buguruni WSP effluent is discharged into this river, upstream of Kigogo area and therefore there is a high likelihood of the river water to be contaminated with this effluent especially during the rain season. Therefore, the possibility of the pond self-cleaning is important and requires further investigation.
The pond has not been dredged since rehabilitation in the year 2000 (personal communication with the DAWASCO techician). According to the research, after 10 years of operation the pond is expected to have accumulated enough sludge to compromise its efficiency. However, observations as well as data collected show that this is not the case for this pond. The pond seem to self-clean, and simulations show that this could be due to flush-out of the settled sludge from increased flow specifically toward the end of rainy season where the incoming discharge has lesser suspended solids. The re-suspension was simulated by imposing high flows for the last month with suspended solids concentration set to zero (0). Although this resulted into re-suspension of materials and reduced sludge depth around the inlet, it did not produce patterns similar to the January 2017 (Figure 7C). Therefore the morphodynamic model is not simulating the re-suspension process well.
Since the introduction of computation fluid dynamics (CFD) in modeling WSP in the 1990s, numerical models have successful been applied both as a substitute to and in complimenting the laboratory scaled models famously used to study WSP processes (Shilton, 2001; Shilton et al., 2008; Alvarado et al., 2012a,b; Passos et al., 2014b, 2019; Ouedraogo et al., 2016). Their use, such as in this research, shows that numerical models may be applied both during design and operation to simulate different scenarios for the pond inputs. This is important for sustainable management of the WSP system and maintenance plans.
4. Conclusions
This research focused on sludge accumulation in a primary facultative pond of a WSP, and linkage to climate characteristics. It was observed that, wind plays a significant role in the pattern of sludge deposition while increased discharge from rainfall contributed to more sludge materials as well as spreading of sludge further into the pond. The observed role of wind in sludge accumulation patterns may be used during design for sludge management, such as positioning of the inlet in a way that wind effect enhance sludge accumulations in only certain sides/areas of the pond. In a properly maintained WSP, the discharge from rainfall should be minimal (mainly origination from precipitation falling over the pond surface). Our research has shown that neglecting maintenance of the pond, as well as the sewer system has potential severe health and environmental effects, impacting communities downstream of the WSP.
Data Availability Statement
All datasets generated for this study are included in the article/Supplementary Material.
Author Contributions
FI prepared and carried out sampling campaigns, laboratory analysis and the implementation of the numerical model. PP and AS provided guidance in data analysis, modeling as well as in the preparation and structuring of this manuscript.
Conflict of Interest
The authors declare that the research was conducted in the absence of any commercial or financial relationships that could be construed as a potential conflict of interest.
Acknowledgments
FI would like to thank The Commonwealth Scholarship Commission in the United Kingdom (CSC) for funding this research through its Ph.D. scholarships for low and middle-income countries. Also, the invaluable field assistance of Paul Paskal Masapa, Ally Said Kibuga and technical assistance from Godas Mwakasege, the laboratory technician from the Chemical and Mining Engineering department at the University of Dar es Salaam are highly appreciated.
Supplementary Material
The Supplementary Material for this article can be found online at: https://www.frontiersin.org/articles/10.3389/fenvs.2019.00159/full#supplementary-material
References
Abis, K. L., and Mara, D. (2005). Research on waste stabilization ponds in the United Kingdom: sludge accumulation in pilot-scale primary facultative ponds. Environ. Technol. 26, 449–458. doi: 10.1080/09593332608618555
Alvarado, A., Sanchez, E., Durazno, G., Vesvikar, M., and Nopens, I. (2012a). CFD analysis of sludge accumulation and hydraulic performance of a waste stabilization pond. Water Sci. Technol. 66, 2370–2377. doi: 10.2166/wst.2012.450
Alvarado, A., Vedantam, S., Goethals, P., and Nopens, I. (2012b). A compartmental model to describe hydraulics in a full-scale waste stabilization pond. Water Res. 46, 521–530. doi: 10.1016/j.watres.2011.11.038
Badrot-Nico, F., Guinot, V., and Brissaud, F. (2009). Fluid flow pattern and water residence time in waste stabilisation ponds. Water Sci. Technol. 59, 1061–1068. doi: 10.2166/wst.2009.087
Brissaud, F., Tournoud, M. G., Drakides, C., and Lazarova, V. (2003). Mixing and its impact on faecal coliform removal in a stabilisation pond. Water Sci. Technol. 48, 75–80. doi: 10.2166/wst.2003.0089
Camnasio, E., Erpicum, S., Orsi, E., Pirotton, M., Schleiss, A. J., and Dewals, B. (2013). Coupling between flow and sediment deposition in rectangular shallow reservoirs. J. Hydraul. Res. 51, 535–547. doi: 10.1080/00221686.2013.805311
Coggins, L. X., Ghisalberti, M., and Ghadouani, A. (2017). Sludge accumulation and distribution impact the hydraulic performance in waste stabilisation ponds. Water Res. 110, 354–365. doi: 10.1016/j.watres.2016.11.031
Deltares (2016). “Simulation of multi-dimensional hydrodynamic flow and transport phenomena, including sediments,” in User Manual, Chapter Delft3D-FL (Delft: Deltares), 679.
Dufresne, M., Dewals, B. J., Erpicum, S., Archambeau, P., and Pirotton, M. (2010). Experimental investigation of flow pattern and sediment deposition in rectangular shallow reservoirs. Int. J. Sediment Res. 25, 258–270. doi: 10.1016/S1001-6279(10)60043-1
Gu, R., and Stefan, H. G. (1995). Stratification dynamics in wastewater stabilization pond. Water Sci. Technol. 29, 1909–1923. doi: 10.1016/0043-1354(95)00011-9
Izdori, F., Semiao, A. J. C., and Perona, P. (2018). Empirical characterization of particle size distribution spatial dynamics for helminth eggs detection in waste stabilization ponds (WSP). Water 10, 138. doi: 10.3390/w10020138
Kantoush, S. A., Bollaert, E., and Schleiss, A. J. (2008). Experimental and numerical modelling of sedimentation in a rectangular shallow basin. Int. J. Sediment Res. 23, 212–232. doi: 10.1016/S1001-6279(08)60020-7
Mahongo, S. B., Francis, J., and Osima, S. E. (2012). Wind patterns of coastal Tanzania: their variability and trends. Western Indian Ocean 10, 107–120.
Mara, D. D. (2004). Domestic Wastewater Treatment in Developing Countries. London: Earthscan Publications.
Mara, D. D. (2009). Waste stabilization ponds: past, present and future. Desalinat. Wat. Treat. 4, 85–88. doi: 10.5004/dwt.2009.359
Murphy, C. (2012). Quantifying the Impact of Sludge Accumulation on the Hydraulic Performance of Waste Stabilisation Ponds. (Bachelor thesis). The University of Western Australia, School of Environmental Systems Engineering.
Ndetto, E. L., and Matzarakis, A. (2013). Basic analysis of climate and urban bioclimate of Dar es Salaam, Tanzania. Theor. Appl. Climatol. 114, 213–226. doi: 10.1007/s00704-012-0828-2
Ndyomugyenyi, R., and Minjas, J. N. (2001). Urinary schistosomiasis in schoolchildren in Dar-es-Salaam, Tanzania, and the factors influencing its transmission. Ann. Trop. Med. Parasitol. 95, 697–706. doi: 10.1080/00034980120097151
Nelson, K. L., Cisneros, B. J., Tchobanoglous, G., and Darby, J. L. (2004). Sludge accumulation, characteristics, and pathogen inactivation in four primary waste stabilization ponds in central Mexico. Water Res. 38, 111–127. doi: 10.1016/j.watres.2003.09.013
Ouedraogo, F. R., Zhang, J., Cornejo, P. K., Zhang, Q., Mihelcic, J. R., and Tejada-Martinez, A. E. (2016). Impact of sludge layer geometry on the hydraulic performance of a waste stabilization pond. Water Res. 99, 253–262. doi: 10.1016/j.watres.2016.05.011
Papadopoulos, A., Parisopoulos, G., Papadopoulos, F., and Karteris, A. (2003). Sludge accumulation pattern in an anaerobic pond under Mediterranean climatic conditions. Water Res. 37, 634–644. doi: 10.1016/S0043-1354(02)00307-X
Passos, R. G., Ferreira, V. V. M., and Sperling, M. V. (2019). A dynamic and unified model of hydrodynamics in waste stabilization ponds. Chem. Eng. Res. Design 144, 434–443. doi: 10.1016/j.cherd.2019.02.025
Passos, R. G., von Sperling, M., and Bressani Ribeiro, T. (2014a). Performance evaluation and spatial sludge distribution at facultative and maturation ponds treating wastewater from an international airport. Water Sci. Technol. 70, 226–233. doi: 10.2166/wst.2014.215
Passos, R. G., Von Sperling, M., and Ribeiro, T. B. (2014b). Hydrodynamic evaluation of a full-scale facultative pond by computational fluid dynamics (CFD) and field measurements. Water Sci. Technol. 70, 569–575. doi: 10.2166/wst.2014.265
Rodrigues, V., Possmoser-Nascimento, T., Dias, D., Passos, R. G., Von Sperling, M., and Vasel, J. (2015). Performance comparison between two equal stabilization ponds operating with and without sludge layer. Water Sci. Technol. 71, 929–937. doi: 10.2166/wst.2015.014
Sengupta, M. E., Thamsborg, S. M., Andersen, T. J., Olsen, A., and Dalsgaard, A. (2011). Sedimentation of helminth eggs in water. Water Res. 45, 4651–4660. doi: 10.1016/j.watres.2011.06.017
Shilton, A. (2001). Studies into the hydraulics of waste stabilization ponds. (Ph.D. thesis). Massey University, Turitea Campus, Palmerston North, New Zealand.
Shilton, A., Kreegher, S., and Grigg, N. (2008). Comparison of computation fluid dynamics simulation against tracer data from a scale model and full-sized waste stabilization pond. J. Environ. Eng. 134, 845–850. doi: 10.1061/(ASCE)0733-9372(2008)134:10(845)
Keywords: waste stabilization ponds, pond morphodynamics, pond hydraulics, pond sedimentation, sludge accumulation, helminth eggs
Citation: Izdori F, Semiao AJC and Perona P (2019) The Role of Environmental Variables in Waste Stabilization Ponds' Morphodynamics. Front. Environ. Sci. 7:159. doi: 10.3389/fenvs.2019.00159
Received: 18 June 2019; Accepted: 30 September 2019;
Published: 08 November 2019.
Edited by:
Maria Elisa Magri, Federal University of Santa Catarina, BrazilReviewed by:
André Bezerra Dos Santos, Universidade Federal do Ceará, BrazilElena Bresci, University of Florence, Italy
Copyright © 2019 Izdori, Semiao and Perona. This is an open-access article distributed under the terms of the Creative Commons Attribution License (CC BY). The use, distribution or reproduction in other forums is permitted, provided the original author(s) and the copyright owner(s) are credited and that the original publication in this journal is cited, in accordance with accepted academic practice. No use, distribution or reproduction is permitted which does not comply with these terms.
*Correspondence: Fides Izdori, Zi5pemRvcmlAZWQuYWMudWs=
 Fides Izdori
 Andrea J. C. Semiao1
 Paolo Perona