 Cinzia Perrino1
 Stefania Gilardoni2*†
 Tony Landi2Anna Abita3Isabella Ferrara3Serafina Oliverio4Maurizio Busetto2Francescopiero Calzolari2Maria Catrambone1Paolo Cristofanelli2Stefano Dalla Torre1Giulio Esposito1Marco Giusto1
 Silvia Mosca1Salvatore Pareti1Elena Rantica1Tiziana Sargolini1
 Giorgio Tranchida5
 Paolo Bonasoni2
- 1C.N.R. Institute of Atmospheric Pollution Research, Rome, Italy
- 2C.N.R. Institute of Atmospheric Sciences and Climate, Bologna, Italy
- 3Agenzia Regionale per la Protezione dell'Ambiente, ARPA Sicilia, Palermo, Italy
- 4Agenzia Regionale per la Protezione dell'Ambiente, Arpacal, Dipartimento Provinciale di Crotone Coordinamento attività SIN Servizio Tematico Aerea, Crotone, Italy
- 5Institute of Anthropic Impacts and Sustainability in Marine Environment, Campobello di Mazara, Trapani, Italy
Outdoor air pollution is responsible for more than 4 million premature deaths worldwide and its contribution is particularly severe in industrial contaminated sites, where epidemiological studies highlight often mortality rate larger than the national average. In the framework of the CISAS project, this study investigates spatial and temporal variability of air pollution across three industrial contaminated sites in southern Italy classified as “High Risk Area of Environmental Crisis”: Crotone, Milazzo, and Priolo. The environmental analysis employed three investigation approaches:—meteorological characterization of the sites with analyses of local air mass circulation;—statistical evaluation of the continuous measurements of gaseous pollutants and PM concentration;—determination of mass concentration and detailed speciation of the chemical components of atmospheric particulate matter during intensive field campaigns. Continuous trace gases and aerosol measurements (including NOx, SO2, O3, NMHC, PM10, and PM2.5) over the period 2016–2018 were analyzed, and specific intensive field experiments (2016–2017), representative of winter and summer conditions, were carried out in order to determine PM10 and PM2.5 chemical composition. The analyses of PM components (ions, elemental composition, trace organic pollutants, organic carbon, and elemental carbon) show concentrations typical of rural and urban areas. The results concerning gaseous pollutants and PM concentration showed a general compliance of the concentrations of some regulated species with the limits set by the EU Ambient Air Quality (AAQ) Directive. However, in particular in the industrial areas of Milazzo and Priolo, the analysis here reported highlights the need for a stringent regulation on NMHC ambient concentration and composition, further investigation of fine particle composition and atmospheric processing, and a deeper understanding of the role of anthropogenic emissions on ozone formation, also considering the World Health Organization (WHO) limits.
Introduction
Air pollutants are substances able to harm human health, vegetation, animals, and cultural heritage. The potential impact of atmospheric compounds on humans and the environment is based on toxicological, epidemiological, and exposure studies. Air pollutants include gas phase species, like nitrogen oxides and ozone, as well as chemical species that compose particulate matter in the atmosphere, including metals and black carbon. Moreover, some air pollutants, such as polycyclic aromatic hydrocarbons and dioxins partition between the gas and the condensed phase, depending on ambient temperature.
The toxicological mechanisms through which air pollutant harm human health, as well as the health outcomes can be very different. Air pollutants enter the human body though inhalation and digestion (Kampa and Castanas, 2008). Fine particles and gas can penetrate deep into the lungs and reach the alveoli. In addition, gas and particulate pollutants can deposit on the ground and contaminate water and food. Through the respiratory system and the digestion system, chemicals can induce local inflammatory and oxidative stress or impact other organs (Kelm, 1999; WHO, 2005; Pope and Dockery, 2006). Epidemiological studies highlight a causal link between short-term and long-term exposure to air pollutants and different health outcomes, including nausea, difficulties in breathing, asthma, allergy, pre-term birth, reduced-activity of the immune system, stroke, nervous system damages, pulmonary and cardiovascular morbidity, and mortality (Kampa and Castanas, 2008 and references therein).
Based on the evident link between air pollution exposure and health damages, air pollution is mainly investigated in urban areas, especially in developed countries, where the largest fraction of population lives (WHO Europe, 2006; WHO, 2018). More recently special attention has been dedicated to contaminated areas, where the highest concentrations of pollutants are expected. According to the World Health Organization, contaminated areas are those that host or have hosted industrial activities for production of chemicals and petrochemicals products, energy, cements, as well as plants for waste disposal or treatment (WHO, 2012). Political concerns arise from the fact that human health can be under threat in these areas, both due to residential and professional exposure. Linking health outcomes to specific pollutant or contamination pathways is particularly challenges since hazards are multiple, exposure data are sparse, and proximity of urban areas can increase the complexity of pollution sources (Martuzzi et al., 2014). In particular, characterization of atmospheric air pollutants in contaminated areas is generally limited, compared to soil and water (Zona et al., 2019).
In this study we investigate air quality at three industrial contaminated sites located in southern Italy and classified as “High Risk Area of Environmental Crisis” (AERCA—Area ad Elevato Rischio di Crisi Ambientale): Priolo, Milazzo, and Crotone. The health outcome in these three areas is investigated in details by the national programme of epidemiological surveillance in contaminated sites (Zona et al., 2019), highlighting a higher standardized mortality rate compared to the national average. In particular, in Priolo and Crotone, the largest difference from the national average mortality rate is due to specific causes like pleural mesothelioma and respiratory deceases, which can be directly linked to inhalation of air pollutants.
Time series analysis of air pollution metrics regulated by the national and European legislation (daily concentration of PM10, 8-h running average of ozone and carbon monoxide, and hourly average of sulfur dioxide and nitrogen dioxide concentrations) classifies Priolo air quality as “low polluted” (Monforte and Ragusa, 2018). The lack of markers typical of industrial emissions in this kind of analysis, like non-methane hydrocarbons, might bias the results (Abita et al., 2019). Fazzo et al. (2016) investigated the incidence of cancer in Priolo and suggested a link between health effects and high concentration of contaminants in soil and water. Nevertheless, the lack of data on harmful pollutants in the atmosphere limited the interpretation of the results.
In this work, we analyse the concentrations of regulated and non-regulated atmospheric pollutants in the three AERCA sites with the goal to characterize the air quality and to support the analysis of population exposure to these specific air pollutants. To the authors' best knowledge this is the first study that integrates the analysis gas-phase concentration and detailed aerosol chemical composition in multiple contaminated sites in southern Italy. This work moves away from urban-focused research and aims at addressing the gap related to the limited knowledge on atmospheric pollutant in industrial areas in order to identifying priority and non-traditional pollutants (e.g., organic vapors) that should be monitored in contaminated areas, to better understand the link between air quality and human health in compliance with the WHO guidelines rather than current air quality guidelines.
The approach here described includes:—modeling and meteorological analyses;—statistical interpretation of the data obtained by the regional networks;—field determination of the concentration and chemical composition of particulate matter (PM). The non-hydrostatic meteorological model MOLOCH, developed by CNR-ISAC, was used to calculate high spatial resolution wind fields on annual basis for the region of interest. For the main gaseous pollutants and for PM (concentration only), we carried out a detailed evaluation and interpretation of the existing data from the regional networks. Such dataset was analyzed both to support the design of the experimental field campaigns at Priolo, Milazzo, and Crotone, and to better understand the atmospheric measurements carried out during this study. Field characterization of PM was focused on its chemical composition because the existing regional air monitoring networks record only gaseous pollutants, including NOx, SO2, O3, and NMHC and, in some cases PM mass concentration. The determination of a high number of species in the particulate phase, instead, requires a complex and articulated analytical procedure that, up to now, had never been implemented in the investigated areas.
This study is part of the national research project CISAS (International Centre of advanced study in environment, ecosystem and human health), which aims at understanding processes and mechanisms responsible for the transfer of conventional and emerging contaminants from the environment to the ecosystem and to humans, in contaminated areas.
Materials and Methods
Sites Description
The study was carried out at three polluted sites located in southern Italy and classified by the Italian Ministry of the Environment as Site of National Interest—High Risk Area of Environmental Crisis AERCA (Area ad Elevato Rischio di Crisi Ambientale). These sites, Crotone, Milazzo, and Priolo, shown in Figure 1, are defined as large and contaminated areas where environmental pollution may cause an important impact in terms of health and ecological risk, as well as a detriment to cultural and environmental heritage. These three AERCA sites are also considered in the “SENTIERI Project: Mortality study of residents in Italian polluted sites”, aiming at evaluating the epidemiological evidence on the association between 63 different causes of death and environmental exposures (Zona et al., 2019).
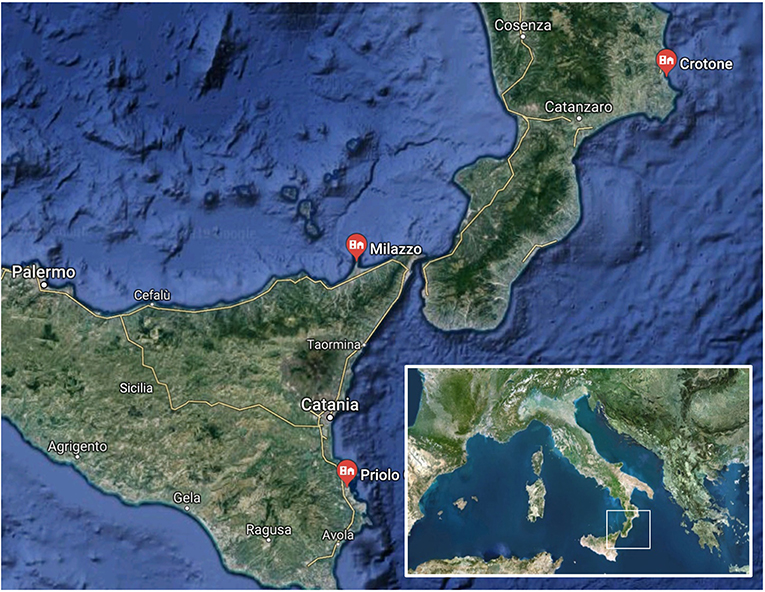
Figure 1. Map of the investigated AERCA sites generated from google map (https://www.google.it/maps).
The three areas have a millennial history, proved by many important archaeological evidences, and have seen an important industrial development during the last century.
Crotone is a coastal city of about 65,000 inhabitants, sited in the Calabria region. The industrial development took place between the two World Wars, with a chemical industry, a metallurgical plant producing zinc alloys and other minor plants. The two main industries were at their maximum activity during the sixties but suffered from a deep crisis during the eighties and were closed at the end of the century, leaving a number of unsolved remediation problems.
The AERCA of Comprensorio del Mela (in the following denoted Milazzo) and of Siracusa are located in Sicily. The Milazzo AERCA includes Milazzo and also Condrò, Gualtieri Sicaminò, Pace del Mela, S. Filippo del Mela, Santa Lucia del Mela, San Pier Niceto. Milazzo is a city of about 30,000 inhabitants sited on the north-eastern coast of Sicily. The industrial development sharply increased during the fifties and sixties with a steel industry, energy production plants and, most of all, the widest oil refinery in Europe, which is still in business.
The AERCA of Siracusa (in the following denoted Priolo), with the municipalities of Priolo Gargallo (12,000 inhabitants), Augusta (36,000 inhabitants), Melilli (13,000 inhabitants), Siracusa (122,000 inhabitants), Floridia (23,000 inhabitants), and Solarino (8,000 inhabitants), covers an area of 550 km2. This AERCA includes the huge Siracusa petrochemical district (the widest in Europe, about 27 Km2) that extends from the north of Siracusa to Augusta, where the main industrial activities include oil refinery, processing of oil-related products and energy production. Born in the fifties and in the two following decades, many of the industrial plants reduced their activity from the eighties, causing serious remediation problems.
Based on 2012 Sicily emission inventory, industrial activities account for 67% of NMHC and 96% of SO2 emissions in the Sicilian industrial areas. NOx, which on regional average is mainly due to traffic emissions (55%), at the industrial areas combustion and non-combustion industrial emissions account for 57% of local NOx emissions and the contribution of traffic is less significant (24%) (Abita et al., 2016).
Continuous Atmospheric Observations
Selection of Measurement Sites
In this study, continuous atmospheric measurements in the period 2016–2018 have been considered, thanks to long term measurements of atmospheric gas phase species and particulate matter mass concentration recorded in Sicily and Calabria regions by Regional Environmental Protection Agencies, ARPA (Agenzia Regionale Protezione Ambiente). Table 1 describes the monitoring sites, grouped by AERCA areas, considered during the present study for air quality continuous observations. Sites were selected based on data availability and their representativeness of different environments inside each AERCA. Santa Lucia del Mela (SLM), contrada Gabbia (GAB), and Termica (TER) are representative of the Milazzo AERCA; Melilli (MEL), Priolo (PRI), and Scala Greca (SCG) are representative of the AERCA of Priolo, while Rocca di Neto (RDN) and Giovanni da Fiore (GDF) are representative of the Crotone area. For Priolo and Milazzo AERCAs we identified a site that might be affected by processed/aged industrial emissions, and hereafter indicated as “downwind.” In addition, we consider a station located nearby plants and representative of the industrial area, and a site representative of urban conditions. In the Crotone area we present data exclusively from an urban site (GDF) and a downwind location (RDN).
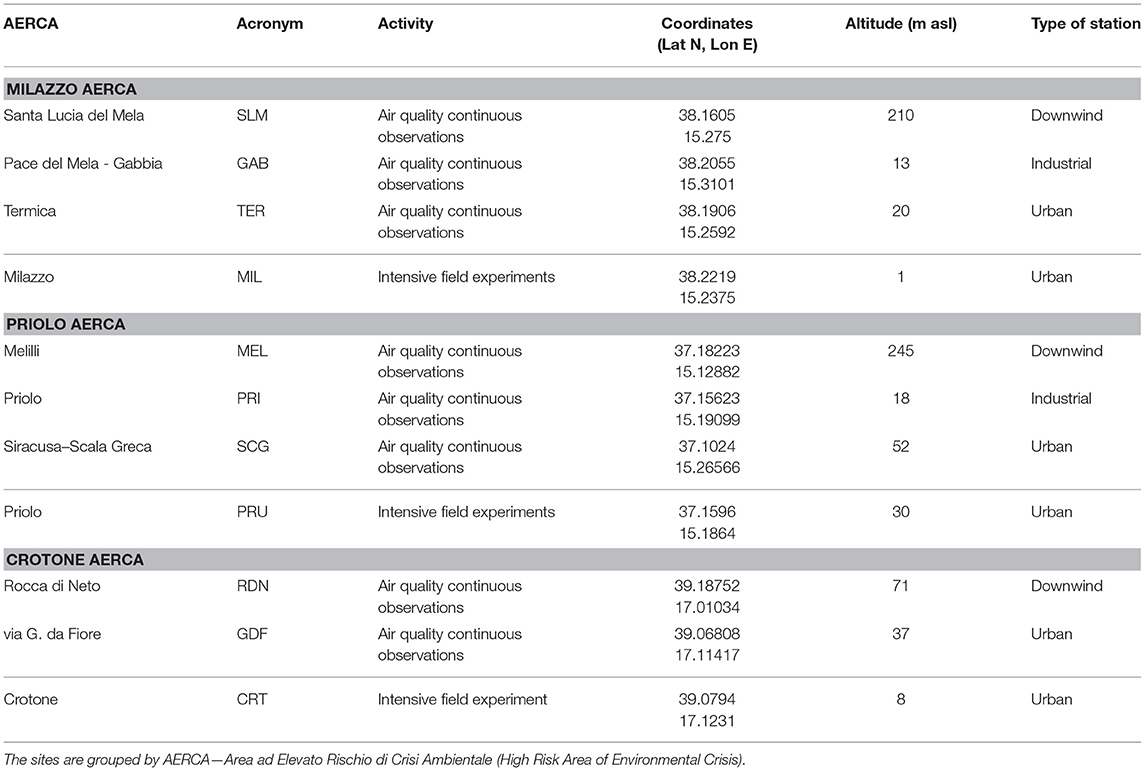
Table 1. List of monitoring sites included in the present study.
Instrumental Setup
Gas phase species here investigated include nitrogen oxides (NOx), sulfur dioxide (SO2), total non-methane hydrocarbons (NMHC), and ozone (O3). These gas phase pollutants are monitored continuously by the monitoring network of the ARPA Sicily and Calabria. NOx measurements are performed by a Teledyne API 200E NOX Chemiluminescent analyzer, while SO2 is monitored by a Teledyne API Model 100E analyzer, based on fluorescence signal induced by UV energy absorption. NMHC are quantified by gas chromatography with a NIRA analyzer model 301. O3 is monitored based on UV light absorption signal with a Teledyne API ozone analyzer model 400E. Hourly average concentrations are stored after validation, based on the number of valid measurements within each hour (minimum data coverage is set at 75%) and on the difference between daily span measurements and calibration values. Every 6 months, certification tests are applied to verify the consistency with long-term data records and among sites. Daily PM2.5 and PM10 mass concentration is measured through beta absorption with a FAI Instrument SWAM dual channel. Particulate matter samples are collected from midnight to midnight at a flow rate of 2.3 Nm3/h.
In the Priolo and Crotone AERCAs the data coverage is larger than 93% at all sites and during all seasons. In the Milazzo AERCA, due to lack of measurements during the second part of 2018, concentration of gas phase species in summer and fall are under-represented; nevertheless, seasonal variability is well-captured during 2016 and 2017 for NOx, O3, and SO2. NMHC data coverage at GAB ranges between 30 and 38% (April 2017–April 2018), while at TER it ranges between 58 and 60% (January 2016–December 2017). Since all seasons are represented by the two time-series, even if limited to 1 and 2 years, respectively, these data were considered in further analysis.
Intensive Field Experiments
Site Selection
Since the CISAS project was aimed at investigating the link between air quality and health of the people living in the study areas, it was decided to locate the PM sampling stations in central, residential areas characterized by a high number of exposed individuals, instead of considering the areas of maximum impact of the industrial emissions. The following three sampling sites were selected (see Table 1). Crotone: close to a traffic street, at about 2 Km from the industrial area; Milazzo: on the terrace of a school, at about 3 Km from the oil refinery; Priolo: close to the Municipality building, at about 1.5 Km from the petrochemical district.
Sampling Periods
In order to evaluate the average concentration affecting the citizens and, at the same time, keep the economic budget to a reasonable level, we designed a schedule characterized by long-duration samplings and by the determination of many chemical components, instead of carrying out daily samplings that would necessarily be few in number of samples or in number of chemical determinations. It was decided to monitor the air concentration of both PM10 and PM2.5 and of their chemical components for a time period of 6 months over 1 year. Each sampling period lasted for 1 month and was simultaneously performed at the three AERCAs; three of the six samplings periods were during the winter (from December 15th, 2016 to March 14th, 2017) and three during the summer (from July, 5th to October 4th, 2017). With a relatively small number of PM characterizations and affordable costs it was thus possible to obtain a reliable evaluation of the concentration and chemical composition of particles of different size and during different and characteristic period of the year.
Experimental Design
The choice of two size fractions (PM10 and PM2.5) allowed a distinction between anthropic and natural source contributions. Anthropic sources (combustion processes and industries) emit almost exclusively in the fine fraction of PM, the same fraction where the species produced by atmospheric reactions (secondary pollutants) are found. Natural sources (sea-salt, soil, bio-aerosol), instead, release particles mainly in the coarse fraction (difference between PM10 and PM2.5).
Two groups of analyses were carried out on the sampled filters, for a total of more than 100 chemical determinations on each sample. The first group of analyses were carried out on both PM10 and PM2.5, in duplicate (two side-by-side samplings, analyzed individually), for a total of 72 samples (three sites, 6 months, two size fractions, two replicates). They include: elements, inorganic ions, elemental carbon, and organic carbon. The analysis in the second group were carried out on PM10 only, on two 15-day samplings for each month, for a total of 36 samples (three sites, 6 months, two samples per month). They include micro-organics: polycyclic aromatic hydrocarbons (PAH), polychlorinated dibenzodioxins (PCDDs), polychlorinated dibenzofurans (PCDFs), dioxin-like polychlorinated biphenyl (dl-PCB), polybrominated diphenyl ethers (PBDEs).
The choice of the analyses to be carried out followed two main criteria: species that are toxic/carcinogen (micro-organics and some elements) and species that are major components of PM. PM major components (typically constituting more than 1% of the PM mass) include some elements (Al, Si, Fe, Na, K, Mg, Ca), inorganic ions (Cl−, , , Na+, , K+, Mg++, Ca++), elemental carbon (EC) and organic carbon (OC, including the whole of organic species). When all these components are detected it is possible to obtain the mass closure, that is the coincidence between the measured mass and the sum of the measured PM components (reconstructed mass). Obtaining the mass closure proves the good quality of the analytical phase. Moreover, the individual chemical determinations can be grouped in order to obtain a picture of PM macro-sources, that is, the main, ubiquitous sources of the atmospheric aerosol (soil, sea, atmospheric reactions, combustion, biomass/biosphere) (Perrino et al., 2014).
PM Sampling
At each site the samplings were carried out simultaneously, by using three PM samplers: two for ions, elements and EC/OC in duplicate, one for micro-organics. The instruments are shown in Supplementary Material.
For PM mass, ions, elements and EC/OC we used instruments operating at the flow rate of 10 L min−1 (Silent Sampler, FAI Instruments) equipped with 4-position sequential units. The sequential units were arranged as follows: (1) PM10 impactor and Teflon filter; (2) PM10 impactor and quartz filter; (3) PM2.5 impactor and Teflon filter; (4) PM2.5 impactor and quartz filter. Teflon filters (filters with polyethylene ring, 47 mm in diameter, 2.0 μm pore size, Whatman) were used to determine ions and elements; quartz filters (47 mm in diameter, QM-A Whatman) were used to determine elemental and organic carbon. These samplings were carried out in duplicate to compensate for possible malfunctions and to increase the accuracy of the analytical determinations. In order to carry out 1-month samplings without overloading the filters but keeping time representativeness, every 2 h we activated the sampling for 30 min and stopped it for 90 min (duty cycle 1:4).
Given the very low air concentration of micro-organics, we sampled PM10 by using high volume samplers operated at the flow rate of 100 L min−1 (Echo High Volume Sampler, TCR Tecora). We used quartz filters 102 mm in diameter and downstream polyurethane foam cartridges, aimed to recover semi-volatile species. Before each sampling, the filters were spiked with a known amount of 13C- labeled standard (EN 1948SS for PCDD/F, P48-SS for dl-PCB, Wellington Laboratories), in order to evaluate the collection efficiency.
Analysis of PM and PM Components
PM mass was determined on Teflon filters by gravimetric analysis, using an automated microbalance (1 μg sensitivity, mod. ME5, Sartorius AG), after conditioning at 50% R.H. and 20°C for 48 h.
The collected filters were then analyzed by for their elemental content (Al, Ca, Cl, Cr, Fe, K, Mg, Mn, Na, Ni, Pb, Si, S, Ti, V) by energy dispersive X-ray fluorescence (ED-XRF; Xepos, Spectro Analytical Instruments); then the polyethylene ring was removed and the filters were US extracted in deionized water (20 min).
A first aliquot of the solution was analyzed for its ionic content (Cl−, , , Na+, , K+, Mg++, Ca++) by ion chromatography (IC; ICS1000, Dionex).
The residual amount was added with acetate buffer (0.01 M; pH 4.5), filtered by using nitrate cellulose filters (0.45 μm pore size, Millipore) and analyzed for the soluble fraction of micro- and trace- elements (As, Be, Cd, Ce, Co, Cu, Cs, Fe, La, Li, Mn, Mo, Ni, Pb, Rb, Sb, Se, Sn, Sr, Tl, U, V, Zr) by inductively coupled plasma mass spectroscopy (ICP-MS; Brucker 820-MS). The solid left on both the Teflon filter and the NC filtration filter was then transferred to a PTFE vessel and HNO3/H2O2 2:1 solution was added to mineralize the residual solid matter. After digestion in microwave oven (Ethos 1 Touch Control, Milestone), the solution was filtered again at 0.45 μm and analyzed by ICP-MS for the residual fraction of the same elements. The chemical fractionation of the total elemental content into a water-soluble and a residual fraction adds useful information for the identification of PM sources and enhances the estimation of the elemental bio-accessibility (Canepari et al., 2009a, 2014).
Forty seven millimeter quartz filters were analyzed for their organic carbon (OC) and elemental carbon (EC) content by thermo-optical analysis (OCEC Carbon Aerosol Analyzer, Sunset Laboratory, OR, USA), applying the NIOSH-quartz temperature protocol.
Further information about the whole analytical procedure, previously validated, are available in Canepari et al. (2009b); Perrino et al. (2011, 2014). A scheme of the method is reported in Figure 2.
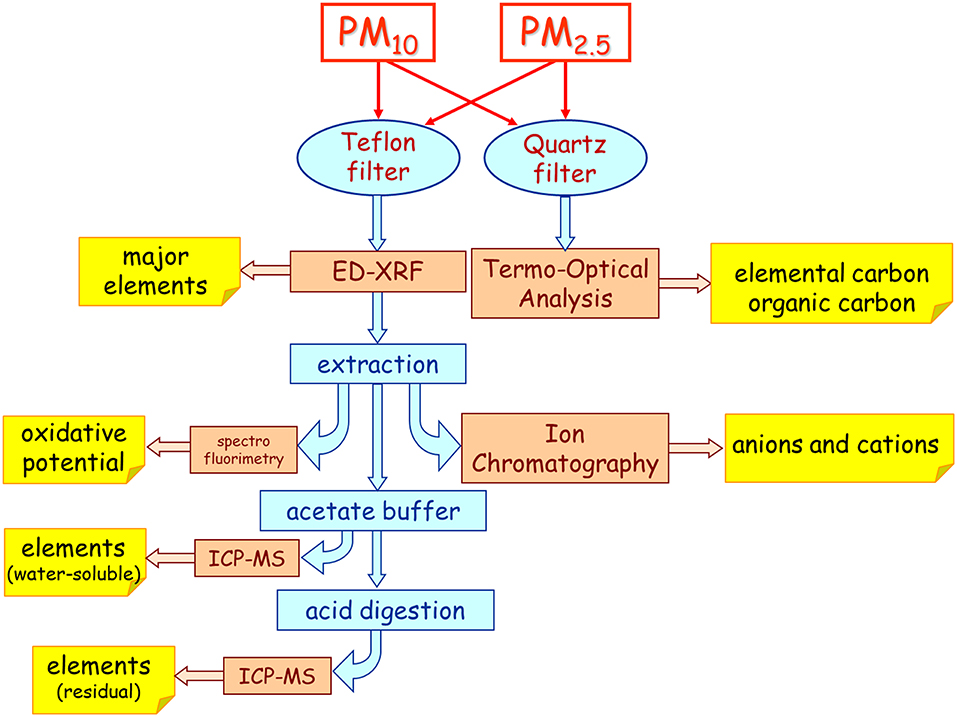
Figure 2. Schematic diagram of the analytical procedure for determining elements, ions, elemental carbon, organic carbon, oxidative potential.
For the determination of micro-organics, 102-mm quartz filters and PUF cartridges were Soxhlet extracted in toluene for 36 h. PCDD/F, dl-PCB and PBDE 13C- labeled standards were added before the extraction to evaluate the efficiency of the extraction, purification, and enrichment phases. The extract was concentrated to about 10 ml; a 1/10 aliquot was used for the analysis of Polycyclic Aromatic Hydrocarbons (PAH), the residual solution was used for the determination of PCDD/PCDF, dl-PCB, and PBDE.
For the analysis of PAH the extracts were spiked with perdeuterated PAHs used as internal standard (L429-IS, Wellington Laboratories), then they were concentrated under a gentle stream of nitrogen and purified by using a silica/alumina micro-column. The aliphatic fraction was eliminated through elution with hexane; PAHs were eluted by hexane:dichloromethane (1:1 v/v) and analyzed by GC-MS, operating in single ion monitoring mode (Ultra Trace gas chromatograph coupled to TSQ mass spectrometer, Thermo Scientific). Recovery standards (L429-RS, Wellington Laboratories) were added before injection.
The aliquot for the analysis of PCDD/F, PCBs and PBDE was transferred quantitatively on multi-layer chromatographic column (packed manually with anhydrous Na2SO4, silica, acidic silica, and silica containing AgNO3); the sample was eluted with 150 ml hexane, then with 100 ml of a mixture hexane: methylene chloride (1:1) and concentrated. The eluate, brought to a volume of a few μL, was analyzed in GC/MS (MS/MS mode) after addition of PBDE internal injection standards. Finally, the sample was transferred on glass micro-column containing alumina. The fraction containing the PCBs was collected by eluting with a mixture of hexane with 4% methylene chloride; the fraction containing PCDD and PCDF was subsequently collected by eluting with a mixture hexane: methylene chloride (1:1). Both fractions were concentrated, made up with mixtures of internal standards for recovery calculation and analyzed by GC/MS (MS/MS mode).
The list of the individual PAH, PCDD, PCDF, dl-PCB, and PBDE determined in this study is reported in Supplementary Material.
Results
Meteorological Characterization and Air Masses Circulation
Seasonal Regimes
Meteorological measurements performed at the three AERCA sites were analyzed for the 3-year period 2016–2018. Such analyses are based on data made available by the Regional Environmental Protection Agencies of Sicily and Calabria. The measurement sites are located on coastal areas, close to the see, as shown in Figure 3, where seasonal wind roses for the above-mentioned sampling sites are reported.
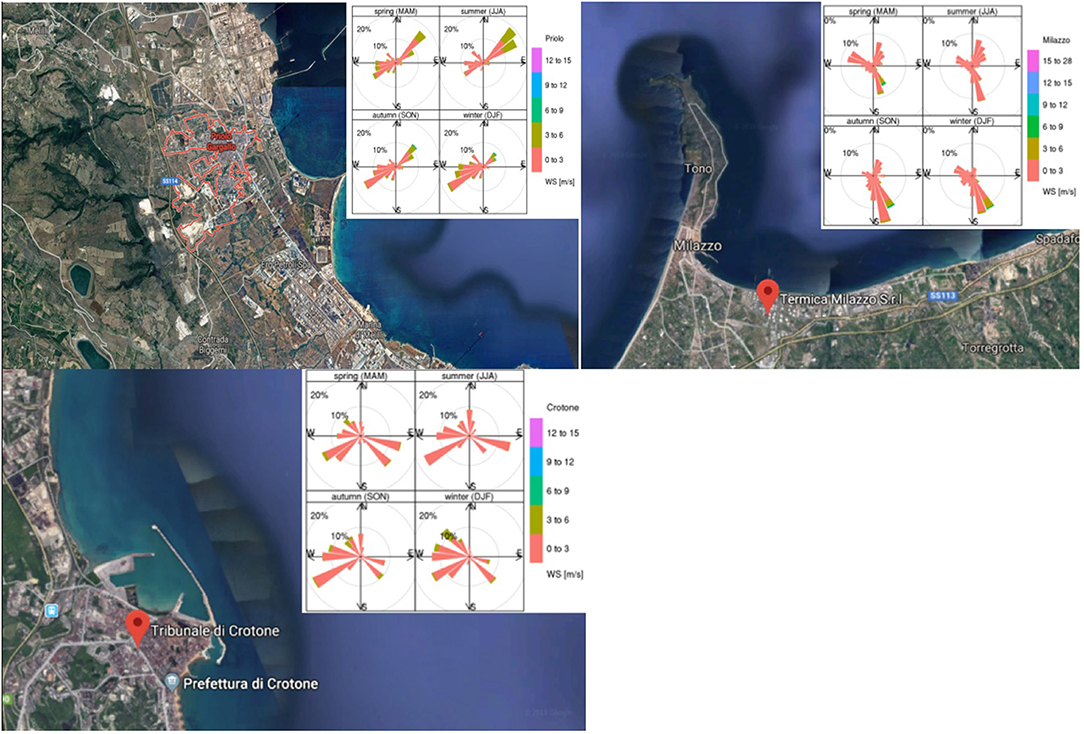
Figure 3. Wind roses of observed seasonal wind speed and direction are shown for Priolo (upper panel), Milazzo (middle panel), and Crotone (lower panel). The integration period ranges between January 2016 and December 2018. The colorbar indicates the wind speed [m/s], keeping in mind that 5 m/s is the max wind intensity for wind breeze regimes. The concentric circumferences represent the occurrence (%) of wind direction calculated over all period (maps were generated by superimposing the wind roses and the google map - https://www.google.it/maps - screenshots of the regions of interest).
Wind roses point out that the dominant regimes, in terms of occurrences of wind direction and related wind magnitude, are strongly associated with sea and land breezes for the three sampling sites. Typically, for the coastal sites, the sea-breeze frequency is more pronounced in summer during the daytime, and land-breeze in winter during nighttime. The polar plots (not shown), elaborated for the measurements collected at Priolo, Milazzo and Crotone, confirm such features.
Local Circulation Description
In the absence of synoptic flow, during the day the sea breeze front progresses toward inland normal to the coastline, at speeds of 1–5 m/s and can reach 20–50 km inland by the end of the day. On contrary, at night-early morning, cold air from land flows out to sea in analogous manner to the sea breeze, although there have been insufficient observations of its propagation across the water to be conclusive (Stull, 2012). For instance, for Priolo sampling site, the literature (i.e., Brusasca, 2004) reports that the frequency of breeze regime is of about 60% on annual basis.
Based on the analysis of local wind data, the plots of day hours as function of wind speed and direction (Figure 4), allows to determine the diurnal and nocturnal wind patterns associated to sea/land breeze circulation system. Synoptic circulation associated with stronger winds (e.g., wind speed larger than 6 m/s) are sporadic (frequency <5% of hours per year). As expected, sea breeze is dominant during the warmer part of the day and it results in stronger winds during the spring and summer. At Priolo we observe a persistent sea breeze from North-East (NE) during the central hours of the day (11–16 UTC). Such feature is present at the sampling site in Milazzo, from North-North-East (NNE), and in Crotone from East-South-East (ESE), as reported in the Figure 4 where the frequency of hourly wind direction is reported for the three sampling sites. In Crotone, however, it is not so pronounced as in the other two locations. On the other hand, land breeze is stronger and more frequent than sea breeze during the colder seasons at all the sampling sites: at Priolo from West-South-West (WSW), at Milazzo from South-South-East (SSE), and at Crotone from West (SW), as reported in the Figure 4. It is important to keep in mind that, in the complex orography conditions, in many real situations, ambient synoptic or mesoscale winds can modify, or even eliminate the weak geographical circulation. For instance, if the background synoptic flow is in the same direction of sea breeze, its front speed is well-approximated by a linear sum of the imposed wind component perpendicular to the front, and the speed of the front in still air.
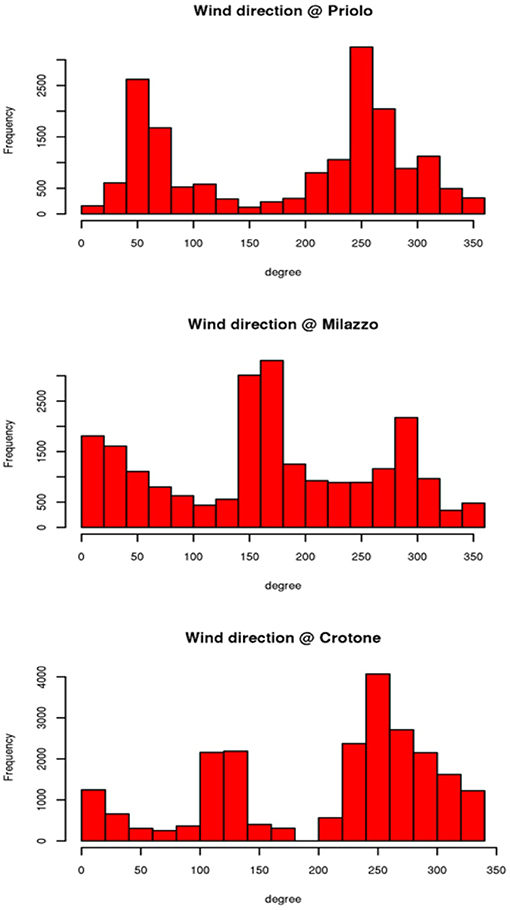
Figure 4. Histograms of frequency of hourly wind direction at the sampling sites as described in Figure 3.
Thus, the characterization of the typical local circulation is actually important for pollutants dispersion and dilution within the planetary boundary layer. Basically, the industrial areas and the major traffic sources span along the coastal line for the three sites. During the warmer seasons the high densely populated areas are located down-wind from the industrial and traffic areas, which results in pollutants transport originating mainly from industrial activities toward the urbanized parts. Such situation is associated with the people exposure to the poor air quality conditions for Priolo, Milazzo, and Crotone as well.
Continuous Atmospheric Observations
In order to characterize the seasonal variation of regulated and non-regulated trace gases NOx, SO2, NMHC, and O3 and atmospheric aerosol PM2.5 and PM10 for every AERCA, we consider three different areas classified as Industrial, Urban, and Downwind, as reported in Table 1.
For the considered pollutants, means of daily average concentrations are reported in Table 2, where for O3 the daily maximum of 8-h running average is used instead of daily average.
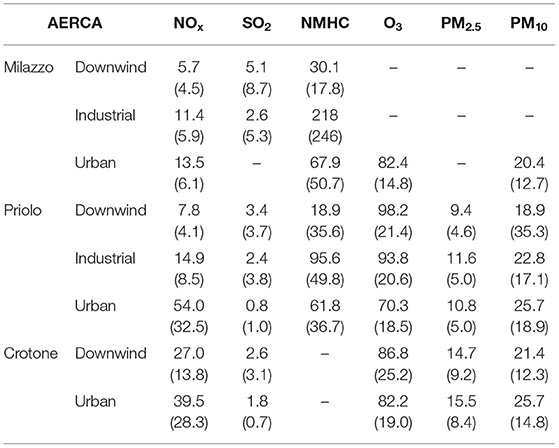
Table 2. Averaged concentration of investigated gas-phase species over the entire study period in μg/m3 (standard deviation is indicated in brackets) (January 2016–December 2018).
The seasonal variability of each trace-gas pollutant at the investigated sites is shown in Figure 5 while the box plots of PM2.5, PM10, and PM2.5/PM10 daily means are shown in Figure 7.
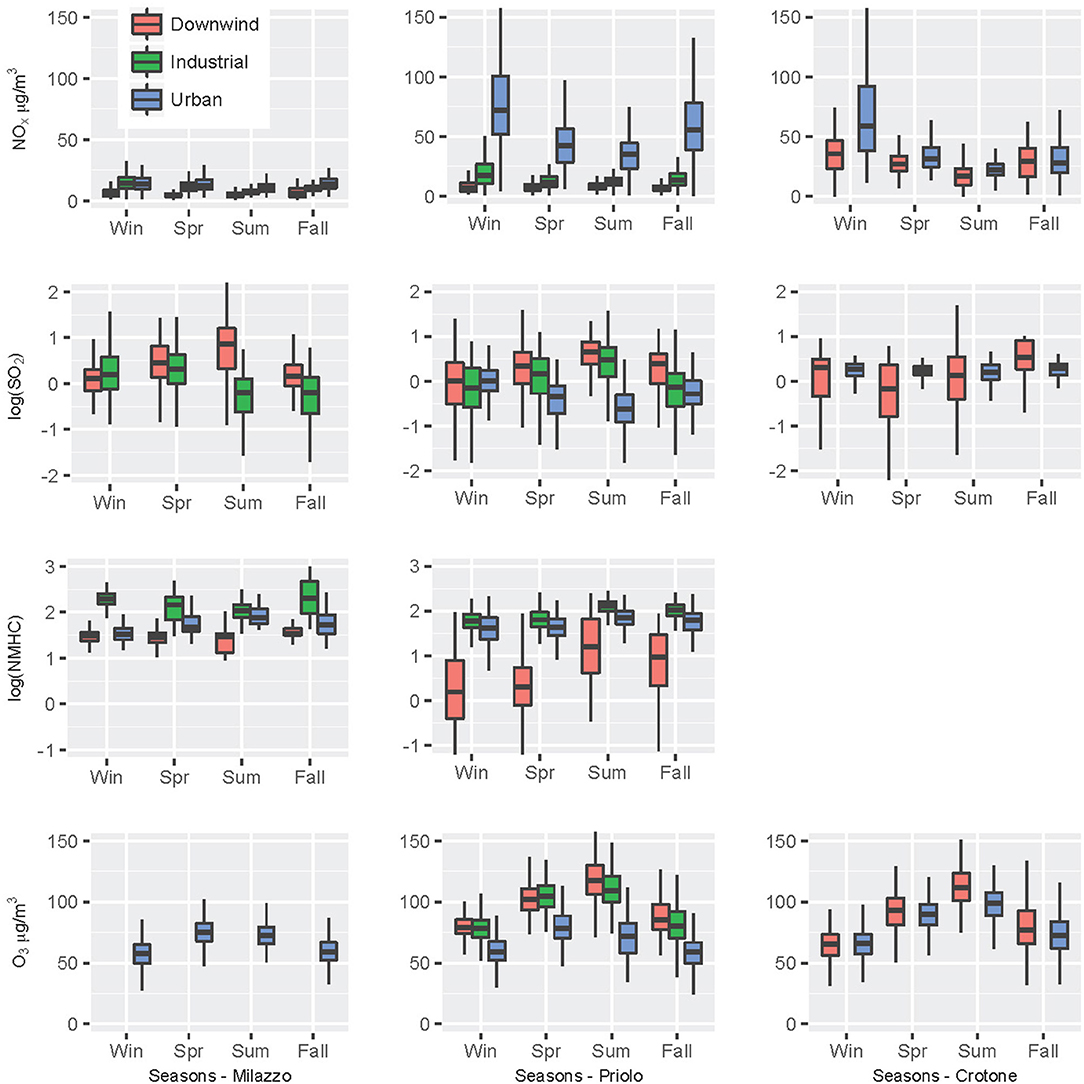
Figure 5. Box plot of NOx, SO2, and NMHC daily means and O3 8-h means grouped by AERCA and season. Each colored column corresponds to a different AERCA site, according to Table 1.
Gas-Phase Pollutants
NOx is emitted during combustion processes at high temperature, and main emission sectors are, based on regional inventory data (2012) of Sicily, road transport (55%) and energy production (15%) (Regione Siciliana, 2018). In addition, low temperature combustion, such as open-fire biomass burning and domestic heating, could represent an additional source of NOx not included in conventional emission inventories (Schultz et al., 2015). In each AERCA, NOx concentrations are higher at the urban sites, followed by the industrial areas. Comparing NOX concentrations at the urban sites, they are lower in the Milazzo AERCA due to the small size of the urban agglomerate where the monitoring station is placed. Seasonal behavior shows higher values during the cold season and minimum during the warmer period, due to the lower atmospheric lifetime (Gilge et al., 2010; Schultz et al., 2015). This result agrees with observations reported by Cristofanelli et al. (2017), who showed similar seasonal cycle for other location in southern Italy.
According to the emission inventory of the Sicily region, the main SO2 anthropogenic sources are energy production (65%) and industrial processes (26%); however, the central Mediterranean represents a European hotspot for the impact of ship emissions on air chemistry (Becagli et al., 2012) with a special emphasis on SO2. In the Milazzo and Priolo AERCAs, SO2 concentrations at the industrial and downwind areas are comparable, indicating well-mixed anthropogenic emission (industrial activities and ship emissions) from emitting sources to surrounding regions.
The term non-methane hydrocarbons (NMHC) refers to low molecular weight hydrocarbon composed by 2–12 carbon atoms, including linear and branched alkanes, alkenes, alcohols, ketones, and aromatic compounds (Bustaffa et al., 2016).
The sources of atmospheric NMHC include anthropogenic and natural emitters so that that different sources are characterized by different chemical fingerprints. Main anthropogenic sources are thermal plants, traffic, and industrial processes, while natural sources are vegetation, marine, and soil emissions (Seinfeld and Pandis, 1998). Nevertheless, NMHC data collected in the AERCA areas do not give information about their chemical speciation, and the term NMHC here refers to the sum of the different chemical species. At the Milazzo and Priolo AERCAs, where NMHC are recorded, a distinctive spatial pattern can be observed, with the highest concentrations in the industrial areas, and one to two orders of magnitude lower levels at the downwind sites. The spatial pattern suggests that anthropogenic emissions are dominating over natural ones in these regions. NMHC ambient concentration was regulated by the DPCM 28/03/1983, setting at 200 μg/m3 the limit of hourly measurements. After the abrogation of such legislation, there is no limit to NMHC ambient levels. The reference value of 200 μg/m3 of hourly measurements (DPCM 28/03/1983), is exceeded for a significant fraction of time at the two industrial sites: 31% of the time at Milazzo AERCA and 14% of the time at Priolo. The NMHC at the industrial sites show often peak events that last from a few hours up to a day, with hourly maximum concentration higher than 1,000 μg/m3. The NMHC seasonal behavior, similar at the two AERCAs, shows higher concentration in summer, in agreement with a likely contribution of industrial fugitive emissions, favored by higher summer temperatures.
Ozone is a secondary pollutant formed in the troposphere by NOx, CO, and NMHC, which react in the presence of sunlight (Lelieveld and Dentener, 2000). Long-term objective for O3 sets a maximum daily 8-h mean concentration at 120 μg/m3 (Ambient Air Quality AAQ EU Directive1) and 100 μg/m3 (WHO). At the Priolo and Crotone AERCAs, where measurements are available at multiple sites, O3 concentrations are the highest at the downwind sites and the lowest at the urban sites, showing a spatial pattern opposite to that of NOx. O3 pattern can be attributed to ozone titration by nitrogen oxides and photochemical production in the polluted air masses. The mean O3 level for downwind and industrial areas ranges between 88 and 98 μg/m3, confirming the high concentrations measured in these coastal areas of Sicily, where the seasonal trend shows maxima in summer and minima in winter and fall in agreement with atmospheric photochemical production rate (Figure 5). In the AERCAs, the AAQ and WHO limits are exceeded most of the time in spring and summer, both at the downwind and nearby the industrial areas. In fact, over the investigated period, O3 8-h mean was higher than 100 μg/m3 (120 μg/m3) 42% (14%) of the days at the downwind and 39% (9%) at the industrial sites of Priolo, while at urban area of Milazzo AERCA, the limit was exceeded 11% (1%) of the time. In the Crotone AERCA, O3 exceeded the limits 32% (10%) of the days at downwind and 19% (2%) at urban areas.
In view of this result, the contribution of anthropogenic activities on O3 levels in the Priolo AERCA during the four seasons was investigated, considering the diurnal behavior of O3 concentrations at industrial and downwind areas under sea breeze conditions, i.e., when the wind direction measured at downwind site ranged between 45 and 135 degree and wind speed was below 5 m s−1 (Figure 6). These conditions allow the selection of time-periods when downwind area is reached by air masses from the sea that sweep the industrial areas along the coast. Interestingly, the O3 diurnal variations registered at industrial and downwind areas overlap most of the time with a lower O3 concentration at the polluted industrial site in the morning, concomitant with the rush hour increase in NOx concentration, as reaction of NO leads to O3 titration. Typical O3 diurnal variation shows a broad maximum in the early afternoon, due to the combined effect of local photochemical production, enhanced vertical air mass mixing with boundary layer and entrainment zone, and transport of air masses from off-shore. During winter, spring, and fall the maximum is less pronounced than in summer.
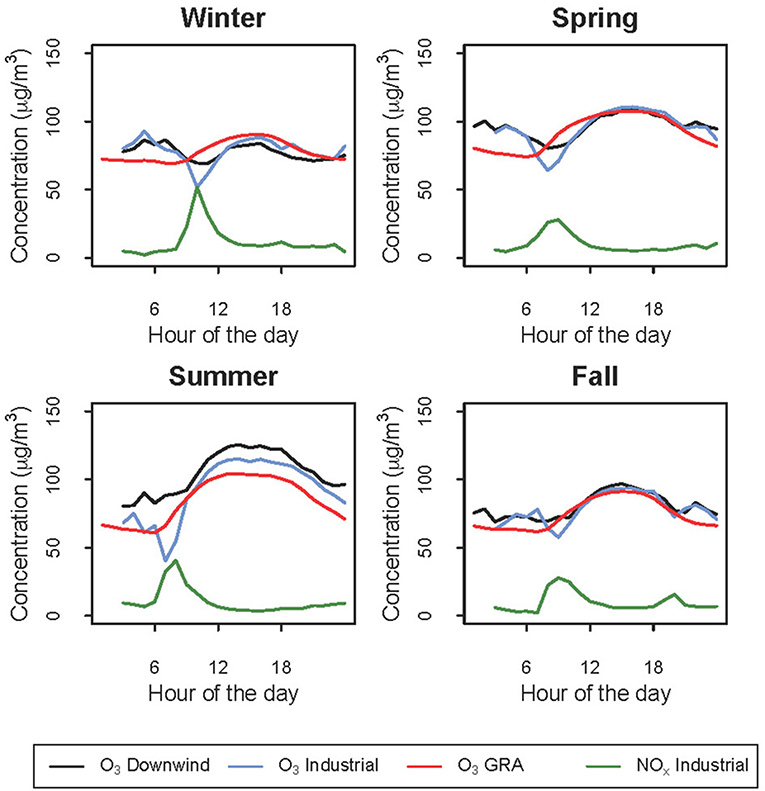
Figure 6. Ozone seasonal diurnal variation under sea breeze conditions at the Priolo AERCA sites: industrial (blue lines), downwind (black lines) and at the regional background coastal site of Capo Ganitola (red lines), together with NOX diurnal trend in industrial area (green lines).
In order to better understand the high annual O3 mean as well as the high O3 diurnal concentrations registered at this AERCA site, the O3 measured at Capo Granitola (GRA), a WMO-GAW regional station representative of a background coastal site in Sicily (Cristofanelli et al., 2017), is considered and reported. The average O3 concentration (calculated from daily maximum of 8-h running averages) was 82.2 μg/m3. The comparison among downwind and industrial AERCA Priolo sites, and GRA suggest that the high background O3 concentration, which typically affect the Mediterranean basin, contributes to the high O3 levels observed in southern Italy, also during night-time, for great part of the year (Lefohn et al., 2018). However, the comparison points out higher O3 night-time at the AERCA sites, probably indicating the impact of recirculation of O3 photochemically produced during day-time. The diurnal variations in Figure 6 show a clear increase at the industrial site and, although less pronounced, at downwind in the afternoon hours during the summer season, when O3 concentrations are higher than night-time levels. In particular, the higher downwind O3 values in respect to industrial areas, confirm the contribution of anthropogenic activities to O3 formation during the warmer season in the industrial/urban where also the highest concentration of NOx and NMHC are observed: under sea breeze regime, the air masses are enriched with O3 in presence of high solar radiation and transported toward downwind areas, where O3 concentrations remain higher due to the absence of compounds capable of destroying it.
Particulate Matter (PM)
The seasonal trend of PM mass concentration at the three AERCAs is shown in Figure 7. Milazzo AERCA is characterized by only PM10 measurements at the urban site, where large day-to-day variability is observed, although daily concentrations never exceed the WHO limit of 50 μg/m3. At the Priolo AERCA. PM10 is characterized by a clear spatial pattern with increasing concentrations moving from downwind to industrial and then to urban area. The urban area is also the site characterized by the lowest PM2.5 to PM10 ratio, often lower than 0.5, indicating a significant contribution of coarse particles, likely due to traffic re-suspension, in agreement with the observed high NOx values.
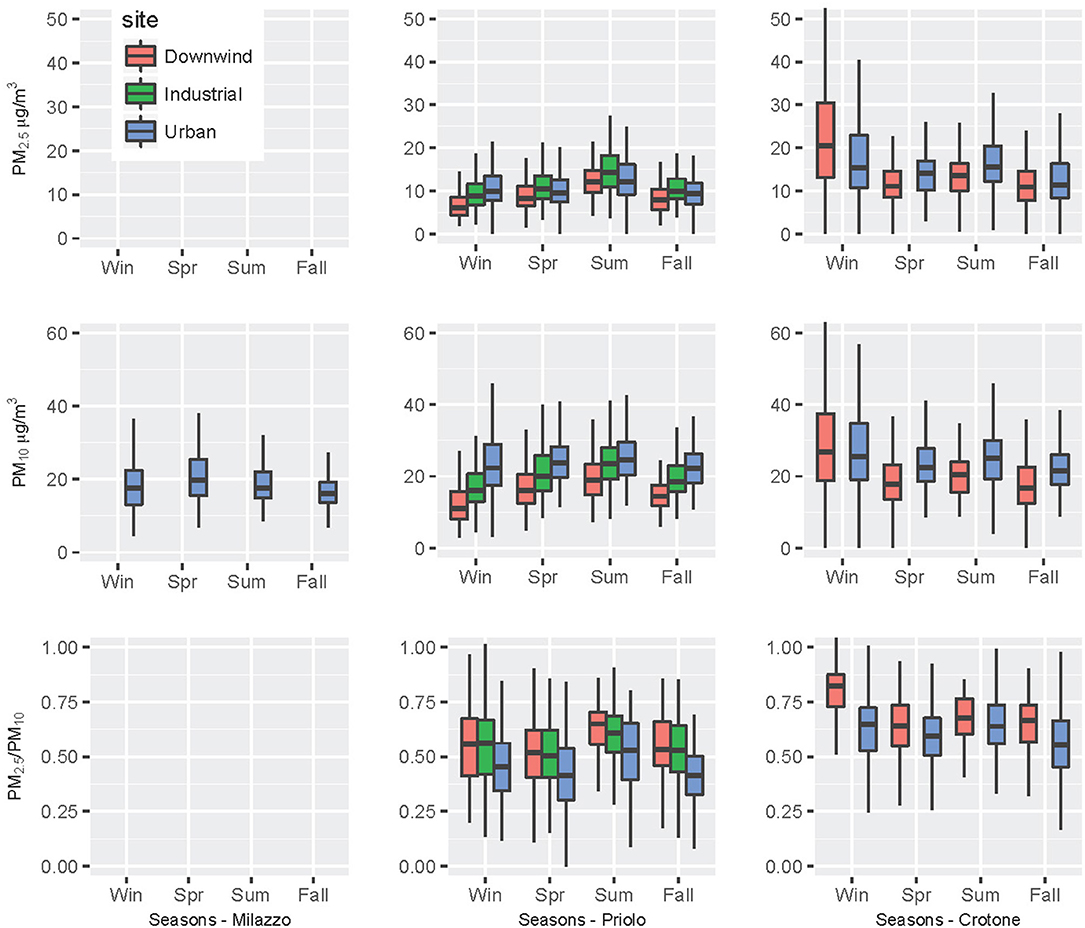
Figure 7. Box plot of PM2.5, PM10, and PM2.5 to PM10 ratio daily means grouped by AERCA and season. Each column corresponds to a different AERCA site, according to Table 1.
Intensive Field Experiments
PM10 and PM2.5 concentrations during the 6-month intensive study period is reported in Figure 8. Monthly mean concentration of PM10 at the three sites ranged between 15 and 35 μg/m3 and never exceeded the 1-year concentration limit set by the European Union (40 μg/m3; EU Directive 2008/50/EC2). PM2.5 concentration ranged between 8 and 19 μg/m3, also in this case below the target concentration value of 25 μg/m3. The more restrictive concentration values set by the WHO, 20 μg/m3 for PM10 and 10 μg/m3 for PM2.5, were instead exceeded in all three sites: the mean 6-month PM10 concentration was 23.0 μg/m3 in Crotone, 20.3 μg/m3 in Milazzo, and 22.9 μg/m3 in Priolo (mean value of the two duplicate measurements during the six periods), while the concentration recorded for PM2.5 was 13.8 μg/m3 in Crotone, 10.6 μg/m3 in Milazzo and 11.3 μg/m3 in Priolo.
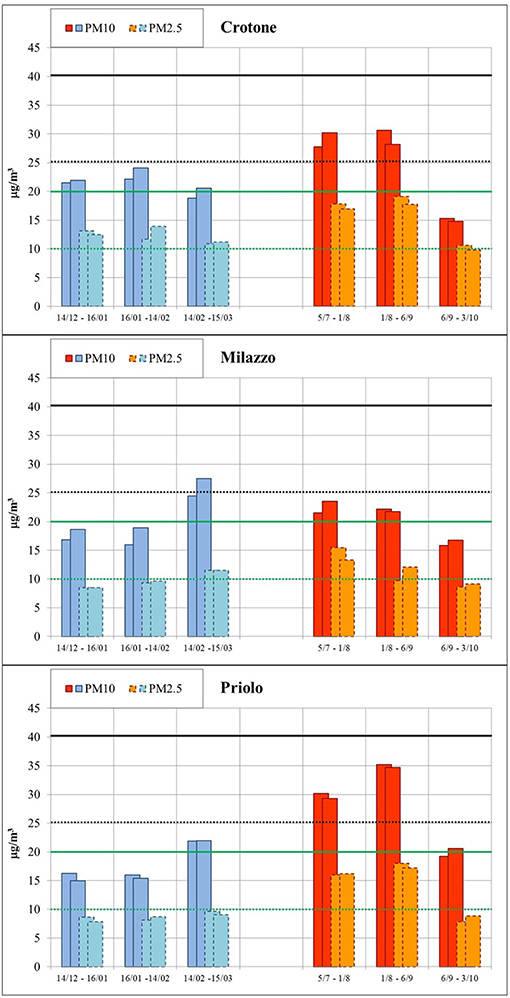
Figure 8. Mass concentration of PM10 and PM2.5 during the winter (blue bars) and the summer (orange bars) periods at the three AERCAs. EU concentration limits are shown in black, WHO concentration limits are shown in green (PM10: solid lines; PM2.5: dashed lines).
In order to check the robustness of our sampling schedule, we compared PM10 concentrations measured in this study with the values recorded daily by ARPA Sicilia, at the monitoring station of TER, immediately adjacent to the oil refinery, at 3.7 Km from the measurement site of this study. Daily PM10 concentration measured at TER during the six considered periods and the comparison between the calculated ARPA mean values and the mean concentration obtained in this study are shown in Figure 9. It is worth noting that daily PM10 values showed a limited range of variability: relative standard deviation was in the range 15–45%, with the only exceptions of a desert dust event of February 24–27 and of a local event of August 6th, which was responsible for a sharp increase of PM10 concentration up to more than 90 μg/m3. The differences in the mean values obtained by ARPA daily measurements and by the cumulate samplings of this study were very small. In the worst case (period 14/12–16/01) the difference was 22%, and it was probably due to the very low 24-h concentration (below 10 μg/m3) recorded during 16 of the 33 days characterizing this sampling period.
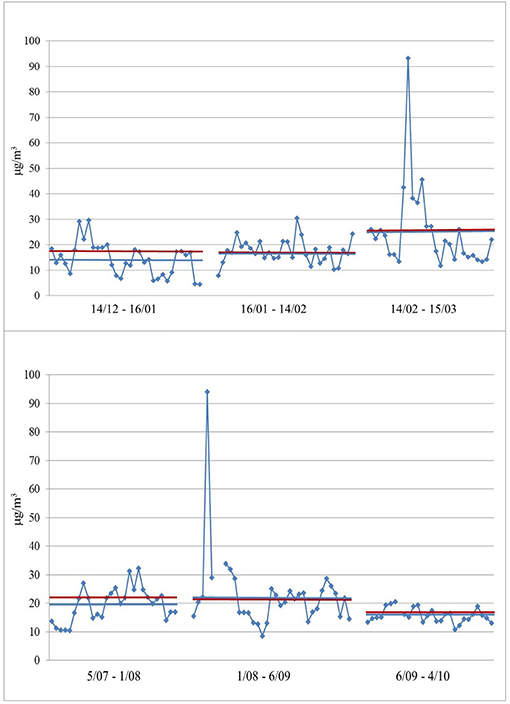
Figure 9. Time pattern of PM10 concentration measured daily by the local environmental agency at the monitoring station of Termica Milazzo (TER), in winter (upper panel) and summer (lower panel); mean values referring to the six sampling periods (blue line) and monthly mean concentration measured by this study (red line).
Figure 10 shows an overall chemical composition of PM10 and PM2.5 at the three considered AERCAs. Considered components were: elemental carbon, organic matter (OC multiplied by 1.8 to take into account non-C atoms), ammonium, nitrate, non-sea-salt sulfate, sea-salt (calculated from Na+ and Cl− concentration multiplied by 1.176, in order to take into account minor sea-water components) and crustal matter (calculated by summing the concentration of Al, Si, and Fe, as metal oxides, the insoluble fractions of K, Mg, and Ca and calcium and magnesium carbonate) (Perrino et al., 2014).
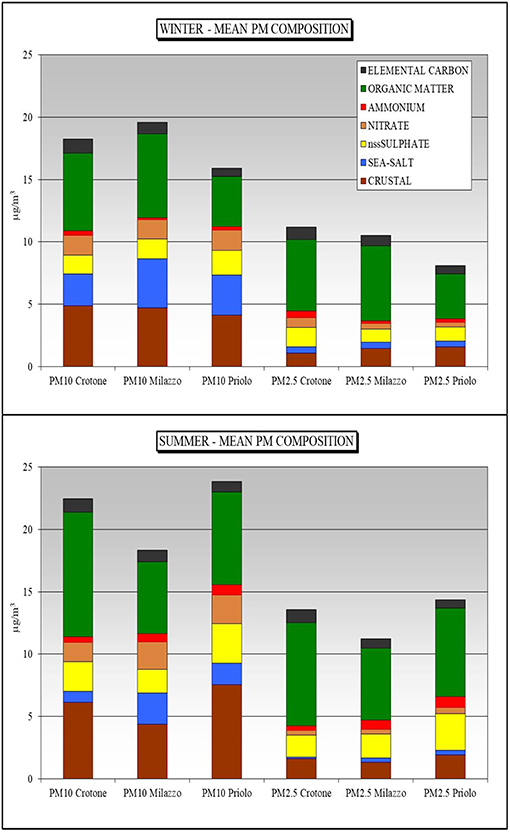
Figure 10. Chemical composition of PM10 and PM2.5 at the three considered AERCAs.
As expected, sea-salt and crustal matter, natural components of primary origin, were mostly found in the coarse fraction of PM. The concentration of sea-salt in PM10 was higher in winter (2.5–4 μg/m3), characterized by more frequent strong advection episodes, than during the summer (0.9–2.5 μg/m3). This contribution to PM10 was particularly important in Milazzo, located in a very narrow peninsula with the sea at the distance of <500 m on both sides (E and W). The concentration of crustal components, instead, was higher during the summer than during the winter period (4.4–7.5 vs. 4.1–4.9 μg/m3), due to the easier re-suspension of soil dust promoted by dry weather conditions. Being re-suspension mostly due to traffic, this concentration increase was not observed in Milazzo, where the sampling site was located on a terrace at about 10 m from the ground.
Elemental carbon, released by combustion processes, was found in the fine fraction of PM and was in the range 0.6–1.1 μg/m3. Organic matter, mostly produced by photochemical reactions of anthropogenic and biogenic NMHC, also showed a size distribution predominantly in the fine range and higher concentration were recorded during summer (5.8–10 vs. 4–6.7 μg/m3 in PM10).
Ammonium sulfate, of photochemical origin, shared the same seasonal pattern as OM, with higher summer values (2.1–3.4 vs. 1.7–2.1 μg/m3). Most of the nitrate amount, instead, was found in the coarse fraction (78–82% during the summer, 49–77% during the winter). This indicates that ammonium is fully neutralized by sulfate and most nitrate was associated with dust and sea salt in coarser particles.
Table 3 reports the average concentration of micro-organics during the winter and the summer study periods. Total concentration of the 14 considered PAH congeners was in the range 5.4–20 ng/m3 during the winter and 2.9–7.0 ng/m3 during the summer, a seasonal difference that could be ascribed to the contribution of heating appliances.
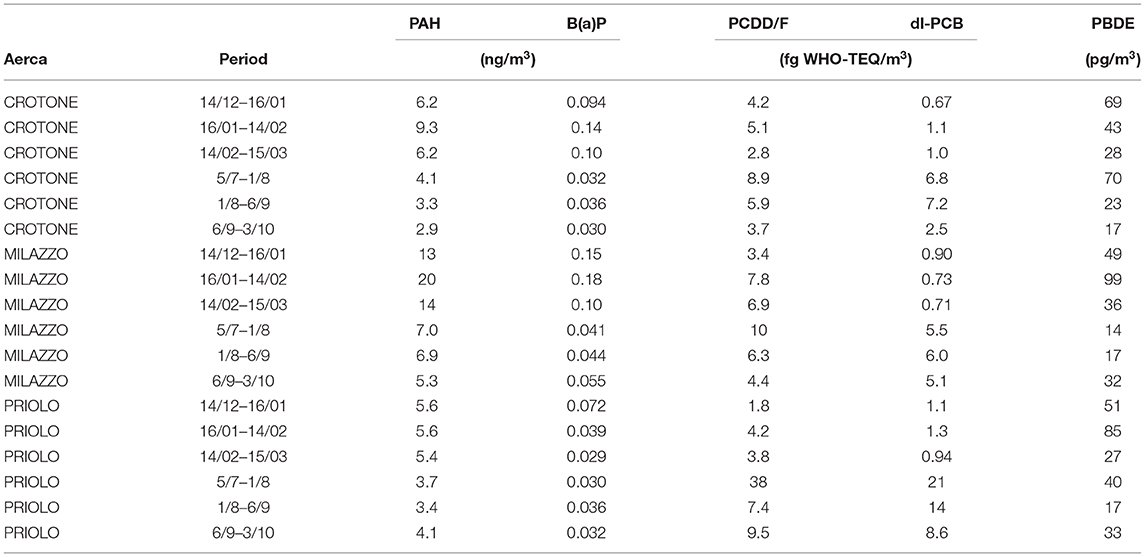
Table 3. Air concentration of micro-organics at the three AERCAs during the study period.
The concentration of total PCDD/F (sum of 17 congeners) and total dioxin-like-PCB (sum of 12 congeners) are reported in Table 3 in terms of toxic equivalency (TEQ). TEQ expresses the toxicity of a mixture of dioxins and dioxin-like compounds in a single number, which results from the product of the concentration of each congener by its individual Toxic Equivalence Factor (TEF). TEF expresses the toxicity of the congeners in terms of the most toxic form of dioxin (2,3,7,8-TCDD), which has TEF = 1. The most recent revision of TEFs was published in 2005 by WHO (Van den Berg et al., 2006).
Total PCDD/F concentration was in all cases below 10 fg TEQ/m3, with the only exception of the first summer month in Priolo, when an increase up to 38 fg TEQ/m3 was recorded, probably as the result of a short-duration local episode.
Regarding PCBs, the WHO guidelines contain information only about the typical air concentration of total PCBs (3 pg/m3 in rural areas and 3 ng/m3 in industrial/urban areas), but there are no indications about the concentration of dl-PCB, that is, PCB of particular interest because of their toxicological properties similar to PCDD. For these congeners, however, TEF values have been set, making possible the calculation of their toxic equivalence. In this study, the sum of the TEQ concentrations for PCDD/F and dl-PCB was in all cases very low: between 2.9 and 8.6 during the winter and between 6.1 and 59 during the summer.
The concentration of PBDE (sum of 44 congeners), organobromine compounds widely used as flame retardants, was in the range 14–99 pg/m3 and was mostly due to decabromodiphenylethane (DBDPE). This compound is often used as a replacement for decaBDE, which was assigned a classification of “suggestive evidence of carcinogenic potential” by USA-EPA and was banned both in Europe and in the United States.
Discussions
This study, deploys modeling activities and experimental characterization of atmospheric compounds. In this context, continuous trace gases and aerosol measurements (including NOx, SO2, O3, NMHC, PM10, and PM2.5) performed during 3 years (2016–2018) were analyzed, and specific intensive field experiments (2016–2017), representative of winter and summer conditions, were carried out in order to determine PM10 and PM2.5 chemical composition.
In each AERCA, none of the sites exceeded the annual AAQ Directive NO2 limit, although at the urban site of the Priolo the hourly concentration was sporadically (<0.05% of the time) higher than 200 μg/m3.
Generally, SO2 concentrations at the AERCA industrial and downwind areas were comparable, indicating a well-mixed of emission sources in the considered areas. The SO2 exposure limit set by WHO (20 μg/m3 on daily basis) was exceeded <5% of the days at the Milazzo and Priolo, while at the Crotone this limit was exceeded <0.2% of the time. The AAQ Directive SO2 limit was never exceeded in the investigated sites, with the exception of the downwind area in Milazzo, where limit was exceeded once over the entire investigated period.
NMHCs, measured at the Milazzo and Priolo, showed a distinctive spatial pattern with the highest concentrations in the industrial areas, and one to two orders of magnitude lower levels at the downwind sites, indicating that in these regions anthropogenic emissions are dominating over natural ones. The reference concentration of 200 μg/m3(DPCM 28/03/1983) was exceeded for about one third of the investigate period at the industrial site of Priolo, and one tenth of the time at the Milazzo industrial area. NMHC promotes O3 production, eventually leading to secondary organic aerosol formation. In addition to their impact on air quality, some NMHC, such as 1–3 butadiene and benzene, are recognized cancer-causing agents (Group 1, IARC) while emissions of several NMHC are also perceived as unpleasant odor by most of the population. A detailed speciation of the most relevant NMHC is needed to better understand their impacts on environment and health. In addition, the implementation of specific legislation for industrial areas controling the ensemble of NMHC is recommended.
The different emission mechanisms and atmospheric reactivity of NMHC and SO2 are well-traced in the Priolo by their different spatial pattern. In this area, where SO2 is mainly emitted by thermal plants and industrial processes through many chimneys, which are tens of meters high, relatively homogeneous concentrations are observed. Although associated with the burning of fossil fuels by cars and trucks, NMHC are released into the atmosphere mainly through fugitive emissions near the ground, thus significant different concentrations are recorded nearby the industrial site and in downwind area. In fact, NMHC, in presence of solar radiation, react quickly in the atmosphere leading to O3 formation, while SO2 oxidation to sulfate is rather slow unless cloud processing occurs. Assuming a OH radical concentration of about 5 × 10⁶ radicals/cm3, typical of moderately polluted environment, and p-xylene or n-hexane kinetic constants (14 × 10−12 cm3 molecules−1 s−1 and 5 × 10⁻¹² cm3 molecules−1 s−1 at 25°C, respectively), the atmospheric lifetime of most of low molecular weight aliphatic and aromatic hydrocarbons would be a few hours. It follows that NMHC emitted in the industrial area are oxidized in the atmosphere before reaching downwind sites located at a few kilometers away. On the contrary, typical SO2 atmospheric residence time is a few days and a more homogenous spatial concentration is observed across the AERCAs.
The Mediterranean basin is characterized by high ozone background levels, significantly higher than those registered in continental Europe (Kalabokasa et al., 2000), as confirmed by the high O3 values recorded at the a WMO-GAW regional station of Capo Granitola (GRA), a site representative of background coastal conditions in Sicily. The highest O3 concentration across the Mediterranean Sea are observed during subsidence conditions, pointing toward local O3 formation from anthropogenic and biogenic precursors (Velchev et al., 2011). O3 concentrations in downwind and industrial areas exceeded the AAQ EU Directive and the WHO limits most of the time in spring and summer, ranging between 88 and 98 μg/m3 (average values for the entire period), stressing on the critical points raised by the WHO which considers O3 as one of the main factors in morbidity and mortality due to asthma. O3 is also a Short Lived Climate Forcer and Pollutant, able to alter the Earth's energy balance by absorbing outgoing radiation from the Earth's surface and therefore warm the atmosphere.
At Priolo, the WHO and AAQ Directive limits of 100 and 120 μg/m3 were exceeded for the 42 and 14% of the days at the industrial site, and 39 and 9% at the downwind site. In the urban area of Milazzo, the limits were exceeded 11 and 1% of the time while in the Crotone, O3 exceeded the limits 32 and 10% of the days at the downwind site and 19 and 2% at the urban areas.
PM2.5 and PM10 average concentrations over the entire periods were below the annual limits set by the AAQ Directive, while Priolo and Crotone AERCA were characterized by urban PM10 and urban and industrial PM2.5 concentrations higher than the WHO annual limits (20 and 10 μg/m3, respectively). Concerning the daily averages, at the Crotone AERCA daily PM10 and PM2.5 values exceeded WHO daily limits in winter (50 and 25 μg/m3, respectively), while the number of PM10 daily exceedances were well below the threshold set by the AAQ Directive (35 days per year larger than 50 μg/m3) at all the investigated sites. The PM2.5 to PM10 ratio, higher in the industrial and downwind areas, was generally larger than 0.5, suggesting a significant contribution of secondary organic and inorganic species to fine particle mass.
The chemical characterization of PM, carried out during two 3-month experimental campaigns in summer and in winter, included the determination of elements, inorganic ions, elemental carbon, organic carbon in PM10 and PM2.5, polycyclic aromatic hydrocarbons (PAH), polychlorinated dibenzodioxins (PCDDs), polychlorinated dibenzofurans (PCDFs), dioxin-like polychlorinated biphenyl (dl-PCB), polybrominated diphenyl ethers (PBDEs) in PM10.
During summer PM10 and PM2.5 concentrations were higher than in winter, particularly in Priolo, and, at a less extent, in Crotone. This seasonal pattern is typical for coastal sites in southern Italy, where the winter season is characterized by dilution of atmospheric pollutants due to atmospheric mixing and frequent advections, while the higher temperature and lower precipitation in summer promotes soil dust re-suspension and to photochemical formation of new particles.
The evaluation of the main PM macro-sources (sea, soil, traffic, secondary formation, organics) showed the prevalence of sea-salt and crustal matter, natural components of primary origin, in the coarse fraction of PM, with higher values during winter for sea-salts and during summer for soil. Traffic components, organics and ammonium sulfate were mostly in the fine fraction of PM. Organics and ammonium sulfate, of photochemical origin from anthropogenic and biogenic NMHC and from NH3 and SO2, respectively, showed higher values during the warmer period.
PAH concentration (sum of 14 congeners) was higher during winter, likely due to the contribution of heating emissions. Nevertheless, the concentration of benzo[a]pyrene was in all cases very far from the target value set by the AAQ Directive at 1 ng/m3 (1-year average). Total PCDD/F concentration was of the order of 10 fg TEQ/m3; all the recorded values were well-below the concentration indicated by WHO as acceptable value in urban areas (100 fg TEQ/m3) and two orders of magnitude lower than the concentration considered by the same organization as indicative of the presence of local sources that have to be identified and evaluated (>300 fg TEQ/m3); (WHO, 2000). Seasonal variations of these micro-organics were negligible.
When adding also dl-PCB, TEQ concentrations remained very low (2.9–8.6 fg TEQ/m3 during the winter and 6.1–59 fg TEQ/m3 during the summer) and was mostly due to PCDD/F during the winter and equally distributed between PCDD/F and dl-PCB during the summer The increase in the atmospheric concentration of PCB during the warm period has been widely reported in the literature and was attributed to the easier volatilization from the soil (Gasser et al., 2008). The concentration of PBDE (sum of 44 congeners) was in the range 14–99 pg/m3 and was mostly due to decabromodiphenylethane (DBDPE).
Conclusions
At the three AERCA sites of Crotone, Milazzo and Priolo, during all the considered periods, the measurements of PM mass concentration and of the main gaseous regulated pollutants, except O3, indicate air quality compliance with the AAQ Directive, which is specifically designed for urban areas and does not consider specific markers for contaminated sites. Nevertheless, when stricter and safer guidelines are considered, critical issues arise particularly for O3 and NMHC. The observations reported in this work suggest that air quality legislation in contaminated areas should follow lower standards, to meet the WHO guidelines, and should include non-traditional pollutants tackling specific anthropogenic emissions, in order to efficiently protect public health.
The results obtained in this work highlight the need for a deeper chemical characterization of organic vapors (NMHC), some of which are carcinogenic and mutagenic, in contaminated sites hosting industrial activities. Organic species in the gas phase are also responsible for unpleasant odors. As suggested by the result of our study, the regulation of NMHC atmospheric concentration should also consider the occurrence of short-lasting peak events and not only metrics based on daily or annual time scales.
In addition, PM2.5 measurements, highlight that fine particles dominated over coarse ones in these regions. The high concentration of NMHC and atmospheric oxidants like O3 indicates that volatile organic species can contribute significantly to fine particle mass in industrially contaminated sites, and a deeper characterization if this organic fraction can support a better understand of the impact of particle chemical composition on health.
Finally, the results of this study will be considered with an integrated approach, addressing together with the atmosphere compartment the other environmental matrices, i.e., soil, sediments, inland and sea water, and food, to better understand the impacts of anthropogenic pollution on environment and health.
Data Availability Statement
The datasets generated for this study are available on request to the first and corresponding authors.
Author Contributions
CP, SG, TL, and PB analyzed the data and wrote the paper. CP designed the field experiment. MC, SD, GE, MG, SM, SP, ER, and TS carried out sampling and chemical analysis during intensive field experiments. PC, GT, MB, and FC collected gas phase measurements at the WMO-GAW site. AA, IF, and SO provided gas phase and PM mass databases and contributed to data discussion.
Conflict of Interest
The authors declare that the research was conducted in the absence of any commercial or financial relationships that could be construed as a potential conflict of interest.
Acknowledgments
The authors would like to acknowledge the Italian Ministry of Education, University and Research for funding the CISAS project (International Centre of advanced study in environment, ecosystem and human health).
Supplementary Material
The Supplementary Material for this article can be found online at: https://www.frontiersin.org/articles/10.3389/fenvs.2019.00196/full#supplementary-material
Footnotes
1,2 ^ Directive 2008/50/EC of the European Parliament and of the Council of 21 May 2008 on Ambient Air Quality and Cleaner Air for Europe, OJ L 152, 11.6.2008
References
Abita, A., Antero, R., Baiata, V., and Dioguardi, R. (2019). Relazione Annuale Sullo Stato Della Qualità Dell'aria Nella Regione Siciliana Anno 2018. Technical report. ARPA Sicilia.
Abita, A., Antero, R., Ballarino, G., Caldara, S., Condò, M., Cuffari, G., et al. (2016). Piano Regionale di Tutela Della Qualità Dell'aria in Sicilia. Aree industriali. Technical report. ARPA Sicilia.
Becagli, S., Sferlazzo, D. M., Pace, G., di Sarra, A., Bommarito, C., Calzolai, G., et al. (2012). Evidence for heavy fuel oil combustion aerosols from chemical analyses at the island of Lampedusa: a possible large role of ships emissions in the Mediterranean. Atmos. Chem. Phys. 12, 3479–3492. doi: 10.5194/acp-12-3479-2012
Brusasca, G. (2004). “Integration of measurement and modelling systems to reconstruct pollution impacts around the industrial area of Priolo (Sicily),” in 13th IUAPPA World Clean Air and Environmental Protection Congress and Exibition, London.
Bustaffa, E., De Marinis Loiotile, A., Farella, G., Petraccone, S., De Gennaro, G., and Bianchi, F. (2016). Idrocarburi non metanici nell'atmosfera in prossimità di impianti di primo trattamento del greggio. Epidemiol. Prev. 40, 290–306. doi: 10.19191/EP16.5.P290.104
Canepari, S., Astolfi, M. L., Farao, C., Maretto, M., Frasca, D., Marcoccia, M., et al. (2014). Seasonal variations in the chemical composition of particulate matter: a case study in the Po Valley. Part II: concentration and solubility of micro-and trace-elements. Environ. Sci. Pollut. Res. 21, 4010–4022. doi: 10.1007/s11356-013-2298-1
Canepari, S., Perrino, C., Astolfi, M. L., Catrambone, M., and Perret, D. (2009b). Determination of soluble ions and elements in ambient air suspended particulate matter: inter-technique comparison of XRF, IC and ICP for sample-by-sample quality control. Talanta 77, 1821–1829. doi: 10.1016/j.talanta.2008.10.029
Canepari, S., Pietrodangelo, A., Perrino, C., Astolfi, M. L., and Marzo, M. L. (2009a). Enhancement of source traceability of atmospheric PM by elemental chemical fractionation. Atmos. Environ. 43, 4754–4765. doi: 10.1016/j.atmosenv.2008.09.059
Cristofanelli, P., Busetto, M., Calzolari, F., Ammoscato, I., Gull,ì, D., Dinoi, A., et al. (2017). Investigation of reactive gases and methane variability in the coastal boundary layer of the central Mediterranean basin. Elem. Sci. Anth. 5:12. doi: 10.1525/elementa.216
Fazzo, L., Carere, M., Tisano, F., Bruno, C., Cernigliaro, A., Cicero, M. R., et al. (2016). Cancer Incidence in Priolo, Sicily: a spatial approach for estimation of industrial air pollution impact. Geospat. Health 11:320. doi: 10.4081/gh.2016.320
Gasser, M., Martí, R., Montaña, M. J., and Díaz-Ferrero, J. (2008). Dioxins, furans and dioxin-like PCBs in ambient air from Camp de Tarragona (Catalonia, Spain). Seasonal variation. Organohalogen Comp. 14, 594–597.
Gilge, S., Plass-Duelmer, C., Fricke, W., Kaiser, A., Ries, L., Buchmann, B., et al. (2010). Ozone, carbon monoxide and nitrogen oxides time series at four alpine GAW mountain stations in central Europe. Atmos. Chem. Phys. 10, 12295–12316. doi: 10.5194/acp-10-12295-2010
Kalabokasa, P. D., Virasb, L. G., Bartzisc, J. G., and Repapisa, C. C. (2000). Mediterranean rural ozone characteristics around the urban area of Athens. Atmos. Environ. 34, 29–30. doi: 10.1016/S1352-2310(00)00298-3
Kampa, M., and Castanas, E. (2008). Human health effects of air pollution. Environ. Pollut. 151, 362–367. doi: 10.1016/j.envpol.2007.06.012
Kelm, M. (1999). Nitric oxide metabolism and breakdown. Biochim. Biophys. Acta 1411, 273–289. doi: 10.1016/S0005-2728(99)00020-1
Lefohn, A. S., Malley, C. S., Smith, L., Wells, B., Hazucha, M., Simon, H., et al. (2018). Tropospheric ozone assessment report: global ozone metrics for climate change, human health, and crop/ecosystem research. Elem. Sci. Anth. 6:28. doi: 10.1525/elementa.279
Lelieveld, J., and Dentener, F. J. (2000). What controls tropospheric ozone? J. Geophys. Res. 105, 3531–3551. doi: 10.1029/1999JD901011
Martuzzi, M., Pasetto, R., and Martin-Olmedo, P. (2014). Industrially contaminated sites and health. J Environ. Public Health. 2014:198574. doi: 10.1155/2014/198574
Monforte, P., and Ragusa, M. A. (2018). Evaluation of the air pollution in a mediterranean region by the air quality index. Environ. Monit. Assess. 190:625. doi: 10.1007/s10661-018-7006-7
Perrino, C., Catrambone, M., Dalla Torre, S., Rantica, E., Sargolini, T., and Canepari, S. (2014). Seasonal variations in the chemical composition of particulate matter: a case study in the Po Valley. Part I: macro-components and mass closure. Environ. Sci. Pollut. Res. 21, 3999–4009. doi: 10.1007/s11356-013-2067-1
Perrino, C., Tiwari, S., Catrambone, M., Dalla Torre, S., Rantica, E., and Canepari, S. (2011). Chemical characterization of atmospheric PM in Delhi, India, during different periods of the year including Diwali festival. Atmos. Pollut. Res. 2, 418–427. doi: 10.5094/APR.2011.048
Pope, C. A. R., and Dockery, C. W. (2006). Health effects of fine particulate air pollution: lines that connect. J. Air Waste Manag. Assoc. 56, 709–742. doi: 10.1080/10473289.2006.10464485
Regione Siciliana (2018). Piano regionale di qualità dell'aria in Sicilia approved by DGR n. 268 of 18/07/2018. Available online at: http://www.regione.sicilia.it/deliberegiunta/. (accessed December 11, 2019).
Schultz, M. G., Akimoto, H., Bottenheim, J., Buchmann, B., Galbally, I. E., Gilge, S., et al. (2015). The Global Atmosphere Watch reactive gases measurement network. Elem. Sci. Anth. 3:000067. doi: 10.12952/journal.elementa.000067
Seinfeld, J. H., and Pandis, S. N. (1998). Atmospheric Chemistry and Physics: From Air Pollution to Climate Change. New York, NY: John Wiley & Sons.
Stull, R. B. (2012). An Introduction to Boundary Layer Meteorology. Vol. 13. Dordrecht: Springer Science & Business Media.
Van den Berg, M., Birnbaum, L. S., Denison, M., De Vito, M., Farland, W., Feeley, M., et al. (2006). The 2005 World Health Organization reevaluation of human and Mammalian toxic equivalency factors for dioxins and dioxin-like compounds. Toxicol. Sci. 93, 223–241. doi: 10.1093/toxsci/kfl055
Velchev, K., Cavalli, F., Hjorth, J., Marmer, E., Vignati, E., Dentener, F., et al. (2011). Ozone over the Western Mediterranean Sea–results from two years of shipborne measurements. Atmos. Chem. Phys. 11, 675–688. doi: 10.5194/acp-11-675-2011
WHO (2000). Air Quality Guidelines for Europe, 2nd Edn. WHO Regional Publications, Eur. Series No. 91. Copenhagen: World Health Organization; Regional Office for Europe.
WHO (2005). Air Quality Guidelines for Particulate Matter, Ozone, Nitrogen Dioxide and Sulfur Dioxide. Geneva: WHO.
WHO (2018). Burden of Disease From Ambient Air Pollution for 2016 v2. Technical Report. World Health Organization. Available online at: https://www.who.int/airpollution/data/AAP_BoD_results_May2018_final.pdf. (accessed December 11, 2019).
Keywords: atmosphere, environment, industrial contaminated sites, air quality, pollution
Citation: Perrino C, Gilardoni S, Landi T, Abita A, Ferrara I, Oliverio S, Busetto M, Calzolari F, Catrambone M, Cristofanelli P, Dalla Torre S, Esposito G, Giusto M, Mosca S, Pareti S, Rantica E, Sargolini T, Tranchida G and Bonasoni P (2020) Air Quality Characterization at Three Industrial Areas in Southern Italy. Front. Environ. Sci. 7:196. doi: 10.3389/fenvs.2019.00196
Received: 14 June 2019; Accepted: 04 December 2019;
Published: 14 January 2020.
Edited by:
Raul Perez Lejano, New York University, United StatesReviewed by:
Guocheng Zhu, Hunan University of Science and Technology, ChinaErualdo R. González, California State University, Fullerton, United States
Copyright © 2020 Perrino, Gilardoni, Landi, Abita, Ferrara, Oliverio, Busetto, Calzolari, Catrambone, Cristofanelli, Dalla Torre, Esposito, Giusto, Mosca, Pareti, Rantica, Sargolini, Tranchida and Bonasoni. This is an open-access article distributed under the terms of the Creative Commons Attribution License (CC BY). The use, distribution or reproduction in other forums is permitted, provided the original author(s) and the copyright owner(s) are credited and that the original publication in this journal is cited, in accordance with accepted academic practice. No use, distribution or reproduction is permitted which does not comply with these terms.
*Correspondence: Stefania Gilardoni, c3RlZmFuaWEuZ2lsYXJkb25pQGNuci5pdA==
†Present address: Stefania Gilardoni, C.N.R. Institute of Polar Sciences, via Gobetti 101, Bologna, Italy