 Aldo Marchetto1*
 David Simpson2,3Wenche Aas4Hilde Fagerli2Karin Hansen5Gunilla Pihl-Karlsson6Per Erik Karlsson6Michela Rogora1
 Tanja G. M. Sanders7
 Andreas Schmitz7,8
 Walter Seidling7
 Anne Thimonier9Svetlana Tsyro2
 Wim de Vries10
 Peter Waldner9
- 1Water Research Institute, National Research Council (CNR), Verbania, Italy
- 2EMEP-MSC-W, Norwegian Meteorological Institute, Oslo, Norway
- 3Department of Space, Earth and Environment, Chalmers University of Technology, Gothenburg, Sweden
- 4Norwegian Institute for Air Research (NILU), Kjeller, Norway
- 5Swedish Environmental Protection Agency, Stockholm, Sweden
- 6Swedish Environmental Research Institute (IVL), Gothenburg, Sweden
- 7Thünen Institute of Forest Ecosystems, Eberswalde, Germany
- 8State Agency for Nature, Environment and Consumer Protection of North Rhine-Westphalia, Recklinghausen, Germany
- 9Swiss Federal Institute for Forest, Snow and Landscape Research (WSL), Birmensdorf, Switzerland
- 10Environmental Research, Wageningen University and Research, Wageningen, Netherlands
Atmospheric nitrogen and sulfur deposition is an important effect of atmospheric pollution and may affect forest ecosystems positively, for example enhancing tree growth, or negatively, for example causing acidification, eutrophication, cation depletion in soil or nutritional imbalances in trees. To assess and design measures to reduce the negative impacts of deposition, a good estimate of the deposition amount is needed, either by direct measurement or by modeling. In order to evaluate the precision of both approaches and to identify possible improvements, we compared the deposition estimates obtained using an Eulerian model with the measurements performed by two large independent networks covering most of Europe. The results are in good agreement (bias <25%) for sulfate and nitrate open field deposition, while larger differences are more evident for ammonium deposition, likely due to the greater influence of local ammonia sources. Modeled sulfur total deposition compares well with throughfall deposition measured in forest plots, while the estimate of nitrogen deposition is affected by the tree canopy. The geographical distribution of pollutant deposition and of outlier sites where model and measurements show larger differences are discussed.
Introduction
Sulfur (S) dioxide, nitrogen (N) oxides and ammonia are the atmospheric pollutants that are deposited in larger quantities, that play an important role in the chemistry of the atmosphere and that affect ecosystem condition, structure and productivity. Sulfur dioxide and N oxides may be produced by natural sources, such as volcanic activities and lightning, but they are emitted in much larger quantities by combustion processes related to human activities, such as power generation, traffic, industry, agriculture. Beside their effects on natural ecosystems (such as fertilization, growth stimulation, acidification, eutrophication, increased sensitivity to pathogens, and tree defoliation (Galloway et al., 2004; Etzold et al., 2020), N oxides can interact with atmospheric oxygen, increasing the production of tropospheric ozone (Crutzen, 1970). Both S and N oxides can be deposited in their original form, or be transformed into their oxidized forms, e.g. sulfate (SO4−), nitric acid (HNO3), or nitrate (NO3−), which can be deposited as particulate or incorporated in clouds and travel for hundreds of kilometers before being deposited (Hertel et al., 2012).
Reduced N enters the atmosphere in the form of ammonia, mainly from agricultural sources, and it can be deposited in this form or transformed into ammonium (NH4+). The latter can be deposited through the dry deposition pathway (aerosols), but it is mainly incorporated in clouds and deposited by wet deposition in the form of ammonium sulfate, if an excess of S dioxide is available. However, in agriculture-rich areas, there is an excess of ammonia, and reduced N will be deposited closer to the emission source than S and N oxides (Asman et al., 1998).
Reactive N and S deposition may occur in the form of wet deposition, when S and N compounds are included in rain droplets or snow, and dry deposition, when they are deposited either as particulate matter or in gaseous forms. The amount of dry deposition is affected by the specific receptors, and in particular forest canopies can collect large amounts of particulate and gaseous air pollutants (filtering effect, Mayer and Ulrich, 1977).
In the 1970s, large emissions of N and S oxides in Europe and North America led to serious concerns about their effects on ecosystems and human health. The ability of these compounds to travel hundreds of kilometers made it evident that effective actions to control these pollutants should be performed on a trans-national basis. The Convention on Long-Range Transboundary Air Pollution (in short “Air Convention”) came into force in 1983 and proved effective in attaining its pollution reduction objectives (Bull et al., 2008). A relevant role was played by the presence of specific pollution control protocols, a census of the emission sources, a predictive model of the expected concentration or deposition both within the framework of the ‘Co-operative Programme for Monitoring and Evaluation of the Long-range Transmissions of Air Pollutants in Europe’ (EMEP), and a series of International Co-operative Programmes (ICPs) within the Working Group on Effects of the Air Convention exploring the effects of air pollution on the natural and human environment. Two important centres within EMEP are the Chemical Coordinating Centre (EMEP CCC), which looks after the measurement networks, and the Meteorological Synthesizing Centre–West (MSC-W), who perform atmospheric modeling simulations for the compounds involved in acidification, eutrophication, near-surface ozone and particulate matter (see www.emep.int).
In order to support the Air Convention, an extensive emission census is produced for S, N and other compounds every year by EMEP, and used as input to the Eulerian chemical transport model which was developed at the EMEP MSC-W (Simpson et al., 2012). The EMEP MSC-W model (see Sect. 1.1) is used here to calculate air concentration and deposition fields for acidifying and eutrophying compounds (S, N) across the European domain.
In order to evaluate model performance, the EMEP CCC coordinates a network of around 100 monitoring stations measuring inorganic ions in precipitation and aerosol and gases in air covering most of Europe (Tørseth et al., 2012).
Within the Air Convention, the ICP on Assessment and Monitoring of Air Pollution Effects on Forests (ICP Forests) monitors forest condition in Europe. Two monitoring networks are running: a systematic network (Level I), based on around 6,000 observation plots, to gain insight into the geographic and temporal variations in crown and soil condition, and an intensive monitoring network (Level II), featuring 14 surveys on around 500 plots in selected forest ecosystems, aiming at clarifying cause-effect relationships within forest ecosystems. Currently at more than 300 Level II plots, atmospheric deposition is collected and analyzed following standard protocols (Lorenz and Fischer, 2013).
In this paper, we compare S and N deposition estimates from the EMEP MSC-W model with measurements from both the EMEP and the ICP Forests monitoring networks and we highlight aspects that would potentially allow to further improve both measurements and model-based estimates of S and N deposition in Europe. This comparison is based on the period 2010–2014, because the number of ICP Forests sampling sites increased during 2009 thanks to the LIFE+ project FutMon, which also allowed the development of quality assurance procedures that became mandatory in 2010 for all laboratories operating in the ICP Forests network. The number of active sampling sites was slowly decreasing in the subsequent years, because of financial constraints.
Materials and Methods
EMEP MSC-W Model
The EMEP MSC-W model (hereafter EMEP model) is an Eulerian chemical transport model that can be used on scales ranging from local (e.g., Vieno et al., 2016) to global (e.g., Schwede et al., 2018). Here it is run with 20 vertical layers and a horizontal resolution of 0.1 × 0.1 degrees driven by ECMWF IFS meteorology (https://www.ecmwf.int/en/research/modelling-and-prediction). It includes about 170 reactions between approximately 130 gas- and particulate-phase species and tracers (EmChem16 scheme, see Simpson et al., 2017; Simpson et al., 2020), and uses the EQSAM module (Metzger et al., 2002) to describe equilibria between the inorganic aerosols. To calculate dry deposition, the model includes a stomatal conductance algorithm, applied to all pollutants where stomatal control is important (e.g. ozone, N and S oxides and ammonia). Non-stomatal uptake is also included, and for NH4+ and SO4− this is calculated as a function of temperature, humidity, and the molar ratio between S dioxide and ammonia. The model version used here (rv4.17a) is described in Simpson et al. (2012, 2017, and references therein). Evaluation of the model against EMEP data is performed every year as part of the annual EMEP MSC-W reports (https://www.emep.int/mscw/mscw_publications.html), as well as in several publications (e.g. Simpson et al., 2006; Bian et al., 2017; Theobald et al., 2019).
For this study, the EMEP model was run on a monthly basis for the period 2010–2014, The simulations used here are part of the time-series simulations discussed in Tsyro and Mortier (2018). For this study, monthly results from these model runs were extracted for the period 2010–2014. Anthropogenic emissions for these runs were taken from a harmonized data set used for trend analysis, as documented in Tista et al. (2018).
For this comparison exercise, wet and dry depositions of sulfur and nitrogen calculated by the EMEP model were retrieved for each deposition measurement site of both ICP Forests and EMEP/CCC networks. Modeled total deposition is obtained by summing up modeled wet and dry deposition. The ICP Forests measurement sites have been classified into broadleaf and coniferous plots depending on the main tree species. The corresponding land-use specific dry deposition rates from the EMEP for “deciduous” and “coniferous” forests were therefore used for this study.
Deposition Measurements
EMEP Deposition Measurements
The reference method for sampling atmospheric wet deposition is using “wet-only” samplers, which open automatically during the precipitation event and close again after the event, avoiding the collection of local dust and of particulate and gaseous deposition during dry periods. Permanently open bulk collectors are also used in areas where the dry deposition is low compared with wet deposition. Sampling is generally performed on a daily basis but weekly, fortnightly and monthly samples are also performed for both sampler types.
The EMEP monitoring sites are in areas where significant local influences (local emission sources, local sinks, topographic features, etc.) are minimised, to ensure that the data are representative for a larger region. However, influence from nearby source may occur to a varying degree, particularly from agricultural activities and dust. The laboratories submitting data to EMEP CCC are annually participating in a laboratory intercomparison to make sure that the analyses are within the data quality objective of the programme, i.e., 10% accuracy or better for SO4− and NO3− in single analysis in the laboratory and 15% for NH4+. This was in general met by all the EMEP laboratories.
Wet deposition data from 59 monitoring sites and bulk deposition data from 36 monitoring sites were used, selecting from the data reports (Hjellbrekke and Fjæraa, 2012; Hjellbrekke and Fjæraa, 2013; Hjellbrekke, 2014; Hjellbrekke, 2015; Hjellbrekke, 2016) sites and years of data with percentage of analysed samples higher than 90%. The location of all sampling sites in Europe is shown in Figure 1.
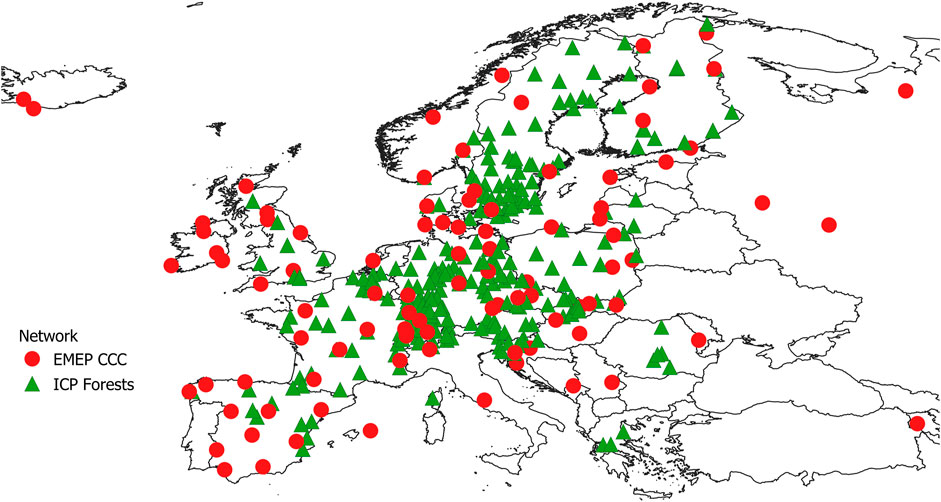
FIGURE 1. Geographical distribution of the sampling sites of the EMEP-CCC (red) and ICP Forests and SWETHRO (green) networks.
ICP Forests and SWETHRO Deposition Measurements
In the ICP Forests network, atmospheric deposition is collected using permanently open bulk collectors. At the sites of this network, two groups of samplers are installed. A first series of collectors are located in the open-field to estimate deposition not affected by the exchange processes within the canopies. As in the EMEP network, the composition of the so-called bulk deposition is assumed to be close to that of wet deposition, even though it contains a small fraction of dry deposition, as gases and particles can deposit on the surface of the collecting device during dry periods. Wet-only precipitation collectors positioned in the open field are also running in a small number of ICP Forests plots.
A second series of collectors are located under the forest canopy across the typically 50 m × 50 m (approx.) monitoring plots (throughfall collectors). Throughfall deposition accounts for both wet deposition and dry deposition, because particles deposited on the tree canopies during dry periods are later washed down together with precipitation. Dry deposition is larger in forests than in the open field because of the large surface area and the roughness of the canopy. Throughfall deposition does not fully reflect the total (wet + dry) atmospheric deposition, however, because some substances are taken up or excreted or leached by tree canopy. In this paper we do not attempt to evaluate the effect of canopy interaction on throughfall deposition, discussed for example by Draaijers and Erisman (1995), Staelens et al. (2008), Talkner et al. (2010), or Ahrends et al. (2021). Sites of the Swedish SWETHRO Network (Pihl-Karlsson et al., 2011) are not formally a part of ICP Forests, but the data are reported to ICP Forests, and used in this study. These data are collected with similar protocols to those used in the ICP Forests network.
Samples were analyzed by different laboratories, typically one per country or at the level of federal states in Germany. All laboratories participated every 1–2 years in a mandatory working ring test (König et al., 2013). Sampling frequency is weekly, fortnightly or monthly.
In the period 2010–2014, deposition was sampled at 362 ICP Forests sites. Here, we considered only those sites where the samplers have been exposed for at least 330 days for at least 1 year. Stemflow is not considered in this paper.
In the ICP Forests data, the analytical quality of each sample was tested by comparing its measured and calculated electrical conductivity. For open field samples (wet-only or bulk), a comparison between the sum of cation and anion concentrations was performed. This second test was not applied to throughfall samples, as they contain high amount of dissolved organic carbon (DOC), generally carrying a negative charge. Details on the tests and the minimum quality required for passing the tests are reported by König et al. (2013). In the ICP Forests manual, it is requested to repeat analysis of samples not passing the tests, but after the results are confirmed, the results are accepted even if the test is still not passed. For the present paper, plots were discarded on a year by year basis when less than 50% of the samples passed the quality check. This arbitrary limit was chosen as a compromise between good geographical coverage and data quality, considering that a relevant number of analyses not passing the check consist of samples with small collected volume, for which complete analysis was not possible.
In conclusion, within the ICP Forests and the SWETHRO network, data from 204 sites were retained for the open field bulk deposition, from four sites for wet-only samplers and from 246 sites for throughfall deposition. Figure 1 shows the location of these sampling sites in Europe. Almost one half of the ICP Forests sampling sites used in this paper are in Germany, France and Poland, i.e., in an area with high S and N emissions.
Data Treatment
Annual depositions of NO3−, NH4+, and SO4= were obtained by multiplying the volume weighted average concentrations by the annual amount of precipitation. As the deposition of marine aerosol may represent an important contribution to the total deposition of SO4=, a sea-salt correction was applied on the annual deposition values, subtracting the marine contribution from S deposition in order to obtain an estimate of non-marine oxidized S deposition (SO4*). The correction factor was obtained as fractions of the chloride or sodium deposition, using the formulas reported in the manual of the ICP Modelling and Mapping (CLRTAP, 2004). To limit the bias due to local sources of either chloride or sodium, the smaller correction was applied.
The contribution of marine aerosol to SO4= deposition, which may be relevant in coastal areas, is not included in the EMEP model, and the results are directly comparable with sea-salt corrected SO4= deposition provided by the monitoring networks.
The comparison between modeled and measured deposition and between measurement networks was performed both graphically and statistically, using regression analysis and testing the significance of the differences between the bias of the model using a Student’s t-test for independent samples for each combination of substance and sampler. Bonferroni correction (Dunn, 1961) was applied to account for repeating the same test for several combinations.
For each variable and sampling method, modeled deposition was plotted against measured deposition, considering an average deposition value for each site, without distinguishing between sites running for the whole study period (5 years) or for less. In this latter case, we averaged only those years of modeled data that are also available in the measured data on a plot-by-plot basis.
Bias was calculated as the difference between mean modeled and measured values. Percent bias was obtained by dividing bias by the measured value, and multiplying by 100.
Measured deposition data obtained in the same location (i.e., at a distance lower than 10 km) using different samplers were compared with each other. Also in this case, data were averaged using only the years in which all the different samplers were active, and the data obtained were validated.
To stabilize data variance, measured and modeled deposition values were log-transformed before performing regression analysis and the Student’s t-test was applied on percent bias. One NH4+ value reported in Iceland as zero because all data were below the detection limits was replaced with the value 0.01 before log transformation.
Samples with a Cook (1977) distance larger than 4/n (where n is the number of data pairs) in the log-log regression were considered as outliers and excluded from the data before statistic treatment, but these outliers are present in the plots, identified with a different symbol in the maps and discussed in the text.
Most calculations were performed in a spreadsheet, Cook’s distance was obtained using the base package in the R statistical environment (R core team, 2020).
Results
Non-marine Sulfate Deposition
The mean annual wet, bulk open field and throughfall deposition of SO4* measured in Europe span over more than one order of magnitude (Table 1), with average values across time and plots of 2.5, 3.0 and 4.2 kg S ha−1 y−1, respectively. Considering bulk open field deposition, the average values measured in the ICP Forests network are higher than those measured in the EMEP network, on average by 12%, at least in part because most ICP Forests samplers are located in central Europe, in areas with high S emission (Figure 1). After outlier rejection and Bonferroni correction, the Student’s t-test on log-transformed deposition values found significant (p < 0.05) differences between the networks for wet deposition, but not for bulk open field deposition. In the case of wet deposition, the results are similar, but the number of wet samplers in the ICP Forests network is too low to make the comparison meaningful.
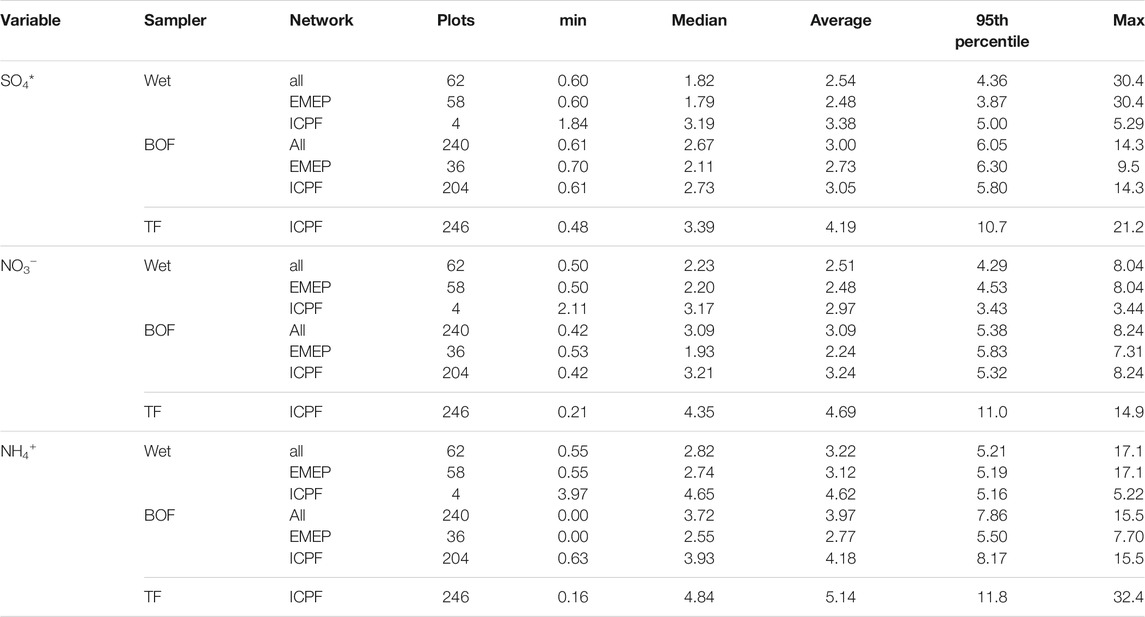
TABLE 1. Selected descriptive statistics of average yearly deposition of non-marine sulfate (SO4*, in kg S ha−1 y−1), nitrate (NO3−) and ammonium (NH4+, both in kg N ha−1 y−1) collected by wet, bulk open field (BOF) and throughfall (TF) samplers in Europe in 2010–2014, in the EMEP and ICP Forests and SWETHRO (ICPF) networks.
In only four ICP Forests plots, wet, bulk open field and throughfall collectors were all running in the same period, and four ICP Forests plots with bulk samplers and 6 with throughfall samplers were located at a distance smaller than 10 km from an EMEP wet sampler. In these sites wet SO4* deposition showed lower values than both bulk open field and throughfall deposition, which include, beside wet deposition, the amount of dry deposition collected by the constantly open bulk sampler in dry periods and by tree canopies, respectively (Figure 2A).
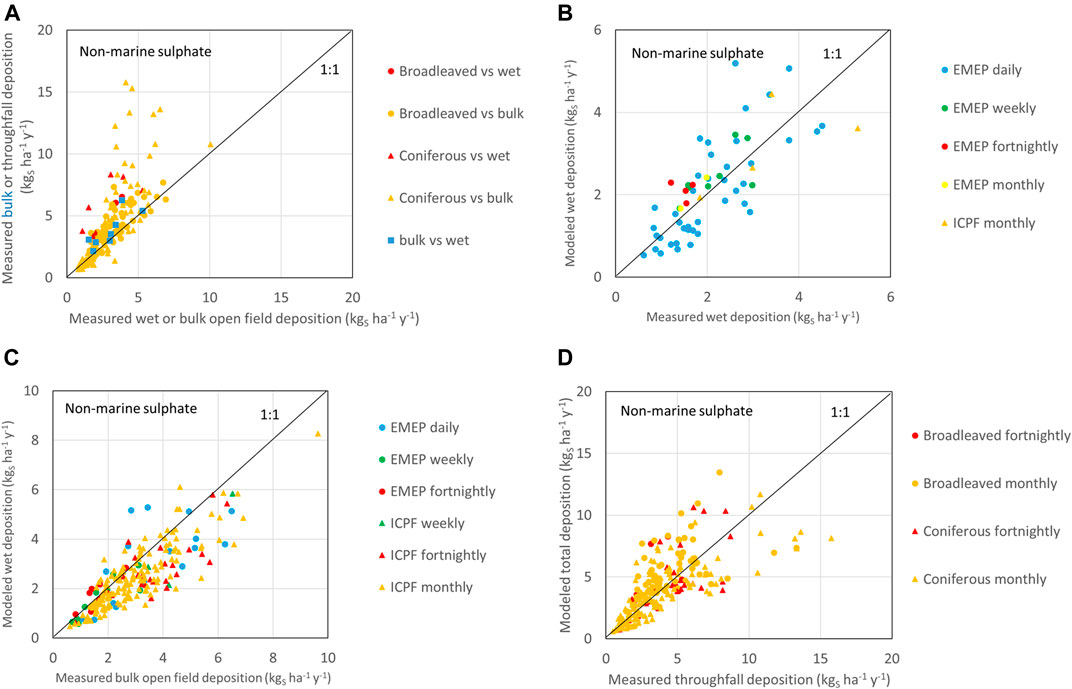
FIGURE 2. Comparison between average non-marine sulfate deposition collected with different samplers in the same location (A), between modeled wet deposition and measured wet deposition (B) and bulk open field deposition (C), and between modeled total deposition and measured throughfall deposition (D).
In 75% of the forest plots where both were measured, SO4* throughfall deposition was higher than open field bulk deposition, as expected because the former also contains dry deposition collected by forest canopy and washed off during rainfall. However, in the remaining sites, throughfall deposition was slightly lower than open field bulk deposition, most probably because of the low levels of dry deposition coupled with analytical uncertainty. It is also possible that there might be a small direct uptake of S by foliage that becomes apparent at low levels of dry deposition (Staelens et al., 2008).
Sites with the highest SO4* wet deposition values (Figure 3A) are located in eastern Europe (in Croatia, Slovakia, and Hungary) and in Italy, at the margin of the strongly industrialized Po plain. A high SO4* deposition value was measured in Montenegro, in a site relatively close (150–250 km) to three large point sources of S emission, namely the Kostolac, Nikola Tesla, and Tuzla coal power plants (Fioletov et al., 2016).
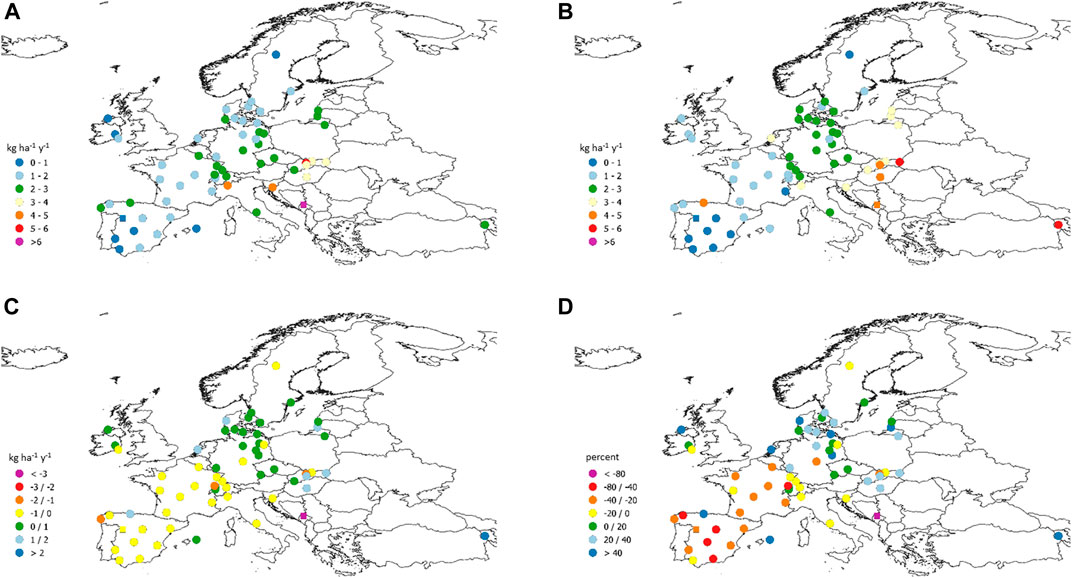
FIGURE 3. Measured (A) and modeled (B) wet non-marine sulfate deposition (kg S ha−1 y−1), and differences [(C), in kg S ha−1 y−1] and percent differences (D) between them. Squares indicates outliers in the regression between log-transformed modeled and measured deposition.
The geographical distribution of high values of bulk deposition of SO4* (Figure 4A) extends more to eastern Europe than in the case of wet deposition, also including Poland, Czechia, and Slovenia. This different pattern may be partially due to the different distribution of wet and bulk sampling sites: for example there are no wet sampler in some countries where bulk deposition is high, such as Poland, Belgium, or Romania. A smaller area with high S deposition level includes Belgium and some sites in Germany, Denmark, and Norway. A high S bulk deposition value was measured in Serbia, not far from the site where high wet deposition was measured.
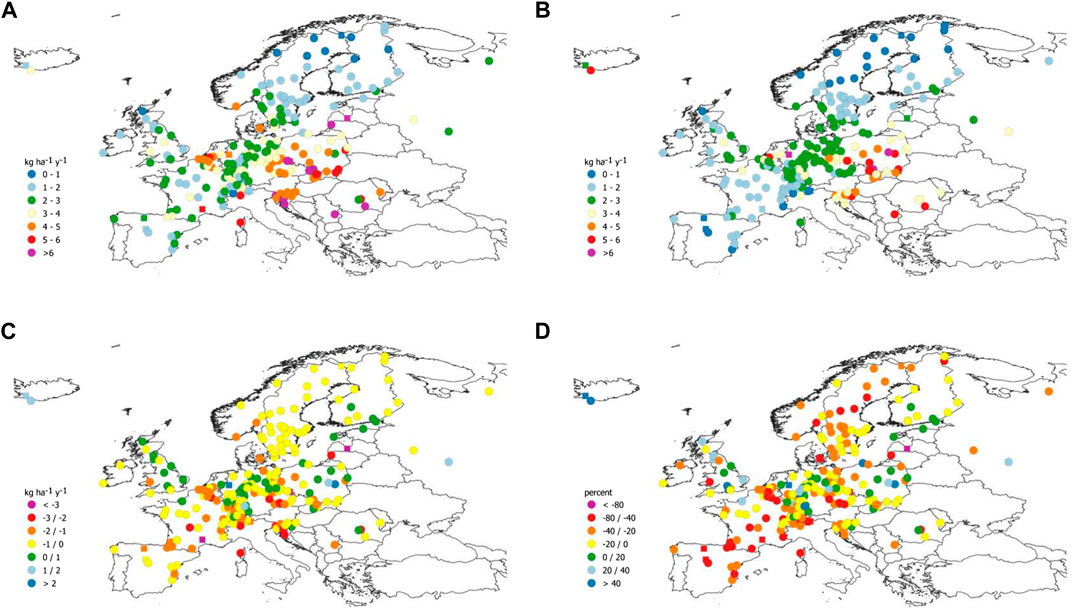
FIGURE 4. Measured bulk open field (A) and modeled wet (B) non-marine sulfate deposition (kg S ha−1 y−1), and differences [(C), in kg S ha−1 y−1] and percent differences (D) between them. Squares indicates outliers in the regression between log-transformed modeled and measured deposition.
The mean annual throughfall deposition of SO4* showed a larger range than those of wet and open field bulk deposition (Table 1), and the geographical distribution of throughfall deposition (Figure 5A) is similar to the distribution of wet-only and open field bulk deposition, but high levels are also found in Greece and the United Kingdom.
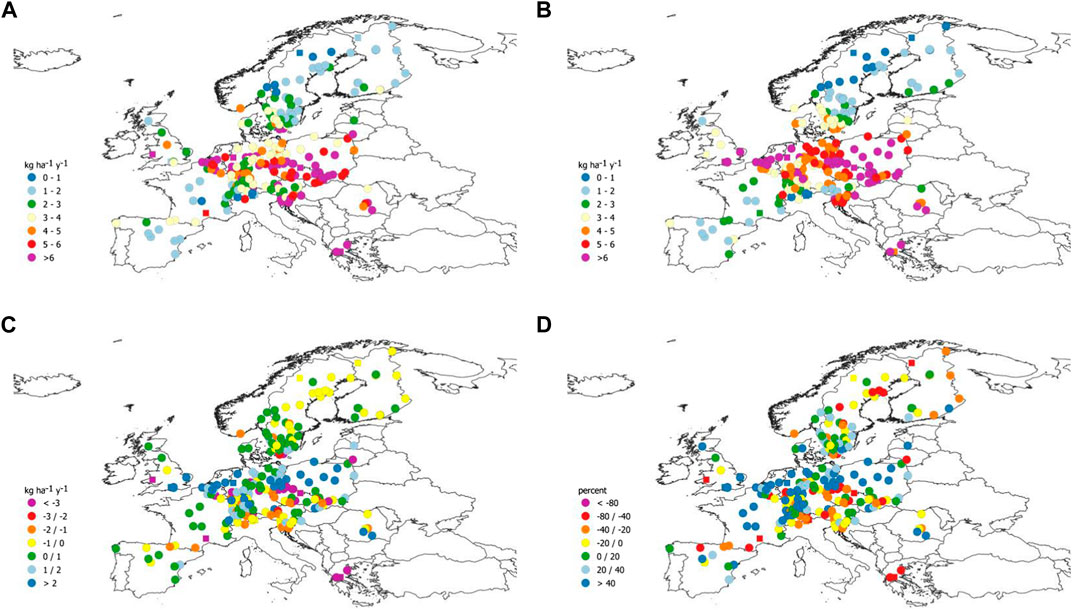
FIGURE 5. Measured throughfall (A) and modeled total (B) non-marine sulfate deposition (kg S ha−1 y−1), and differences [(C), in kg S ha−1 y−1] and percent differences (D) between them. Squares indicates outliers in the regression between log-transformed modeled and measured deposition.
Modeled SO4∗ wet deposition (Figures 3B, 4B) compared well (r2 = 0.61) with measured wet deposition (Figure 2B). After removing two outliers (one in Montenegro and one in Spain), the percent bias of the model is not significantly different from zero, and no significant difference was found among the percent bias for the different networks and sampling periods (Table 2). Apart from one case, the differences between modeled and measured S wet deposition are lower than 2 kg S ha−1 y−1 (Figure 3C). The differences are generally lower than 40%, but higher percentages were found in Spain, in one site in France and one in Montenegro (Figure 3D).
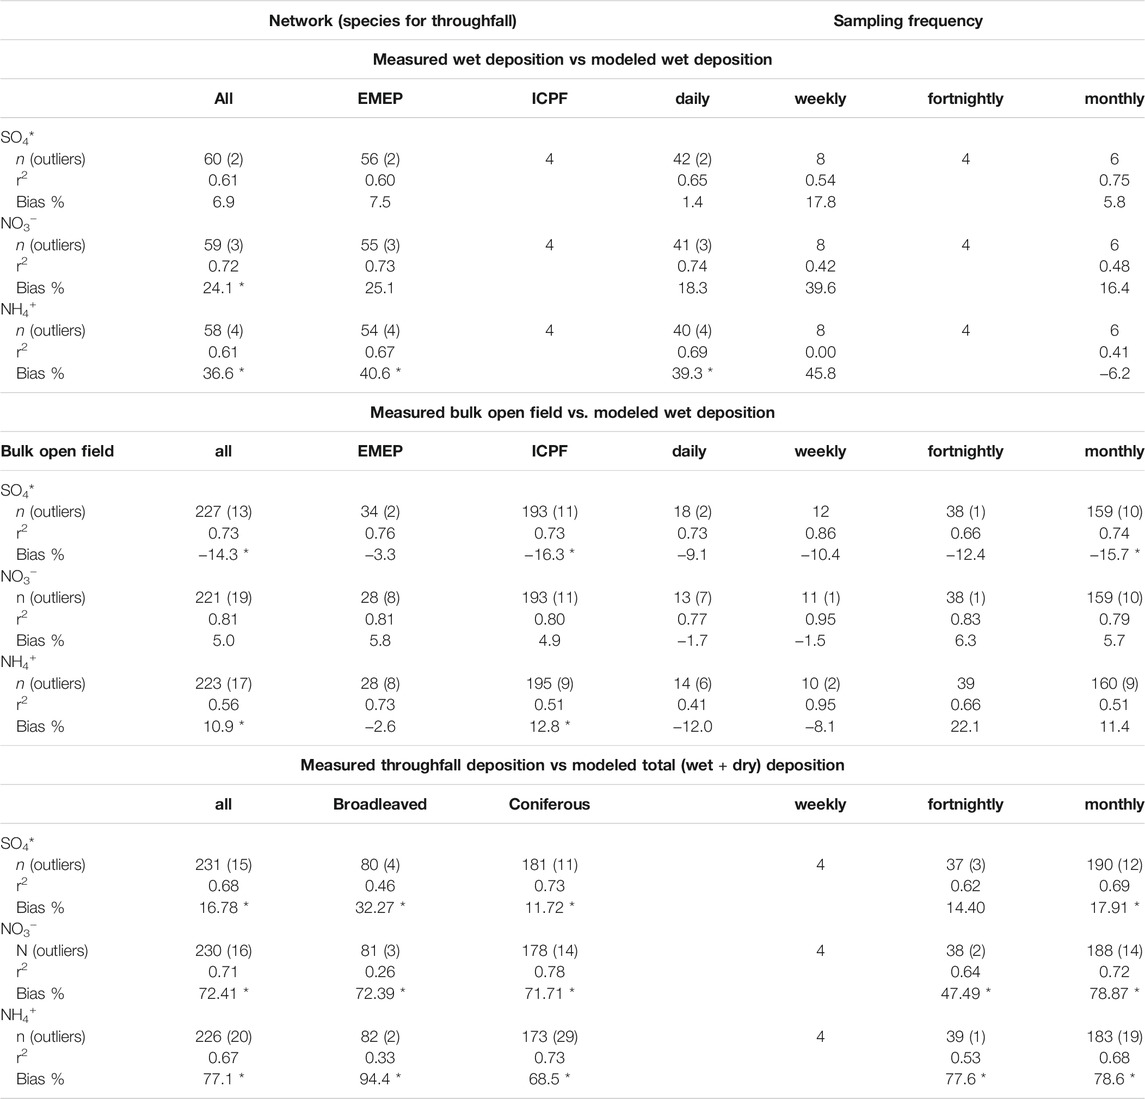
TABLE 2. Relationship between modeled and measured deposition in 2010–2014. r2 coefficient of determination between log-transformed modeled and measured deposition, n: number of sites, Bias %: percent average bias, *: bias significantly different from 0 at p < 0.05 (Student’s t-test).
In spite of the high correlation (r2 = 0.73 after the rejection of 13 outliers), measured SO4* bulk open field deposition was generally higher than modeled wet deposition (Figure 2C), and the percent bias (Figure 2D) was significantly different from zero (p < 0.05 after Bonferroni correction) in sites with monthly samples (Table 2), as expected considering that constantly open bulk samplers collect some amount of dry deposition in dry periods.
The differences between modeled wet and measured bulk SO4* wet deposition were in general lower than 2 kg S ha−1 y−1, but higher differences were found in France, Czechia, Lithuania and particularly in the southern Alps (Italy and Slovenia) a region with strong orographic precipitation and close to large industrial areas (Figure 4C). In spite of the small absolute differences, percent differences were marked: in most of central Europe, modeled deposition was lower than measured deposition by more than 40% of the measured value (Figure 4D).
The comparison between measured throughfall (Figure 5A) and modeled total (Figure 5B) SO4* deposition showed higher scatter, and 15 outliers were detected. After outlier rejection, a good correlation between log-transformed modeled and measured deposition (r2 = 0.68) was found, and the percent bias was low (17%) but significantly different from zero. Large differences were found in central Europe, from England to Poland, and in Greece and Romania (Figure 5C), while high percent differences were also found in region with low deposition values, such as in Spain and in Scandinavia (Figure 5D).
Nitrate Deposition
In the case of NO3−, the range of the mean annual wet, bulk open field and throughfall depositions is large (from 0.2 to 15 kg N ha−1 y−1, Table 1), with average values of 2.5, 3.1 and 4.7 kg N ha−1 y−1. As for SO4*, the average values measured in the ICP Forests network are higher than those measured in the EMEP network, on average by 20% for wet deposition and 44% for bulk open field deposition. The difference between the mean log-transformed values for the two networks was significant only for bulk open field deposition (p < 0.001 after Bonferroni correction).
In sites where different samplers were exposed, NO3− wet deposition results were lower than from both bulk open field and throughfall deposition, presumably because of the amount of dry deposition collected by the constantly open bulk sampler in dry periods and by the tree canopy, respectively (Figure 6A). As expected, in 71% of the forest sites where both were measured, NO3− throughfall deposition was higher than open field bulk deposition, probably because of dry deposition collected by forest canopy.
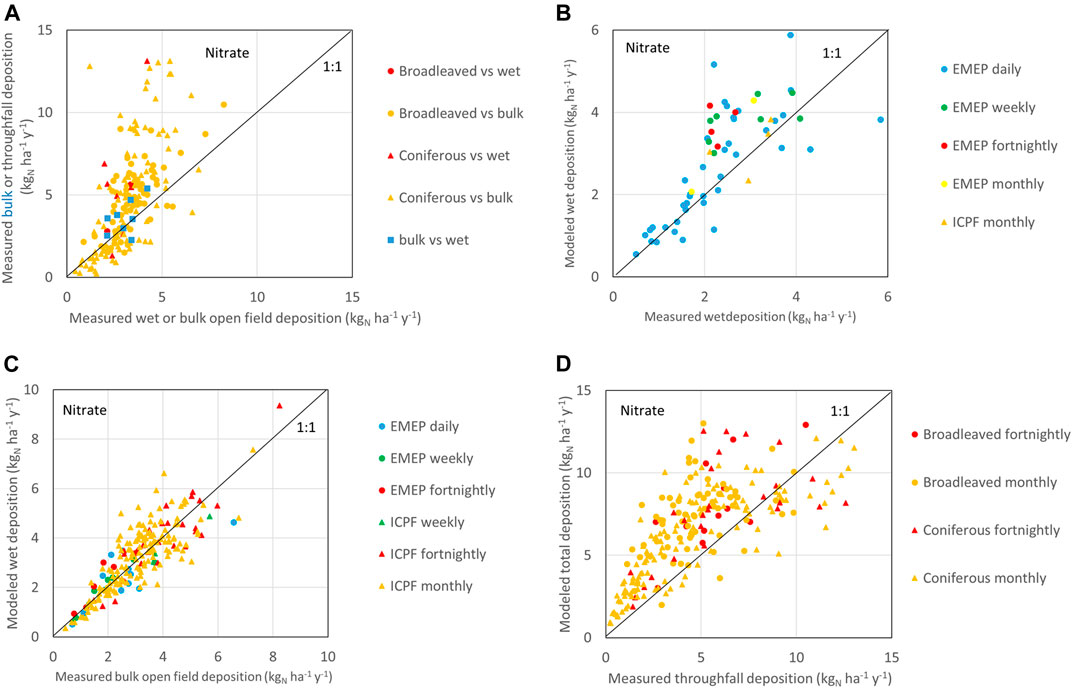
FIGURE 6. Comparison between average nitrate deposition collected with different samplers in the same location (A), between modeled wet deposition and measured wet deposition (B) and bulk open field deposition (C), and between modeled total deposition and measured throughfall deposition (D).
However, in most sites where open field deposition was lower than 2.5 kg N ha−1 y−1 and in a large share of sites where it was lower than 3.5 kg N ha−1 y−1, NO3− throughfall deposition was lower than open field bulk deposition, reflecting the presence of processes decreasing the throughfall deposition of NO3− (“canopy effects”), such as foliar uptake of N compounds (e.g., Garten and Hanson, 1990) and the consequences of metabolism of microorganisms in the phyllosphere (e.g. Guerrieri et al., 2015).
The area with high NO3− wet deposition values (Figure 7A) is smaller than in the case of SO4*, including Italy, part of France, Switzerland, and Germany and some sites in Sweden and Lithuania. The highest average NO3− deposition was measured in Montenegro, in the same site relatively close to large point sources where the maximum SO4* deposition was measured, and in Italy, in the southern slope of central Alps, in a site receiving a high amount of orographic precipitation and located close to the Po plain, where most of Italian industry and agriculture are located.
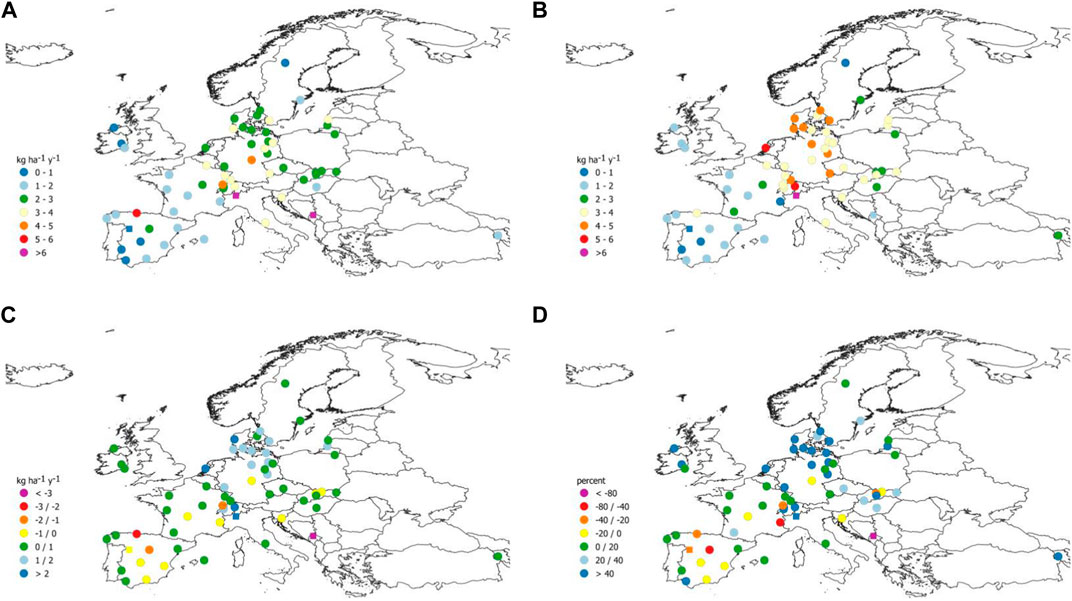
FIGURE 7. Measured (A) and modeled (B) wet nitrate deposition (kg N ha−1 y−1), and differences [(C), in kg N ha−1 y−1] and percent differences (D) between them. Squares indicates outliers in the regression between log-transformed modeled and measured deposition.
The geographical distribution of high values of bulk deposition of NO3− (Figure 8A) is larger, including Slovenia, Belgium, Czechia, Poland, southern Norway and southern Sweden, and extends westwards to sites in southern France and Spain. High values of throughfall NO3− deposition (Figure 9A) were found in the same area and in Switzerland, Austria, Wales, Denmark and in central Sweden.
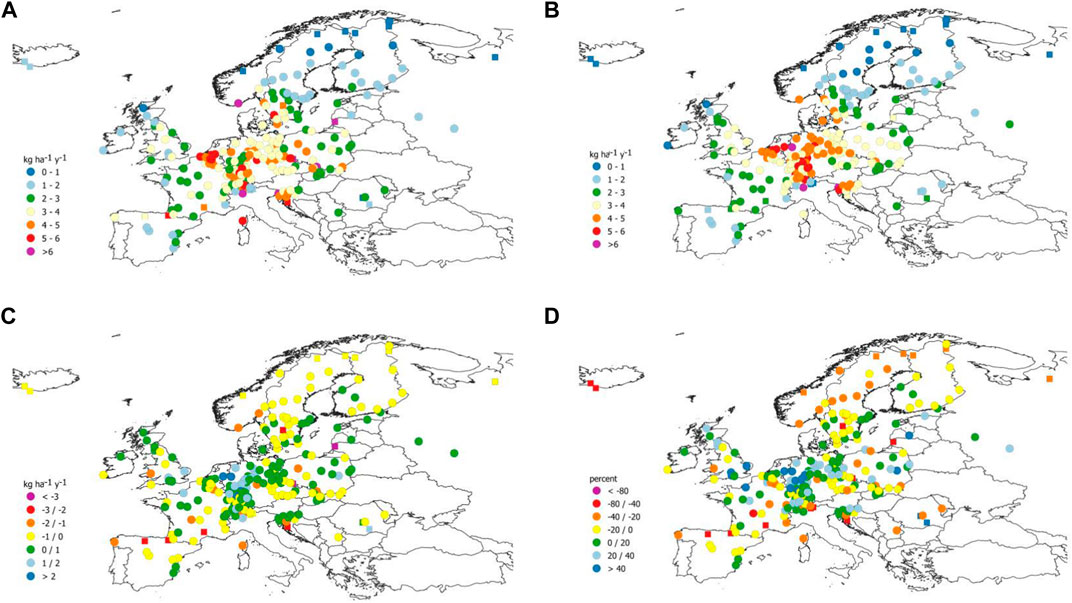
FIGURE 8. Measured bulk open field (A) and modeled wet (B) nitrate deposition (kg N ha−1 y−1), and differences [(C), in kg N ha−1 y−1] and percent differences (D) between them. Squares indicates outliers in the regression between log-transformed modeled and measured deposition.
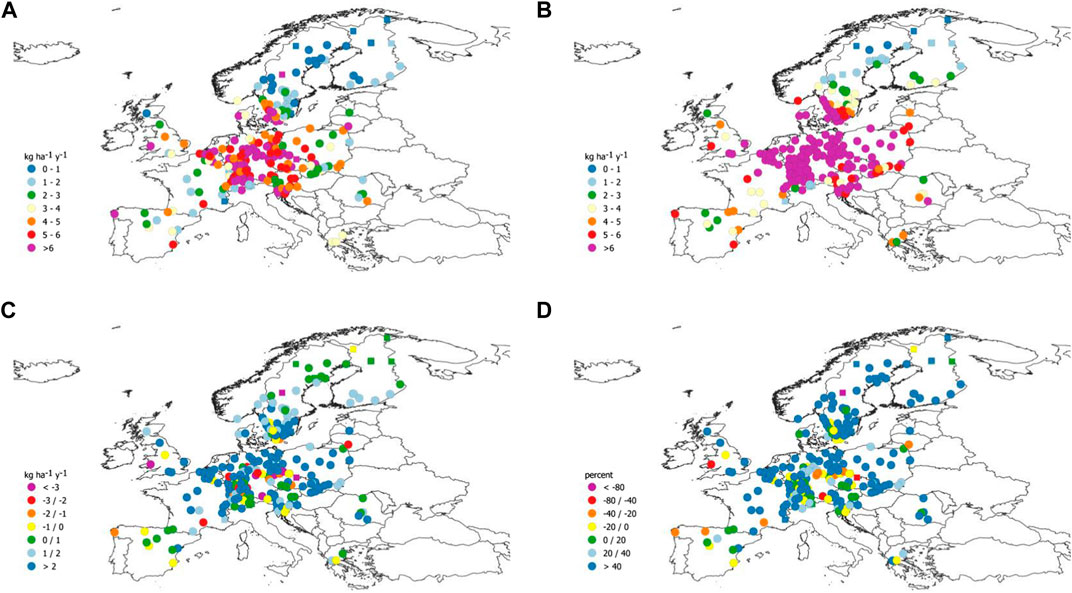
FIGURE 9. Measured throughfall (A) and modeled total (B) nitrate deposition (kg N ha−1 y−1), and differences [(C), in kg N ha−1 y−1] and percent differences (D) between them. Squares indicates outliers in the regression between log-transformed modeled and measured deposition.
As in the case of SO4*, modeled NO3− wet deposition (Figures 7B, 8B) compare well (r2 = 0.72) with measured wet deposition (Figure 6B). However, after removing three outliers (in Montenegro, Italy and Spain), the percent bias of the model still was significantly different from zero (Table 2). In fact, for the higher values of NO3− deposition, modeled wet deposition was higher than measured wet deposition, suggesting a small loss of N from the samplers. or chemical transformation within the sample, or a small model bias relating to high concentrations and/or precipitation amounts.
After the rejection of 19 outliers, measured NO3− bulk open field deposition and modeled NO3− wet deposition showed a high correlation (r2 = 0.81) and the percent bias was not significantly different from zero.
The differences between modeled NO3− wet deposition and both measured NO3− wet and bulk deposition were generally lower than 2 kg N ha−1 y−1 (Figures 7C, 8C) but percent differences larger than 40% were common (Figures 7D, 8D).
As in the case of SO4*, the comparison between measured throughfall (Figure 9A) and modeled total (Figure 9B) NO3− deposition showed a high scatter. In most of the sites, and in particular all sites where throughfall deposition was lower than 2.9 kg N ha−1 y−1, modeled total deposition resulted higher than measured throughfall deposition, suggesting that canopy effects (see below) may also have an effect on NO3−. After the rejection of 16 outliers, a good correlation between log-transformed modeled and measured deposition (r2 = 0.71) was found, but the percent bias was high (72%) and consistently different from zero, for both coniferous and broadleaved forests and for both fortnightly and monthly sampling (Table 2). Large differences were mainly found in sites in central Europe (Figures 9C,D).
Ammonium Deposition
Average NH4+ wet, bulk open field and throughfall deposition (3.2, 4.0 and 5.1 kg N ha−1 y−1, Table 1) were larger than the respective values for NO3−. As for SO4* and NO3−, the average values measured in the ICP Forests network were higher than those measured in the EMEP network, on average by 48% for wet deposition and 51% for bulk open field deposition. The difference between the mean log-transformed values for the two networks was significant only for bulk open field deposition (p < 0.05 after Bonferroni correction).
As in the case of SO4* and NO3−, in sites where different samplers were used simultaneosly, wet deposition results were lower than both bulk open field and throughfall deposition. Measured throughfall deposition was generally higher than bulk open field deposition, because of the amount of dry deposition collected by tree canopy (Figure 10A), but it was very close to bulk deposition in all sites where the former was lower than 2.1 kg N ha−1 y−1, because of canopy effects, which may completely compensate both surface deposition of ammonia and dry deposition of NH4+ collected by the forest canopy and washed off during rainfall on these plots.
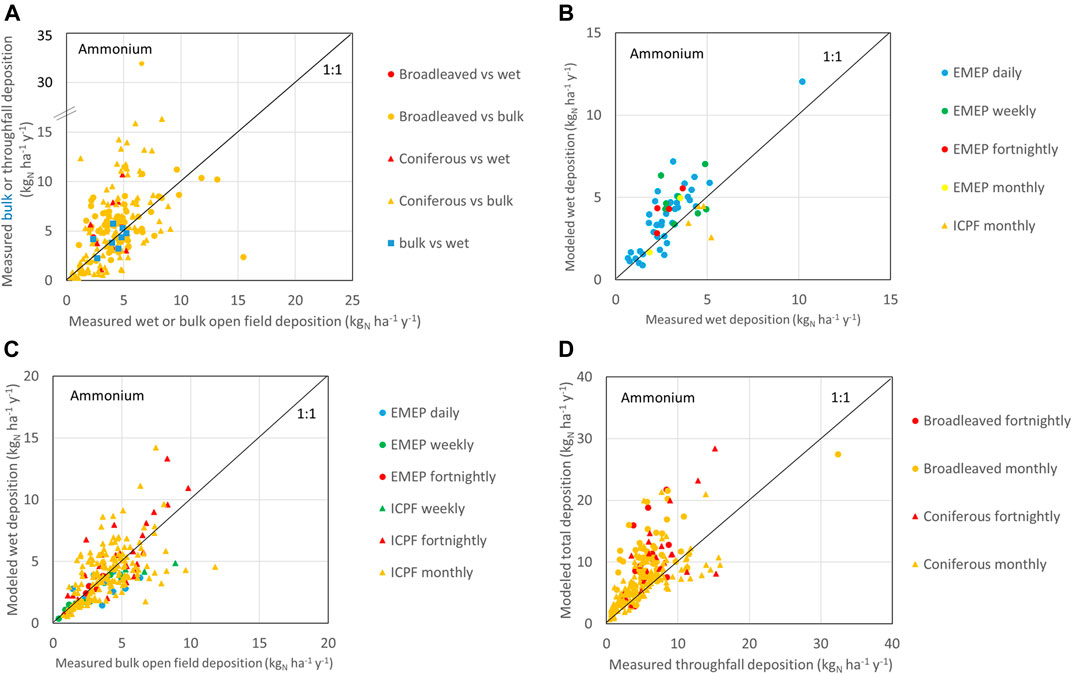
FIGURE 10. Comparison between average ammonium deposition collected with different samplers in the same location (A), between modeled wet deposition and measured wet deposition (B) and bulk open field deposition (C), and between modeled total deposition and measured throughfall deposition (D).
The area with high NH4+ wet deposition values (Figure 11A) was larger than in the case of SO4* and NO3−, including Germany, Switzerland, northern Italy, and eastern France. As in the case of NO3−, the highest average NH4+ deposition values were measured in Montenegro and in Italy, in the same sites remarked above. However, the geographical distribution of high values of bulk and throughfall NH4+ deposition (Figures 12A, 13A) was large, covering central Europe from France to Poland, and from southern Scandinavia and England to Croatia.
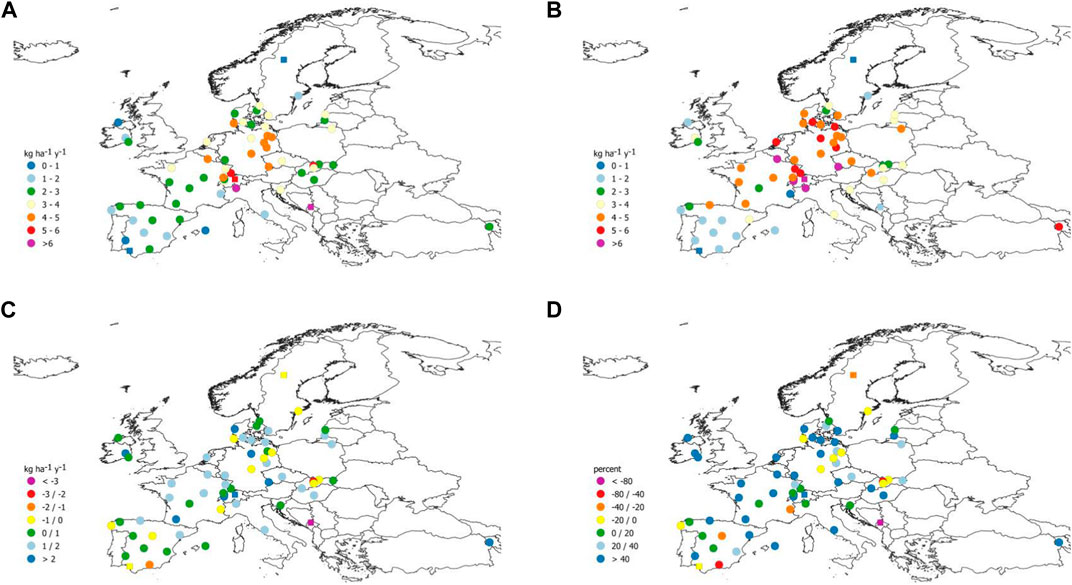
FIGURE 11. Measured (A) and modeled (B) wet ammonium deposition (kg N ha−1 y−1), and differences [(C), in kg N ha−1 y−1] and percent differences (D) between them. Squares indicates outliers in the regression between log-transformed modeled and measured deposition.
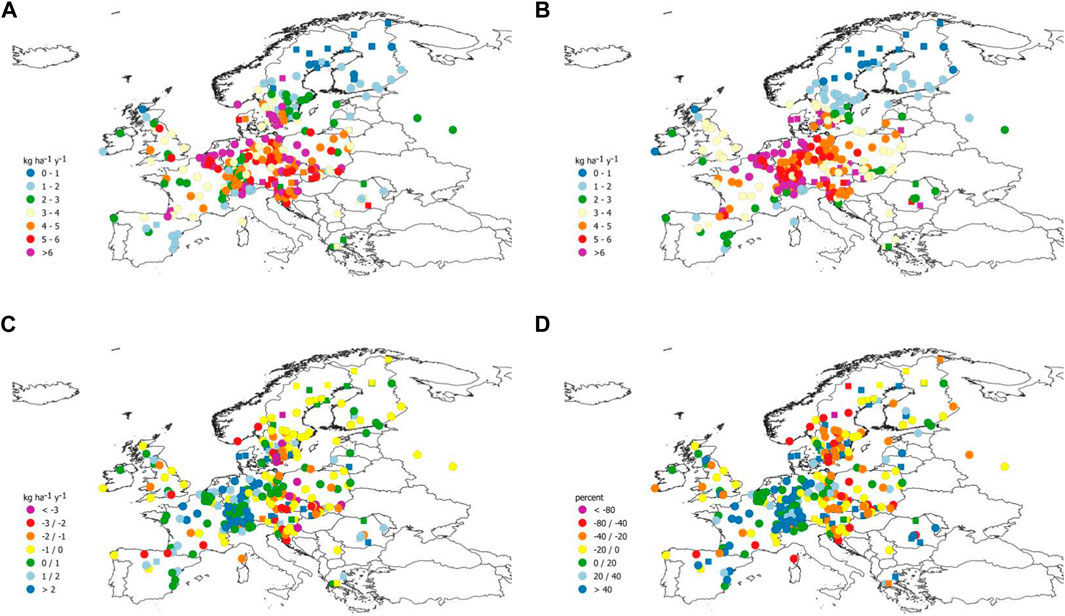
FIGURE 12. Measured bulk open field (A) and modeled wet (B) ammonium deposition (kg N ha−1 y−1), and differences [(C), in kg N ha−1 y−1] and percent differences (D) between them. Squares indicates outliers in the regression between log-transformed modeled and measured deposition.
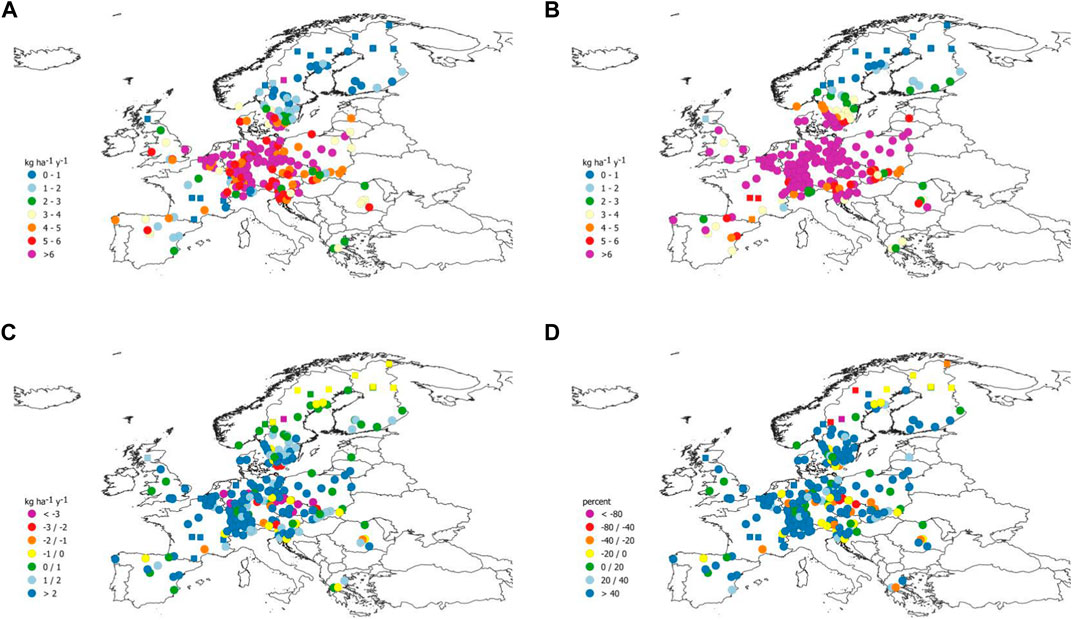
FIGURE 13. Measured throughfall (A) and modeled total (B) ammonium deposition (kg N ha−1 y−1), and differences [(C), in kg N ha−1 y−1] and percent differences (D) between them. Squares indicates outliers in the regression between log-transformed modeled and measured deposition.
As in the case of SO4* and NO3−, modeled NH4+ wet deposition (Figures 11B, 12B) compared well with measured wet (r2 = 0.61, Figure 10B) and bulk open field (r2 = 0.56, Figure 10C) deposition. However, after removing 4 and 17 outliers, respectively, the percent bias of the model still was significantly different from zero, with modeled values higher than measured values. Modeled values higher than measurements suggests small nitrogen loss from the sampler, or an overestimation of the model, possibly due to the fact that the model provides higher value for the spatial cell (within the grid) in which the measurement site is located because the cell includes locations with locally high NH3 sources while measurements are performed in more remote areas.
Measured throughfall NH4+ deposition (Figure 13A) was lower than modeled total NH4+ deposition (Figure 13B) in most sites (Figure 10D), indicating again the presence of relevant canopy effects. However, when throughfall deposition was higher than 8 kg N ha−1 y−1, measured throughfall deposition was higher than modeled total deposition at a number of sites, suggesting that the canopy effects affecting NH4+ deposition may be less efficient when deposition values are very high.
After the rejection of 20 outliers, and in spite of a good correlation between log-transformed modeled and measured deposition (r2 = 0.67), the percent bias was high (77%) and consistently different from zero, for both coniferous and broadleaved forest and for both fortnightly and monthly sampling (Table 2). As a consequence, large differences between modeled total and measured throughfall NH4+ deposition were found almost everywhere (Figures 13C,D).
Discussion
The last comparison between measured and modeled deposition data at ICP Forest sites was performed by Simpson et al. (2006). The authors concluded that the comparability between the EMEP model and the ICP Forests measured data could be improved by 1) introducing a stricter quality assurance/quality control (QA/QC) procedure on the ICP Forests data, 2) verifying the precision and comparability of deposition samplers used in the ICP Forests network, 3) improving the ability of the EMEP model to simulate different receptors (such as coniferous and broadleaved forests), 4) more specific evaluation of model results for different N compounds (HNO3, NH4NO3, etc.), and 5) improving the spatial and temporal resolution of the EMEP model (then ca. 50 km × 50 km).
Since the Simpson et al. (2006) work, many of these proposals were implemented. In the EMEP MSC-W model, a major change has been the increase in the default resolution (for European runs) to a finer model grid (0.1 degrees × 0.1 degrees) (Schaap et al., 2015; Solberg et al., 2017). Many improvements have also been made in the treatment of aerosols and the chemical mechanism (Simpson et al., 2017; Stadtler et al., 2018), the deposition scheme and boundary layer physics (see Supplementary Table S1 of Simpson et al., 2012, Table 8.2 of Simpson et al., 2017). In ICP Forests QA/QC procedures were introduced, using internal quality controls based on ion balance and conductivity checks and external quality controls, with mandatory ring tests for the laboratories at least every 2 years (Ferretti et al., 2009; König et al., 2013). Furthermore, Zlindra et al. (2011) assessed the comparability of the deposition samplers used in different countries between each other and versus a standardized collector shaped following the rules used for meteorological gauges. Results showed good agreement in the amount and the chemical composition of precipitation between all national collectors and the harmonized one.
Considering the large effort in improving the accuracy of both modeled and measured N and S deposition data, we present an updated assessment of the comparability of measured and modeled atmospheric deposition at the EMEP-CCC and the ICP Forests Level II monitoring sites and the modeled deposition by the EMEP model. This evaluation was carried out to verify the effectiveness of the improvements.
Modeled and measured values generally compare well. In particular, measured wet deposition of SO4* and NO3− was close to modeled wet deposition, but in some sites, generally located near to local sources, the differences between measured and modeled values were substantial. For the higher values of NO3− deposition, modeled wet deposition was higher than measured wet deposition, suggesting a small loss of N from the samplers, or slight model overestimation.
Measured open field bulk deposition of SO4* was slightly higher than modeled wet deposition, since bulk samplers, being continuously open, also collect some dry deposition, which causes a small increase in the value of the measured deposition.
On the contrary, NO3− bulk open field deposition was close to the measured values, probably because the small amount of dry deposition collected by bulk samplers reduced the difference between modeled and measured wet deposition values.
Modeled wet and measured wet and bulk NH4+ deposition were less comparable than those of SO4* or NO3−, which might be explained by local sources of ammonia (NH3) being relevant for ammonium (NH4+) deposition. Ammonia emission estimates, in terms of both amount and spatial distribution, are still associated with considerable uncertainties, and an increase of the model resolution would not reduce inaccuracies in NH4+ deposition, unless the emission input is improved. For a better prediction of NH4+ deposition at a specific site of interest, the analysis of the surroundings should also be included, identifying the proximity of local sources such as animal farming or agricultural fields.
Measured throughfall of SO4* compared well to modeled total (wet + dry) deposition, with a bias not significantly different from zero. On the contrary, measured throughfall of both NH4+ and NO3− were significantly lower than modeled total deposition, as expected because of canopy effects affecting N compounds. For this reason, it is important to further improve the quantification of N deposition to forests, including progresses in estimating dry deposition, for example via surrogate surface/surface washing approaches (Aguillaume et al., 2017; Karlsson et al., 2019), and to obtain a better quantification of canopy exchange (Draaijers and Erisman 1995) and a better understanding of the importance of conversion processes by microorganisms in the phyllosphere (e.g., Guerrieri et al., 2015). Also, we need to pay attention to sites located close to large emission sources and receiving orographic precipitation, as the distribution of outliers suggests that sites located close to large emission sources show relatively larger differences between modeled and measured deposition. Attention must also be paid to sites with low deposition values, such as those in remote areas, where the differences between measured and modeled values are comparable to the measured value (see for example Figures 11D, 12D and 13D compared to Figures 11C, 12C and 13C).
To evaluate the effect of the stricter quality assurance in deposition monitoring and of the improvements in the EMEP model, it is possible to compare the statistical parameters (intercepts, slopes and percentage variance explained) of the comparison between measured and modeled deposition reported by Simpson et al. (2006) with those calculated for the dataset used in the present study (Supplementary Table S1).
In the case of the comparison between modeled wet and measured open field sulfate deposition, the intercept of the linear regression between modeled and measured data decreases from 1.20–2.76 to 0.26–0.66 and the slope increases from 0.26–0.66 to 0.86–1.18 from the period 1997–2000 to the period 2010–2014. This pattern indicates a marked improvement in the comparability of the two estimates of sulfate deposition. An improvement in the r2 values is also evident from 0.25 to 0.47 in the period 1997–2000 to 0.66–0.70 from 2010 to 2013. A lower value (0.39) was found in 2014, partially due to the presence of outliers. In fact, in the 2014 data, rejecting one outlying result imporves the r2 value from 0.39 to 0.59 (Supplementary Table S1).
The same pattern is evident for the comparison between open field measured and wet modeled NO3 deposition, with the intercept decreasing from 1.02–1.38 to 0.59–0.84 and the slope increasing from 0.22–0.43 to 0.70–0.82. The increase in r2 (from 0.45–0.50 to 0.51–0.69) is less evident than in the case of sulfate.
These results show an evident improvement in the comparability between measured and modeled sulfate and nitrate deposition, that can be ascribed to both model refinement and extended quality control of the analytical procedure.
On the contrary, in the case of NH4+ deposition, there is not an improvement in r2 values, nor an evident change in slope and intercept of the linear regression. This coincides with the lower comparability between measured and modeled ammonium deposition discussed in the paper, which is likely due to the higher importance of local sources for ammonium deposition than for sulfate and nitrate deposition, making modeled NH4+ deposition less accurate.
In the case of throughfall deposition, as discussed before, a direct comparison with modeled total deposition is possible only for sulfate. Considering ICP Forests plots in coniferous forests, a decrease in the intercept is still evident, from 2.39–3.71 to −0.19–1.13, together with an increase in the slope from 0.51–0.76 to 0.77–1.09 from the period 1997–2000 to the period 2010–2014. However, no evident improvement in r2 was detected. For plots in broadleaved forests, the pattern is less clear, but it must be considered that the number of plots is lower than for coniferous forests.
An improvement in the comparability of modeled and measured deposition from 1997 to 2000 to 2010–2014 is evident for wet vs open field SO4* and NO3 deposition, suggesting that model refinements and stricter quality assurance procedures improved deposition estimates by model and measurement. However, for ammonium wet vs open field deposition and for throughfall vs total sulfate deposition we did not find a marked improvement in the comparability between measured and modeled deposition.
In summary, deposition modeling on a continental scale is a good tool for estimating both general patterns and trends in deposition and model improvements have improved the accuracy of these estimates in recent years. However, when more precise estimates are needed, for example in evaluating the effect of pollutant deposition on the ecosystem structure and functions or in developing more detailed cause-effect relationships at different spatial scales, local measurements and calculations of deposition are required.
Data Availability Statement
The datasets analyzed for this study can be found as follows: EMEP deposition measurement data are fully reported in the annual reports (downloadable from http://ebas.nilu.no); ICP Forests deposition data are stored in the ICP Forests database at the Programme Coordination Centre and are available on request (PCC-ICPForests@thuenen.de); Results of the EMEP MSC-W model can be downloaded from the following URL: https://emep.int/mscw/.
Author Contributions
All authors contributed actively in the planning and writing of the paper. AM performed the numerical and statistical treatment of the data. DS performed a custom run of the EMEP model for this paper.
Funding
The ICP Forests network was in general funded by national bodies and partially co-funded by the European Union under the Regulation (EC) No 2152/2003 of the European Parliament and of the Council of November 17, 2003 concerning monitoring of forests and environmental interactions in the Community (“Forest Focus”), and the LIFE+ projects FutMon (“Further Development and Implementation of an EU-level Forest Monitoring System” (LIFE07 ENV/D/000218). The EMEP work was funded by the EU FP7 projects ECLAIRE (project number 282910) and EMEP under UNECE, with computer time supported by the Research Council of Norway (Programme for Supercomputing).
Conflict of Interest
The authors declare that the research was conducted in the absence of any commercial or financial relationships that could be construed as a potential conflict of interest.
Publisher’s Note
All claims expressed in this article are solely those of the authors and do not necessarily represent those of their affiliated organizations, or those of the publisher, the editors and the reviewers. Any product that may be evaluated in this article, or claim that may be made by its manufacturer, is not guaranteed or endorsed by the publisher.
Acknowledgments
We warmly acknowledge the EMEP measuring network teams, the ICP Forests Programme Co-ordination Centre team and the national teams working in the ICP Forests and SWETHRO networks. Field data were provided by authors’ institutions and by Bundesforschungs-und Ausbildungszentrum für Wald, Naturgefahren und Landschaft (BFW) (Austria), Research Institute for Nature and Forest (INBO) (Belgium), Ministère de la Région Wallonne, Division de la Nature et des Forêts de la Direction Générale des Ressources Naturelles et de l’Environnement, (Belgium), Forestry and Game Management Research Institute (VULHM) (Czech Republic), Danish Centre for Forest, Landscape and Planning, University of Copenhagen (Denmark), Finnish Forest Research Institute (METLA) (Finland), Office National des Forêts (ONF) (France), Hellenic Ministry of Rural Development and Foods, General Directorate for Development and Protection of Forests and Natural Environment (Greece), State Forest Survey Service (Lithuania), Forest Research Institute (Poland), Institutul de Cercetări si Amenajări Silvice (Romania), National Forest Centre (Slovakia), Slovenian Forestry Institute (Slovenia), Dirección General para la Biodiversidad (Spain), Forest Research, Alice Holt Lodge (United Kingdom), Landesforstanstalt Eberswalde (Germany), Forstliche Versuchs-und Forschungsanstalt Baden-Württemberg (Germany), Bayerische Landesanstalt für Wald und Forstwirtschaft (LWF) (Germany), Northwest German Forest Research Station (Germany), Ministerium für Landwirtschaft, Umwelt und Verbraucherschutz (Germany), Landesamt für Natur, Umwelt und Verbraucherschutz NRW (Germany), Forschungsanstalt für Waldökologie und Forstwirtschaft Rheinland-Pfalz (Germany), Ministerium für Landwirtschaft, Umwelt und ländliche Räume (Germany), Landesamt für Umwelt-und Arbeitsschutz (Germany), Staatsbetrieb Sachsenforst (SBS) (Germany), Thüringer Landesanstalt für Wald, Jagd und Fischerei (TLWJF) (Germany), Latvian State Forestry Research Institute “Silava” (Latvia).
Supplementary Material
The Supplementary Material for this article can be found online at: https://www.frontiersin.org/articles/10.3389/fenvs.2021.734556/full#supplementary-material
References
Aguillaume, L., Izquieta-Rojano, S., García-Gómez, H., Elustondo, D., Santamaría, J. M., Alonso, R., et al. (2017). Dry Deposition and Canopy Uptake in Mediterranean Holm-Oak Forests Estimated With a Canopy Budget Model: a Focus on N Estimations. Atmos. Environ. 152, 191–200. doi:10.1016/j.atmosenv.2016.12.038
Ahrends, A., Bulling, M. T., Platts, P. J., Swetnam, R., Ryan, C., Doggart, N., et al. (2021). Detecting and Predicting Forest Degradation: A Comparison of Ground Surveys and Remote Sensing in Tanzanian Forests. Plants People Planet. 3, 268–281. doi:10.1002/ppp3.10189
Asman, W. A. H., Sutton, M. A., and Schjorring, J. K. (1998). Ammonia: Emission, Atmospheric Transport and Deposition. New Phytol. 139, 27–48. doi:10.1046/j.1469-8137.1998.00180.x
Bian, H., Chin, M., Hauglustaine, D. A., Schulz, M., Myhre, G., Bauer, S. E., et al. (2017). Investigation of Global Particulate Nitrate From the AeroCom Phase III experiment. Atmos. Chem. Phys. 17, 12911–12940. doi:10.5194/acp-17-12911-2017
Bull, K., Johansson, M., and Krzyzanowski, M. (2008). Impacts of the Convention on Long-Range Transboundary Air Pollution on Air Quality in Europe. J. Toxicol. Environ. Health A. 71, 51–55. doi:10.1080/15287390701557883
CLRTAP (2004). Manual on Methodologies and Criteria for Modelling and Mapping Critical Loads and Levels and Air Pollution Effects, Risks and Trends. Berlin, Umwelbundesamt.
Cook, R. D. (1977). Detection of Influential Observation in Linear Regression. Technometrics. 19, 15–508. doi:10.2307/1268249
Crutzen, P. J. (1970). The Influence of Nitrogen Oxides on the Atmospheric Ozone Content. Q.J R. Met. Soc. 96, 320–325. doi:10.1002/qj.49709640815
Draaijers, G. P. J., and Erisman, J. W. (1995). A Canopy Budget Model to Assess Atmospheric Deposition From Throughfall Measurements. Water Air Soil Pollut. 85, 2253–2258. doi:10.1007/BF01186169
Dunn, O. J. (1961). Multiple Comparisons Among Means. J. Am. Stat. Assoc. 56, 52–64. doi:10.1080/01621459.1961.10482090
Etzold, S., Ferretti, M., Reinds, G. J., Solberg, S., Gessler, A., Waldner, P., et al. (2020). Nitrogen Deposition Is the Most Important Environmental Driver of Growth of Pure, Even-Aged and Managed European Forests. For. Ecol. Management. 458, 117762–762. doi:10.1016/j.foreco.2019.117762
Ferretti, M., König, N., Rautio, P., and Sase, H. (2009). Quality Assurance (QA) in International Forest Monitoring Programmes: Activity, Problems and Perspectives From East Asia and Europe. Ann. For. Sci. 66, 403. doi:10.1051/forest/2009025
Fioletov, V. E., McLinden, C. A., Krotkov, N., Li, C., Joiner, J., Theys, N., et al. (2016). A Global Catalogue of Large SO2 Sources and Emissions Derived From the Ozone Monitoring Instrument. Atmos. Chem. Phys. 16, 11497–11519. doi:10.5194/acp-16-11497-2016
Galloway, J. N., Dentener, F. J., Capone, D. G., Boyer, E. W., Howarth, R. W., Seitzinger, S. P., et al. (2004). Nitrogen Cycles: Past, Present, and Future. Biogeochemistry. 70, 153–226. doi:10.1007/s10533-004-0370-0
Garten, C. T., and Hanson, P. J. (1990). Foliar Retention of 15N-Nitrate and 15N-Ammonium by Red Maple (Acer Rubrum) and White Oak (Quercus alba) Leaves From Simulated Rain. Environ. Exp. Bot. 30, 333–342. doi:10.1016/0098-8472(90)90045-6
Guerrieri, R., Vanguelova, E. I., Michalski, G., Heaton, T. H. E., and Mencuccini, M. (2015). Isotopic Evidence for the Occurrence of Biological Nitrification and Nitrogen Deposition Processing in Forest Canopies. Glob. Change Biol. 21, 4613–4626. doi:10.1111/gcb.13018
Hertel, O., Skjøth, C. A., Reis, S., Bleeker, A., Harrison, R. M., Cape, J. N., et al. (2012). Governing Processes for Reactive Nitrogen Compounds in the European Atmosphere. Biogeosciences. 9, 4921–4954. doi:10.5194/bg-9-4921-2012
Hjellbrekke, A. G. (2014). Data Report 2012 Acidifying and Eutrophying Compounds and Particulate Matter. EMEP/CCC-Report 3/2014. Kjeller: EMEP-CCC.
Hjellbrekke, A. G. (2015). Data Report 2013 Particulate Matter, Carbonaceous and Inorganic Compounds. EMEP/CCC-Report 1/2015. Kjeller: EMEP-CCC.
Hjellbrekke, A. G. (2016). Data Report 2014 Particulate Matter, Carbonaceous and Inorganic Compounds. EMEP/CCC-Report 2/2016. Kjeller: EMEP-CCC.
Hjellbrekke, A. G., and Fjæraa, A. M. (2012). Data Report 2010 Acidifying and Eutrophying Compounds and Particulate Matter. EMEP/CCC-Report 1/2012. Kjeller: EMEP-CCC.
Hjellbrekke, A. G., and Fjæraa, A. M. (2013). Data Report 2011 Acidifying and Eutrophying Compounds and Particulate Matter. EMEP/CCC-Report 2/2013. Kjeller: EMEP-CCC.
Karlsson, P. E., Pihl Karlsson, G., Hellsten, S., Akselsson, C., Ferm, M., and Hultberg, H. (2019). Total Deposition of Inorganic Nitrogen to Norway spruce Forests - Applying a Surrogate Surface Method Across a Deposition Gradient in Sweden. Atmos. Environ. 217, 116964. doi:10.1016/j.atmosenv.2019.116964
König, N., Cools, N., Derome, K., Kowalska, A., De Vos, B., Fürst, A., et al. (2013). “Data Quality in Laboratories,” in In Forest Monitoring: Methods for Terrestrial Investigations in Europe with an Overview of North America and Asia. Editors M. Ferretti, and R. Fischer (Oxford: Elsevier), 415–453. doi:10.1016/b978-0-08-098222-9.00022-4
Lorenz, M., and Fischer, R. (2013). “Pan-European Forest Monitoring,” in Forest Monitoring: Methods for Terrestrial Investigations in Europe with an Overview of North America and Asia. Editors M. Ferretti, and R. Fischer (Elsevier), 19–32. doi:10.1016/B978-0-08-098222-9.00002-9
Mayer, R., and Ulrich, B. (1977). Acidity of Precipitation as Influenced by the Filtering of Atmospheric sulphur and Nitrogen Compounds? its Role in the Element Balance and Effect on Soil. Water Air Soil Pollut. 7, 409–416. doi:10.1007/BF00284135
Metzger, S., Dentener, F., Pandis, S., and Lelieveld, J. (2002). Gas/Aerosol Partitioning: 1. A Computationally Efficient Model. J. Geophys. Res. 107, D16. doi:10.1029/2001JD001102
Pihl Karlsson, G., Akselsson, C., Hellsten, S., and Karlsson, P. E. (2011). Reduced European Emissions of S and N - Effects on Air Concentrations, Deposition and Soil Water Chemistry in Swedish Forests. Environ. Pollut. 159, 3571–3582. doi:10.1016/j.envpol.2011.08.007
R Core Team (2020). R: A Language and Environment for Statistical ## Computing. Vienna, Austria: R Foundation for Statistical Computing. Available at: https://www.R-project.org/.
Schaap, M., Wichink Kruit, R. J., Hendriks, C., Kranenburg, R., Segers, A., Builtjes, P., et al. (2015). Atmospheric Deposition to German Natural and Semi-Natural Ecosystems During 2009. Project No. (FKZ) 3712 63 240-1. Umweltbundesamt: Dessau-Roßlau.
Schwede, D. B., Simpson, D., Tan, J., Fu, J. S., Dentener, F., Du, E., et al. (2018). Spatial Variation of Modelled Total, Dry and Wet Nitrogen Deposition to Forests at Global Scale. Environ. Pollut. 243, 1287–1301. doi:10.1016/j.envpol.2018.09.084
Simpson, D., Benedictow, A., Berge, H., Bergström, R., Emberson, L. D., Fagerli, H., et al. (2012). The EMEP MSC-W Chemical Transport Model - Technical Description. Atmos. Chem. Phys. 12, 7825–7865. doi:10.5194/acp-12-7825-2012
Simpson, D., Bergström, R., Briolat, A., Imhof, H., Johansson, J., Priestley, M., et al. (2020). GenChem v1.0 - a Chemical Pre-Processing and Testing System for Atmospheric Modelling. Geosci. Model. Dev. 13, 6447–6465. doi:10.5194/gmd-13-6447-2020
Simpson, D., Bergström, R., Imhof, H., and Wind, P. (2017). “Updates to the EMEP/MSC-W Model, 2016–2017 Transboundary Particulate Matter, Photo-Oxidants, Acidifying and Eutrophying Components” in Transboundary Particulate Matter, Photo-Oxidants, Acidifying and Eutrophying Components. EMEP Status Report 1/2017. Oslo, Norway: The Norwegian Meteorological Institute, 15–36.
Simpson, D., Fagerli, H., Hellsten, S., Knulst, J. C., and Westling, O. (2006). Comparison of Modelled and Monitored Deposition Fluxes of Sulphur and Nitrogen to ICP-forest Sites in Europe. Biogeosciences. 3, 337–355. doi:10.5194/bg-3-337-2006
Solberg, S., Fagerli, H., and Tsyro, S. (2017). “EMEP MSC-W Model Runs Using the EMEP Emissions in Fine Resolution - Comparison to Observations” in Transboundary Particulate Matter, Photo-Oxidants, Acidifying and Eutrophying Components. Status Report 1/2017. Oslo, Norway: The Norwegian Meteorological Institute, 59–75.
Stadtler, S., Simpson, D., Schröder, S., Taraborrelli, D., Bott, A., and Schultz, M. (2018). Ozone Impacts of Gas-Aerosol Uptake in Global Chemistry Transport Models. Atmos. Chem. Phys. 18, 3147–3171. doi:10.5194/acp-18-3147-2018
Staelens, J., Houle, D., De Schrijver, A., Neirynck, J., and Verheyen, K. (2008). Calculating Dry Deposition and Canopy Exchange With the Canopy Budget Model: Review of Assumptions and Application to Two Deciduous Forests. Water Air Soil Pollut. 191, 149–169. doi:10.1007/s11270-008-9614-2
Talkner, U., Krämer, I., Hölscher, D., and Beese, F. O. (2010). Deposition and Canopy Exchange Processes in Central-German Beech Forests Differing in Tree Species Diversity. Plant Soil. 336, 405–420. doi:10.1007/s11104-010-0491-2
Theobald, M. R., Vivanco, M. G., Aas, W., Andersson, C., Ciarelli, G., Couvidat, F., et al. (2019). An Evaluation of European Nitrogen and Sulfur Wet Deposition and Their Trends Estimated by Six Chemistry Transport Models for the Period 1990-2010. Atmos. Chem. Phys. 19, 379–405. doi:10.5194/acp-19-379-2019
Tista, M., Wankmüller, R., Matthews, B., Mareckova, K., Fagerli, H., and Nyíri, Á. (2018). Emissions for 2016, in Transboundary Particulate Matter, Photo-Oxidants, Acidifying and Eutrophying Components. EMEP Status Report 1/2018. Oslo, Norway: NIVA, 41–64.
Tørseth, K., Aas, W., Breivik, K., Fjæraa, A. M., Fiebig, M., Hjellbrekke, A. G., et al. (2012). Introduction to the European Monitoring and Evaluation Programme (EMEP) and Observed Atmospheric Composition Change During 1972-2009. Atmos. Chem. Phys. 12, 5447–5481. doi:10.5194/acp-12-5447-2012
Tsyro, S., and Mortier, A. (2018). Model Calculations in fine Resolution for 2000-2016, in Transboundary Particulate Matter, Photo-Oxidants, Acidifying and Eutrophying Components 8. EMEP Status Report 1/201. Oslo, Norway: NIVA, 65–72.
Vieno, M., Heal, M. R., Twigg, M. M., MacKenzie, I. A., Braban, C. F., Lingard, J. J. N., et al. (2016). The UK Particulate Matter Air Pollution Episode of March-April 2014: More Than Saharan Dust. Environ. Res. Lett. 11, 044004. doi:10.1088/1748-9326/11/4/044004
Keywords: nitrogen, deposition, forest, Europe, sulfur, nitrate, sulfate, ammonium
Citation: Marchetto A, Simpson D, Aas W, Fagerli H, Hansen K, Pihl-Karlsson G, Karlsson PE, Rogora M, Sanders TGM, Schmitz A, Seidling W, Thimonier A, Tsyro S, de Vries W and Waldner P (2021) Good Agreement Between Modeled and Measured Sulfur and Nitrogen Deposition in Europe, in Spite of Marked Differences in Some Sites. Front. Environ. Sci. 9:734556. doi: 10.3389/fenvs.2021.734556
Received: 01 July 2021; Accepted: 01 September 2021;
Published: 20 September 2021.
Edited by:
Silvana Munzi, University of Lisbon, PortugalReviewed by:
Mark Richard Theobald, Medioambientales y Tecnológicas, SpainMaria Alexandra Oliveira, University of Lisbon, Portugal
Copyright © 2021 Marchetto, Simpson, Aas, Fagerli, Hansen, Pihl-Karlsson, Karlsson, Rogora, Sanders, Schmitz, Seidling, Thimonier, Tsyro, de Vries and Waldner. This is an open-access article distributed under the terms of the Creative Commons Attribution License (CC BY). The use, distribution or reproduction in other forums is permitted, provided the original author(s) and the copyright owner(s) are credited and that the original publication in this journal is cited, in accordance with accepted academic practice. No use, distribution or reproduction is permitted which does not comply with these terms.
*Correspondence: Aldo Marchetto, YWxkby5tYXJjaGV0dG9AY25yLml0