 Melinda Martinez
 Marcelo Ardón
 Mary Jane Carmichael2†
- 1Department Forestry and Environmental Resources, North Carolina State University, Raleigh, NC, United States
- 2Departments of Biology and Environmental Studies, Hollins University, Roanoke, VA, United States
Wetlands are large sources of methane (CH4), therefore it is vital to understand the pathways, mechanisms, and sources to anticipate future positive feedbacks to climate change. Plant mediated transport of CH4 from sediment-borne gases is thought to be a major contributor in wetland ecosystems, though few studies have measured standing dead trees (snags). Snags are expected to become more common across the southeastern coast as marshes migrate into freshwater forested wetlands. In this study, our goal was to distinguish the main sources of CH4 being emitted from snags, that is, from soil or in situ origin. The δ2H and δ13C stable isotopic composition from various sources was sampled for source determination. We measured CH4 in various components: emissions from snag stem sides and the soil-atmosphere interface; and concentrations from snag trunk airspace at various heights from ground level (30, 60, and 120 cm), and soil porewater. Potential CH4 production and oxidation in tree cores from two heights (60 and 120 cm) was also measured to examine the potential for CH4 generation or oxidation in stems. We found that CH4 concentrations inside snags (∼10–200 ppm) were 2–50 times higher than atmospheric levels, and generally decreased with increasing stem height. The stable isotopes δ13C and δ2H showed an enrichment from porewater to soils and snag stems. δ13C enrichment of CH4 in snag stems suggests that CH4 is being oxidized as it moves through snags. The tree core vial incubations showed that very few cores produced small amounts of CH4 under anaerobic conditions (n = 5 out of 50), and very few cores oxidized CH4 under more aerobic conditions (n = 5 out of 50). It is possible that a small amount of CH4 is produced in-situ within the heartwood, but it is likely this depends on the density, porosity, and aeration of snags (degree of decay). Our results highlight that high concentrations of CH4 can persist within the heartwood of snags long after initial decay, and that CH4 emitted from snags is largely derived from deep wetland soils and oxidized during transport (via diffusion) throughout the stem of snags.
Introduction
Wetlands play a major role in the global carbon cycle, especially in methane (CH4) emissions due to the anaerobic conditions created from standing water and saturated soils (Reddy and DeLaune, 2008). CH4 is an important greenhouse gas because it has a sustained-flux global warming potential 45 times that of carbon dioxide (CO2), averaged over 100 years (Neubauer and Megonigal, 2015). CH4 accounts for about 30% of all long-lived greenhouse gases (GHGs) globally, with a mean residence time of 9 years (Whalen, 2005). Wetlands are the largest natural source of CH4, contributing as much as 20–30% of the global emissions (Reddy and DeLaune, 2008; Saunois et al., 2020). Freshwater wetlands tend to produce more CH4 than saline wetlands, because of the abundant sulfate (SO42−) found in seawater, which is a preferred electron acceptor and reduces methanogenesis (Reddy and DeLaune, 2008). In freshwater wetlands CH4 is produced mostly through the acetoclastic pathway, using acetate as the substrate (Conrad, 2005). Once CH4 is produced there are two relevant fates in wetland ecosystems: consumption by methanotrophs or flux to the atmosphere. The amount emitted to the atmosphere is ultimately a balance between CH4 production and oxidation as it is transported through the soil-water-plant continuum (Reddy and DeLaune, 2008).
CH4 pathways to the atmosphere include the soil-atmosphere interface, water-atmosphere interface, or plant-mediated transport to the atmosphere (Carmichael et al., 2014). Many studies have shown that both live and dead herbaceous vegetation contribute a significant amount of CH4 to the atmosphere (Covey and Megonigal, 2019), and more recent studies have focused on the role of woody vegetation as a CH4 pathway to the atmosphere (Carmichael et al., 2014; Barba et al., 2018; Martinez and Ardón, 2021). Studies from both upland and wetland ecosystems have shown tree stems to be sources of CH4 to the atmosphere (Covey and Megonigal, 2019; Vargas and Barba, 2019). While upland ecosystems are generally thought of as CH4 sinks, studies have shown CH4 emitted through tree stems can be sourced from within the tree due to wood decomposition, or from deep soil layers and transported through the plant continuum (Megonigal and Guenther, 2008; Covey et al., 2012). Tree stem emissions have been found to be about 42.7 Tg yr−1 from the wetland Amazon basin alone, demonstrating the importance of tree stem surfaces (Pangala et al., 2017). While we know more about the source and sink dynamics of soil CH4 production at broader scales, the biogeochemical pathways of production, oxidation, and pathways of tree stem CH4 emissions remains poorly understood (Barba et al., 2018).
Fewer studies have focused on CH4 emissions/pathways from standing dead trees (i.e., snags), which are becoming more common in freshwater forested wetlands across the southeastern United States (White and Kaplan, 2021). These areas with abundant snags are often called ghost forests and are striking features of climate change (Kirwan and Gedan, 2019). White and Kaplan (2021) estimate that 19,480 km2 of coastal forested wetlands have transitioned to other habitat types from 1986 to 2016, some of which were ghost forests at some point during the transition. Snags have the potential to transport soil produced CH4 through the root and plant tissue cells to the atmosphere, but CH4 emitted could also be produced internally due to decomposition (Carmichael and Smith, 2016; Carmichael et al., 2017). As the climate changes, ghost forests are projected to expand in area (Kirwan and Gedan, 2019), and therefore could emit a substantial amount of greenhouse gases to the local and regional carbon cycle (Martinez and Ardón, 2021). It is important to understand the emissions of CH4 from different pathways for better management in response to a changing climate (Barba et al., 2018).
Stable isotopes ratios (
Previously, we showed that snag stem CH4 fluxes were not as predictable as soil CH4 fluxes using environmental parameters such as water levels, salinity, and soil sulfate concentrations (Martinez and Ardón, 2021). The disconnect between soil and snag CH4 drivers was thought to be driven by oxidation taking place within snags. Although soil CH4 fluxes (5.9 ± 1.9 mg CH4 m−2 hr−1) were 20 times greater than snag CH4 fluxes (0.3 mg CH4 m−2 hr−1), snag fluxes should still be taken into account given the cumulative GHGs ghost forests stands can potentially contribute.
Our goal in this study was to identify the main sources and pathways of CH4 emitted from snags in ghost forests by quantifying CH4 fluxes and concentrations. Stable isotopes, and lab incubation experiments were combined to examine if the CH4 emitted through the snag stems was soil-derived or produced internally due to heartwood rot. We hypothesized that CH4 emitted from snag stems was produced in soils, and snags served as conduits to the atmosphere due to the intricate network of open cells within decaying stems. We expected that most of the CH4 in snags is formed by acetate cleavage (acetoclastic pathway as opposed to CO2 reduction), therefore we used stable isotope data to examine the degree of oxidation. Lastly, we hypothesized that little CH4 would be produced from snag tree cores under anaerobic conditions, and CH4 could be oxidized under higher CH4 concentrations and aerobic conditions.
Materials and Methods
Study Site
Our study took place during the growing season in June and July 2019 on the Albemarle Pamlico Peninsula (APP), in eastern North Carolina. We selected five areas: Palmetto-Peartree Preserve (PPP), Point Peter Rd within the Alligator River National Wildlife Refuge (PP), Swanquarter National Wildlife Refuge (SQ), Pocosin Lakes National Wildlife Refuge (PC), and Gull Rock State Game Lands (GR) (Martinez and Ardón, 2021). The coastal wetlands along the APP include non-riverine swamp forests, pocosins, and freshwater and brackish marshes. The APP has generally low salinity (one to seven parts per thousand) and is subject to frequent flooding from wind tides (Manda et al., 2014). More than 50% of the peninsula is within 1.5 m of mean sea level, making it highly vulnerable to sea level rise and saltwater intrusion (Moorhead and Brinson, 1995). The APP has been drained via extensive artificial canals and ditches to improve the agricultural value of the land (Manda et al., 2014), but these canals also allow saltwater to propagate further inland especially during storms, imperiling nearby vegetation communities (Bhattachan et al., 2019). Saltwater intrusion and increasing flooding events have increased the amount of forest die back in the region, creating extensive ghost forests (Smart et al., 2020).
Snag-Stem and Soil CH4 Emissions
Five snags were selected at each site (n = 25) based on stability (i.e., intact and not at risk of falling). There are different stages of decay for standing dead trees, which can be classified from 1 to 5, with stage 1 being intact and recently deceased while stage 5 being close to falling over (Odion et al., 2011). The snags selected for all sites, except PC, were all pine trees with most of the bark removed classified as stages ranging from 1 to 3. The snags selected at PC were a mixture of pine and cypress trees with most of the bark removed, also ranging from 1 to 3 stages of decay. Snag and soil CH4 concentrations were measured using clear semi-rigid chambers at various heights ranging from 60–70 cm from ground, depending on optimal sealing conditions (Figure 1). The snag-stem chambers were designed after Siegenthaler et al. (2016), which is a flexible type of chamber made from a clear, polycarbonate sheet. Soil chambers (30 cm diameter) were installed 1–2 m a way from snags. The soil chamber tops included a vent tube, internal fan (0.003 m3/s; Jameco Electronics, Belmont, California, United States), and three sampling ports, two hose barbed connectors for portable gas analyzer tubing (Input/Output air sample) and air-tight tubing (12 inches) with a three-way stopcock for extra gas samples. The soil chambers were inserted 10 cm into the soil and left to stabilize for at least 1 week before taking measurements.
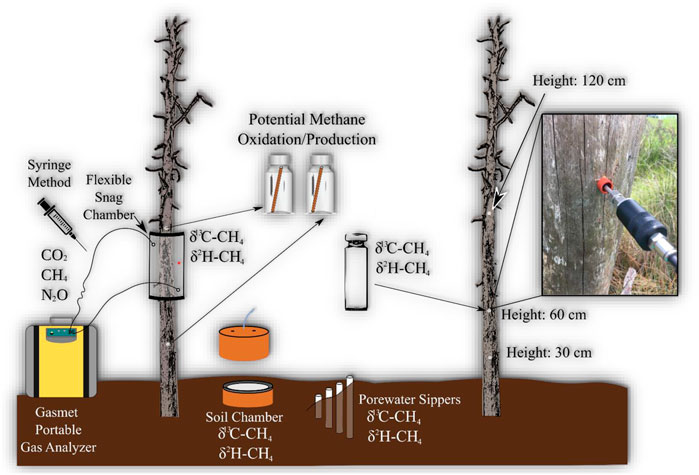
FIGURE 1. Conceptual diagram of monitoring setup for each site. Gas samples were taken from snag and soil greenhouse gas chambers, and water samples from porewater for dissolved CH4 concentrations. Red dot on tree chamber is rubber septum which is used when extracting samples with syringe. Snags were drilled at three heights to measure CH4 concentrations within heartwood of snag. Tree cores were also taken from two heights (60 and 120 cm) for lab incubation experiments to measure potential CH4 production and oxidation.
The CH4 in snag and soils chambers was measured using two different methods: Gasmet portable gas analyzer (Gasmet Technologies, Finland) and the syringe method (Figure 1). The Gasmet is capable of analyzing a variety of greenhouse gases, but this study is focused only on CH4. Chambers were attached for 10–20 min (10 min for snags and 20 for soils), and measuring gas concentrations every 20 s using the Gasmet, or 30–40 min measuring every 5 min using the syringe method. The syringe method was used at times when the Gasmet was not optimal due to either weather or battery failures. Gas samples using syringe method were stored in Exetainer vials (Labco–Lampeter, Wales, United Kingdom). Prior to field use, Exetainer vials were evacuated using a vacuum pump connected to a manifold and flushed repeatedly with ultra-pure N2 gas. Gas samples were stored in vials and run within a 6-week period, which has been shown to maintain sample concentrations (Sturm et al., 2015). CH4 gases were analyzed using an Agilent gas analyzer (7890 A GC system - Santa Clara, CA) equipped with a methanizer and Flame ionization Detector for CH4 analysis. Detailed descriptions of the region, site, and methods can be found in Martinez and Ardón (2021).
CH4 concentration inside snag heartwood were assessed following a similar protocol to Covey et al. (2012). A 1.27 cm diameter drill bit was used to drill to the center of the tree at three heights (30, 60, and 120 cm). After drilling, each hole was plugged using a rubber septum and pierced with a sampling wand connected to the Gasmet to sample for ∼3 min. The air immediately outside the drilled hole was also sampled for comparison and to allow for the higher gas concentration to flow out of the tubing.
Gas samples for stable isotope analysis were sampled once at each site in June 2019 for GR and PP and July 2019 for PC, SQ, and PPP from inside the snag (n = 25) and soil (n = 25) chambers after chamber incubation using a gas tight syringe. Both snag and soil chambers were modified to sample with a syringe either through a rubber septum (snag chambers) or tubing using a three-way stopcock (soil chambers). Heartwood gas samples were also collected for stable isotope analysis with a syringe through a rubber septum 60 cm from ground (n = 25).
Porewater CH4
Belowground porewater sippers were installed at 30 cm near three snags at each site. Porewater was analyzed to help provide insights into whether CH4 emitted by stems was produced in soils or groundwater (Barba et al., 2018). Porewater was drawn after snag and soil gas sample collections and measured for
Porewater samples collected for isotopes
Potential CH4 Incubations
Snag tree cores were taken (June and July 2019) to provide estimates of CH4 emissions by incubation to test the potential of wood to produce CH4 (n = 100; PMP and PMO). Tree cores (5 mm diameter × 10–30 cm length) included the bark (if present), sapwood, and heartwood. Heartwood rot/wet wood conditions provide a conducive habitat for microbial CH4 production, therefore potential CH4 production (PMP) from incubations could suggest tree decomposition as an important source of CH4 (Covey et al., 2012; Barba et al., 2018). Tree cores were taken at two heights (120 and 60 cm) from the five sites, to perform wood incubations to measure potential CH4 production (n = 50, 25 per each height). Cores were placed in 120 ml serum vials and flushed with N2 for 8–10 min. Gas samples were taken from the vial at 0, 12, 24, 48, and 72 h after incubating. A separate empty vial was flushed with N2 as a field blank to measure potential background concentrations. Snag tree cores from GR and PP were run in June 2019 measuring at time points 0, 12, 24, and 48 h, while snag tree cores from PPP, SQ, and PC sites were run in July 2019 measuring at time points 0, 24, 48, and 72 h. The 12 h time point for July incubation was deemed unnecessary, and we extended the incubation to 72 h to determine if a longer incubation was needed to measure change in CH4 concentration during treatments.
In addition to measuring potential CH4 produced under anaerobic conditions, snag cores from similar heights (120 and 60 cm from ground) were incubated under higher concentrations of CH4 to measure potential CH4 oxidation (PMO) under aerobic conditions (n = 50). Vials were flushed with a gas standard mixture of CO2, CH4, and N2O near ambient levels with a much higher CH4 concentration. Snag cores from GR and PP were incubated at a CH4 concentration of ∼45 ppm, while snag cores from PPP, SQ, and PC were incubated at a CH4 concentration of ∼120 ppm. The difference in CH4 concentrations was due to difficulties diluting Pure CH4 (99.999%). CH4 can potentially be oxidized by methanotrophs and/or nitrifying bacteria which have an affinity for CH4 (Chan and Parkin, 2001). Gas samples were taken at similar intervals as the potential CH4 production incubations. An empty vial flushed with the same gas standard mixture was measured as a field blank to assess potential gas leaks or air seepage inside the vial.
We calculated snag tree core CH4 fluxes, represented as ng g−1 hr−1, using the volume of the vial (minus the volume of the snag tree core) and the weight of the snag tree core as a substitute for area. Criteria were used to filter data using a minimum detectable concentration difference (MDCD) between the initial and final measurements. The MDCD in this study is based on the detection limits of the GC, which is 20% (or 0.2 ppm) for CH4, so |FinalCH4 Concentration–InitialCH4 Concentration| > 0.2 (meets MDCD criteria). Observations that did not meet the criteria were not used (marked as NA). The incubation fluxes were calculated using the HMR approach (HMR R package), which uses both linear and non-linear approaches (Pedersen et al., 2010). Only data with significant correlations (p < 0.1) were kept.
Statistics
Due to the lack of normality in the data, Kruskal-Wallis was used to test differences in stable isotopes (δ13C-CH4 and δ2H-CH4) among source types, and heartwood CH4 concentrations among sites, and between heights (30, 60, and 120 cm). Dunn’s multiple pairwise comparisons were then used for post-hoc analysis when Kruskal-Wallis showed significant differences, with a Bonferroni p-value adjustment (p < 0.05). Linear regression models were used to assess the relationships between stable isotopes and CH4 concentrations with all source types (snag chambers, soil chambers, heartwood, and porewater), and also between CH4 heartwood concentrations and stem height. CH4 concentration data was log transformed due to lack of normality. All statistical analyses were performed in R program (R Core Team, 2020).
Results
Salinity levels were the lowest at PPP (∼1 ppt) and highest at SQ (∼7 ppt), with PC, PP, and GR in between, increasing in salinity respectively (Table 1). Sulfate concentrations from porewater sippers followed similar patterns as salinity with the lowest concentration in PPP (2.39 mg/L) and highest in SQ (245 mg/L). Air temperature during the sampling period ranged from 27 to 34°C, while soil temperature ranged from 21 to 27°C (Table 1). Water levels during the sampling period were highest at PC (∼6 cm above ground) and lowest at PP (∼20 cm below ground).
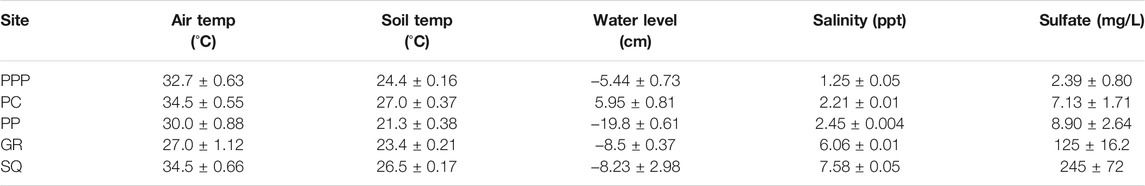
TABLE 1. Environmental conditions (mean ± SE) during sampling across all sites. GR and PP were sampled in June 2019 while PPP, PC and SQ were sampled in July 2019.Water level and salinity values were averaged from the 3 days leading up to sampling. Sulfate samples were taken from porewater sippers.
Heartwood CH4
Heartwood CH4 concentrations differed among sites and between heights (p < 0.01, Figure 2). Concentrations from PC (mean ± SE: 904 ± 415 ppm) were an order of magnitude higher than all other sites, which were on average 13 ppm (p < 0.01, Figure 2). For all sites, CH4 concentrations decreased with increasing height, with measurements from 30 cm being 2–4 times higher than measurements from 120 cm (p = 0.01). The linear regression model for CH4 concentration (log transformed) by height for all sites combined (Eq. 1) was significant (p < 0.01) although explained a small amount of variance (r2=0.04).
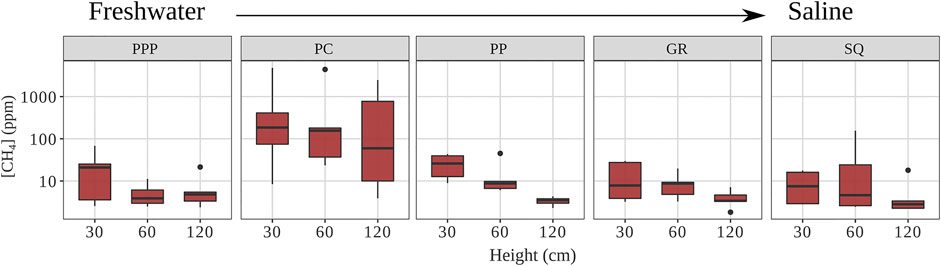
FIGURE 2. Heartwood CH4 concentrations for each site (from fresh to saline) and height (PPP—Palmetto Peartree, PC—Pocosin Lakes, PP—Point Peter, GR—Gull Rock, and SQ—Swanquarter). Solid line represents median, whiskers represent 5th and 95th percentiles, and dots are outliers (Note: y-axis is log scaled).
Stable Isotopes
The δ13C-CH4 value of CH4 ranged from −74 to −39‰, while δ2H-CH4 ranged from -327 to -34‰. Both δ13C-CH4 and δ2H-CH4 stable isotopic values became more enriched (more positive) from porewater < heartwood < soil chamber < snag chamber (Figures 3, 4). Porewater δ13C-CH4 (mean: −60 ± 1.7‰) and δ2H-CH4 (−327 ± 4.8‰) were more depleted than soil chamber, heartwood, and snag chamber values (p < 0.1) (Figures 3, 4). Soil chamber δ13C-CH4 values (−48 ± 1.5‰) were not significantly different from snag chamber (−47.7 ± 0.9‰; p = 1.0) or heartwood values (-52.2 ± 1.5‰; p = 0.13), but snag chamber values were more enriched than heartwood (p = 0.06). Similarly, soil chamber δ2H-CH4 values (−168 ± 14‰) were also within the range of snag chambers (−132 ± 12‰; p = 0.70), and heartwood (−209 ± 14‰; p = 0.53) values, but heartwood values were more depleted than snag chamber values (p = 0.006). Soil chamber δ13C-CH4 ranged from −73 to −39‰ while δ2H-CH4 ranged from -304 to -34‰. Heartwood δ13C-CH4 ranged from −73 to −44‰, while δ2H-CH4 ranged from −327 to −105‰. Overall, there was enrichment in isotopic signature in both δ13C and δ2H for all source types with decreasing CH4 concentrations across all sites (Figures 3, 4), except for δ13C from SQ.
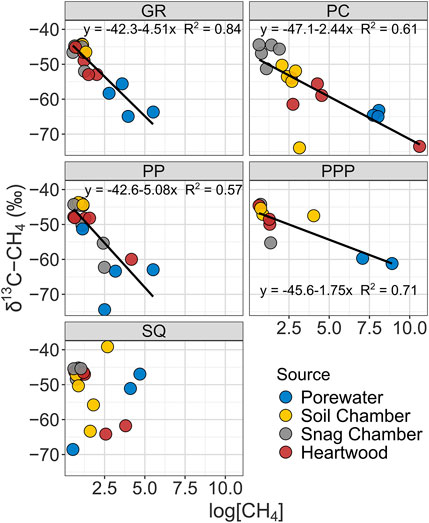
FIGURE 3. Linear regressions showing relationship between δ13C-CH4 stable isotopic values with CH4 concentrations from various sources by study sites. Note all CH4 concentrations were log transformed.
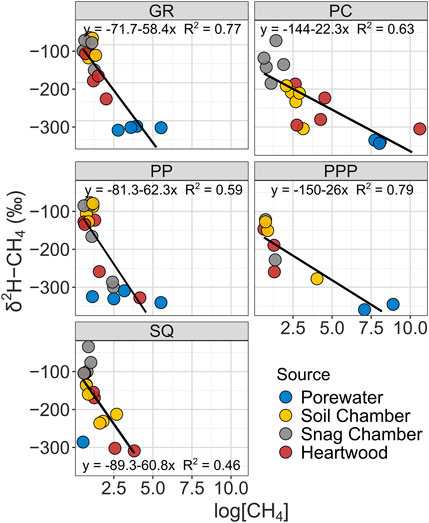
FIGURE 4. Linear regressions showing relationship between δ2H-CH4 stable isotopic values with CH4 concentrations from various sources by study sites. Note all CH4 concentrations were log transformed.
Potential CH4 Incubations
CH4 concentrations in snag tree core incubations changed very little over time (Figure 5). The overall number of snag tree incubation cores that had a measurable flux was 10 out of 100 cores taken. From the measurable fluxes, 5 were from the potential CH4 oxidation (PMO) treatment, while the other five were from the potential CH4 production (PMP) treatment (Figure 5). The highest CH4 flux within the PMP treatment was 2.12 ng g−1 hr−1 for cores 60 cm from ground, while the smallest increase was 0.35 ng g−1 hr−1 for cores 120 cm from ground. One core from 120 cm height produced a small amount of CH4 under PMO conditions, 0.5 ng g−1 hr−1. The highest oxidized CH4 within the PMO treatment was -2.5 ng g−1 hr−1 from 120 cm height core. The sample size was too low to perform any statistical analysis on the incubation flux calculations.
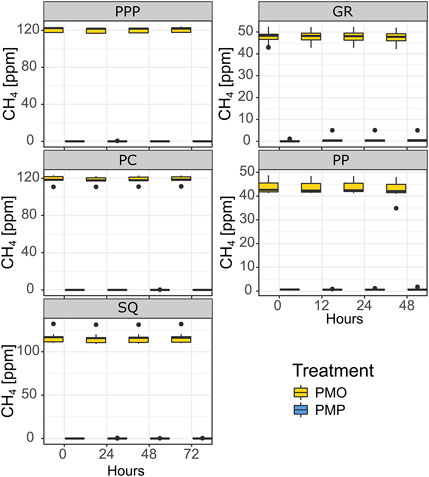
FIGURE 5. Snag tree core (both heights combined) CH4 concentrations during incubation experiments. Potential Methane Oxidation—PMO; Potential Methane Production—PMP. GR and PP were incubated in June while PPP, PC, and SQ were incubated in July. Solid line represents median, whiskers represent 5th and 95th percentiles.
Discussion
Our main goal was to determine the main source of CH4 found and emitted from snags, and predicted that it was produced in the soil and transported up the stem. We found three lines of evidence to support this hypothesis: 1) there was a decrease in CH4 concentrations with increasing stem height, 2) the isotopic composition of CH4 within snags was more enriched in snags relative to porewater, and 3) very little CH4 was produced or consumed when tree cores were incubated under anaerobic and aerobic conditions, respectively. As expected, most of the CH4 from snag stems, soil, and porewater was produced through the acetoclastic pathway based on the isotopic signature (δ13C: −45 to −60‰). Our results show that high concentrations of CH4 can persist within the heartwood of snags long after initial decay (stage 1) (Odion et al., 2011), and undergo oxidation before being emitted through the stem. The stable isotopes showed enrichment of both δ13C-CH4 and δ2H-CH4 from porewater, to heartwood, to snag chamber indicating that CH4 was being oxidized throughout this pathway. Although it is important to note that we did not sample water from the various locations, so while the δ2H-CH4 pattern is consistent with the δ13C-CH4 suggesting oxidation, we cannot rule out other water sources. The tree core vial incubations indicated that small amounts of CH4 can be produced under anaerobic conditions, about 2.12 ng g−1 hr−1, but also oxidized under higher CH4 concentrations (−2.5 ng g−1 hr−1). Based on these results, the CH4 emitted from snags is largely derived from the soil, and progressively oxidized as it passes throughout the stem. It is possible that a small amount of CH4 is produced in situ within the heartwood, but it is likely this depends on the density, porosity, and aeration status of snags (degree of decay and water content). A recent study in forested wetlands showed that gas diffusion barriers may be what ultimately determines the magnitude of stem CH4 emissions, which in the case of snags is porosity from decay and wood moisture content (Norwood et al., 2021). Overall, our results are consistent with the hypothesis that CH4 is primarily produced in soils, and is oxidized as it moves along the soil-stem-atmosphere pathway.
Heartwood CH4
CH4 concentrations in heartwood varied across the sites. The CH4 concentrations at PC were higher (904 ± 415 ppm) because there was standing water year-round, unlike all other sites (Figure 2; Table 1). When drilling into the heartwood at PC, some snags had a small stream of dripping water from within the tree (personal observation). The high moisture (and likely low oxygen levels) within the snags were conducive to CH4 production, which would explain why their concentrations were so much higher than all other sites. The mean heartwood CH4 concentration for the other sites (∼13 ppm) were below those found in snags from a similar region within the APP (100 ppm) (Carmichael et al., 2017). The difference between snags from the Carmichael et al. (2017) study and ours could be due to site differences similar to PC within our own study. The snags from Carmichael et al. (2017) were in standing water year-round.
There was a gradual decrease in CH4 concentration with increasing stem height (Figure 2), which has been found in other studies when measuring heartwood CH4 concentrations in live and dead trees (Covey et al., 2016; Carmichael et al., 2017), but this decrease also affects tree stem CH4 fluxes (Pangala et al., 2017; Jeffrey et al., 2019). The decrease in heartwood CH4 is likely due to distance from source (CH4 originating from within soils) and increasing oxidation with increasing stem height, which is also why tree-stem CH4 flux would be affected (Pangala et al., 2017; Jeffrey et al., 2019). Using a linear regression model, we calculated that CH4 concentrations inside the heartwood would decrease to 0 near 3.34 m (Eq. 1). Snags across the study sites ranged in height from 3 to 15 m. Our results suggest that snags can be important areas for CH4 oxidation. It is important to note that measurements were taken during a relatively warm time of year (Table 1), so it is possible that during time periods when the air is cooler, there might be less CH4 oxidation in the snags (King and Adamsen, 1992).
Stable Isotopes
Stable isotope data from all sites had similar patterns (enrichment from porewater < heartwood < soil chamber < snag chamber) with the exception of δ13C from SQ (Figure 3). As we predicted most of the CH4 produced from each source: snag chamber, heartwood, soil chamber, and porewater, was generated through the acetoclastic pathway which ranges from δ13C ∼ −65 to −50‰, and δ2H ∼ −400 to −250%, although a few samples (n = 4) were less than δ13C −65‰ from porewater, soil, and heartwood samples. One sample from heartwood in PC had really high CH4 concentrations (∼40,000 ppm) and a very depleted
Both
Stable isotopes from heartwood and soil chambers were more similar to each other and had wider ranges than snag chambers (Figures 3, 4). Heartwood δ13C and δ2H were on average similar to the mean porewater δ13C and δ2H, indicating that the degree of oxidation was less than the pathway from porewater to soil chamber, although there was a wide range for both δ13C and δ2H (Figures 3, 4). CH4 oxidation occurred more in samples from snag chambers and were closest to ambient air stable isotopes (−46‰ and −114‰, δ13C and δ2H respectively), providing further evidence that is consistent with CH4 continuing to be oxidized as it moves through the snags (Figures 3, 4). A previous study also showed δ13C-CH4 enrichment with increasing stem height in a flooded forested ecosystem, suggesting oxidation during tree stem transport (Jeffrey et al., 2021). This same study also found methane oxidizing bacteria (primarily Methylomonas) to be abundant within bark representing an important sink (Jeffrey et al., 2021). We have collected evidence of methanotrophs within snags in GR at ∼60 cm from ground, although the abundance is not yet known (unpublished data; Carmichael et al. In Prep). The degree of oxidation in our study likely depends on the stage of decay of the snags. Later stages of decay (stages 4–5) likely having more porous stems (lower density) therefore increasing oxidation, whereas earlier stages of decay (stages 1–3) may continue emitting CH4 due to moist tree stems which are more advantageous to methanogens, similar to the snags measured in this study.
The overall positive correlation between δ2H and δ13C of CH4 in freshwater wetlands has also been shown in other studies (Sugimoto and Wada, 1995; Sugimoto and Fujita, 2006). Isotopic fractionation, in both δ13C and δ2H, has been shown to decrease with decreasing CH4 concentrations, which is what we observed in all sites, except SQ (Figures 3, 4) (Riveros-Iregui & King, 2008). It is possible that the higher salinities and thus higher SO42- content in the sediments in SQ inhibited methanogenesis because SO42- is a preferential electron acceptor in saturated sediments (Weston et al., 2006). If there is less CH4 (substrate) in the sediment, then there will be less methanotrophy and less enrichment in δ13C signal (Edmonds et al., 2009).
Potential CH4 Incubations
Tree cores were incubated under two different simulated conditions to further investigate potential production and/or oxidation in snags internally (heartwood and sapwood). Very few (n = 10) cores exhibited a measurable difference in CH4 from the beginning to the end of the incubation (Figure 5). This suggests that any amount of CH4 that is present in the heartwood is largely soil derived. Under the PMP treatment, the highest measurable CH4 flux occurred in cores taken from the base of the tree, while in the PMO treatment the highest measurable CH4 oxidation flux occurred in cores from 120 cm from base of the tree. It is possible that there are more abundant methanogen communities closer to the base where conditions are more conductive for methanogenesis (i.e., higher moisture content, thus lower O2 availability), but not as much as deep soil layers where majority of the CH4 is derived. The fact that there was very little change in CH4 concentrations throughout both treatments at both heights (PMP and PMO) further demonstrates that the majority of the CH4 emitted from snag stems is largely soil derived (Figure 5). A study looking at CH4 fluxes from stems in the Amazon basin, similarly found that very few of their tree core incubations produced CH4, and interpreted those results as support for soil as the source of CH4 (Pangala et al., 2017).
Conclusion
Analysis of greenhouse gas (GHG) fluxes from tree stems and snags is still an emerging field, but studies have shown that this pathway, previously unaccounted for in global budgets, is an important source to consider. Although fewer studies have measured the potential of standing dead trees (i.e. snags) to emit GHGs (Carmichael et al., 2017; Jeffrey et al., 2019; Martinez and Ardón, 2021), they have the potential to transport soil produced CH4 through the plant tissue cells to the atmosphere, but CH4 emitted could also be produced internally due to decomposition. Across the southeast coastline, many freshwater forested wetlands are rapidly transitioning to marshes due to increasing flooding and saltwater intrusion, leaving behind many snags, collectively referred to as ghost forests. CH4 dynamics in ghost forests may be more complicated than previously thought due to the various sources and sinks. Our results show that: 1) the majority of CH4 in soils of these ghost forests is formed through the acetoclastic pathway; 2) the majority of CH4 being emitted from snags was likely produced deep in the soil, and 3) snags are important locations of CH4 oxidation.
Permission to Reuse and Copyright
We give permission for figures, tables, and images to be published under a Creative Commons CC-BY licence.
Data Availability Statement
The datasets analyzed for this study can be found in Dryad Digital Repository https://datadryad.org/stash/dataset/doi:10.5061/dryad.xksn02vhg.
Author Contributions
MM and MA conceived the study and research methods. Material preparation, data collection and data analysis were performed by MM. The first draft of the manuscript was written by MM with feedback and comments from MA and MC. All authors reviewed, edited, and approved the manuscript to its final form.
Funding
This work was funded by the NSF (DEB1713502) as well as North Carolina Sea Grant/SpaceGrant Fellowship (2019).
Conflict of Interest
The authors declare that the research was conducted in the absence of any commercial or financial relationships that could be construed as a potential conflict of interest.
Publisher’s Note
All claims expressed in this article are solely those of the authors and do not necessarily represent those of their affiliated organizations, or those of the publisher, the editors and the reviewers. Any product that may be evaluated in this article, or claim that may be made by its manufacturer, is not guaranteed or endorsed by the publisher.
Acknowledgments
We thank Destinee Parson, Colin Dail, Cam Phipps, Margaret Maynardie, Kelsey Morton, and Steve Anderson for field and lab assistance. We are also thankful for the Ardón lab for edits on this manuscript.
References
Barba, J., Bradford, M. A., Brewer, P. E., Bruhn, D., Covey, K., Haren, J., et al. (2018). Methane Emissions from Tree Stems: a New Frontier in the Global Carbon Cycle. New Phytol. 222, 18–28. doi:10.1111/nph.15582
Bhattachan, A., Jurjonas, M. D., Morris, P. R., Taillie, P. J., Smart, L. S., Emanuel, R. E., et al. (2019). Linking Residential Saltwater Intrusion Risk Perceptions to Physical Exposure of Climate Change Impacts in Rural Coastal Communities of North Carolina. Nat. Hazards 97, 1277–1295. doi:10.1007/s11069-019-03706-0
Bréas, O., Guillou, C., Reniero, F., and Wada, E. (2001). The Global Methane Cycle: Isotopes and Mixing Ratios, Sources and Sinks. Isotopes Environ. Health Stud. 37, 257–379. doi:10.1080/10256010108033302
Carmichael, M. J., Bernhardt, E. S., Bräuer, S. L., and Smith, W. K. (2014). The Role of Vegetation in Methane Flux to the Atmosphere: Should Vegetation Be Included as a Distinct Category in the Global Methane Budget? Biogeochemistry 119, 1–24. doi:10.1007/s10533-014-9974-1
Carmichael, M. J., Helton, A. M., White, J. C., and Smith, W. K. (2017). Standing Dead Trees Are a Conduit for the Atmospheric Flux of CH4 and CO2 from Wetlands. Wetlands 38, 133–143. doi:10.1007/s13157-017-0963-8
Carmichael, M. J., and Smith, W. K. (2016). Standing Dead Trees: a Conduit for the Atmospheric Flux of Greenhouse Gases from Wetlands? Wetlands 36, 1183–1188. doi:10.1007/s13157-016-0845-5
Chan, A. S. K., and Parkin, T. B. (2001). Methane Oxidation and Production Activity in Soils from Natural and Agricultural Ecosystems. J. Environ. Qual. 30, 1896–1903. doi:10.2134/jeq2001.1896
Conrad, R. (2005). Quantification of Methanogenic Pathways Using Stable Carbon Isotopic Signatures: a Review and a Proposal. Org. Geochem. 36, 739–752. doi:10.1016/j.orggeochem.2004.09.006
Covey, K. R., de Mesquita, C. P. B., Oberle, B., Maynard, D. S., Bettigole, C., Crowther, T. W., et al. (2016). Greenhouse Trace Gases in deadwood. Biogeochemistry 130, 215–226. doi:10.1007/s10533-016-0253-1
Covey, K. R., and Megonigal, J. P. (2019). Methane Production and Emissions in Trees and Forests. New Phytol. 222, 35–51. doi:10.1111/nph.15624
Covey, K. R., Wood, S. A., Warren, R. J., Lee, X., and Bradford, M. A. (2012). Elevated Methane Concentrations in Trees of an upland forest. Geophys. Res. Lett. 39, L15705. doi:10.1029/2012GL052361
Edmonds, J. W., Weston, N. B., Joye, S. B., Mou, X., and Moran, M. A. (2009). Microbial Community Response to Seawater Amendment in Low-Salinity Tidal Sediments. Microb. Ecol. 58, 558–568. doi:10.1007/s00248-009-9556-2
Helton, A. M., Bernhardt, E. S., and Fedders, A. (2014). Biogeochemical Regime Shifts in Coastal Landscapes: the Contrasting Effects of Saltwater Incursion and Agricultural Pollution on Greenhouse Gas Emissions from a Freshwater Wetland. Biogeochemistry 120, 133–147. doi:10.1007/s10533-014-9986-x
Hornibrook, E. R. C., Longstaffe, F. J., and Fyfe, W. S. (2000). Evolution of Stable Carbon Isotope Compositions for Methane and Carbon Dioxide in Freshwater Wetlands and Other Anaerobic Environments. Geochimica et Cosmochimica Acta 64, 1013–1027. doi:10.1016/S0016-7037(99)00321-X
Hornibrook, E. R. C., Longstaffe, F. J., and Fyfe, W. S. (1997). Spatial Distribution of Microbial Methane Production Pathways in Temperate Zone Wetland Soils: Stable Carbon and Hydrogen Isotope Evidence. Geochimica et Cosmochimica Acta 61, 745–753. doi:10.1016/S0016-7037(96)00368-7
Jeffrey, L. C., Maher, D. T., Tait, D. R., Reading, M. J., Chiri, E., Greening, C., et al. (2021). Isotopic Evidence for Axial Tree Stem Methane Oxidation within Subtropical lowland Forests. New Phytol. 230, 2200–2212. doi:10.1111/nph.17343
Jeffrey, L. C., Reithmaier, G., Sippo, J. Z., Johnston, S. G., Tait, D. R., Harada, Y., et al. (2019). Are Methane Emissions from Mangrove Stems a Cryptic Carbon Loss Pathway? Insights from a Catastrophic forest Mortality. New Phytol. 224, 146–154. doi:10.1111/nph.15995
King, G. M., and Adamsen, A. P. S. (1992). Effects of Temperature on Methane Consumption in a Forest Soil and in Pure Cultures of the Methanotroph Methylomonas Rubra. Appl. Environ. Microbiol. 58, 2758–2763. doi:10.1128/aem.58.9.2758-2763.1992
Kirwan, M. L., and Gedan, K. B. (2019). Sea-level Driven Land Conversion and the Formation of Ghost Forests. Nat. Clim. Chang. 9, 450–457. doi:10.1038/s41558-019-0488-7
Manda, A. K., Giuliano, A. S., and Allen, T. R. (2014). Influence of Artificial Channels on the Source and Extent of saline Water Intrusion in the Wind Tide Dominated Wetlands of the Southern Albemarle Estuarine System (USA). Environ. Earth Sci. 71, 4409–4419. doi:10.1007/s12665-013-2834-9
Martinez, M., and Ardón, M. (2021). Drivers of Greenhouse Gas Emissions from Standing Dead Trees in Ghost Forests. Biogeochemistry 154, 471–488. doi:10.1007/s10533-021-00797-5
Megonigal, J. P., and Guenther, A. B. (2008). Methane Emissions from upland forest Soils and Vegetation. Tree Physiol. 28, 491–498. doi:10.1093/treephys/28.4.491
Moorhead, K. K., and Brinson, M. M. (1995). Response of Wetlands to Rising Sea Level in the Lower Coastal Plain of North Carolina. Ecol. Appl. 5, 261–271. doi:10.2307/1942068
Neubauer, S. C., and Megonigal, J. P. (2015). Moving beyond Global Warming Potentials to Quantify the Climatic Role of Ecosystems. Ecosystems 18, 1000–1013. doi:10.1007/s10021-015-9879-4
Norwood, M. J., Ward, N. D., McDowell, N. G., Myers‐Pigg, A. N., Bond‐Lamberty, B., Indivero, J., et al. (2021). Coastal Forest Seawater Exposure Increases Stem Methane Concentration. J. Geophys. Res. Biogeosci 126. doi:10.1029/2020JG005915
Odion, D. C., Sarr, D. A., Mohren, S., and Smith, S. (2011). Monitoring Vegetation Composition, Structure and Function in the parks of the Klamath Network Parks. Fort Collins, Colorado: National Park Service.
Pangala, S. R., Enrich-Prast, A., Basso, L. S., Peixoto, R. B., Bastviken, D., Hornibrook, E. R. C., et al. (2017). Large Emissions from Floodplain Trees Close the Amazon Methane Budget. Nature 552, 230–234. doi:10.1038/nature24639
Pedersen, A. R., Petersen, S. O., and Schelde, K. (2010). A Comprehensive Approach to Soil-Atmosphere Trace-Gas Flux Estimation with Static chambers. Eur. J. Soil Sci. 61, 888–902. doi:10.1111/j.1365-2389.2010.01291.x
R Core Team (2020). R: A Language and Environment for Statistical Computing. Vienna, Austria. Available at: http://www.R-project.org/.
Reddy, K. R., and DeLaune, R. D. (2008). Biogeochemistry of Wetlands Science and Applications. Boca Raton, FL: CRC Press.
R. H. Michener, and K. Lajtha (Editors) (2007). Stable Isotopes in Ecology and Environmental Science. 2nd ed. (Malden, MA: Blackwell Pub).
Riveros-Iregui, D. A., and King, J. Y. (2008). Isotopic Evidence of Methane Oxidation across the Surface Water-Ground Water Interface. Wetlands 28, 928–937. doi:10.1672/07-191.1
Sanci, R., and Panarello, H. O. (2015). Carbon and Hydrogen Isotopes as Tracers of Methane Dynamic in Wetlands. Ijg 06, 720–728. doi:10.4236/ijg.2015.67058
Saunois, M., Stavert, A. R., Poulter, B., Bousquet, P., Canadell, J. G., Jackson, R. B., et al. (2020). The Global Methane Budget 2000–2017. Earth Syst. Sci. Data 12, 1561–1623. doi:10.5194/essd-12-1561-2020
Siegenthaler, A., Welch, B., Pangala, S. R., Peacock, M., and Gauci, V. (2016). Technical Note: Semi-rigid chambers for Methane Gas Flux Measurements on Tree Stems. Biogeosciences 13, 1197–1207. doi:10.5194/bg-13-1197-2016
Smart, L. S., Taillie, P. J., Poulter, B., Vukomanovic, J., Singh, K. K., Swenson, J. J., et al. (2020). Aboveground Carbon Loss Associated with the Spread of Ghost Forests as Sea Levels Rise. Environ. Res. Lett. 15, 104028. doi:10.1088/1748-9326/aba136
Sturm, K., Keller-Lehmann, B., Werner, U., Raj Sharma, K., Grinham, A. R., and Yuan, Z. (2015). Sampling Considerations and Assessment of Exetainer Usage for Measuring Dissolved and Gaseous Methane and Nitrous Oxide in Aquatic Systems. Limnol. Oceanogr. Methods 13, 375–390. doi:10.1002/lom3.10031
Sugimoto, A., and Fujita, N. (2006). Hydrogen Concentration and Stable Isotopic Composition of Methane in Bubble Gas Observed in a Natural Wetland. Biogeochemistry 81, 33–44. doi:10.1007/s10533-006-9028-4
Sugimoto, A., and Wada, E. (1995). Hydrogen Isotopic Composition of Bacterial Methane: CO2/Hz Reduction and Acetate Fermentation. Geochimica et Cosmochimica Acta 59, 1329–1337. doi:10.1016/0016-7037(95)00047-4
Vargas, R., and Barba, J. (2019). Greenhouse Gas Fluxes from Tree Stems. Trends Plant Sci. 24, 296–299. doi:10.1016/j.tplants.2019.02.005
Weston, N. B., Dixon, R. E., and Joye, S. B. (2006). Ramifications of Increased Salinity in Tidal Freshwater Sediments: Geochemistry and Microbial Pathways of Organic Matter Mineralization. J. Geophys. Res. 111, G01009. doi:10.1029/2005JG000071
Whalen, S. C. (2005). Biogeochemistry of Methane Exchange between Natural Wetlands and the Atmosphere. ENVIRON. ENG. SCI. 22, 22. doi:10.1089/ees.2005.22.73
Keywords: methane (CH4), oxidation, ghost forests, freshwater, wetlands
Citation: Martinez M, Ardón M and Carmichael MJ (2022) Identifying Sources and Oxidation of Methane in Standing Dead Trees in Freshwater Forested Wetlands. Front. Environ. Sci. 9:737379. doi: 10.3389/fenvs.2021.737379
Received: 06 July 2021; Accepted: 15 December 2021;
Published: 01 February 2022.
Edited by:
Hans-Peter Grossart, University of Potsdam, GermanyReviewed by:
Yves T. Prairie, Université du Québec à Montréal, CanadaKaren Leah Prestegaard, University of Maryland, United States
Copyright © 2022 Martinez, Ardón and Carmichael. This is an open-access article distributed under the terms of the Creative Commons Attribution License (CC BY). The use, distribution or reproduction in other forums is permitted, provided the original author(s) and the copyright owner(s) are credited and that the original publication in this journal is cited, in accordance with accepted academic practice. No use, distribution or reproduction is permitted which does not comply with these terms.
*Correspondence: Melinda Martinez, bW1hcnRpMTNAbmNzdS5lZHU=
†ORCID: Melinda Martinez, orcid.org/0000-0001-6652-9220; Marcelo Ardón, orcid.org/0000-0001-7275-2672; Mary Jane Carmichael, orcid.org/0000-0002-3454-6971