 Zouxia Long
 Wenling Wang1†
- 1Third Institute of Oceanography, Ministry of Natural Resources, Xiamen, China
- 2Zhejiang Institute of Geological Survey, Hangzhou, China
- 3Technology Innovation Center for Ecological Evaluation and Remediation of Agricultural Land in Plain Area, Ministry of Natural Resources, Hangzhou, China
Plastic-related industrial discharge is suspected as a significant source of microplastics (MPs) in the influent of wastewater treatment plants (WWTPs). However, little is known about the characteristics of MPs in industrial wastewater. Taking the Haicang WWTP in Xiamen, China, as an example, this study compared MPs in industrial wastewater with the domestic one in terms of abundance, particle size, polymer type, shape and color. Wentworth modulus, grain size parameters and principal component analysis (PCA) were performed to describe the MP difference between those two. It was found that the abundance of MPs in industrial wastewater was more than twice that in domestic wastewater, and the flux of MPs discharged into the aquatic environment through industrial wastewater was about 3.2 times that of domestic wastewater. The main shapes of MPs in industrial wastewater and domestic wastewater were fiber and granule, respectively. The proportion of polyester (PES) and polyethylene terephthalate (PET) in industrial wastewater was higher than that in domestic wastewater, related to the type of factories served by the WWTP. Compared with domestic wastewater, the rough surface of MPs in industrial wastewater was more complex and diverse, which might have a high capability of adsorbing other pollutants, thereby causing more significant harm to the environment. Our results supported that industrial sources of MPs are the priority areas in environmental management, and immediate action is taken to prevent industrial-sources MPs from entering the environment.
Research Highlights
• Wentworth modulus and principal component analysis were performed to describe the Heterogeneity of MPs between industrial and domestic sources.
• MP characteristics of industrial wastewater, including high loading, small-size and rough surfaces, are different from domestic wastewater.
• Industrial wastewater is a targeted intervention point at the source mitigation of MPs.
• The moisture content of sludge is a crucial factor when analyzing the MP balance in WWTPs.
Introduction
Microplastic (MP) pollution is caused by the surrounding industrial and residential activities (Nizzetto et al., 2016; Deng et al., 2020). It is generally believed that there is a positive correlation between MP pollution in the aquatic environment and the degree of industrialization (Yonkos et al., 2014; Townsend et al., 2019). Available field survey (Li et al., 2018; Liu F. et al., 2019; Liu et al., 2020; Wu et al., 2020) and model study (Piehl et al., 2021) have confirmed that MP emissions from industrial areas are higher than those from residential areas, business quarters, etc. Industrial waste discharges are found to be one of the main contributors to the MP pollution in the aquatic environment, such as rivers (Lechner et al., 2014; Yonkos et al., 2014; Lechner and Ramler, 2015; Woodward et al., 2021), lakes (Zbyszewski and Corcoran, 2011), and oceans (Franco et al., 2020; Su et al., 2020). MP pollution from industrial wastewater is considered higher than that of residential wastewater (Zbyszewski and Corcoran, 2011; Townsend et al., 2019; Chen et al., 2020; Su et al., 2020). However, there is a lack of knowledge of industrial wastewater in overall MP emissions (Bitter and Lackner, 2020). Literature on the contribution of industrial sources to the MP pollution in municipal wastewater is scarce (Lechner et al., 2014; Franco et al., 2020; Wang et al., 2020; Franco et al., 2021). Identifying and regulating the sources of MPs become the focus of the environmental MP research (Lechner and Ramler, 2015), especially in the industrial zones (Liu et al., 2021). It is necessary to gain insight into the importance of various MP sources and pathways in the municipal sewer systems to adopt effective management strategies against MP pollution (Helm, 2017; Hou et al., 2021; Piehl et al., 2021).
Wastewater treatment plants (WWTPs) are considered to be one of the largest sinks of industrial and residential MP discharge (Ruan et al., 2019; Hou et al., 2021). At the same time, it is believed to be one of the primary point sources of MPs entry into the aquatic environments (Kazour et al., 2019; Lv et al., 2019; Schmidt et al., 2020) due to the large volume of effluents generated every day (Conley et al., 2019; Bretas Alvim et al., 2020) and the current immature treatment technologies (Rodríguez-Narvaez et al., 2021). The concentration, morphology, and chemical composition of MPs in the influent of WWTPs may depend on many factors (Mason et al., 2016), yet the primary one of which is the source of MPs (Carr et al., 2016; Yuan et al., 2020; Rodríguez-Narvaez et al., 2021). Sources of MPs to WWTPs are directly linked to sewage systems and wastewater origin (Barchiesi et al., 2021). In urban areas, combined sewer systems are common, in which domestic and industrial wastewater are jointly transported to WWTPs for treatment (Baresel and Olshammar, 2019; Schernewski et al., 2020; Rasmussen et al., 2021). It is an international practice to use WWTPs to collect and treat various types of industrial and domestic wastewater in metropolises (Qiu et al., 2010; Mahon et al., 2017; Ngo et al., 2019; Funck et al., 2021; Takdastan et al., 2021; Zhang et al., 2021). Most industrial wastewaters are treated in WWTPs or pre-treated in factories before being discharged (Nizzetto et al., 2016; Wang et al., 2020), but some still are released directly to the municipal sewer systems or receiving waters (Woodward et al., 2021).
Most previous works focused on the migration and removal of MPs at different stages in WWTPs (Tagg et al., 2020). Little information is available for the heterogeneity of MPs from various sources, especially the characteristics of MPs in industrial wastewater (Li et al., 2018; Long et al., 2019; Wang et al., 2020; Zhang et al., 2021). Therefore, the contribution of industrial sources to the WWTPs and aquatic environment contamination in terms of MPs is not yet defined precisely (Mallow et al., 2020; Wang et al., 2020). One likely reason is that few countries have formulated discharge standards for MPs in industrial wastewater, turning MP pollution into a global issue (Lechner and Ramler, 2015; Freeman et al., 2020). Another reason is that factories will not voluntarily reveal or make public their MP pollution status (Franco et al., 2020), where industrial wastewater plays a significant part. Extensive work has indicated that environmental pollution by MPs in wastewater can only be solved at the source (Science Advice for Policy by European Academies, 2019), which is the most economical and feasible way. Characterizing the difference of MPs between industrial and domestic sources will help formulate targeted and efficient source control policies (Helm, 2017; Bitter and Lackner, 2020). Industrial activities are considered the point sources of MPs and the priority of releasing substantial MPs into the municipal sewer systems (Bitter and Lackner, 2020). Some countries have taken some activities, such as prohibiting the addition of microbeads in personal care products to reduce the domestic-sources MP pollution (Xanthos and Walker, 2017). However, microbeads are still used in large quantities in industries (Woodward et al., 2021). A lack of in-depth knowledge restricts the implementation of targeted measures to effectively reduce MP pollution in industrial wastewater. Urgent monitoring and research are needed to identify the characteristics of the industrial contribution to MPs inflow to WWTPs, and generate science-based solutions (Prata, 2018b; Barchiesi et al., 2021).
Haicang WWTP, located in Xiamen, China, separates industrial wastewater and domestic wastewater before entering the influent pump station. Therefore, it provides a natural experiment for the characterization of MPs from different sources. In this context, the characteristics of MPs in industrial and domestic wastewater from Haicang WWTP were performed adopting the improved sampling method created by Long et al. (2019), and the results were compared with our previous work. Wentworth modulus, grain size parameters, and principal component analysis (PCA) were performed to describe the difference between MPs from industrial and domestic sources. The study aims to investigate the heterogeneity and contribution of MPs between industrial and domestic wastewater, thus appropriate strategies and management activities can be developed to address the wastewater MP pollution.
Materials and Methods
Study Area
Haicang District, located in the west of Xiamen City, is one of the fast-growing economic areas in southeast China driven by industrial activity. Haicang WWTP, operating in June, 2000 with a designed treatment capacity of 100,000 tonnes/day, is serving the industrial and domestic wastewater in the region (Lin, 2008). Separate sewer systems convey industrial and domestic wastewater, combine at the influent pump station, and enter the plant. Approximately 60% of the influent originated from industrial sources and the rest from residential sources. The primary contributors to industrial wastewater are ten mega-factories. Five of them, including automobile production, polyester chemical fiber industry, food manufacturing plants, and garbage incineration, are widely producing or using plastic products. The daily mean wastewater treatment volume in 2018 was approaching the designed treatment capacity with the fast urbanization and rapid industrial development. An improved activated sludge process is adopted for secondary treatment, then the effluent is discharged into Xiamen Bay. The flow chart of the treatment process is shown in Figure 1. The capacity of Haicang WWTP is being expanded to satisfy the increasing demand for wastewater treatment. An official estimated data shows that by 2035, the daily treatment capacity will reach 400,000 tonnes/day.

FIGURE 1. Schematic of Haicang WWTP and sampling sites in 2018.
Sampling and Processing
Wastewater and sludge sampling was conducted on October 24, 2018, and the sampling sites were described in Figure 1. To ensure compatibility with previous datasets, wastewater and sludge samples were collected and processed using the same method employed during the 2017 study (Long et al., 2019). The flows in the sampling days were 6.84 × 10⁴ tonnes and 10.37 × 10⁴ tonnes, respectively, with corresponding main intervals of flow frequency were 6.0–7.2 × 10⁴ tonnes, 10–11 × 104 tonnes, respectively (Supplementary Figure S1, Supplementary Table S1), which indicated that representative samples were captured.
An improved sampling method involving an electromagnetic flowmeter and a fast digital camera was adopted for wastewater sampling (Long et al., 2019). Within this process, a multi-use pump (Newa-NJ4500, Italy) was used to convey the sampling wastewater sequentially through an intelligent electromagnetic flowmeter (SIN-LDGDN20, China) and a cascade filtration unit using four removable stainless steel mesh screens (Narcissus, China) with 355, 125, 63, and 43 μm apertures, respectively. When sampling, photographed the electromagnetic flowmeter using a fast digital camera (Canon EOS 5D Mark III, Japan) to record the starting flow. When one of the mesh screens was clogged by the high organic content in the influent, suspended the sampling and recorded the flow as described above. Removed the clogged mesh screens and kept the unblocked ones running as necessary following the same procedure. This combined approach overcame the interference of organic matter-rich in the influent and offered the benefit of sampling multiple volumes individually and accurately (Table 1). In addition, three sludge samples were taken randomly by stainless steel spoon and stored into glass bottles rinsed with ultrapure water previously. The samples were capped tightly and brought to the laboratory for further analysis.
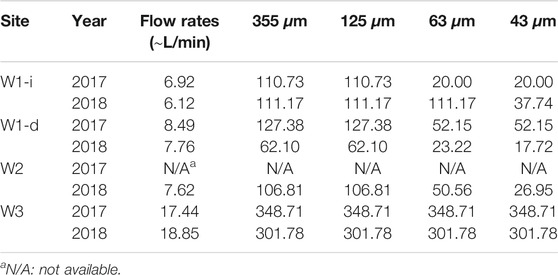
TABLE 1. The sample volume of various mesh screens at different sites.
The following mature experimental methods were adopted to purify and isolate the MPs from wastewater (Long et al., 2019). Firstly, transferred the wastewater samples in the glass bottle to a pre-cleaned 500-ml beaker with ultrapure water and covered it with aluminum foil to prevent contamination. Then the beaker was placed into the oven at 90°C to dry the water (Masura et al., 2015) for subsequent elimination of natural organics. In this step, the dried samples should be taken out to avoid damaging the MPs when water was completely dried. Next, the wet peroxide oxidation (WPO) using 30% H2O2 solution combining 0.05 M FeSO4 solution was employed (Masura et al., 2015; Dyachenko et al., 2017) to eliminate the natural organics in the samples. Due to the high content of natural organics in the influent, it couldn’t be digested entirely at one time. Therefore, repeated this step until the digestion was complete. After WPO, evaporated the sample solution to dryness again, added 100–120 ml saturated sodium chloride solution (∼1.2 g/cm3), and then transferred the solution to a 500 ml separating funnel. In this process, the beaker should be washed with saturated sodium chloride solution instead of ultrapure water to avoid reducing the concentration of the solution. After density separation, the supernatant was transferred onto the PC membrane (Nuclepore®, Whatman) using a vacuum pump. Stored the membrane in a covered Petri Dish, air-dried, and for further analysis.
The processing of the sludge sample was similar to the wastewater sample, but the former needed to be weighed. An amount of sludge (10–20 g) was scooped into the 500-ml beaker using stainless steel spoon, covered with aluminum foil, and dried in the oven. Measured and recorded the quality of the sludge samples before and after drying. The remaining steps referred to the treatment method of the wastewater sample. It should be noted that since the sludge contains a more significant fraction of MPs and their density may be higher, zinc chloride solution (∼1.6 g/cm3) was used as the density separation reagent for sludge samples.
Identification of MPs
This experiment combined a dissection microscope (Leica, ZOOM 2000, 10.5–45×5 objective, Germany) and Fourier Transform Infrared (FTIR, Bruker, HYPERION3000 + VERTEX70, Germany) spectroscopy to classify and identify MPs. First, with the help of a dissection microscope and metal tweezers, the particles were individually picked out from the PC membrane onto a micro slide (P/N: 0042–545, Thermo Fisher Scientific, United States). Then, the particles were carefully counted and categorized by shapes (fibers, pellets, granules, fragments) and color (black, yellow, red, blue, green, white, and clear). Because of the large number of particles on the PC membrane, especially from the influent, it was reasonable and feasible to take subsamples (Murphy et al., 2016) from each membrane to identify polymer type by FTIR spectroscopy. Accordingly, under the 40× magnification of dissection microscope, 20 circular subsamples (d = 8 mm) were taken per membrane to the quantity and identify the polymer type (Supplementary Figure S2). The area of subsamples was >20% of the effective area of the PC membrane, and the method following ref. (Long et al., 2019) was used to estimate the total amount of MPs on each membrane.
Under the video wizard of software OPUS 7.8 (Bruker Optics GmbH, Germany), 624 particles were identified by an infrared (IR) objective (15× magnification) in a reflection mode along with 16 scans at a resolution of 8 cm−1 in the wavenumber range of 4,000–400 cm−1. Each particle must be measured at three different points to eliminate the interference of natural organics. Furthermore, the spectrum with minor interference and pronounced characteristic peaks should be selected to further compare with the reference library to determine the polymer type. Finally, a total of 779 particles were analyzed using FTIR spectroscopy, and 385 (49.42%) items were identified as MPs in this study (Supplementary Table S2). The results of industrial and domestic wastewater samples are shown in Supplementary Table S3 and Supplementary Table S4, respectively (W1-i = 77, W1-d = 96). According to the method (Long et al., 2019), it was estimated that 155 particles remained on the PC membranes as (unclassified) MPs and, the total amount of MPs was 540 in all samples (Supplementary Table S2). In the 2017 survey, 278 particles (W1-i = 149, W1-d = 129) were checked, and 91, 67 were confirmed as MPs, respectively (Supplementary Table S5, S6).
Statistical Analyses
The particle size of MPs in millimeters was converted to Wentworth modulus (∅) as Eq. 1 (Krumbein, 1934; McManus, 1963) to facilitate calculation and comparison.
where, d is the particle size of MPs in millimeters, d0 = 1 mm, ∅ is a dimensionless parameter.
The grain size parameters (Mean size Mz, Standard Deviation σi, Skewness Ski, Graphic Kurtosis Kg) were used to quantitatively describe and compare the MP characteristics. They were calculated by Eq. 2, Eq. 3, Eq. 4 and Eq. 5 (Folk and Ward, 1957).
where, ∅5, ∅16, ∅25, ∅50, ∅75, ∅84 and ∅95 are the ∅ value variables corresponding to 5, 16, 25, 50, 75, 84 and 95% on the probability cumulative curve of MPs.
Principal component analysis (PCA) was performed to explore the types, shapes and colors variability of MPs in wastewater from industrial and domestic sources.
Quality Assurance and Quality Control
Many strict control measures (Woodall et al., 2015) were employed to prevent potential contamination as much as possible during the sampling and laboratory, such as wearing cotton laboratory coats, masks, and rubber gloves throughout the process, using non-plastic and deep-cleaned equipment and conducting the experiments in a clean environment. Additionally, some other special measures were taken in this study to minimize contamination and ensure the quality and testability of results (Long et al., 2019). Both single-blind recovery and spiked recovery experiments were used to verify the effectiveness of the sampling and experimental methods. Polystyrene (PS) microspheres with a diameter of 90 μm (Fluoresbrite®, Yellow Green Microspheres, United States) were added to the blank and influent samples, respectively. Then, the same procedure as described above was used in the recovery experiments. The recovery rate of a single-blind method (89.93%) is higher than the spiked method (80.06%). The possible reason may be that the PS microspheres are easily carried away by the high content of natural organics in the influent sample and are unrecoverable. Nonetheless, the recovery rate of 80.06% can also meet the experimental conditions and promise an effective procedure. Therefore, the results are conservative.
Results and Discussion
Abundance of MPs
As shown in Table 2 and Figure 2, the abundance of MPs in industrial wastewater (W1-i) is 2.76 items/L, more than twice as much as the domestic wastewater (W1-d, 1.29 items/L). The results are consistent with our previous study in 2017 of the same WWTP (Long et al., 2019) (Figure 2A), and prove that MP abundance is higher from industrial sources than that from domestic sources (Chen et al., 2020; Franco et al., 2020). Annual fluxes of industrial and domestic MP discharge were extrapolated based on representative samples and wastewater discharge data in different years. It is estimated that the annual discharge of MPs from industrial and domestic sources increases steadily and will reach 17.41×10¹⁰ items, 7.92×10¹⁰ items, respectively, by 2035 (Figure 2B, Supplementary Table S7). With the urbanization of Haicang district, despite the volume of domestic wastewater is increasing faster than industrial wastewater (Supplementary Table S7), the annual emissions of industrial sources MPs are still more than twice that of domestic sources due to the high abundance of MPs (black dotted line in Figure 2B). Therefore, the higher concentrations and daily release of MPs from industrial sources will elevate loads of MPs in the influent of studied WWTP.
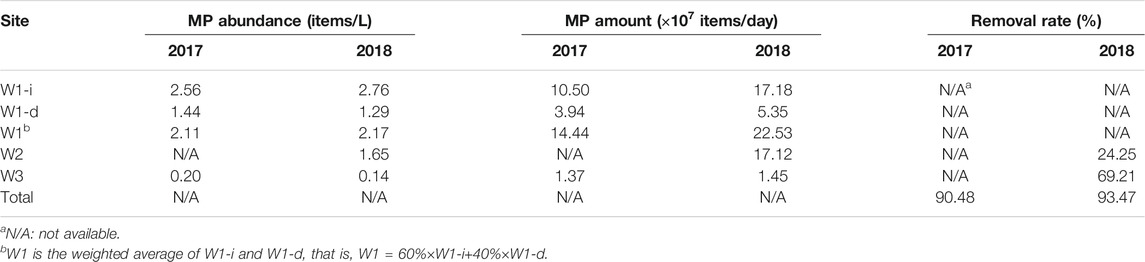
TABLE 2. MP abundance and removal rate at various sampling sites on the sampling day.
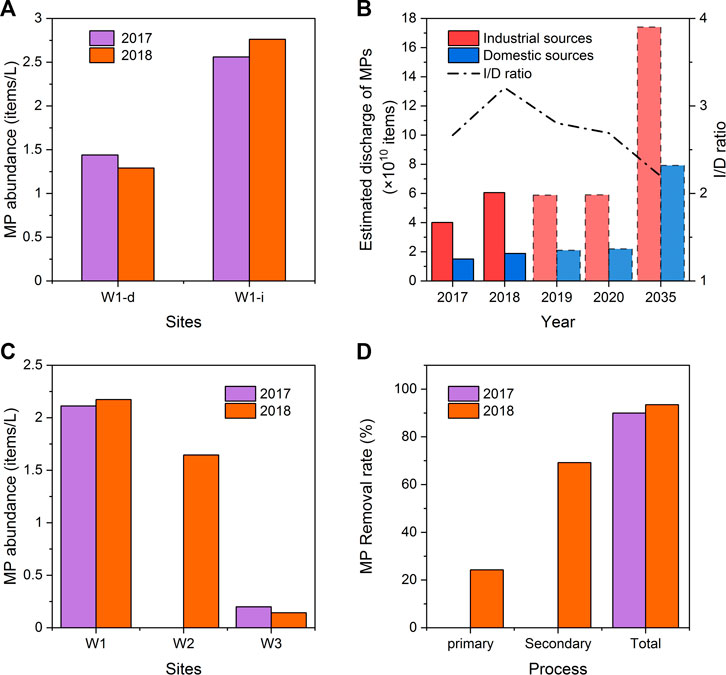
FIGURE 2. The abundance (A), annual estimated discharge (B) of MPs in industrial and domestic wastewater. The abundance of MPs (C) and removal rate (D) in different processes of Haicang WWTP.
This study confirmed that plastic-related industrial discharge might be the key factor contributing to the load of MPs in WWTPs (Long et al., 2019; Deng et al., 2020; Zou et al., 2020). MP abundance in wastewater is highly related to the presence and quantity of industries (Barchiesi et al., 2021). Both individual industrial types (Xu et al., 2018; Zhou et al., 2020; Franco et al., 2021) and regional scales (Liu et al., 2020; Wu et al., 2020) studies have shown that MP emissions from industrial sources are higher than those from domestic sources. However, most current WWTPs are not designed for MP removal, and any additional MP elimination processes will increase the capital cost and be challenging to achieve in the short term (Hou et al., 2021). Environmental management plays a significant role in controlling the production and transmission of MPs (Chen et al., 2020). The industries should take measures to prevent MPs from entering the sewer systems (Helm, 2017), especially within small and medium-sized enterprises lacking proper wastewater treatment capacity. Compared with domestic sources, industrial sources are more relevant in reducing MP contamination in wastewater (Lechner and Ramler, 2015). Simple measures may prevent MPs from entering the wastewater in industries (Prata, 2018a). Governments may play a role in guiding enterprises to eco-friendly production through taxes and incentives, which are essential to reduce the losses of MPs (Prata, 2018b). On the other hand, according to the “polluter pays” principle, enterprises should take social responsibility for reducing MP discharge by improving plastic waste management, introducing plastic recycling and upgrading programs even in the absence of legislation (Li et al., 2016; Prata, 2018b). Therefore, it is believed that industrial sources should be the priority areas to reduce MP contamination.
The abundance and characteristics of MPs in different sites of Haicang WWTP are shown in Figure 2C, Supplementary Figure S3, S4. The MP abundance in 2018 in the primary effluent (W2) and secondary effluent (W3) is 1.64 items/L and 0.14 items/L, respectively. It is suggested that the removal rate of MPs in the primary treatment and secondary treatments are 24.25 and 69.21%, respectively. The total removal rate of MPs in 2017 and 2018 in Haicang WWTP are 90.48% and 93.47%, respectively (Figure 2D), confirming that secondary treatment is the leading efficient process to remove MPs in activated sludge-based WWTPs (Ben-David et al., 2021; Wu et al., 2021). The essential mechanism may be that MPs are trapped by bacteria in the activated sludge-related process and settle along with sludge in the secondary sedimentation tank (Liu X. et al., 2019; Sun et al., 2019; Zhang et al., 2020; Liu et al., 2021).
Our findings suggest that the moisture content in the sludge samples varies greatly and significantly affects the expression of MP abundance in wet and dry sample scenarios (Table 3; Figure 3A). In the wet samples scenario, MP abundance in the sludge cake (S3) is 1.88 items/g·ww, more than five times that of excess sludge (S2). However, in the dry samples scenario, MP abundance in S3 is 3.01 items/g·dw, about 27.6% of that in S2 (9.86 items/g·dw). Based on the treated amount of wastewater and sludge production on the sampling day in 2018 (Supplementary Table S1), MP balance in studied WWTP was estimated and the result is presented in Figure 3B. The sum of the MPs in the effluent and excess sludge is 22.92×10⁷ items/day, slightly larger than that in the influent (22.51×10⁷ items/day). There are two possible reasons for this imbalance. One reason is that MPs entering the excess sludge are controlled by the number of MPs in the influent and affected by the dynamic sludge return ratio. The hydraulic retention time of wastewater in the WWTP causes the MPs between the influent and effluent to be out of sync. At the same time, stress forces employed in the wastewater treatment system can induce fragmentation and an increasing amount of MPs (Enfrin et al., 2019). The decrease of MPs after sludge dewatering indicate that about 27% of MPs escaped into the reject water and recycled back into the wastewater treatment system, in line with the existing estimating (Talvitie et al., 2017; Sun et al., 2019). The principal reason is that MPs trapped in unstable flocs are probably easy to fall off in the dewatering process (Sun et al., 2019; Alavian Petroody et al., 2021). It shows that the distribution of MPs in WWTPs is unclear yet, and the moisture content of sludge must be considered and the abundance of MPs in wet sludge may be more useful when analyzing the MP balance.
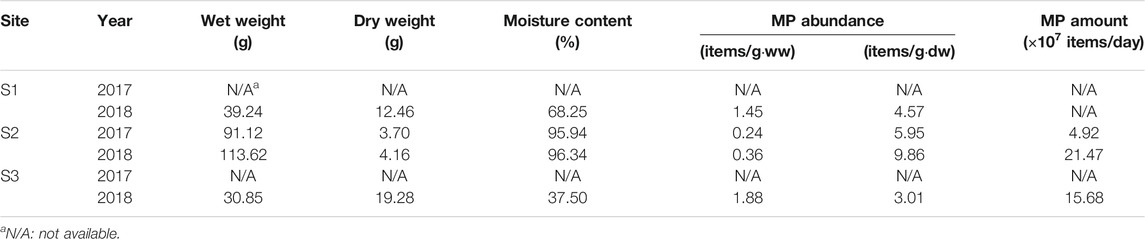
TABLE 3. The characteristics of sludgy samples.
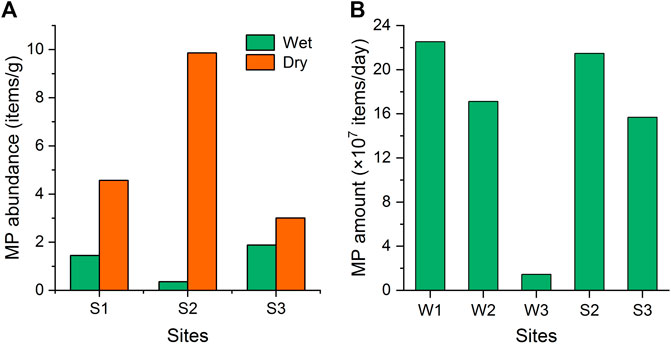
FIGURE 3. MP abundance in sludge (A) and MP balance analysis of Haicang WWTP (B) in 2018.
Characteristics of MPs
The grain size of MPs (∅) in W1-i and W1-d in 2018 is approximate to Gaussian distribution with some differences (Figure 4; Table 4). A notable difference was not detected between industrial and domestic wastewater using the traditional method (Franco et al., 2021). In contrast, it is convenient to distinguish the subtle difference of MP size between various sources using grain size parameters in this study. Since the grain size parameters were calculated from the continuous frequency curve of MP particle size, which was independent of the grade scale (Krumbein, 1934). Therefore, it is possible to use particle size parameters to quantitatively describe the characteristics of MP size in a holistic view. For example, the Mz (∅) in W1-i (1.49) is more extensive than that in W1-d (1.36), while the σi (∅) in W1-i (1.0) is slightly smaller than that in W1-d (1.1). Therefore, it implies that the fraction of the small particle size of MPs in industrial wastewater (W1-i) is larger than the domestic wastewater (W1-d), which is consistent with the existing results (Liu et al., 2019). As a result, the particle size distribution is more concentrated (Figure 4) and the mean particle size of MPs is decreased in industrial sources (Su et al., 2020; Wang et al., 2020). The possible reason might be that MPs from industry are mainly produced by chopping plastic materials (Helm, 2017; Wang et al., 2020), while the MPs from domestic are various.
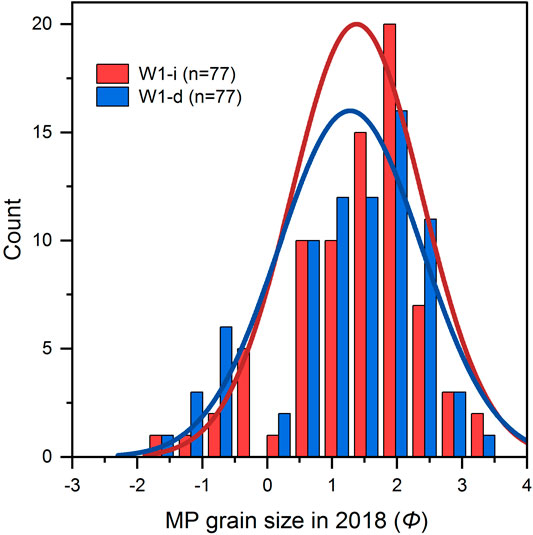
FIGURE 4. The distribution of grain size of MPs in different sources.
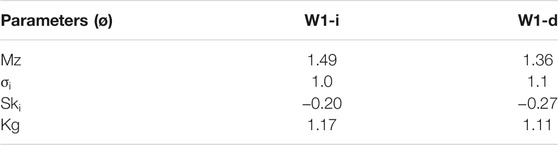
TABLE 4. Grain size parameters of MPs in different sources in 2018.
MP types, shapes and colors from industrial and domestic wastewater are highly variable across different years (Figures 5A,C,E). However, PCA results show that MPs from industrial and domestic sources display apparent differences in features such as types, shapes and colors (Figures 5B,D,F).
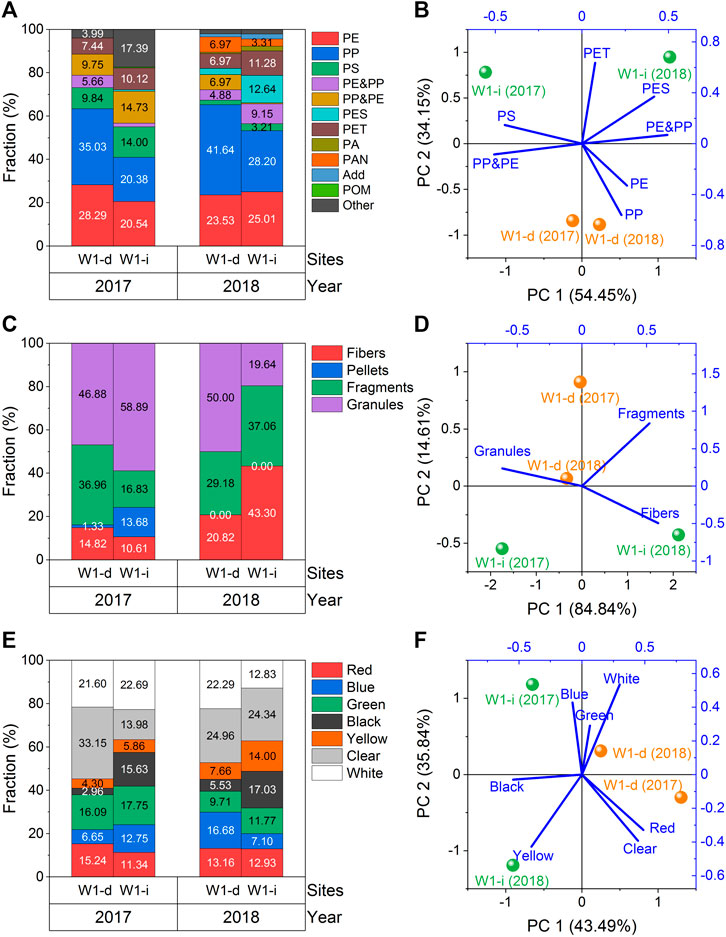
FIGURE 5. Characteristics of MPs in wastewater from industrial and domestic sources and their biplots of PCA analysis in 2018.
As shown in Figure 5B, most of the type variance is captured by PC1 and PC2, which explains the 54.45 and 34.15% of the disparity, respectively. W1-d (2017) and W1-d (2018) have similar MP polymer compositions, of which polypropylene (PP) and polyethylene (PE) are the main polymer types. PP and PE are generally used to manufacture household products and are the main polymer compositions in domestic plastics waste (Song et al., 2011) and wastewater (Zhang et al., 2020). There is little difference in the polymer type of MPs between W1-d (2017) and W1-d (2018), indicating a significant aggregation and constancy of MPs from domestic sources. However, the distance between W1-i (2017) and W1-i (2018) represents that the polymer compositions of MPs are unstable, demonstrating the significant separation of polymer type. The polymer compositions of industrial sources MPs are related to the factories’ types and their products in the vicinity (Zou et al., 2020). Among the primary sources of industrial wastewater that contributed to Haicang WWTP, polyethylene terephthalate (PET) fiber is the main product of the plastic production factory, and polyester (PES) and PET are widely used in the automobile manufacturer. Those increase PES and PET types of MPs in industrial wastewater significantly, which is higher than that in domestic wastewater. Our results sustain that residential areas hold MP concentrations of comparable size and composition, while the industrial areas show much variability among themselves (Liu et al., 2019).
The results show that fibers, fragments and granules subsist in both industrial and domestic wastewater. Still, the pellets are rarely detected in 2018 (Figure 5C), which is in agreement with other studies (Murphy et al., 2016; Xu et al., 2019; Franco et al., 2020). It may be attributed to the fact that secondary MPs are predominant, while primary MPs are minimal in wastewater (Blair et al., 2019). Fragments and granules are the dominant shapes of MPs in domestic wastewater. The PCA result reveals that W1-d (2017) and W1-d (2018) are clustering (Figure 5D), indicating that the shapes of MPs from domestic wastewater have similar laws with the type. However, the shapes of MPs from industrial wastewater are different between 2017 and 2018. Especially, fibers are the primary shape in industrial wastewater in 2018. The distance between W1-i (2017) and W1-i (2018) displays the variances of MP types (Figure 5D).
The surface morphology of MPs from industrial wastewater differs significantly from that of domestic (Supplementary Figure S5 and Supplementary Figure S6). Compared with industrial MPs, domestic MPs have a smooth and clear surface, and fewer impurities are attached after WPO treatment. It may be related to that polishing operations in industries will generate a massive amount of MPs with twisted and curved morphology (Helm, 2017; Lee et al., 2021). Simultaneously, industrial wastewater contains more synthetic compounds that are difficult to assimilate by the WPO process (Jiménez, 2009). MPs have been recognized as vectors for toxic contaminants (Rios et al., 2007). The path of MPs through WWTPs would further enhance their adsorption propensity and increase the spread of pollutants in the environment (Enfrin et al., 2019; Hou et al., 2021). Recent studies demonstrate that the organic matter in the activated sludge process of a WWTP could oxidize MP surface and increase their roughness and porosity, leading to ten times growth in their adsorption to other entities such as metals and various persistent pollutants (Enfrin et al., 2019; Li et al., 2019). This implies that industrial-based MPs with rough surfaces and small sizes tend to have greater adsorption than domestic sources (Zhan et al., 2016). Therefore, MPs from industrial sources may be harmful to the environment than domestic sources. Further study needs to compare the toxicological differences of MPs from the two kinds of sources and provide guidance for the priority direction to reduce MP contamination in wastewater.
In terms of color, white, transparent and red with component scores for PC1 are the main contributors to domestic-source MPs; blue, yellow and black with component scores for PC2 and PC1 are the main contributors to industrial-source MPs (Figure 5F). The white and transparent MPs in domestic wastewater are mainly PE, PP or PE&PP copolymers, which is compatible with the wide use of PE and PP in daily life. The main components of black MPs in industrial wastewater are PES and PP, and the transparent MPs are PE, PP and PET. No clear patterns are found in relation to the MP color difference between industrial and domestic wastewater, implying that MP color can not be used to distinguish the sources of MPs alone.
Conclusion
This study analyzed and compared the differences of MPs in industrial and domestic wastewater using the example of Haicang WWTP. The key conclusions are as follows. The surveys performed in 2017 and 2018 independently show that the abundance of MPs in industrial wastewater is nearly twice that of domestic wastewater. The flux of MPs discharged into the municipal sewer systems through industrial wastewater is about 3.2 times that of domestic wastewater. There are differences in morphology, polymer type, and particle size between industrial and domestic sources MPs. Industrial sources contribute more to the MP pollution of municipal wastewater. At the same time, more other pollutants are adsorbed by industrial-based MPs, which may aggravate compound pollution. As for the source mitigation of MPs, the high loading, small-size and complex morphology of MPs in industrial wastewater present a targeted intervention point. This research provides some new ideas and novel insights for promoting the traceability of MPs in wastewater. However, source-specific classifications within MPs categories in wastewater are still tricky due to the diversity and complexity of MP sources, which requires further improvements in methods and techniques.
Data Availability Statement
The raw data supporting the conclusions of this article will be made available by the authors, without undue reservation.
Author Contributions
ZL conceived and designed the study and wrote the manuscript; WW participated in the experiments, conducted the data analysis and edited the manuscript; XY provided guidance for this study and contributed to manuscript editing; ZYL and JC provided the grain size parameters analysis and related expertise. All authors contributed to the manuscript and approved the submitted version.
Funding
This study was supported by grants from the National Natural Science Foundation of China (No. 42176220); the Scientific Research Foundation of the Third Institute of Oceanography, MNR (No. 2019030); the China Blue Bay Remediation Action Plan (XHYH201745).
Conflict of Interest
The authors declare that the research was conducted in the absence of any commercial or financial relationships that could be construed as a potential conflict of interest.
Publisher’s Note
All claims expressed in this article are solely those of the authors and do not necessarily represent those of their affiliated organizations, or those of the publisher, the editors and the reviewers. Any product that may be evaluated in this article, or claim that may be made by its manufacturer, is not guaranteed or endorsed by the publisher.
Supplementary Material
The Supplementary Material for this article can be found online at: https://www.frontiersin.org/articles/10.3389/fenvs.2021.770634/full#supplementary-material
References
Alavian Petroody, S. S., Hashemi, S. H., and van Gestel, C. A. M. (2021). Transport and Accumulation of Microplastics through Wastewater Treatment Sludge Processes. Chemosphere 278, 130471. doi:10.1016/j.chemosphere.2021.130471
Barchiesi, M., Chiavola, A., Di Marcantonio, C., and Boni, M. R. (2021). Presence and Fate of Microplastics in the Water Sources: Focus on the Role of Wastewater and Drinking Water Treatment Plants. J. Water Process Eng. 40, 101787. doi:10.1016/j.jwpe.2020.101787
Baresel, C., and Olshammar, M. (2019). On the Importance of Sanitary Sewer Overflow on the Total Discharge of Microplastics from Sewage Water. J. Environ. Prot.10 (9), 1105–1118. doi:10.4236/jep.2019.109065
Ben-David, E. A., Habibi, M., Haddad, E., Hasanin, M., Angel, D. L., Booth, A. M., et al. (2021). Microplastic Distributions in a Domestic Wastewater Treatment Plant: Removal Efficiency, Seasonal Variation and Influence of Sampling Technique. Sci. Total Environ. 752, 141880. doi:10.1016/j.scitotenv.2020.141880
Bitter, H., and Lackner, S. (2020). First Quantification of Semi-crystalline Microplastics in Industrial Wastewaters. Chemosphere 258, 127388. doi:10.1016/j.chemosphere.2020.127388
Blair, R. M., Waldron, S., and Gauchotte-Lindsay, C. (2019). Average Daily Flow of Microplastics through a Tertiary Wastewater Treatment Plant over a Ten-Month Period. Water Res. 163, 114909. doi:10.1016/j.watres.2019.114909
Bretas Alvim, C., Mendoza-Roca, J. A., and Bes-Piá, A. (2020). Wastewater Treatment Plant as Microplastics Release Source - Quantification and Identification Techniques. J. Environ. Manage. 255, 109739. doi:10.1016/j.jenvman.2019.109739
Carr, S. A., Liu, J., and Tesoro, A. G. (2016). Transport and Fate of Microplastic Particles in Wastewater Treatment Plants. Water Res. 91, 174–182. doi:10.1016/j.watres.2016.01.002
Chen, H., Jia, Q., Zhao, X., Li, L., Nie, Y., Liu, H., et al. (2020). The Occurrence of Microplastics in Water Bodies in Urban Agglomerations: Impacts of Drainage System Overflow in Wet Weather, Catchment Land-Uses, and Environmental Management Practices. Water Res. 183, 116073. doi:10.1016/j.watres.2020.116073
Conley, K., Clum, A., Deepe, J., Lane, H., and Beckingham, B. (2019). Wastewater Treatment Plants as a Source of Microplastics to an Urban Estuary: Removal Efficiencies and Loading Per Capita over One Year. Water Res. X 3, 100030. doi:10.1016/j.wroa.2019.100030
Deng, H., Wei, R., Luo, W., Hu, L., Li, B., Di, Y. n., et al. (2020). Microplastic Pollution in Water and Sediment in a Textile Industrial Area. Environ. Pollut. 258, 113658. doi:10.1016/j.envpol.2019.113658
Dyachenko, A., Mitchell, J., and Arsem, N. (2017). Extraction and Identification of Microplastic Particles from Secondary Wastewater Treatment Plant (WWTP) Effluent. Anal. Methods 9 (9), 1412–1418. doi:10.1039/C6AY02397E
Enfrin, M., Dumée, L. F., and Lee, J. (2019). Nano/microplastics in Water and Wastewater Treatment Processes - Origin, Impact and Potential Solutions. Water Res. 161, 621–638. doi:10.1016/j.watres.2019.06.049
Folk, R. L., and Ward, W. C. (1957). Brazos River Bar [Texas]; a Study in the Significance of Grain Size Parameters. J. Sediment. Res. 27 (1), 3–26. doi:10.1306/74d70646-2b21-11d7-8648000102c1865d
Franco, A. A., Arellano, J. M., Albendín, G., Rodríguez-Barroso, R., Quiroga, J. M., and Coello, M. D. (2021). Microplastic Pollution in Wastewater Treatment Plants in the City of Cádiz: Abundance, Removal Efficiency and Presence in Receiving Water Body. Sci. Total Environ. 776, 145795. doi:10.1016/j.scitotenv.2021.145795
Franco, A. A., Arellano, J. M., Albendín, G., Rodríguez-Barroso, R., Zahedi, S., Quiroga, J. M., et al. (2020). Mapping Microplastics in Cadiz (Spain): Occurrence of Microplastics in Municipal and Industrial Wastewaters. J. Water Process Eng. 38, 101596. doi:10.1016/j.jwpe.2020.101596
Freeman, S., Booth, A. M., Sabbah, I., Tiller, R., Dierking, J., Klun, K., et al. (2020). Between Source and Sea: The Role of Wastewater Treatment in Reducing marine Microplastics. J. Environ. Manage. 266, 110642. doi:10.1016/j.jenvman.2020.110642
Funck, M., Al-Azzawi, M. S. M., Yildirim, A., Knoop, O., Schmidt, T. C., Drewes, J. E., et al. (2021). Release of Microplastic Particles to the Aquatic Environment via Wastewater Treatment Plants: The Impact of Sand Filters as Tertiary Treatment. Chem. Eng. J. 426, 130933. doi:10.1016/j.cej.2021.130933
Helm, P. A. (2017). Improving Microplastics Source Apportionment: a Role for Microplastic Morphology and Taxonomy? Anal. Methods 9 (9), 1328–1331. doi:10.1039/C7AY90016C
Hou, L., Kumar, D., Yoo, C. G., Gitsov, I., and Majumder, E. L.-W. (2021). Conversion and Removal Strategies for Microplastics in Wastewater Treatment Plants and Landfills. Chem. Eng. J. 406, 126715. doi:10.1016/j.cej.2020.126715
Jiménez, B. (2009). “Coming to Terms with Nature: Water Reuse New Paradigm towards Integrated Water Resources Management,” in Water and Health Voll II Envyclopedia of Life Support Systems. Editor W. Grabow (Oxford, United Kingdom: Eolss Publishers Co. Ltd.), 398–428.
Kazour, M., Terki, S., Rabhi, K., Jemaa, S., Khalaf, G., and Amara, R. (2019). Sources of Microplastics Pollution in the marine Environment: Importance of Wastewater Treatment Plant and Coastal Landfill. Mar. Pollut. Bull. 146, 608–618. doi:10.1016/j.marpolbul.2019.06.066
Krumbein, W. C. (1934). Size Frequency Distributions of Sediments. Sepm Jsr 4 (2), 65–77. doi:10.1306/d4268eb9-2b26-11d7-8648000102c1865d
Lechner, A., Keckeis, H., Lumesberger-Loisl, F., Zens, B., Krusch, R., Tritthart, M., et al. (2014). The Danube So Colourful: A Potpourri of Plastic Litter Outnumbers Fish Larvae in Europe's Second Largest River. Environ. Pollut. 188, 177–181. doi:10.1016/j.envpol.2014.02.006
Lechner, A., and Ramler, D. (2015). The Discharge of Certain Amounts of Industrial Microplastic from a Production Plant into the River Danube Is Permitted by the Austrian Legislation. Environ. Pollut. 200, 159–160. doi:10.1016/j.envpol.2015.02.019
Lee, J., Choi, Y., Jeong, J., and Chae, K.-J. (2021). Eye-glass Polishing Wastewater as Significant Microplastic Source: Microplastic Identification and Quantification. J. Hazard. Mater. 403, 123991. doi:10.1016/j.jhazmat.2020.123991
Li, W. C., Tse, H. F., and Fok, L. (2016). Plastic Waste in the marine Environment: A Review of Sources, Occurrence and Effects. Sci. Total Environ. 566-567, 333–349. doi:10.1016/j.scitotenv.2016.05.084
Li, X., Chen, L., Mei, Q., Dong, B., Dai, X., Ding, G., et al. (2018). Microplastics in Sewage Sludge from the Wastewater Treatment Plants in China. Water Res. 142, 75–85. doi:10.1016/j.watres.2018.05.034
Li, X., Mei, Q., Chen, L., Zhang, H., Dong, B., Dai, X., et al. (2019). Enhancement in Adsorption Potential of Microplastics in Sewage Sludge for Metal Pollutants after the Wastewater Treatment Process. Water Res. 157, 228–237. doi:10.1016/j.watres.2019.03.069
Lin, Q. (2008). Thought and Practice on Upgrading and Retrofitting of Haicang Sewage Treatment Plant. China Water & Wastewater 24 (24), 20–22.
Liu, F., Olesen, K. B., Borregaard, A. R., and Vollertsen, J. (2019). Microplastics in Urban and Highway Stormwater Retention Ponds. Sci. Total Environ. 671, 992–1000. doi:10.1016/j.scitotenv.2019.03.416
Liu, W., Zhang, J., Liu, H., Guo, X., Zhang, X., Yao, X., et al. (2021). A Review of the Removal of Microplastics in Global Wastewater Treatment Plants: Characteristics and Mechanisms. Environ. Int. 146, 106277. doi:10.1016/j.envint.2020.106277
Liu, X., Yuan, W., Di, M., Li, Z., and Wang, J. (2019). Transfer and Fate of Microplastics during the Conventional Activated Sludge Process in One Wastewater Treatment Plant of China. Chem. Eng. J. 362, 176–182. doi:10.1016/j.cej.2019.01.033
Liu, Y., Zhang, J., Cai, C., He, Y., Chen, L., Xiong, X., et al. (2020). Occurrence and Characteristics of Microplastics in the Haihe River: An Investigation of a Seagoing River Flowing through a Megacity in Northern China. Environ. Pollut. 262, 114261. doi:10.1016/j.envpol.2020.114261
Long, Z., Pan, Z., Wang, W., Ren, J., Yu, X., Lin, L., et al. (2019). Microplastic Abundance, Characteristics, and Removal in Wastewater Treatment Plants in a Coastal City of China. Water Res. 155, 255–265. doi:10.1016/j.watres.2019.02.028
Lv, X., Dong, Q., Zuo, Z., Liu, Y., Huang, X., and Wu, W.-M. (2019). Microplastics in a Municipal Wastewater Treatment Plant: Fate, Dynamic Distribution, Removal Efficiencies, and Control Strategies. J. Clean. Prod. 225, 579–586. doi:10.1016/j.jclepro.2019.03.321
Mahon, A. M., O’Connell, B., Healy, M. G., O’Connor, I., Officer, R., Nash, R., et al. (2017). Microplastics in Sewage Sludge: Effects of Treatment. Environ. Sci. Technol. 51 (2), 810–818. doi:10.1021/acs.est.6b04048
Mallow, O., Spacek, S., Schwarzböck, T., Fellner, J., and Rechberger, H. (2020). A New Thermoanalytical Method for the Quantification of Microplastics in Industrial Wastewater. Environ. Pollut. 259, 113862. doi:10.1016/j.envpol.2019.113862
Mason, S. A., Garneau, D., Sutton, R., Chu, Y., Ehmann, K., Barnes, J., et al. (2016). Microplastic Pollution Is Widely Detected in US Municipal Wastewater Treatment Plant Effluent. Environ. Pollut. 218, 1045–1054. doi:10.1016/j.envpol.2016.08.056
Masura, J., Baker, J., Foster, G., and Arthur, C. (2015). Laboratory Methods for the Analysis of Microplastics in the marine Environment: Recommendations for Quantifying Synthetic Particles in Waters and Sediments, 48. Maryland: NOAA Technical Memorandum NOS-OR&R.
McManus, D. A. (1963). A Criticism of Certain Usage of the Phi-Notation. Sepm Jsr 33 (3), 670–674. doi:10.1306/74d70eed-2b21-11d7-8648000102c1865d
Murphy, F., Ewins, C., Carbonnier, F., and Quinn, B. (2016). Wastewater Treatment Works (WwTW) as a Source of Microplastics in the Aquatic Environment. Environ. Sci. Technol. 50 (11), 5800–5808. doi:10.1021/acs.est.5b05416
Ngo, P. L., Pramanik, B. K., Shah, K., and Roychand, R. (2019). Pathway, Classification and Removal Efficiency of Microplastics in Wastewater Treatment Plants. Environ. Pollut. 255, 113326. doi:10.1016/j.envpol.2019.113326
Nizzetto, L., Futter, M., and Langaas, S. (2016). Are Agricultural Soils Dumps for Microplastics of Urban Origin? Environ. Sci. Technol. 50 (20), 10777–10779. doi:10.1021/acs.est.6b04140
Piehl, S., Hauk, R., Robbe, E., Richter, B., Kachholz, F., Schilling, J., et al. (2021). Combined Approaches to Predict Microplastic Emissions within an Urbanized Estuary (Warnow, Southwestern Baltic Sea). Front. Environ. Sci. 9 (41). doi:10.3389/fenvs.2021.616765
Prata, J. C. (2018a). Microplastics in Wastewater: State of the Knowledge on Sources, Fate and Solutions. Mar. Pollut. Bull. 129 (1), 262–265. doi:10.1016/j.marpolbul.2018.02.046
Prata, J. C. (2018b). Plastic Litter in Our Oceans: A Case for Government Action. Ocean Yearb. Online 32 (1), 283–313. doi:10.1163/22116001-03201012
Qiu, Y., Shi, H.-c., and He, M. (2010). Nitrogen and Phosphorous Removal in Municipal Wastewater Treatment Plants in China: A Review. Int. J. Chem. Eng. 2010, 1–10. doi:10.1155/2010/914159
Rasmussen, L. A., Iordachescu, L., Tumlin, S., and Vollertsen, J. (2021). A Complete Mass Balance for Plastics in a Wastewater Treatment Plant - Macroplastics Contributes More Than Microplastics. Water Res. 201, 117307. doi:10.1016/j.watres.2021.117307
Rios, L. M., Moore, C., and Jones, P. R. (2007). Persistent Organic Pollutants Carried by Synthetic Polymers in the Ocean Environment. Mar. Pollut. Bull. 54 (8), 1230–1237. doi:10.1016/j.marpolbul.2007.03.022
Rodríguez-Narvaez, O. M., Goonetilleke, A., Perez, L., and Bandala, E. R. (2021). Engineered Technologies for the Separation and Degradation of Microplastics in Water: A Review. Chem. Eng. J. 414, 128692. doi:10.1016/j.cej.2021.128692
Ruan, Y., Zhang, K., Wu, C., Wu, R., and Lam, P. K. S. (2019). A Preliminary Screening of HBCD Enantiomers Transported by Microplastics in Wastewater Treatment Plants. Sci. Total Environ. 674, 171–178. doi:10.1016/j.scitotenv.2019.04.007
Schernewski, G., Radtke, H., Hauk, R., Baresel, C., Olshammar, M., Osinski, R., et al. (2020). Transport and Behavior of Microplastics Emissions from Urban Sources in the Baltic Sea. Front. Environ. Sci. 8, 17. doi:10.3389/fenvs.2020.579361
Schmidt, C., Kumar, R., Yang, S., and Büttner, O. (2020). Microplastic Particle Emission from Wastewater Treatment Plant Effluents into River Networks in Germany: Loads, Spatial Patterns of Concentrations and Potential Toxicity. Sci. Total Environ. 737, 139544. doi:10.1016/j.scitotenv.2020.139544
Science Advice for Policy by European Academies (2019). A Scientifc Perspective on Microplastics in Nature and Society. Berlin: SAPEA. doi:10.26356/microplastics
Song, B., Xue, L., Long, F., Lv, Q., Xia, X., Huang, Q., et al. (2011). Quantitative Study on the Generation Characteristics of Domestic Plastics Waste in Beijing. J. Basic Eng. 19 (2), 211–220. doi:10.3969/j.issn.1005-0930.2011.02.005
Su, L., Sharp, S. M., Pettigrove, V. J., Craig, N. J., Nan, B., Du, F., et al. (2020). Superimposed Microplastic Pollution in a Coastal metropolis. Water Res. 168, 115140. doi:10.1016/j.watres.2019.115140
Sun, J., Dai, X., Wang, Q., van Loosdrecht, M. C. M., and Ni, B.-J. (2019). Microplastics in Wastewater Treatment Plants: Detection, Occurrence and Removal. Water Res. 152, 21–37. doi:10.1016/j.watres.2018.12.050
Tagg, A. S., Sapp, M., Harrison, J. P., Sinclair, C. J., Bradley, E., Ju-Nam, Y., et al. (2020). Microplastic Monitoring at Different Stages in a Wastewater Treatment Plant Using Reflectance Micro-FTIR Imaging. Front. Environ. Sci. 8 (145). doi:10.3389/fenvs.2020.00145
Takdastan, A., Niari, M. H., Babaei, A., Dobaradaran, S., Jorfi, S., and Ahmadi, M. (2021). Occurrence and Distribution of Microplastic Particles and the Concentration of Di 2-ethyl Hexyl Phthalate (DEHP) in Microplastics and Wastewater in the Wastewater Treatment Plant. J. Environ. Manage. 280, 111851. doi:10.1016/j.jenvman.2020.111851
Talvitie, J., Mikola, A., Setälä, O., Heinonen, M., and Koistinen, A. (2017). How Well Is Microlitter Purified from Wastewater? - A Detailed Study on the Stepwise Removal of Microlitter in a Tertiary Level Wastewater Treatment Plant. Water Res. 109, 164–172. doi:10.1016/j.watres.2016.11.046
Townsend, K. R., Lu, H.-C., Sharley, D. J., and Pettigrove, V. (2019). Associations between Microplastic Pollution and Land Use in Urban Wetland Sediments. Environ. Sci. Pollut. Res. 26 (22), 22551–22561. doi:10.1007/s11356-019-04885-w
Wang, F., Wang, B., Duan, L., Zhang, Y., Zhou, Y., Sui, Q., et al. (2020). Occurrence and Distribution of Microplastics in Domestic, Industrial, Agricultural and Aquacultural Wastewater Sources: A Case Study in Changzhou, China. Water Res. 182, 115956. doi:10.1016/j.watres.2020.115956
Woodall, L. C., Gwinnett, C., Packer, M., Thompson, R. C., Robinson, L. F., and Paterson, G. L. J. (2015). Using a Forensic Science Approach to Minimize Environmental Contamination and to Identify Microfibres in marine Sediments. Mar. Pollut. Bull. 95 (1), 40–46. doi:10.1016/j.marpolbul.2015.04.044
Woodward, J., Li, J., Rothwell, J., and Hurley, R. (2021). Acute Riverine Microplastic Contamination Due to Avoidable Releases of Untreated Wastewater. Nat. Sustain. 4 (9), 793–802. doi:10.1038/s41893-021-00718-2
Wu, M., Tang, W., Wu, S., Liu, H., and Yang, C. (2021). Fate and Effects of Microplastics in Wastewater Treatment Processes. Sci. Total Environ. 757, 143902. doi:10.1016/j.scitotenv.2020.143902
Wu, P., Tang, Y., Dang, M., Wang, S., Jin, H., Liu, Y., et al. (2020). Spatial-temporal Distribution of Microplastics in Surface Water and Sediments of Maozhou River within Guangdong-Hong Kong-Macao Greater Bay Area. Sci. Total Environ. 717, 135187. doi:10.1016/j.scitotenv.2019.135187
Xanthos, D., and Walker, T. R. (2017). International Policies to Reduce Plastic marine Pollution from Single-Use Plastics (Plastic Bags and Microbeads): A Review. Mar. Pollut. Bull. 118 (1), 17–26. doi:10.1016/j.marpolbul.2017.02.048
Xu, X., Hou, Q., Xue, Y., Jian, Y., and Wang, L. (2018). Pollution Characteristics and Fate of Microfibers in the Wastewater from Textile Dyeing Wastewater Treatment Plant. Water Sci. Technology 78 (10), 2046–2054. doi:10.2166/wst.2018.476
Xu, X., Jian, Y., Xue, Y., Hou, Q., and Wang, L. (2019). Microplastics in the Wastewater Treatment Plants (WWTPs): Occurrence and Removal. Chemosphere 235, 1089–1096. doi:10.1016/j.chemosphere.2019.06.197
Yonkos, L. T., Friedel, E. A., Perez-Reyes, A. C., Ghosal, S., and Arthur, C. D. (2014). Microplastics in Four Estuarine Rivers in the Chesapeake Bay, U.S.A. Environ. Sci. Technol. 48 (24), 14195–14202. doi:10.1021/es5036317
Yuan, F., Zhao, H., Sun, H., Zhao, J., and Sun, Y. (2020). Abundance, Morphology, and Removal Efficiency of Microplastics in Two Wastewater Treatment Plants in Nanjing, China. Environ. Sci. Pollut. Res. 28, 9327–9337. doi:10.1007/s11356-020-11411-w
Zbyszewski, M., and Corcoran, P. L. (2011). Distribution and Degradation of Fresh Water Plastic Particles along the Beaches of Lake Huron, Canada. Water Air Soil Pollut. 220 (1), 365–372. doi:10.1007/s11270-011-0760-6
Zhan, Z., Wang, J., Peng, J., Xie, Q., Huang, Y., and Gao, Y. (2016). Sorption of 3,3′,4,4′-tetrachlorobiphenyl by Microplastics: A Case Study of Polypropylene. Mar. Pollut. Bull. 110 (1), 559–563. doi:10.1016/j.marpolbul.2016.05.036
Zhang, L., Liu, J., Xie, Y., Zhong, S., and Gao, P. (2021). Occurrence and Removal of Microplastics from Wastewater Treatment Plants in a Typical Tourist City in China. J. Clean. Prod. 291, 125968. doi:10.1016/j.jclepro.2021.125968
Zhang, X., Chen, J., and Li, J. (2020). The Removal of Microplastics in the Wastewater Treatment Process and Their Potential Impact on Anaerobic Digestion Due to Pollutants Association. Chemosphere 251, 126360. doi:10.1016/j.chemosphere.2020.126360
Zhou, H., Zhou, L., and Ma, K. (2020). Microfiber from Textile Dyeing and Printing Wastewater of a Typical Industrial Park in China: Occurrence, Removal and Release. Sci. Total Environ. 739, 140329. doi:10.1016/j.scitotenv.2020.140329
Keywords: wastewater, microplastics, industrial sources, environment management, priority areas
Citation: Long Z, Wang W, Yu X, Lin Z and Chen J (2021) Heterogeneity and Contribution of Microplastics From Industrial and Domestic Sources in a Wastewater Treatment Plant in Xiamen, China. Front. Environ. Sci. 9:770634. doi: 10.3389/fenvs.2021.770634
Received: 04 September 2021; Accepted: 01 November 2021;
Published: 30 November 2021.
Edited by:
Parinda Thayanukul, Mahidol University, ThailandReviewed by:
Mohamed Hassaan, National Institute of Oceanography and Fisheries (NIOF), EgyptZacharias Frontistis, University of Western Macedonia, Greece
Copyright © 2021 Long, Wang, Yu, Lin and Chen. This is an open-access article distributed under the terms of the Creative Commons Attribution License (CC BY). The use, distribution or reproduction in other forums is permitted, provided the original author(s) and the copyright owner(s) are credited and that the original publication in this journal is cited, in accordance with accepted academic practice. No use, distribution or reproduction is permitted which does not comply with these terms.
*Correspondence: Zouxia Long, em91eGlhbG9uZ0B0aW8ub3JnLmNu; Jian Chen, Y2hlbmppYW5AdGlvLm9yZy5jbg==
†Present address: Chongqing Ecological Environment Bureau Liangjiang New Area Branch, Block B5, Yuxing Plaza, No. 52, Huangshan Avenue, Chongqing, 401121, China