 Dominic Fawcett1,2*†
 Andrew M. Cunliffe2†
 Stephen Sitch2Michael O’Sullivan3Karen Anderson1Richard E. Brazier4Timothy C. Hill2Peter Anthoni5Almut Arneth5Vivek K. Arora6Peter R. Briggs7
 Daniel S. Goll8Atul K. Jain9Xiaojun Li10
 Danica Lombardozzi11Julia E. M. S. Nabel12
 Benjamin Poulter13Roland Séférian14Hanqin Tian15Nicolas Viovy16
 Jean-Pierre Wigneron10Andy Wiltshire17
 Soenke Zaehle12
- 1Environment and Sustainability Institute, University of Exeter, Penryn, United Kingdom
- 2Department of Geography, College of Life and Environmental Sciences, University of Exeter, Exeter, United Kingdom
- 3Department of Mathematics, College of Engineering, Mathematics and Physical Sciences, University of Exeter, Exeter, United Kingdom
- 4Centre for Resilience in Environment, Water and Waste, Geography, College of Life and Environmental Sciences, University of Exeter, Exeter, United Kingdom
- 5Karlsruhe Institute of Technology, Institute of Meteorology and Climate, Research/Atmospheric Environmental Research, Garmisch-Partenkirchen, Germany
- 6Canadian Centre for Climate Modelling and Analysis, Environment and Climate Change Canada, Victoria, BC, Canada
- 7Climate Science Centre, CSIRO Oceans and Atmosphere, Canberra, ACT, Australia
- 8Université Paris Saclay, CEA-CNRS-UVSQ, LSCE/IPSL, Gif sur Yvette, France
- 9Department of Atmospheric Sciences, University of Illinois, Urbana, IL, United States
- 10INRAE, UMR 1391 ISPA, Université de Bordeaux, Villenave d’Ornon, France
- 11Climate and Global Dynamics Laboratory, National Center for Atmospheric Research, Boulder, CO, United States
- 12Max Planck Institute for Biogeochemistry, Max Planck Institute for Meteorology, Jena, Germany
- 13NASA GSFC, Earth Science Division, Biospheric Sciences Laboratory, Greenbelt, MD, United States
- 14CNRS, CNRM, Université de Toulouse, Toulouse, France
- 15International Center for Climate and Global Change Research, School of Forestry and Wildlife Sciences, Auburn University, Auburn, AL, United States
- 16LSCE, Université Paris-Saclay, Gif sur Yvette, France
- 17Met Office Hadley Centre, Exeter, United Kingdom
Drylands cover ca. 40% of the land surface and are hypothesised to play a major role in the global carbon cycle, controlling both long-term trends and interannual variation. These insights originate from land surface models (LSMs) that have not been extensively calibrated and evaluated for water-limited ecosystems. We need to learn more about dryland carbon dynamics, particularly as the transitory response and rapid turnover rates of semi-arid systems may limit their function as a carbon sink over multi-decadal scales. We quantified aboveground biomass carbon (AGC; inferred from SMOS L-band vegetation optical depth) and gross primary productivity (GPP; from PML-v2 inferred from MODIS observations) and tested their spatial and temporal correspondence with estimates from the TRENDY ensemble of LSMs. We found strong correspondence in GPP between LSMs and PML-v2 both in spatial patterns (Pearson’s r = 0.9 for TRENDY-mean) and in inter-annual variability, but not in trends. Conversely, for AGC we found lesser correspondence in space (Pearson’s r = 0.75 for TRENDY-mean, strong biases for individual models) and in the magnitude of inter-annual variability compared to satellite retrievals. These disagreements likely arise from limited representation of ecosystem responses to plant water availability, fire, and photodegradation that drive dryland carbon dynamics. We assessed inter-model agreement and drivers of long-term change in carbon stocks over centennial timescales. This analysis suggested that the simulated trend of increasing carbon stocks in drylands is in soils and primarily driven by increased productivity due to CO2 enrichment. However, there is limited empirical evidence of this 50-year sink in dryland soils. Our findings highlight important uncertainties in simulations of dryland ecosystems by current LSMs, suggesting a need for continued model refinements and for greater caution when interpreting LSM estimates with regards to current and future carbon dynamics in drylands and by extension the global carbon cycle.
Introduction
Drylands play an important role in the global carbon cycle and are vulnerable to global climate and land-use changes (Sietz et al., 2011; Ahlström et al., 2015). Yet, despite their importance, we have limited understanding of drylands and their ecological responses to climate change and other drivers (Huang et al., 2017). Defined by their climatic aridity, dryland ecosystems cover ca. 40% of the land surface and are expanding as evapotranspiration increases faster than precipitation (Huang et al., 2016; Archer et al., 2018; Yao et al., 2020; IPCC, 2021). Despite being characterised by relatively low-biomass densities relative to forest biomes, drylands, and particularly semi-arid ecosystems, are thought to dominate both the longer term (>50-year) trend and year-to-year variability in the land carbon sink (Poulter et al., 2014; Ahlström et al., 2015; Piao et al., 2020). There is a pressing need to learn more about the future efficacy of drylands as a sink of anthropogenic carbon emissions (Friedlingstein et al., 2019). Particularly semi-arid ecosystems are thought to have a potentially transitory response to large perturbations causing enhanced uptake followed by rapid turnover of carbon through decomposition and loss through fire (Poulter et al., 2014), implying that they may only have the capacity to function as a significant carbon sink for a finite period (Schlesinger et al., 2009). Drylands furthermore provide provisioning and regulating services that directly support over a third of the human population worldwide (SRCCL, 2020). Many of these people are experiencing increasing insecurity due to the triple threat of climate change, population growth, and increasing pressure on finite natural resources (Huang et al., 2016; Archer et al., 2018; Xu et al., 2020).
There is considerable uncertainty in current and projected storage and fluxes of carbon in drylands (Schlesinger et al., 2009; Haverd et al., 2016; Schlesinger, 2016; Yao et al., 2020). Much of our understanding of the processes behind these global changes relies on simulations of land surface models (LSMs) or dynamic global vegetation models (DGVMs, in this manuscript collectively labelled as LSMs; Ahlström et al., 2015; Piao et al., 2020; Poulter et al., 2014). Yet we know that LSMs often perform more poorly in water-limited drylands relative to energy-limited biomes (Harper et al., 2020; Yang et al., 2020; MacBean et al., 2021). Much of this poorer performance is attributed to incomplete representations of ecosystem responses to plant water availability in terms of carbon inputs (Harper et al., 2020; MacBean et al., 2021) and processes controlling the release of carbon such as fire and photodegradation (Bond et al., 2005; Berenstecher et al., 2020). This is compounded by limitations in parameterisation data on land use and localised precipitation (Yang et al., 2020). This uncertainty is further exacerbated by a backdrop of changing environmental conditions including CO2 fertilization, increasing plant water use efficiency, fire suppression, woody shrub encroachment, and increasingly variable precipitation, leaving considerable uncertainty around the resilience of dryland ecosystem function (Gonsamo et al., 2021; Maestre et al., 2021; Walker et al., 2021).
To constrain uncertainty in predictions of the current and future functioning of dryland ecosystems, further evaluations are needed to assess LSM performance (Forkel et al., 2019; Piao et al., 2020). LSM intercomparison efforts are common and include those that focus on “Trends in net land carbon exchange” (TRENDY) (Sitch et al., 2015). However, historically there has been a lack of observational data from water-limited drylands, and the data that do exist have not been extensively used for evaluating model performance in these settings (Ciais et al., 2011). New satellite-derived datasets have recently become available with global coverage over recent decades (Smith et al., 2019). For example, productivity describes the uptake of carbon by the ecosystems and can be inferred from satellite observations using light use efficiency models. Critically, light use efficiency is modulated by changing atmospheric carbon dioxide concentrations (Long et al., 2004). The PML-v2 gross primary productivity (GPP) product is modelled based on MODIS observations and has been demonstrated to have less error compared to other products with regards to site-level eddy covariance observations (Gan et al., 2018; Zhang et al., 2019a). Most evaluations of LSM performance have focused on fluxes rather than carbon stocks (Blyth et al., 2011; Yang et al., 2020; Yao et al., 2020; MacBean et al., 2021). Vegetation optical depth (VOD) provides a metric for vegetation structural characterisation, by measuring the attenuation of microwaves by water content in vegetation (Chaparro et al., 2019). Recent studies have found L-band frequency (1–2 GHz or 15–30 cm wavelength) VOD (L-VOD) is strongly related to aboveground biomass carbon (AGC) in dryland ecosystems (Brandt et al., 2018). Another advantage of this product is its multi-year availability, which is imperative for evaluating trends and interannual variability in biomass carbon stocks.
The long-term trends of dryland carbon stocks over centennial timescales and their future state is critically important yet highly uncertain given their potential transitory responses. However, these timescales lie beyond the temporal limit of widespread observational data, hindering evaluations of LSM estimates. To assess model performance and evaluate long-term changes in dryland carbon stocks, we undertook a model intercomparison. By evaluating the consistency of different model estimates over time, we can better constrain the uncertainty associated with ensemble estimates over multi-decadal periods. If different models agree, this increases confidence in their ensemble predictions over longer timescales. Conversely, if models differ over time, then ensemble predictions should be treated with caution and different ways of assessing models should be selected by considering them as falsifiable hypotheses (Goldstein et al., 2013).
This study aims to investigate the correspondence between simulated and retrieved productivity and biomass carbon in dryland landscapes. Specifically, we addressed the following questions:
1) How well are TRENDY models able to reproduce a) spatial distribution, b) temporal trends, and c) interannual variability in GPP compared to estimates from the satellite-derived PML-v2 product?
2) How well are TRENDY models able to reproduce a) spatial distribution, b) temporal trends, and c) interannual variability in aboveground vegetation carbon compared to estimates from the satellite-derived L-VOD product?
3) How consistent are TRENDY simulations of vegetation and soil carbon stocks among models through time?
Methods
Dryland Delineation
We classified climatic drylands based on the aridity index, using a threshold of <0.65 for the ratio of mean annual precipitation (P) to mean annual potential evapotranspiration (PET) (Yao et al., 2020) calculated using the 2.5 arc minutes 1981–2010 TerraClimate mean gridded surface climatology (Abatzoglou et al., 2018). The fine grain of the TerraClimate product corresponded more closely to physical reality than coarser resolution products (Supplementary Table S1 for details of these gridded products). We excluded drylands >55° north and south of the Equator to omit “cold” permafrost drylands, resulting in a global dryland area of 59.1 × 10⁶ km2. While LSMs do not always simulate drylands exactly coincident with this climatic mask, this masking approach is standard (e.g., Ahlström et al., 2015; Yao et al., 2020; Gonsamo et al., 2021).
Gross Primary Productivity From MODIS
We used the PML-v2 (v016) GPP product derived using a light use efficiency model based on MODIS observations (Zhang et al., 2019a). This product has a spatial resolution of 500 m, revisit frequency of 8 days, and was available from 26/03/2000 to 26/12/2020. Importantly, the PML-v2 product couples evapotranspiration and GPP resulting in a more robust estimation of GPP while partly accounting for water use efficiency, and explicitly accounts for the influence of changing CO2 concentration on carbon assimilation via a simplified photosynthesis model (Gan et al., 2018). PML-v2 has been evaluated at 95 eddy covariance flux tower sites, 40 of which lie within our delineated drylands (Zhang et al., 2019a). Over the 95 sites, PML-v2 outperformed other GPP products available at the time for 8-day and site mean GPP, with smaller bias, lower RMSE, and higher R2 compared to the MOD17A2H, FluxCom GPP, and VPM GPP products; (Zhang et al., 2019a), while performance regarding annual anomalies was comparable. We calculated annual integrated productivity for spatial comparison with the LSM predictions and temporal analysis.
Above Ground Carbon Density From L-Band Vegetation Optical Depth
We inferred AGC in biomass from L-VOD retrieved from the Soil Moisture and Ocean Salinity (SMOS) mission L-band observations from 2011 to 2018 (SMOS-IC V2; Wigneron et al., 2021; Figure 1). Soil moisture and L-VOD are derived from a two-parameter inversion of the L-MEB model (L-band microwave emission of the biosphere) from the multi-angular and dual-polarized SMOS observations (Wigneron et al., 2021). The SMOS-IC products are mostly independent of other Earth observation datasets or simulations from atmospheric models (Wigneron et al., 2021). The L-VOD product consists of ascending and descending orbit datasets with a maximum 3-day revisit time. L-VOD is sensitive to radio frequency interference (RFI) over some specific geographic regions (particularly central Asia and southern Europe) and noise when retrieved over areas of variable topography or frozen ground (Fernandez-Moran et al., 2017). L-VOD data require filtering to retrieve reproducible signals, so we filtered observations by quality flags to exclude pixels containing more than 10% water, ice, or urban land cover (based on the MODIS MCD12Q1 product and IGBP classification scheme), extreme topography (Mialon et al., 2008) and frozen ground (ECMWF soil temperature <273 K) (Fernandez-Moran et al., 2017). L-VOD retrievals above a noise threshold between measured and L-MEB modelled brightness temperature values (8 K) were discarded to remove strong RFI (Fernandez-Moran et al., 2017). We selected four regions with sufficient data coverage (North America, South America, Australia, and Africa) and total dryland area 37.9 × 10⁶ km2, as RFI precluded reliable retrieval of L-VOD in other dryland regions. Filtered observations (mean of 102 per pixel annually) were aggregated to annual median ascending and descending L-VOD. Where fewer than 20 observations per year were available, the pixel was excluded (Brandt et al., 2018). Large differences between annual average ascending and descending L-VOD can indicate remaining RFI, therefore pixels where this difference was greater than 0.05 L-VOD were excluded. This filtering also excluded a part of North America due to an L-VOD anomaly in 2011. L-VOD retrievals are sensitive to both vegetation biomass and water stress (Konings et al., 2019). However, we expect trends in annual median L-VOD to be largely unaffected by inter-annual variability in vegetation water content. We assume that any trend in vegetation water content would correspond to a trend in vegetation biomass in these predominantly water-limited ecosystems (Abel et al., 2021; Frappart et al., 2020). We assumed a linear relationship between plant water content and biomass in these generally sparsely vegetated drylands, which was supported by the findings of (Brandt et al., 2019; Fan et al., 2019; Konings et al., 2017; Liu et al., 2015; Mialon et al., 2020; Rodríguez-Fernández et al., 2018; Tian et al., 2016). Annual average carbon density (Mg C ha−1) was estimated from ascending L-VOD, which is acquired at dawn when plant water storage usually peaks (Tian et al., 2018). Equation 1 was used to estimate AGC which was derived from an OLS regression of L-VOD against a global biomass map (Santoro et al., 2018), converted to AGC following the 47% biomass:carbon density ratio (Paustian et al., 2006; Chave et al., 2019). We developed a drylands-specific biomass transfer function because previous linear models (e.g., Brandt et al., 2018) calibrated against data including high-biomass ecosystems like tropical forests tend to overestimate dryland biomass (Supplementary Figure S3). The GlobBiomass map was selected as it showed a higher correlation with L-VOD for drylands than available alternatives (Supplementary Table S2).
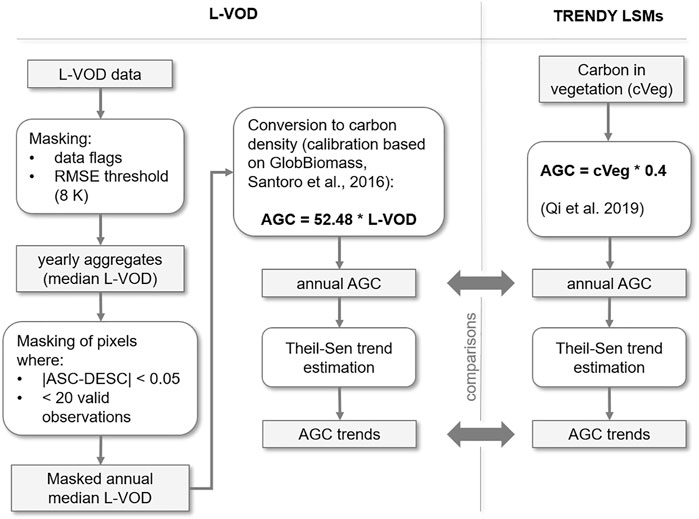
FIGURE 1. Processing of L-VOD data and TRENDY simulated above ground carbon (AGC) to obtain annual average carbon density and trends. ASC and DESC refer to ascending and descending L-VOD data. Bold arrows indicate products compared.
Land Surface Models Simulated Productivity and Biomass
To test the correspondence of state-of-the-art LSMs with retrieved biomass and productivity estimates, we used the simulation outputs from 12 LSMs from the TRENDY v8 project (Friedlingstein et al., 2019). This TRENDY ensemble of models includes CABLE-POP, CLASS-CTEM, CLM5.0, DLEM, ISBA-CTRIP, ISAM, JSBACH, JULES-ES-1.0, LPJ-GUESS, OCN, ORCHIDEE, and ORCHIDEE-CNP (Supplementary Table S3 for details). For these comparisons we focused on the most comprehensive simulations with time-varying CO2, observed climate and land-use forcing (TRENDY “S3” simulations). Using the ensemble mean of these LSMs allows us to filter some of the inter-model variability to examine the overall model estimates. Six of these models include representation of fire processes [Supplementary Table S3 and (Friedlingstein et al., 2019) for details]. We annually aggregated GPP and mean annual biomass of the LSMs, from 01/01/2001 to 31/12/2018 and 01/01/2011 to 31/12/2018 respectively. We used AGC where this was quantified by the LSMs (CABLE-POP, CLASS-CTEM, CLM, ISAM). For the LSMs that did not explicitly partition carbon into above and below pools in TRENDYv8 outputs, we assumed 40% of simulated total biomass carbon was aboveground, using the average root to shoot ratios of grasslands, shrublands, savannas and woody savanna biomes that together dominate total dryland biomass (Liu et al., 2015; Qi et al., 2019). Though this ratio will vary regionally according to environmental factors and plant functional types, there is insufficient information available to enable accurate spatially explicit exploration.
Land Surface Models Intercomparison
To assess the implications of different model simulations over climate-relevant time scales, we evaluated changes in predicted soil C (cSoil, including necromass as litter and coarse woody debris where simulated), vegetation carbon (cVeg), and net ecosystem (cEco = cSoil + cVeg) stocks from 1901 to 2018. At the end of this period, we quantified how much each model diverged from the TRENDY mean in units of standard deviation of the ensemble mean (Goldstein et al., 2013). We excluded ISBA-CTRIP from this portion of the analysis because this model had issues with 1) insufficient soil carbon storage under trees and 2) high productivity of crops causing excessive soil inputs (Boysen et al., 2020) (subsequently resolved by the addition of a crop sub-model). To diagnose the causes of the differences in simulated carbon stocks over time and between models, we isolated the effects of CO2, climate change, and land-use change by looking at the contribution associated with the TRENDY “S1” (including CO2 forcing), “S2” (including CO2 and climate change forcing), and “S3” simulations (Friedlingstein et al., 2019).
Fire
To understand the extent to which model-data differences in GPP and AGC related to fire, a process not represented in all LSMs, we investigated these spatially in relation to fire frequency. Using the most recent MCD64A1 version 6 burned area product (Giglio et al., 2015), we calculated the sum of the burned area between 2001 and 2018 per 1° grid cell and divided it by the length of the data record. This period was chosen to best encapsulate the influence of fires on GPP and AGC.
Statistical Analysis
We tested the spatial correspondence between LSM simulations and biomass carbon retrieved from L-VOD or GPP retrieved from MODIS respectively. To maintain a consistent sample size across models, we used bilinear interpolation to resample the outputs from TRENDY models to a common spatial resolution of 1°. To appropriately handle boundary effects and partial coverage due to quality filtering of satellite retrieved L-VOD and GPP, we computed weights for the model pixels using the “exactextractr” package in R (Baston, 2020, v0.5.1). We computed weighted pairwise Pearson’s r (R package “weights”, Pasek, 2020, v1.0.1), and used weighted total least squares regression (R package “deming”, Therneau, 2018, v1.4) to fit linear models that account for uncertainty on both axes to quantify the agreement as the slope of the fitted model.
To test the temporal correspondence at annual resolution between biomass carbon inferred from L-VOD and simulated with LSMs and between GPP inferred from MODIS and simulated with LSMs, we summed the weighted dryland values at the native spatial resolution of each dataset using “exactextractr”, and for the biomass comparison considered only the areas with reliable L-VOD data for all years (Figure 1 and Supplementary Figure S2). We quantified bias as the mean error between the summed model predictions and the satellite retrievals. Both GPP and AGC measurements were highly sensitive to the approaches used to resample data. Sensitivity analysis revealed that the inclusion or exclusion of cells only partially within our spatial region of interest potentially introduces a 6-fold difference in the total productivity and biomass retrieved for drylands (Supplementary Figures S17–19). To minimise this issue when undertaking this analysis across datasets with different native resolutions, we used weighted extraction methods to account for the partial coverage of cells within a mask.
We used a Theil-Sen estimator to robustly fit linear models to the time series of productivity and AGC (Myers-Smith et al., 2020). To assess correspondence in inter-annual variability, we normalised each time series to its mean and detrended the series using the Theil-Sen model slope. The goodness-of-fit was then quantified as the mean absolute error between the series.
Results
Correspondence in Gross Primary Productivity
We found good spatial correlation between the mean GPP PML-v2 inferred from MODIS observations and GPP simulated by the TRENDY model ensemble (Figure 2; Table 1) over arid and semi-arid regions between 2001 and 2018. Correlation coefficients were moderately high across the 12 models, with Pearson’s r ranging from 0.71 to 0.90. The spatial patterns shown in Figure 2B are common across most LSMs (Supplementary Figure S6), with overestimation of productivity in the African Sahel and underestimation of productivity in southern African and South American drylands. The linear model slopes between the model and the satellite retrievals ranged from 0.56 to 1.18. The TRENDY mean exhibited strong correspondence with the satellite retrievals, with r of 0.9 and a slope of 0.88. We found no overarching relationship between fire frequency and bias in GPP although several models (JULES, CLASS-CTEM, ORCHIDEE-CNP, and OCN) did systematically overestimate GPP in more frequently burned areas (Supplementary Figure S11).
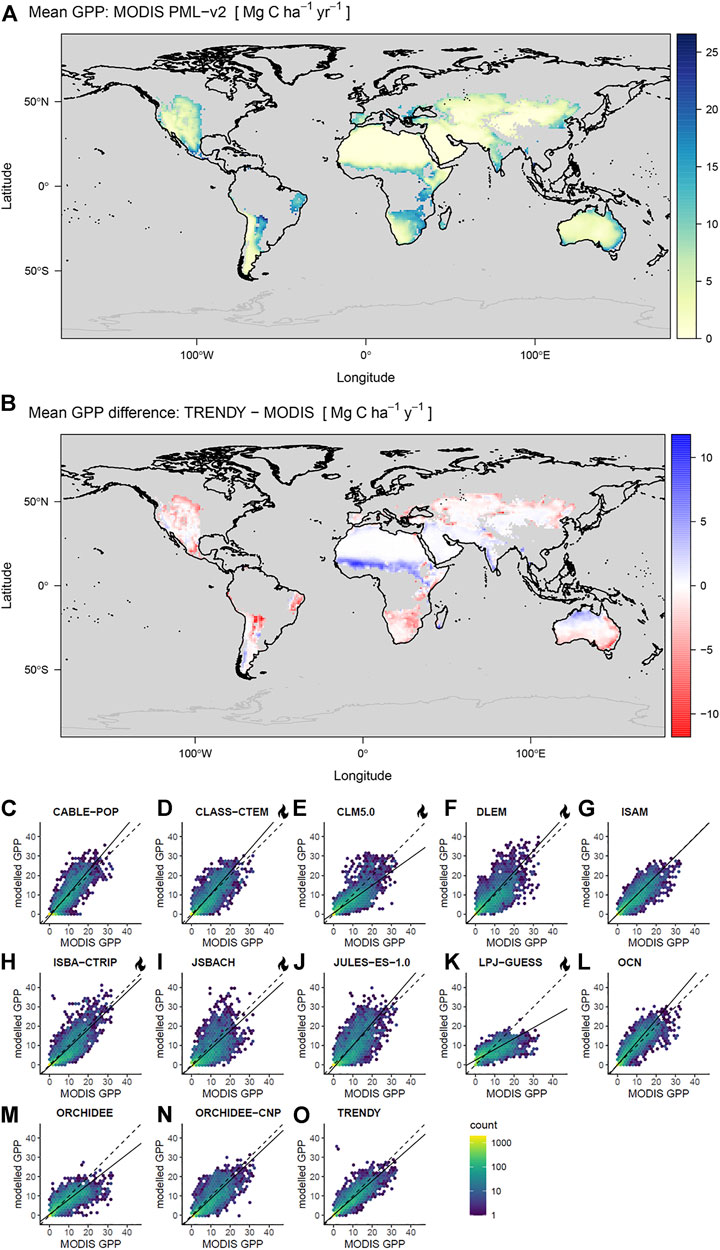
FIGURE 2. (A) Mean productivity retrieved from MODIS PML-v2, (B) difference between MODIS PML-v2 minus TRENDY-mean productivity over arid and semi-arid regions. The regions analysed are shown in bold. (C–O) Pairwise pixel covariance in annual GPP means over global dryland regions (2001–2018) estimated from MODIS PML-v2 and TRENDY models, displayed as counts per hexagonal bin. Dashed lines represent 1:1, and solid lines are linear models fitted with total least squares. Units are GPP (Mg C ha−1 y−1) and all means are calculated over the common 2001–2018 time period. Note that in (C–O) models are fitted to weighted values but weights are not illustrated while (A,B) include only grid cells with centroids within the dryland mask. LSMs with explicit representation of fire are indicated with a flame icon.
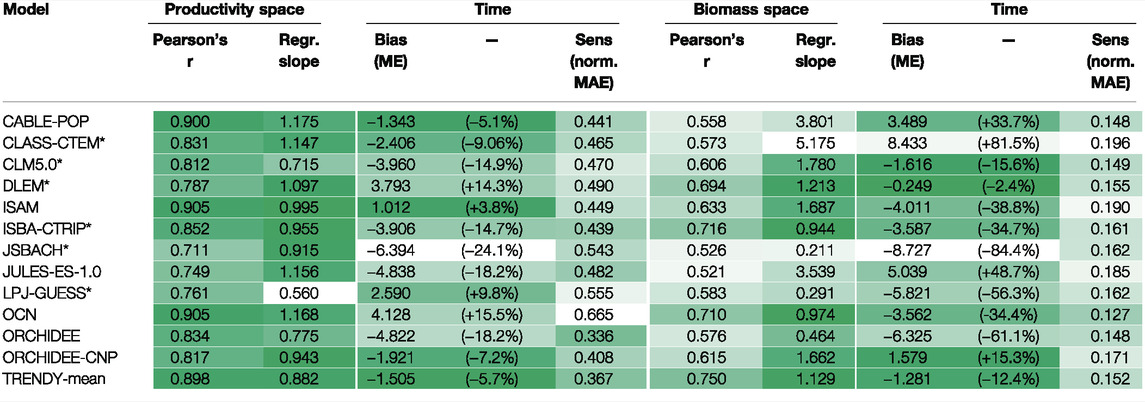
TABLE 1. Correspondence between model simulations and satellite retrieved GPP and AGC from MODIS PML-v2 and L-VOD respectively. Where Pearson’s r indicates the weighted Pearson’s r, slope is the slope of the linear model fitted to the pairwise pixel comparison with weighted total least squares regression, bias in time is the mean error of the annually aggregated values (percentages in brackets show the relative error), and the sensitivity to interannual variability is quantified by the mean-normalised mean absolute error. Shading indicates the relative performance of each model, with darker shading indicating better correspondence. Regression slopes were shaded by their log10 absolute value. * indicates models including explicit representation of fire.
We found strong correspondence in inter-annual anomalies in GPP between MODIS-derived and all TRENDY models between 2001 and 2018. There was relatively little bias in mean GPP between the TRENDY mean and MODIS PML-v2 product (ME −1.5 Pg C yr−1, 5.7%) (Figure 3C; Table 1). All 12 models and consequently the TRENDY-mean exhibited positive trends in productivity over time (11 of 12 trends were significant at α 0.05), while the retrieved GPP had no trend over the 18 years (Figure 3A, Supplementary Table S4). GPP trends differed spatially, increasing in some areas and decreasing in others (Supplementary Figures S5, S7).
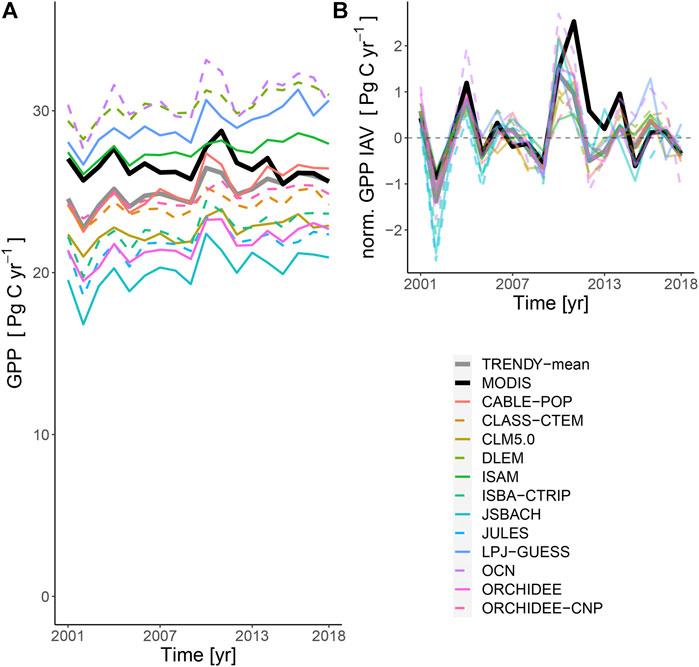
FIGURE 3. (A) Time-series of mean annual GPP (2001–2018) of global drylands for the satellite retrieval and TRENDY models (including TRENDY mean). All 12 models simulate increasing GPP over time whereas MODIS-retrieved GPP had no clear trend. (B) The mean-normalised detrended time series show good agreement in interannual differences for all models.
Correspondence in Aboveground Biomass Carbon
We found often poor agreement in the spatial patterns of remotely-sensed and model-simulated biomass for the regions analysed (Africa, Australia, North and South America) (Figure 4, Table 1). Correlation coefficients were moderate across the 12 models, with Pearson’s r ranging from 0.52 to 0.75. The bias between the models and the satellite retrievals was often extreme, with most models exhibiting substantial bias and linear model slopes ranging between 0.2 and 5.2. The TRENDY mean exhibited slightly stronger correspondence with the satellite retrievals, with r of 0.75 and a slope of 1.13. For most models, we found little relation between observed burn frequency and model - data residuals, apart from JULES and CLASS-CTEM which overestimated biomass in more frequently burned regions (Supplementary Figure S12).
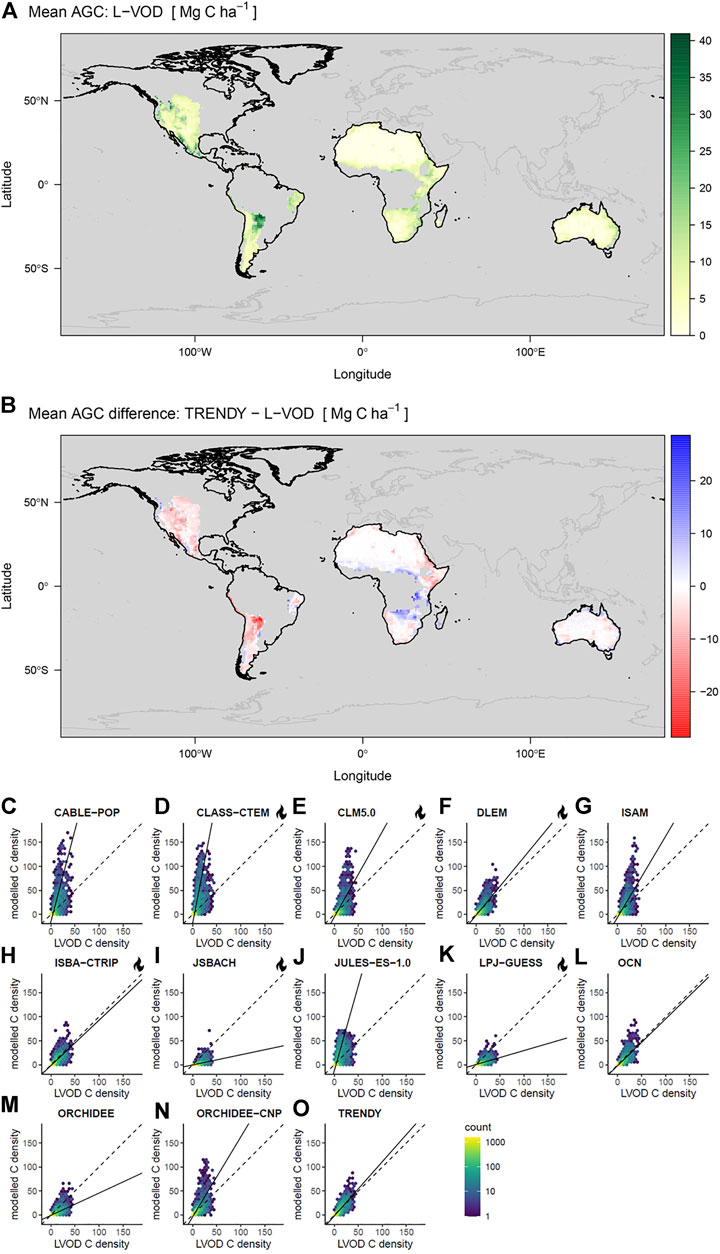
FIGURE 4. (A) mean biomass inferred from L-VOD, (B) difference between L-VOD retrieval and the TRENDY mean AGC, the regions analysed are outlined in black with other regions excluded due to higher RFI. (C–O) Pairwise pixel covariance in mean AGC density estimated from L-VOD versus modelled values over the focal dryland regions, displayed as counts per hexagonal bin. Dashed lines represent 1:1 on the carbon density plots and solid lines are linear models fitted with total least squares. Units are biomass carbon density (Mg C ha−1) and means are calculated over the 2011-2018 period. Note that in (C–O) models are fitted to weighted values but weights are not illustrated while (A,B) include only grid cells with centroids within the dryland mask. LSMs with explicit representation of fire are indicated with a flame icon.
Detection of temporal change in biomass was hindered by the short (2011–2018) period included in the L-VOD product. There was generally poor agreement in the temporal patterns of simulated and remotely-sensed above ground carbon. There was a large range in bias between models and the satellite retrieval with MEs from −8.7 to 8.4 Pg C (−84.4 and 81.5%). Although inter-annual anomalies in AGC generally had the same sign across the L-VOD retrieval and TRENDY models (for the TRENDY mean the sign of the anomaly was consistent between TRENDY and the L-VOD in 88% of the time series), most LSMs had much smaller anomalies from the mean compared to the larger anomalies in the L-VOD-derived values (Figure 5). There were no meaningful trends in the time series of AGC; the few that were statistically significant had negligible effect sizes (Supplementary Table S4).
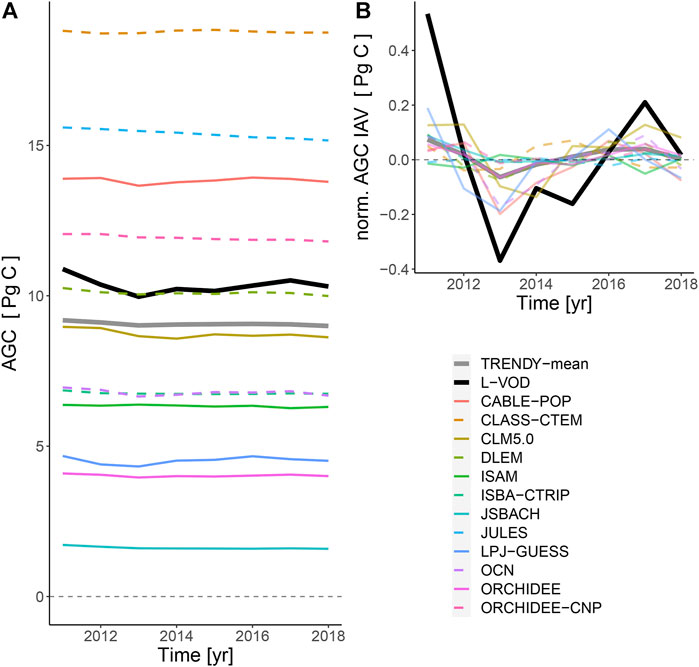
FIGURE 5. (A) Time-series of aboveground carbon (2011–2018) in African, American and Australian drylands for the retrieval (black bold line) and models of the TRENDY ensemble. There was substantial bias between most models and models were less sensitive to temporal changes in AGC compared to the L-VOD retrieval. (B) The mean-normalised detrended time series show weak agreement in interannual differences for all models.
Simulated Dryland Carbon Stocks Through Time
The land surface models predicted a net gain of ecosystem carbon in global drylands (mean 3.37 Pg C), due to an increase in soil carbon (mean 6.35 Pg C) that exceeds the losses in vegetation carbon (mean −2.98 Pg C) over the last 118 years (1901–2018) (Figures 6, 7, Supplementary Table S5). There was a wide range of carbon accumulation responses across the TRENDY models (Supplementary Table S5). The overall loss in simulated vegetation carbon was predominantly driven by the influence of land-use change, exceeding the increase simulated due to CO2 fertilization (Supplementary Figure S13). Climate change had minimal effect on the simulated dryland vegetation carbon stocks. The overall increase in simulated soil carbon was predominantly driven by the increase in litter inputs into the soil associated with the increase in net primary productivity due to CO2 fertilization, with most models predicting a small reduction due to climate change (Supplementary Figure S14). The influence of land-use change on soil carbon was more varied between model simulations, with the majority showing a reduction. The overall increase in simulated ecosystem carbon was predominantly driven by the influence of CO2 fertilization, exceeding the losses predicted due to both land-use change and, to a lesser extent, climate change (Figure 6 and Supplementary Figure S15). Overall, dryland carbon stocks are simulated by models to have decreased by an average of 3.82 Pg C from 1901 to late-1960, before subsequently increasing by 7.19 Pg C up to 2018 as the CO2 fertilisation effect increases simulated GPP in response to increasing atmospheric CO2 concentrations.
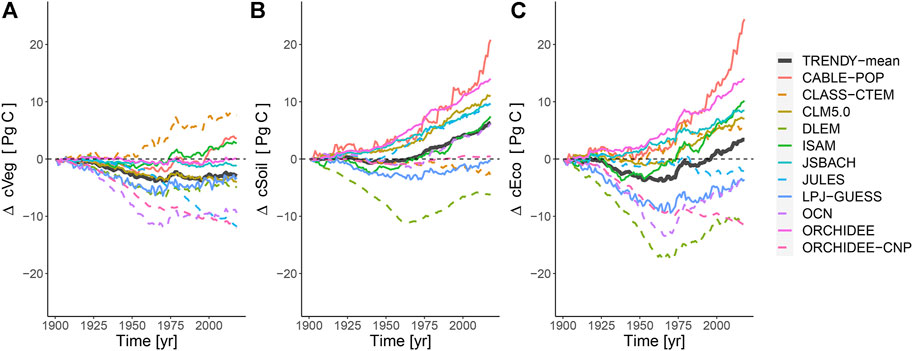
FIGURE 6. Time-series of changes in (A) vegetation carbon, (B) soil carbon and (C) ecosystem carbon storage (soil plus vegetation) in global drylands between 1901 and 2018 as simulated by the models of the TRENDY ensemble. The divergence is shown relative to 1901. On average the models simulate an overall increase in ecosystem carbon over the century, particularly in the latter 70 years.
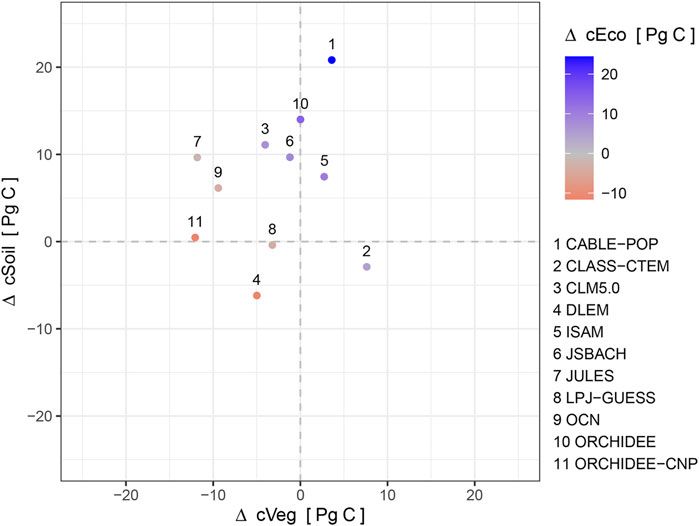
FIGURE7. Comparison of changes in simulated vegetation and soil carbon in global drylands from 1901 to 2018. Points are coloured by the net change in ecosystem carbon, illustrating the diversity of model predictions within the ensemble.
Discussion
In this study, we investigated the correspondence between LSM simulated values, a MODIS productivity product (2001–2018) and L-VOD derived AGC (2011–2018) in climatic drylands as well as the agreement of model projections of dryland carbon stocks (1901–2018). We examined LSMs’ performance in terms of their ability to simulate the spatial distribution of GPP and AGC alongside the temporal trends and variability of these quantities over arid and semi-arid regions. GPP appears to be reasonably well simulated, compared to estimates from the MODIS PML-v2 product, in most LSMs. However, there were differences in simulated aboveground carbon stocks and their trends compared to the estimate from the L-VOD product. Large differences potentially arise from insufficient constraints impacting the representation of carbon allocation and release processes.
Gross Primary Productivity
Our results suggest that carbon uptake (GPP) by dryland ecosystems is broadly well represented by LSMs at the global scale. We found good agreement in the spatial distribution of GPP between simulated LSM estimates and MODIS based PML-v2 values in drylands for most models. Correlation coefficients were high and bias was low, especially for the TRENDY ensemble average. Our finding that spatial patterns of GPP were broadly in agreement was consistent with previous evaluations of other MODIS-derived GPP products against GPP observations from dryland eddy covariance flux towers in North America (Biederman et al., 2017). Geographic biases were consistent across most LSMs, with overestimation of productivity in the African Sahel and underestimation of productivity in drylands in southern Africa and South America.
We found very strong agreement in GPP interannual variability between LSM-simulated values and those modelled based on satellite observations of photosynthetic capacity (Figure 3B; Table 1), including the large 2 Pg C yr−1 positive anomaly in 2010–11 caused by a severe La Niña event (Poulter et al., 2014; Haverd et al., 2016). This agreement lends some confidence that globally, LSMs capture the predominant dynamic responses controlling inputs of carbon into dryland ecosystems in response to annual-scale perturbations. However, the agreement found in IAV in GPP at the global scale contrasts with the disagreement in IAV at the site level where both MODIS and LSM simulated productivity have been found to underestimate IAV. Using eddy covariance observations from 25 dryland sites in North America, Biederman et al. (2017) found IAV in GPP was underestimated by MODIS-derived GPP. Similarly using observations from 12 eddy covariance sites in the southwestern U.S., MacBean et al. (2021) concluded LSMs underestimate IAV in dryland net ecosystem exchange. These findings underscore the ongoing need for further development and evaluations of remotely sensed GPP products in drylands (Smith et al., 2019).
All 12 LSMs consistently estimated a positive trend in dryland GPP between 2001 and 2018 (Figure 3; Table 1), mainly due to simulated CO2 fertilization (Supplementary Figure S16). The CO2 fertilization effect has been identified for drylands using satellite measurements (Donohue et al., 2013). Models predict a direct CO2 fertilization effect (reduced photorespiration) and in water-limited systems stomatal closure for the same gain in CO2 implies a longer growing season and higher annual productivity (Gonsamo et al., 2021), as expected from theory (Prentice et al., 2001). However, there was no trend in the satellite retrieved PML-v2 GPP product over this time. The discrepancy in GPP trends between models and PML-v2 was most pronounced in the Sahel region, where PML-v2 GPP decreased and LSM-simulated GPP increased (Supplementary Figure S7). While the PML-v2 product represents the effects of increasing CO2 concentration on GPP (Zhang et al., 2019a), a comprehensive review of the effects of CO2 enrichment on GPP by Walker et al. (2021) suggests that most remotely sensed GPP products are insufficiently sensitive to increasing CO2. Satellite-retrieved GPP products are derived from light use efficiency models which have limitations (Smith et al., 2019; Baldocchi, 2020; Walker et al., 2021), one being the often very heterogeneous patterns of dryland vegetation and soil background signal giving rise to uncertainties, particularly in leaf area index estimations at the coarser spatial resolutions of the satellite pixels (Smith et al., 2019). Furthermore, the observations of evapotranspiration, energy, and carbon fluxes used for calibrating satellite retrieved GPP products and some of the LSMs are observed at relatively few locations globally, with short time-series, insufficient replication, and sampling biases that under-represent highly dynamic dryland ecosystems (Schimel et al., 2015; Hill et al., 2017; Jung et al., 2020). The undersampling of semi-arid settings in particular has been suggested to have a large impact on GPP upscaling errors (Jung et al., 2020).
Aboveground Biomass Carbon
Although we found reasonably good spatial agreement in AGC between L-VOD retrieved and average LSM (TRENDY-mean, Pearson’s r: 0.75), individual models exhibited poor agreement both with each other and with the satellite-derived estimates (Figure 4; Supplementary Figure S8; Table 1). We found large biases in total AGC between models (Figure 5A). To some extent, inter-LSM differences arise from different representations of land surface processes (Sitch et al., 2008), for example, their representation of fire and land-use change, and native model resolutions that influence PFT fractions within grid-cells along dryland fringes or vegetation transition zones (Supplementary Figures S17–19). These factors also influence simulated residence times (Friend et al., 2014) and ecosystem respiration, explaining why LSMs that show better correspondence with the PML-v2 product for GPP do not necessarily correspond better for AGC (Table 1).
To improve the evaluation of LSM vegetation carbon stock predictions in low biomass drylands, further efforts are needed to improve the accuracy and validation of satellite-derived AGC products. A recent review concluded existing aboveground biomass products are almost entirely inconsistent across dry forests, savannas, and grasslands (Zhang et al., 2019b). Uncertainties arise from insufficient data on non-forest vegetation for calibration and validation as well as the insensitivity of remotely sensed observations to low biomass ecosystems (Duncanson et al., 2019; Cunliffe et al., 2021). Furthermore, comparisons between LSM predictions and AGC maps are strongly influenced by root-shoot ratios. These ratios are poorly constrained by observations, particularly in drylands (Qi et al., 2019), and also vary under different environmental conditions in response to differences in atmospheric CO2, aridity and grazing pressure, amongst other factors (Mokany et al., 2006; Yan et al., 2020; Yan et al., 2021). The impact of different root-shoot ratios also relates to the functional role of roots in LSMs. For many models, root biomass does not impact function such as explicit water uptake (Warren et al., 2015), therefore adding root biomass would merely add a greater respiratory cost to the plants and lead to lower allocation to photosynthetic material (leaves) and reduced net primary productivity (Sitch et al., 2003).
Over the relatively short (8-year) time series, there was no clear trend in AGC but the year-to-year anomalies (IAV) were mostly consistent in terms of sign between models and L-VOD AGC. The positive anomaly in 2011 was largely driven by the influence of the La Niña in Australia (Poulter et al., 2014; Haverd et al., 2016). These results could imply that LSMs capture the response to key drivers on carbon inputs via photosynthesis but not necessarily the allocation between above and belowground biomass or the processes that release carbon from these environments (e.g., respiration, fire, photodegradation). The L-VOD AGC anomalies have considerably higher amplitude than those of the LSMs. It is possible that the amplitudes of L-VOD-inferred anomalies may be exaggerated by variations in plant water stress, even though the L-VOD was averaged annually. The difference in amplitudes is furthermore sensitive to the biomass-transfer function used to calibrate the L-VOD data [e.g., linear, see this study (Supplementary Figure S3) and Brandt et al. (2018), or sinusoid, Fan et al. (2019)] and L-VOD data filtering. As L-VOD is a relatively recent product, methods for processing and analysing the data to best understand ecological functions are still being developed. Although longer time-series of VOD products exist, based on C, X, and Ku band microwave data, they have limitations such as increased sensitivity to water stress of foliage (Momen et al., 2017) and the necessity for intercalibration of different satellite instruments and measurements (Moesinger et al., 2020).
Long-Term Carbon Stock Predictions
Simulated dryland vegetation carbon stocks varied between LSMs and decreased on average between 1901 and 2018 (Figures 6, 7) because reductions mainly due to land-use change exceeded the gains caused by CO2 fertilization, while climate change had minimal effect in most models (Supplementary Figure S13). Dryland soil carbon stocks increased since 1970 despite being negatively impacted by land-use change in drylands such as the conversion of native woodlands to pasture and cropland which are often associated with degradation and can lead to decreased carbon input into soils (Cowie et al., 2011) (Supplementary Figure S14). These reductions in soil carbon from land-use change were counteracted by inputs from increased vegetation productivity due to CO2 fertilization (Figures 6, 7, and Supplementary Figure S15) (Walker et al., 2021), resulting in soil carbon dominating the increasing trend in LSM simulated dryland ecosystem carbon storage (Figure 6). However, current ecosystem models are considered to poorly capture the complex interactions between CO2 fertilization and soil organic carbon stocks (Terrer et al., 2021). With a lack of long-term observations, it is difficult to be confident in the role of dryland soils in climate-carbon feedbacks. This highlights the need for longer-term observational efforts to be able to verify these model estimates. Furthermore, we found large differences in the change in modelled carbon stocks of dryland ecosystems over centennial timescales between the different LSMs (Figures 6, 7). This level of disagreement in the change in carbon stocks when hindcast using relatively well-constrained climatology, CO2 concentrations and land use is concerning because it undermines confidence in prognostic applications of these LSMs to even more uncertain future scenarios.
Improving Process Representations in Modelled Drylands
Fire is a critical process in many, but not all, dryland ecosystems, responsible for maintaining a stable ecological state in savanna ecosystems and is a major cause of carbon release (Bond et al., 2005; Lasslop et al., 2020). Land surface models increasingly include explicit representation of fire, including six of the twelve models considered here. Our analysis of these simulations found that the models with explicit fire did not show systematically better agreement with either GPP or AGC retrieved from remote sensing (Table 1). We found little systematic relationship between observed burn frequency and GPP residuals, although some models (JULES and CLASS-CTEM, ORCHIDEE-CNP, and OCN) did overestimate GPP in more frequently burned areas (Supplementary Figure S11). There was generally no relation between observed burn frequency and AGC residuals, apart from JULES and CLASS-CTEM which overestimated biomass in more frequently burned regions (Supplementary Figure S12). These results are consistent with the fire model intercomparisons (FireMIP), which found that while explicit fire substantially improved model-data correspondence in some regions (especially in functional drylands in South America that are excluded by our climatic definition of drylands) it worsened correspondence in other regions (Hantson et al., 2020). Vegetation models which lack explicit representation of fire contain compensatory biases which partially account for the effects of fire (Burton et al., 2019; Rabin et al., 2017). “LSMs that represent fires still do so insufficiently. For example, fire-enabled LSMs were not able to capture the global trend in burnt area (Andela et al., 2017). Uncertainties also remain regarding remote sensing observations with commonly used 500 m spatial resolution fire products significantly underestimating area burnt and fire carbon emissions (Ramo et al., 2021). Improvements to the representation of fire in LSMs are both needed and anticipated as better remotely-sensed fire products become available and we learn more about the compensatory biases present within current LSMs (Burton et al., 2019; Hantson et al., 2020; Lasslop et al., 2020).”
Simulations of terrestrial ecosystem processes in these LSMs struggle to capture many aspects of carbon dynamics in ecosystems that are subjected to severe water stress (Harper et al., 2020; MacBean et al., 2021). Limitations in model simulations of plant responses to water availability have been highlighted by MacBean et al. (2021) and Harper et al. (2020). For example, the plant functional types simulated in most models do not represent the ecophysiological adaptations present in most dryland vegetation communities (such as stomatal control and drought phenology), and simulated soils and rooting schemes are usually too shallow for these ecosystems. Furthermore, most LSMs have poor or no representation of biological soil crusts which are increasingly recognised to play critical roles in drylands including contributing ∼0.6 Pg yr−1 of C to global net primary productivity (Chamizo et al., 2012; Rodriguez-Caballero et al., 2018). This is likely a reflection of a historical emphasis/bias of models to temperate forest phenology combined with a lack of empirical data. Differences in simulated vegetation dynamics also lead to erroneous estimates of fractional cover in key areas.
There are other processes thought to be important in drylands that LSMs do not represent. For instance, solar radiation interacting with plant litter causes photodegradation that emits gaseous carbon. Empirical evidence from decomposition (Austin & Vivanco, 2006; Day et al., 2018, 2019; Méndez et al., 2019; Berenstecher et al., 2020) and eddy covariance (Rutledge et al., 2010; Adair et al., 2017) studies suggests that photodegradation accounts for somewhere between 10% and 50% of gaseous carbon emissions in the semiarid ecosystems that dominate IAV and trends in dryland carbon dynamics (Poulter et al., 2014; Ahlström et al., 2015). Photodegradation is therefore an important aspect of carbon emission in seasonally arid ecosystems that is not currently represented in LSMs, despite their inclusion of insolation and litter pools. As the simulated long-term trends in ecosystem carbon stocks are dominated by cSoil (including litter) (Figures 6, 7), explicit representation of photodegradation would improve simulations of carbon dynamics in drylands.
Conclusion
The potential significance of drylands for the global carbon budget highlights the need for an improved understanding of how well LSMs simulate the carbon dynamics of these ecosystems. Comparing LSM simulations to two satellite-derived products revealed that these correspond reasonably well in terms of spatial patterns and interannual variability of dryland productivity but disagree regarding the distribution and changes in biomass. While the satellite-derived products used for this evaluation have their own limitations and uncertainties, many relating to the historic lack of observations in drylands, their synoptic coverage is suitable for global assessments of LSMs. The current limitations in how LSMs represent carbon allocation and release in dryland ecosystems in particular should be addressed through improved process representations. This includes refining existing processes such as plant responses to water availability, addressing compensatory biases in fire-enabled models, and representing photodegradation of litter that is an important pathway of carbon release in semiarid ecosystems. The increasing trend in dryland carbon storage simulated by the LSMs is dominated by increasing soil carbon; however, this change is very poorly constrained by empirical observations and needs to be addressed by future site-scale evaluations. This highlights both the need for longer-term observational efforts to be able to constrain and verify these model predictions but also that we should remain cautious in interpreting this element of LSM predictions as to the role of drylands in explaining trends in the global carbon cycle.
Data Availability Statement
The datasets presented in this study can be found in online repositories. The names of the repository/repositories and accession number(s) can be found below: The TRENDY-v8 ensemble of simulation outputs is available upon request at https://sites.exeter.ac.uk/trendy. The PML-v2 product script is available online from https://github.com/gee-hydro/gee_PML. The SMOS-IC V2 L-VOD product was provided by Jean-Pierre Wigneron. Processing code is available at https://doi.org/10.5281/zenodo.5511724. Google Earth Engine Repository is available at: https://earthengine.googlesource.com/users/dfawcett/DRIVING_C_RS_publication (requires Google account to access).
Author Contributions
Conceived the research idea: AC, DF, KA, SS, RB, and TH. Acquired funding: SS, RB, AC, KA, TH, J-PW, DG, and RS. Developed the experimental design. AC, DF, KA, and SS. Curated the data: DF, MO, XL, and J-PW. Data visualisation: DF and AC. Performed the analysis: DF and AC. Led the writing of the manuscript: AC and DF. All authors contributed to the final version of the manuscript.
Funding
Natural Environment Research Council (NERC) (NE/R00062X/1) awarded to RB, AC, SS, KA, and TH. ESA Climate Change Initiative RECCAP2 (contract no. 4000123002/18/I-NB) awarded to SS. SS also received support from NERC SECO grant NE/T01279X/1. DG received support from the ANR CLAND Convergence Institute. RS was supported by the European Union’s Horizon 2020 research and innovation programme ESM2025—Earth System Models for the Future (Grant Agreement No 101003536).
Conflict of Interest
The authors declare that the research was conducted in the absence of any commercial or financial relationships that could be construed as a potential conflict of interest.
Publisher’s Note
All claims expressed in this article are solely those of the authors and do not necessarily represent those of their affiliated organizations, or those of the publisher, the editors and the reviewers. Any product that may be evaluated in this article, or claim that may be made by its manufacturer, is not guaranteed or endorsed by the publisher.
Acknowledgments
We thank Clément Albergel from the European Space Agency (ESA) for constructive feedback on an earlier version of this manuscript. The CESM project is supported primarily by the National Science Foundation (NSF). This material is based upon work supported by the National Center for Atmospheric Research, which is a major facility sponsored by the NSF under Cooperative Agreement 1852977. Computing and data storage resources, including the Cheyenne supercomputer (doi:10.5065/D6RX99HX), were provided by the Computational and Information Systems Laboratory (CISL) at NCAR.
Supplementary Material
The Supplementary Material for this article can be found online at: https://www.frontiersin.org/articles/10.3389/fenvs.2022.790200/full#supplementary-material
References
Abatzoglou, J. T., Dobrowski, S. Z., Parks, S. A., and Hegewisch, K. C. (2018). TerraClimate, a High-Resolution Global Dataset of Monthly Climate and Climatic Water Balance from 1958-2015. Sci. Data 5, 170191. doi:10.1038/sdata.2017.191
Abel, C., Horion, S., Tagesson, T., De Keersmaecker, W., Seddon, A. W. R., Abdi, A. M., et al. (2021). The Human-Environment Nexus and Vegetation-Rainfall Sensitivity in Tropical Drylands. Nat. Sustain. 4, 25–32. doi:10.1038/s41893-020-00597-z
Adair, E. C., Parton, W. J., King, J. Y., Brandt, L. A., and Lin, Y. (2017). Accounting for Photodegradation Dramatically Improves Prediction of Carbon Losses in Dryland Systems. Ecosphere 8, e01892. doi:10.1002/ecs2.1892
Ahlström, A., Raupach, M. R., Schurgers, G., Smith, B., Arneth, A., Jung, M., et al. (2015). The Dominant Role of Semi-arid Ecosystems in the Trend and Variability of the Land CO 2 Sink. Science 348, 895–899. doi:10.1126/science.aaa1668
Andela, N., Morton, D. C., Giglio, L., Chen, Y., van der Werf, G. R., Kasibhatla, P. S., et al. (2017). A Human-Driven Decline in Global Burned Area. Science 356, 1356–1362. doi:10.1126/science.aal4108
Archer, E., Engelbrecht, F., Hänsler, A., Landman, W., Tadross, M., and Helmschrot, J. (2018). Seasonal Prediction and Regional Climate Projections for Southern Africa. Biodivers. Ecol. 6, 14–21. doi:10.7809/b-e.00296
Austin, A. T., and Vivanco, L. (2006). Plant Litter Decomposition in a Semi-arid Ecosystem Controlled by Photodegradation. Nature 442, 555–558. doi:10.1038/nature05038
Baldocchi, D. D. (2020). How Eddy Covariance Flux Measurements Have Contributed to Our Understanding of Global Change Biology. Glob. Change Biol. 26, 242–260. doi:10.1111/gcb.14807
Baston, D. (2020). Exactextractr: Fast Extraction from Raster Datasets Using Polygons. Burlington, Vermont, United States: ISciences, LLC.
Berenstecher, P., Vivanco, L., Pérez, L. I., Ballaré, C. L., and Austin, A. T. (2020). Sunlight Doubles Aboveground Carbon Loss in a Seasonally Dry Woodland in Patagonia. Curr. Biol. 30, 3243–3251.e3. doi:10.1016/j.cub.2020.06.005
Biederman, J. A., Scott, R. L., Bell, T. W., Bowling, D. R., Dore, S., Garatuza‐Payan, J., et al. (2017). CO 2 Exchange and Evapotranspiration across Dryland Ecosystems of Southwestern North America. Glob. Change Biol. 23, 4204–4221. doi:10.1111/gcb.13686
Blyth, E., Clark, D. B., Ellis, R., Huntingford, C., Los, S., Pryor, M., et al. (2011). A Comprehensive Set of Benchmark Tests for a Land Surface Model of Simultaneous Fluxes of Water and Carbon at Both the Global and Seasonal Scale. Geosci. Model. Dev. 4, 255–269. doi:10.5194/gmd-4-255-2011
Bond, W. J., Woodward, F. I., and Midgley, G. F. (2005). The Global Distribution of Ecosystems in a World without Fire. New Phytol. 165, 525–538. doi:10.1111/j.1469-8137.2004.01252.x
Boysen, L. R., Brovkin, V., Pongratz, J., Lawrence, D. M., Lawrence, P., Vuichard, N., et al. (2020). Global Climate Response to Idealized Deforestation in CMIP6 Models. Biogeosciences 17, 5615–5638. doi:10.5194/bg-17-5615-2020
Brandt, M., Hiernaux, P., Rasmussen, K., Tucker, C. J., Wigneron, J.-P., Diouf, A. A., et al. (2019). Changes in Rainfall Distribution Promote Woody Foliage Production in the Sahel. Commun. Biol. 2, 133. doi:10.1038/s42003-019-0383-9
Brandt, M., Wigneron, J.-P., Chave, J., Tagesson, T., Penuelas, J., Ciais, P., et al. (2018). Satellite Passive Microwaves Reveal Recent Climate-Induced Carbon Losses in African Drylands. Nat. Ecol. Evol. 2, 827–835. doi:10.1038/s41559-018-0530-6
Burton, C., Betts, R., Cardoso, M., Feldpausch, T. R., Harper, A., Jones, C. D., et al. (2019). Representation of Fire, Land-Use Change and Vegetation Dynamics in the Joint UK Land Environment Simulator vn4.9 (JULES). Geosci. Model. Dev. 12, 179–193. doi:10.5194/gmd-12-179-2019
Chamizo, S., Cantón, Y., Miralles, I., and Domingo, F. (2012). Biological Soil Crust Development Affects Physicochemical Characteristics of Soil Surface in Semiarid Ecosystems. Soil Biol. Biochem. 49, 96–105. doi:10.1016/j.soilbio.2012.02.017
Chaparro, D., Duveiller, G., Piles, M., Cescatti, A., Vall-llossera, M., Camps, A., et al. (2019). Sensitivity of L-Band Vegetation Optical Depth to Carbon Stocks in Tropical Forests: a Comparison to Higher Frequencies and Optical Indices. Remote Sensing Environ. 232, 111303. doi:10.1016/j.rse.2019.111303
Chave, J., Davies, S. J., Phillips, O. L., Lewis, S. L., Sist, P., Schepaschenko, D., et al. (2019). Ground Data Are Essential for Biomass Remote Sensing Missions. Surv. Geophys. 40, 863–880. doi:10.1007/s10712-019-09528-w
Ciais, P., Bombelli, A., Williams, M., Piao, S. L., Chave, J., Ryan, C. M., et al. (2011). The Carbon Balance of Africa: Synthesis of Recent Research Studies. Phil. Trans. R. Soc. A. 369, 2038–2057. doi:10.1098/rsta.2010.0328
Clark, D. B., Mercado, L. M., Sitch, S., Jones, C. D., Gedney, N., Best, M. J., et al. (2011). The Joint UK Land Environment Simulator (JULES), Model Description - Part 2: Carbon Fluxes and Vegetation Dynamics. Geosci. Model. Dev. 4, 701–722. doi:10.5194/gmd-4-701-2011
Cowie, A. L., Penman, T. D., Gorissen, L., Winslow, M. D., Lehmann, J., Tyrrell, T. D., et al. (2011). Towards Sustainable Land Management in the Drylands: Scientific Connections in Monitoring and Assessing Dryland Degradation, Climate Change and Biodiversity. Land Degrad. Dev. 22, 248–260. doi:10.1002/ldr.1086
Cunliffe, A. M., Anderson, K., Boschetti, F., Brazier, R. E., Graham, H. A., Myers‐Smith, I. H., et al. (2021). Global Application of an Unoccupied Aerial Vehicle Photogrammetry Protocol for Predicting Aboveground Biomass in Non‐forest Ecosystems. Remote Sens Ecol. Conserv 8, 57–71. doi:10.1002/rse2.228
Day, T. A., Bliss, M. S., Placek, S. K., Tomes, A. R., and Guénon, R. (2019). Thermal Abiotic Emission of CO 2 and CH 4 from Leaf Litter and its Significance in a Photodegradation Assessment. Ecosphere 10, e02745. doi:10.1002/ecs2.2745
Day, T. A., Bliss, M. S., Tomes, A. R., Ruhland, C. T., and Guénon, R. (2018). Desert Leaf Litter Decay: Coupling of Microbial Respiration, Water‐soluble Fractions and Photodegradation. Glob. Change Biol. 24, 5454–5470. doi:10.1111/gcb.14438
Delire, C., Séférian, R., Decharme, B., Alkama, R., Calvet, J. C., Carrer, D., et al. (2020). The Global Land Carbon Cycle Simulated with ISBA‐CTRIP: Improvements over the Last Decade. J. Adv. Model. Earth Syst. 12, e2019MS001886. doi:10.1029/2019MS001886
Donohue, R. J., Roderick, M. L., McVicar, T. R., and Farquhar, G. D. (2013). Impact of CO2fertilization on Maximum Foliage Cover across the globe's Warm, Arid Environments. Geophys. Res. Lett. 40, 3031–3035. doi:10.1002/grl.50563
Duncanson, L., Armston, J., Disney, M., Avitabile, V., Barbier, N., Calders, K., et al. (2019). The Importance of Consistent Global Forest Aboveground Biomass Product Validation. Surv. Geophys. 40, 979–999. doi:10.1007/s10712-019-09538-8
Fan, L., Wigneron, J.-P., Ciais, P., Chave, J., Brandt, M., Fensholt, R., et al. (2019). Satellite-observed Pantropical Carbon Dynamics. Nat. Plants 5, 944–951. doi:10.1038/s41477-019-0478-9
Fernandez-Moran, R., Al-Yaari, A., Mialon, A., Mahmoodi, A., Al Bitar, A., De Lannoy, G., et al. (2017). SMOS-IC: An Alternative SMOS Soil Moisture and Vegetation Optical Depth Product. Remote Sensing 9, 457–521. doi:10.3390/rs9050457
Forkel, M., Drüke, M., Thurner, M., Dorigo, W., Schaphoff, S., Thonicke, K., et al. (2019). Constraining Modelled Global Vegetation Dynamics and Carbon Turnover Using Multiple Satellite Observations. Sci. Rep. 9, 18757. doi:10.1038/s41598-019-55187-7
Frappart, F., Wigneron, J., Li, X., Liu, X., Al-yaari, A., Fan, L., et al. (2020). Global Monitoring of the Vegetation Dynamics from the Vegetation Optical Depth ( VOD ): A Review. Remote Sens 12, 7–10. doi:10.3390/rs12182915
Friedlingstein, P., Jones, M. W., O’Sullivan, M., Andrew, R. M., Hauck, J., Peters, G. P., et al. (2019). Global Carbon Budget 2019. Earth Syst. Sci. Data 11, 1783–1838. doi:10.5194/essd-11-1783-2019
Friend, A. D., Lucht, W., Rademacher, T. T., Keribin, R., Betts, R., Cadule, P., et al. (2014). Carbon Residence Time Dominates Uncertainty in Terrestrial Vegetation Responses to Future Climate and Atmospheric CO 2. Proc. Natl. Acad. Sci. U.S.A. 111, 3280–3285. doi:10.1073/pnas.1222477110
Gan, R., Zhang, Y., Shi, H., Yang, Y., Eamus, D., Cheng, L., et al. (2018). Use of Satellite Leaf Area index Estimating Evapotranspiration and Gross Assimilation for Australian Ecosystems. Ecohydrology 11, e1974. doi:10.1002/eco.1974
Giglio, L., Justice, C., Boschetti, L., and Roy, D. (2015). MCD64A1 MODIS/Terra+Aqua Burned Area Monthly L3 Global 500m SIN Grid V006 [Data Set] [Accessed September 20, 2021]. doi:10.5067/MODIS/MCD64A1.006
Goldstein, M., Seheult, A., and Vernon, I. (2013). “Assessing Model Adequacy,” in Environmental Modelling: Finding Simplicity in Complexity. Editors J. Wainwright, and M. Mulligan (Wiley-Blackwell), 435–449. doi:10.1002/9781118351475.ch26
Goll, D. S., Vuichard, N., Maignan, F., Jornet-Puig, A., Sardans, J., Violette, A., et al. (2017). A Representation of the Phosphorus Cycle for ORCHIDEE (Revision 4520). Geosci. Model. Dev. 10, 3745–3770. doi:10.5194/gmd-10-3745-2017
Gonsamo, A., Ciais, P., Miralles, D. G., Sitch, S., Dorigo, W., Lombardozzi, D., et al. (2021). Greening Drylands Despite Warming Consistent with Carbon Dioxide Fertilization Effect. Glob. Change Biol. 27, 3336–3349. doi:10.1111/gcb.15658
Hantson, S., Kelley, D. I., Arneth, A., Harrison, S. P., Archibald, S., Bachelet, D., et al. (2020). Quantitative Assessment of Fire and Vegetation Properties in Simulations with Fire-Enabled Vegetation Models from the Fire Model Intercomparison Project. Geosci. Model. Dev. 13, 3299–3318. doi:10.5194/gmd-13-3299-2020
Harper, A. B., Williams, K. E., McGuire, P. C., Duran Rojas, M. C., Hemming, D., Verhoef, A., et al. (2020). Improvement of Modelling Plant Responses to Low Soil Moisture in JULESvn4.9 and Evaluation against Flux tower Measurements. Geosci. Model. Dev. Discuss., 1–42. doi:10.5194/gmd-2020-273
Haverd, V., Smith, B., Nieradzik, L., Briggs, P. R., Woodgate, W., Trudinger, C. M., et al. (2018). A New Version of the CABLE Land Surface Model (Subversion Revision R4601) Incorporating Land Use and Land Cover Change, Woody Vegetation Demography, and a Novel Optimisation-Based Approach to Plant Coordination of Photosynthesis. Geosci. Model. Dev. 11, 2995–3026. doi:10.5194/gmd-11-2995-2018
Haverd, V., Smith, B., and Trudinger, C. (2016). Dryland Vegetation Response to Wet Episode, Not Inherent Shift in Sensitivity to Rainfall, behind Australia's Role in 2011 Global Carbon Sink Anomaly. Glob. Change Biol. 22, 2315–2316. doi:10.1111/gcb.13202
Hill, T., Chocholek, M., and Clement, R. (2017). The Case for Increasing the Statistical Power of Eddy Covariance Ecosystem Studies: Why, where and How? Glob. Change Biol. 23, 2154–2165. doi:10.1111/gcb.13547
Huang, J., Li, Y., Fu, C., Chen, F., Fu, Q., Dai, A., et al. (2017). Dryland Climate Change: Recent Progress and Challenges. Rev. Geophys. 55, 719–778. doi:10.1002/2016RG000550
Huang, J., Yu, H., Guan, X., Wang, G., and Guo, R. (2016). Accelerated Dryland Expansion under Climate Change. Nat. Clim Change 6, 166–171. doi:10.1038/nclimate2837
Jung, M., Schwalm, C., Migliavacca, M., Walther, S., Camps-Valls, G., Koirala, S., et al. (2020). Scaling Carbon Fluxes from Eddy Covariance Sites to globe: Synthesis and Evaluation of the FLUXCOM Approach. Biogeosciences 17, 1343–1365. doi:10.5194/bg-17-1343-2020
Konings, A. G., Piles, M., Das, N., and Entekhabi, D. (2017). L-band Vegetation Optical Depth and Effective Scattering Albedo Estimation from SMAP. Remote Sensing Environ. 198, 460–470. doi:10.1016/j.rse.2017.06.037
Konings, A. G., Rao, K., and Steele‐Dunne, S. C. (2019). Macro to Micro: Microwave Remote Sensing of Plant Water Content for Physiology and Ecology. New Phytol. 223, 1166–1172. doi:10.1111/nph.15808
Krinner, G., Viovy, N., de Noblet-Ducoudré, N., Ogée, J., Polcher, J., Friedlingstein, P., et al. (2005). A Dynamic Global Vegetation Model for Studies of the Coupled Atmosphere-Biosphere System. Glob. Biogeochem. Cycles 19. doi:10.1029/2003GB002199
Lasslop, G., Hantson, S., Harrison, S. P., Bachelet, D., Burton, C., Forkel, M., et al. (2020). Global Ecosystems and Fire: Multi‐model Assessment of Fire‐induced Tree‐cover and Carbon Storage Reduction. Glob. Change Biol. 26, 5027–5041. doi:10.1111/gcb.15160
Lawrence, D. M., Fisher, R. A., Koven, C. D., Oleson, K. W., Swenson, S. C., Bonan, G., et al. (2019). The Community Land Model Version 5: Description of New Features, Benchmarking, and Impact of Forcing Uncertainty. J. Adv. Model. Earth Syst. 11, 4245–4287. doi:10.1029/2018MS001583
Liu, Y. Y., van Dijk, A. I. J. M., de Jeu, R. A. M., Canadell, J. G., McCabe, M. F., Evans, J. P., et al. (2015). Recent Reversal in Loss of Global Terrestrial Biomass. Nat. Clim Change 5, 470–474. doi:10.1038/nclimate2581
Long, S. P., Ainsworth, E. A., Rogers, A., and Ort, D. R. (2004). RISING ATMOSPHERIC CARBON DIOXIDE: Plants FACE the Future. Annu. Rev. Plant Biol. 55, 591–628. doi:10.1146/annurev.arplant.55.031903.141610
MacBean, N., Scott, R. L., Biederman, J. A., Peylin, P., Kolb, T., Litvak, M. E., et al. (2021). Dynamic Global Vegetation Models Underestimate Net CO2 Flux Mean and Inter-annual Variability in Dryland Ecosystems. Environ. Res. Lett. 16, 094023. doi:10.1088/1748-9326/ac1a38
Maestre, F. T., Benito, B. M., Berdugo, M., Concostrina‐Zubiri, L., Delgado‐Baquerizo, M., Eldridge, D. J., et al. (2021). Biogeography of Global Drylands. New Phytol. 231, 540–558. doi:10.1111/nph.17395
Mauritsen, T., Bader, J., Becker, T., Behrens, J., Bittner, M., Brokopf, R., et al. (2019). Developments in the MPI‐M Earth System Model Version 1.2 (MPI‐ESM1.2) and its Response to Increasing CO 2. J. Adv. Model. Earth Syst. 11, 998–1038. doi:10.1029/2018MS001400
Meiyappan, P., Jain, A. K., and House, J. I. (2015). Increased Influence of Nitrogen Limitation on CO 2 Emissions from Future Land Use and Land Use Change. Glob. Biogeochem. Cycles 29, 1524–1548. doi:10.1002/2015GB005086
Melton, J. R., and Arora, V. K. (2016). Competition between Plant Functional Types in the Canadian Terrestrial Ecosystem Model (CTEM) V. 2.0. Geosci. Model. Dev. 9, 323–361. doi:10.5194/gmd-9-323-2016
Méndez, M. S., Martinez, M. L., Araujo, P. I., and Austin, A. T. (2019). Solar Radiation Exposure Accelerates Decomposition and Biotic Activity in Surface Litter but Not Soil in a Semiarid woodland Ecosystem in Patagonia, Argentina. Plant Soil 445, 483–496. doi:10.1007/s11104-019-04325-1
Mialon, A., Coret, L., Kerr, Y. H., Secherre, F., and Wigneron, J.-P. (2008). Flagging the Topographic Impact on the SMOS Signal. IEEE Trans. Geosci. Remote Sensing 46, 689–694. doi:10.1109/TGRS.2007.914788
Mialon, A., Rodríguez-Fernández, N. J., Santoro, M., Saatchi, S., Mermoz, S., Bousquet, E., et al. (2020). Evaluation of the Sensitivity of SMOS L-VOD to Forest Above-Ground Biomass at Global Scale. Remote Sensing 12, 1450. doi:10.3390/rs12091450
Moesinger, L., Dorigo, W., de Jeu, R., van der Schalie, R., Scanlon, T., Teubner, I., et al. (2020). The Global Long-Term Microwave Vegetation Optical Depth Climate Archive (VODCA). Earth Syst. Sci. Data 12, 177–196. doi:10.5194/essd-12-177-2020
Mokany, K., Raison, R. J., and Prokushkin, A. S. (2006). Critical Analysis of Root : Shoot Ratios in Terrestrial Biomes. Glob. Change Biol. 12, 84–96. doi:10.1111/j.1365-2486.2005.001043.x
Momen, M., Wood, J. D., Novick, K. A., Pangle, R., Pockman, W. T., McDowell, N. G., et al. (2017). Interacting Effects of Leaf Water Potential and Biomass on Vegetation Optical Depth. J. Geophys. Res. Biogeosci. 122, 3031–3046. doi:10.1002/2017JG004145
Myers-Smith, I. H., Kerby, J. T., Phoenix, G. K., Bjerke, J. W., Epstein, H. E., Assmann, J. J., et al. (2020). Complexity Revealed in the Greening of the Arctic. Nat. Clim. Change 10, 106–117. doi:10.1038/s41558-019-0688-1
Paustian, K., Ravindranath, N. H., and van Amstel, A. R. (2006). 2006 IPCC Guidelines for National Greenhouse Gas Inventories. [s.n.].
Piao, S., Wang, X., Wang, K., Li, X., Bastos, A., Canadell, J. G., et al. (2020). Interannual Variation of Terrestrial Carbon Cycle: Issues and Perspectives. Glob. Change Biol. 26, 300–318. doi:10.1111/gcb.14884
Poulter, B., Frank, D., Ciais, P., Myneni, R. B., Andela, N., Bi, J., et al. (2014). Contribution of Semi-arid Ecosystems to Interannual Variability of the Global Carbon Cycle. Nature 509, 600–603. doi:10.1038/nature13376
Prentice, I. C., Farquhar, G. D., Fasham, M. J. R., Goulden, M. L., Heimann, M., Jaramillo, V. J., et al. (2001). “The Carbon Cycle and Atmospheric Carbon Dioxide,” in Climate Change 2001: The Scientific Basis. Contribution of Working Group I to the Third Assessment Report of the Intergovernmental Panel on Climate Change. J. T. Houghton, Y. Ding, D. J. Griggs, M. Noguer, P. J. van der Linden, X. Daiet al. (Cambridge, UK: Cambridge University Press).
Qi, Y., Wei, W., Chen, C., and Chen, L. (2019). Plant Root-Shoot Biomass Allocation over Diverse Biomes: A Global Synthesis. Glob. Ecol. Conservation 18, e00606. doi:10.1016/j.gecco.2019.e00606
Ramo, R., Roteta, E., Bistinas, I., van Wees, D., Bastarrika, A., Chuvieco, E., et al. (2021). African Burned Area and Fire Carbon Emissions Are Strongly Impacted by Small Fires Undetected by Coarse Resolution Satellite Data. Proc. Natl. Acad. Sci. U.S.A. 118, e2011160118. doi:10.1073/pnas.2011160118
Reick, C. H., Gayler, V., Goll, D., Hagemann, S., Heidkamp, M., Nabel, J. E. M. S., et al. (2021). JSBACH 3 - The land component of the MPI Earth System Model: documentation of version 3.2. Hamburg: MPI für Meteorologie. doi:10.17617/2.3279802
Rodriguez-Caballero, E., Belnap, J., Büdel, B., Crutzen, P. J., Andreae, M. O., Pöschl, U., et al. (2018). Dryland Photoautotrophic Soil Surface Communities Endangered by Global Change. Nat. Geosci 11, 185–189. doi:10.1038/s41561-018-0072-1
Rodríguez-Fernández, N. J., Mialon, A., Mermoz, S., Bouvet, A., Richaume, P., Al Bitar, A., et al. (2018). An Evaluation of SMOS L-Band Vegetation Optical Depth (L-VOD) Data Sets: High Sensitivity of L-VOD to Above-Ground Biomass in Africa. Biogeosciences 15, 4627–4645. doi:10.5194/bg-15-4627-2018
Rutledge, S., Campbell, D. I., Baldocchi, D., and Schipper, L. A. (2010). Photodegradation Leads to Increased Carbon Dioxide Losses from Terrestrial Organic Matter. Glob. Change Biol. 16, no. doi:10.1111/j.1365-2486.2009.02149.x
Santoro, M., Cartus, O., Mermoz, S., Bouvet, A., Le Toan, T., Carvalhais, N., et al. (2018). GlobBiomass Global Above-Ground Biomass and Growing Stock Volume Datasets. Available at: http://globbiomass.org/products/global-mapping (Accessed September 20, 2021).
Schimel, D., Pavlick, R., Fisher, J. B., Asner, G. P., Saatchi, S., Townsend, P., et al. (2015). Observing Terrestrial Ecosystems and the Carbon Cycle from Space. Glob. Change Biol. 21, 1762–1776. doi:10.1111/gcb.12822
Schlesinger, W. H. (2016). An Evaluation of Abiotic Carbon Sinks in Deserts. Glob. Change Biol. 23, 25–27. doi:10.1111/gcb.13336
Schlesinger, W. H., Belnap, J., and Marion, G. (2009). On Carbon Sequestration in Desert Ecosystems. Glob. Change Biol. 15, 1488–1490. doi:10.1111/j.1365-2486.2008.01763.x
Sietz, D., Lüdeke, M. K. B., and Walther, C. (2011). Categorisation of Typical Vulnerability Patterns in Global Drylands. Glob. Environ. Change 21, 431–440. doi:10.1016/j.gloenvcha.2010.11.005
Sitch, S., Friedlingstein, P., Gruber, N., Jones, S. D., Murray-Tortarolo, G., Ahlström, A., et al. (2015). Recent Trends and Drivers of Regional Sources and Sinks of Carbon Dioxide. Biogeosciences 12, 653–679. doi:10.5194/bg-12-653-2015
Sitch, S., Huntingford, C., Gedney, N., Levy, P. E., Lomas, M., Piao, S. L., et al. (2008). Evaluation of the Terrestrial Carbon Cycle, Future Plant Geography and Climate-Carbon Cycle Feedbacks Using Five Dynamic Global Vegetation Models (DGVMs). Glob. Change Biol. 14, 2015–2039. doi:10.1111/j.1365-2486.2008.01626.x
Sitch, S., Smith, B., Prentice, I. C., Arneth, A., Bondeau, A., Cramer, W., et al. (2003). Evaluation of Ecosystem Dynamics, Plant Geography and Terrestrial Carbon Cycling in the LPJ Dynamic Global Vegetation Model. Glob. Chang. Biol. 9, 161–185. doi:10.1046/j.1365-2486.2003.00569.x
Smith, B., Wårlind, D., Arneth, A., Hickler, T., Leadley, P., Siltberg, J., et al. (2014). Implications of Incorporating N Cycling and N Limitations on Primary Production in an Individual-Based Dynamic Vegetation Model. Biogeosciences 11, 2027–2054. doi:10.5194/bg-11-2027-2014
Smith, W. K., Dannenberg, M. P., Yan, D., Herrmann, S., Barnes, M. L., Barron-Gafford, G. A., et al. (2019). Remote Sensing of Dryland Ecosystem Structure and Function: Progress, Challenges, and Opportunities. Remote Sensing Environ. 233, 111401. doi:10.1016/j.rse.2019.111401
SRCCL (2020). Special Report on Climate Change and Land, 2020. Available at: https://www.ipcc.ch/srccl/chapter/summary-for-policymakers/.
Terrer, C., Phillips, R. P., Hungate, B. A., Rosende, J., Pett-Ridge, J., Craig, M. E., et al. (2021). A Trade-Off between Plant and Soil Carbon Storage under Elevated CO2. Nature 591, 599–603. doi:10.1038/s41586-021-03306-8
Tian, F., Brandt, M., Liu, Y. Y., Verger, A., Tagesson, T., Diouf, A. A., et al. (2016). Remote Sensing of Vegetation Dynamics in Drylands: Evaluating Vegetation Optical Depth (VOD) Using AVHRR NDVI and In Situ green Biomass Data over West African Sahel. Remote Sensing Environ. 177, 265–276. doi:10.1016/j.rse.2016.02.056
Tian, F., Wigneron, J.-P., Ciais, P., Chave, J., Ogée, J., Peñuelas, J., et al. (2018). Coupling of Ecosystem-Scale Plant Water Storage and Leaf Phenology Observed by Satellite. Nat. Ecol. Evol. 2, 1428–1435. doi:10.1038/s41559-018-0630-3
Tian, H., Chen, G., Lu, C., Xu, X., Hayes, D. J., Ren, W., et al. (2015). North American Terrestrial CO2 Uptake Largely Offset by CH4 and N2O Emissions: toward a Full Accounting of the Greenhouse Gas Budget. Climatic Change 129, 413–426. doi:10.1007/s10584-014-1072-9
IPCC (2021). in Climate Change 2021: The Physical Science Basis. Contribution of Working Group I to the Sixth Assessment Report of the Intergovernmental Panel on Climate Change. V. Masson-Delmotte, P. Zhai, A. Pirani, S. L. Connors, C. Péan, S. Bergeret al. (Cambridge University Press).
Walker, A. P., De Kauwe, M. G., Bastos, A., Belmecheri, S., Georgiou, K., Keeling, R. F., et al. (2021). Integrating the Evidence for a Terrestrial Carbon Sink Caused by Increasing Atmospheric CO 2. New Phytol. 229, 2413–2445. doi:10.1111/nph.16866
Warren, J. M., Hanson, P. J., Iversen, C. M., Kumar, J., Walker, A. P., and Wullschleger, S. D. (2015). Root Structural and Functional Dynamics in Terrestrial Biosphere Models - Evaluation and Recommendations. New Phytol. 205, 59–78. doi:10.1111/nph.13034
Wigneron, J.-P., Li, X., Frappart, F., Fan, L., Al-Yaari, A., De Lannoy, G., et al. (2021). SMOS-IC Data Record of Soil Moisture and L-VOD: Historical Development, Applications and Perspectives. Remote Sensing Environ. 254, 112238. doi:10.1016/j.rse.2020.112238
Xu, C., Kohler, T. A., Lenton, T. M., Svenning, J.-C., and Scheffer, M. (2020). Future of the Human Climate Niche. Proc. Natl. Acad. Sci. U.S.A. 117, 11350–11355. doi:10.1073/pnas.1910114117
Yan, C., Yuan, Z., Liu, Z., Zhang, J., Liu, K., Shi, X., et al. (2021). Aridity Stimulates Responses of Root Production and Turnover to Warming but Suppresses the Responses to Nitrogen Addition in Temperate Grasslands of Northern China. Sci. Total Environ. 753, 142018. doi:10.1016/j.scitotenv.2020.142018
Yan, L., Li, Y., Wang, L., Zhang, X., Wang, J., Wu, H., et al. (2020). Grazing Significantly Increases Root Shoot Ratio but Decreases Soil Organic Carbon in Qinghai‐Tibetan Plateau Grasslands: A Hierarchical Meta‐analysis. Land Degrad. Dev. 31, 2369–2378. doi:10.1002/ldr.3606
Yang, H., Ciais, P., Santoro, M., Huang, Y., Li, W., Wang, Y., et al. (2020). Comparison of forest Above‐ground Biomass from Dynamic Global Vegetation Models with Spatially Explicit Remotely Sensed Observation‐based Estimates. Glob. Change Biol. 26, 3997–4012. doi:10.1111/gcb.15117
Yao, J., Liu, H., Huang, J., Gao, Z., Wang, G., Li, D., et al. (2020). Accelerated Dryland Expansion Regulates Future Variability in Dryland Gross Primary Production. Nat. Commun. 11, 1665. doi:10.1038/s41467-020-15515-2
Zaehle, S., and Friend, A. D. (2010). Carbon and Nitrogen Cycle Dynamics in the O-CN Land Surface Model: 1. Model Description, Site-Scale Evaluation, and Sensitivity to Parameter Estimates. Glob. Biogeochem. Cycles 24, a–n. doi:10.1029/2009GB003521
Zhang, Y., Kong, D., Gan, R., Chiew, F. H. S., McVicar, T. R., Zhang, Q., et al. (2019a). Coupled Estimation of 500 M and 8-day Resolution Global Evapotranspiration and Gross Primary Production in 2002-2017. Remote Sensing Environ. 222, 165–182. doi:10.1016/j.rse.2018.12.031
Keywords: land surface models (LSM), drylands, productivity, aboveground biomass, model evaluation, vegetation optical depth (VOD)
Citation: Fawcett D, Cunliffe AM, Sitch S, O’Sullivan M, Anderson K, Brazier RE, Hill TC, Anthoni P, Arneth A, Arora VK, Briggs PR, Goll DS, Jain AK, Li X, Lombardozzi D, Nabel JEMS, Poulter B, Séférian R, Tian H, Viovy N, Wigneron J-P, Wiltshire A and Zaehle S (2022) Assessing Model Predictions of Carbon Dynamics in Global Drylands. Front. Environ. Sci. 10:790200. doi: 10.3389/fenvs.2022.790200
Received: 06 October 2021; Accepted: 04 April 2022;
Published: 27 April 2022.
Edited by:
Lara Prihodko, New Mexico State University, United StatesReviewed by:
Ning Chen, Lanzhou University, ChinaJoel Biederman, United States Department of Agriculture, United States
Copyright © 2022 Fawcett, Cunliffe, Sitch, O’Sullivan, Anderson, Brazier, Hill, Anthoni, Arneth, Arora, Briggs, Goll, Jain, Li, Lombardozzi, Nabel, Poulter, Séférian, Tian, Viovy, Wigneron, Wiltshire and Zaehle. This is an open-access article distributed under the terms of the Creative Commons Attribution License (CC BY). The use, distribution or reproduction in other forums is permitted, provided the original author(s) and the copyright owner(s) are credited and that the original publication in this journal is cited, in accordance with accepted academic practice. No use, distribution or reproduction is permitted which does not comply with these terms.
*Correspondence: Dominic Fawcett, ZC5mYXdjZXR0QGV4ZXRlci5hYy51aw==
†These authors have contributed equally to this work and share first authorship