 Liliana K. Rutaihwa1,2,3
 Fabrizio Menardo1,2
 David Stucki1,2
 Sebastian M. Gygli1,2
 Serej D. Ley1,2,4,5
 Bijaya Malla1,2,6
 Julia Feldmann1,2
 Sonia Borrell1,2
 Christian Beisel7
 Kerren Middelkoop8,9E. Jane Carter10,11Lameck Diero11
 Marie Ballif12Levan Jugheli1,2Klaus Reither1,2Lukas Fenner1,2,12
 Daniela Brites1,2*†
 Sebastien Gagneux1,2*†
- 1Department of Medical Parasitology and Infection Biology, Swiss Tropical and Public Health Institute, Basel, Switzerland
- 2University of Basel, Basel, Switzerland
- 3Department of Intervention and Clinical Trials, Ifakara Health Institute, Bagamoyo, Tanzania
- 4Infection and Immunity Unit, Papua New Guinea Institute of Medical Research, Goroka, Papua New Guinea
- 5Division of Molecular Biology and Human Genetics, Faculty of Medicine and Health Sciences, DST-NRF Centre of Excellence for Biomedical Tuberculosis Research, South African Medical Research Council Centre for Tuberculosis Research, Stellenbosch University, Cape Town, South Africa
- 6Department of Radiation Oncology, Inselspital, Bern University Hospital, University of Bern, Bern, Switzerland
- 7Department of Biosystems Science and Engineering, ETH Zurich, Basel, Switzerland
- 8Desmond Tutu HIV Centre, Institute of Infectious Disease and Molecular Medicine, Cape Town, South Africa
- 9Department of Medicine, University of Cape Town, Cape Town, South Africa
- 10Division of Pulmonary and Critical Care Medicine, Warren Alpert School of Medicine at Brown University, Providence, RI, United States
- 11Department of Medicine, Moi University School of Medicine, Eldoret, Kenya
- 12Institute of Social and Preventive Medicine, University of Bern, Bern, Switzerland
The Lineage 2–Beijing (L2–Beijing) sub-lineage of Mycobacterium tuberculosis has received much attention due to its high virulence, fast disease progression, and association with antibiotic resistance. Despite several reports of the recent emergence of L2–Beijing in Africa, no study has investigated the evolutionary history of this sub-lineage on the continent. In this study, we used whole genome sequences of 781 L2 clinical strains from 14 geographical regions globally distributed to investigate the origins and onward spread of this lineage in Africa. Our results reveal multiple introductions of L2–Beijing into Africa linked to independent bacterial populations from East- and Southeast Asia. Bayesian analyses further indicate that these introductions occurred during the past 300 years, with most of these events pre-dating the antibiotic era. Hence, the success of L2–Beijing in Africa is most likely due to its hypervirulence and high transmissibility rather than drug resistance.
Introduction
Tuberculosis (TB) is mainly caused by a group of closely related bacteria referred to as the Mycobacterium tuberculosis Complex (MTBC). The MTBC comprises seven phylogenetic lineages adapted to humans and several lineages adapted to different wild and domestic animal species (Gagneux, 2018). The human-adapted lineages of the MTBC show a distinct geographic distribution, with some “generalist” lineages such as Lineage (L)2 and L4 occurring all around the world and others being geographically restricted “specialist” that include L5, L6, and L7 (Coscolla and Gagneux, 2014; Stucki et al., 2016). Africa is the only continent which is home to all seven human-adapted lineages, including the three “specialist” lineages exclusively found on the continent. Current evidence suggests that the MTBC overall originated in Africa (Gagneux, 2018) and subsequently spread around the globe following human migratory events (Wirth et al., 2008; Comas et al., 2013). The broad distribution of some of the “generalist” lineages and their presence in Africa has been attributed to past exploration, trade, and conquest. For instance, an important part of the TB epidemics in sub-Saharan Africa is driven by the generalist Latin–American–Mediterranean (LAM) sublineage of L4, which is postulated to have been introduced to the continent post-European contact (Stucki et al., 2016; Brynildsrud et al., 2018).
Among the different human-adapted MTBC lineages, the L2–Beijing sublineage has been of particular interest (Merker et al., 2015). L2–Beijing has expanded and emerged worldwide from East Asia; its most likely geographical origin (Luo et al., 2015; Merker et al., 2015). In some parts of the world, the recent emergence of L2–Beijing has been linked to increased transmission (Yang et al., 2012; Holt et al., 2018), high prevalence of multidrug–resistant TB (MDR–TB) (Borrell and Gagneux, 2009), and to social and political instability, resulting into displacement of people and poor health systems (Eldholm et al., 2016). Increasingly, L2–Beijing is also being reported in Africa (Bifani et al., 2002; Affolabi et al., 2009; Gehre et al., 2016; Mbugi et al., 2016), and evidence suggests that L2–Beijing in African regions is becoming more prevalent over time (Cowley et al., 2008; van der Spuy et al., 2009; Glynn et al., 2010). Some authors have hypothesized that the introduction of L2–Beijing into South Africa resulted from the importation of slaves from Southeast Asia during the 17th and 18th centuries and/or the Chinese labor forces arriving in the 1900s (van Helden et al., 2002). Alternatively, in West Africa, the presence of L2–Beijing was proposed to reflect more recent immigration from Asia (Affolabi et al., 2009; Gehre et al., 2016). To a certain extent, the recent expansion of L2–Beijing in parts of Africa has been associated with drug resistance (Githui et al., 2004; Klopper et al., 2013) and higher transmissibility (Guerra-Assunção et al., 2015). In addition, a study in the Gambia showed a faster progression from latent infection to active TB disease in patient house-hold contacts exposed to L2–Beijing (de Jong et al., 2008).
Whilst L2–Beijing seems to be expanding in several regions of Africa, no study has formally investigated the evolutionary history of L2–Beijing on the continent. In this study, we used whole genome sequencing data from a global collection of L2 clinical strains to determine the most likely geographical origin of L2–Beijing in Africa and its spread across the continent.
Materials and Methods
Identification of Lineage 2 Strains and Whole-Genome Sequencing
We obtained whole-genome sequencing data of L2 strains from the two previously largest studies focusing on the evolutionary history and global spread of L2–Beijing strains (Luo et al., 2015; Merker et al., 2015). We then identified additional published genomes as African and non-African representatives of L2–Beijing strains from other studies (Comas et al., 2010, 2013; Casali et al., 2012, 2014; Kato-Maeda et al., 2012; Zhang et al., 2013; Portevin et al., 2014; Guerra-Assunção et al., 2015; Koch et al., 2017; Manson et al., 2017). Moreover, we newly sequenced 116 additional L2–Beijing strains using Illumina HiSeq 2000/2500 paired end technology (PRJNA488343). In total, we included 781 L2 genome sequences (Figure S1 and Table S1).
Whole Genome Sequence Analysis and Phylogenetic Inference
We used a customized pipeline previously described to map short sequencing reads with BWA 0.6.2 to a reconstructed hypothetical MTBC ancestor used as reference (Comas et al., 2013). SAMtools 0.1.19 was used to call single nucleotide polymorphisms (SNPs), and these SNPs were annotated using ANNOVAR and customized scripts based on the M. tuberculosis H37Rv reference annotation (AL123456.2). For downstream analyses, we excluded SNPs in repetitive regions, those annotated in problematic regions such as “PE/PPE/PGRS” and SNPs in drug-resistance associated genes. Small insertions and deletions were also excluded from the analyses. Only SNPs with minimum coverage of 20x and minimum mapping quality of 30 were kept. All SNPs classified by Samtools as having frequencies of the major non-reference allele lower than 100% (AF1 <1) within each genome were considered to be heterogeneous and were treated as ambiguities and excluded, and were otherwise considered fixed (AF1 = 1). Mixed infections or contaminations were discarded by excluding genomes with more than 1,000 heterogeneous positions and genomes for which the number of heterogeneous SNPs was higher than the number of fixed SNPs. In addition we excluded genomes for which the number of fixed SNPs would fall below Q1–1.5 IQR of all fixed SNPs considering all L2 genomes (Q1 being the first quantile and IQR the inner quantile range as calculated in R3.5.0). All genomes were typed for lineage and sub-lineage using SNP markers as defined in Steiner et al. (2014) plus Coll et al. (2014) and those showing simultaneously more than one marker were excluded. We concatenated fixed SNPs from the variable positions obtained, which yielded a 32,269 bp alignment. The alignment was then used to infer a maximum likelihood phylogeny using RAxML 8.3.2 with a general time reversible (GTR) model in RAxML and 1,000 rapid bootstrap inferences, followed by a thorough maximum-likelihood search (Stamatakis, 2006). The topology was rooted using the reference strain, H37Rv which belongs to Lineage 4.
Phylogeographic Analyses
Reconstruction of the Ancestral Geographic Range
To investigate the likely geographic origin of L2–Beijing strains in Africa, we inferred the historical biogeography of L2 using the RASP software (Yu et al., 2015) on a representative subset of 422 genomes due to software's sample limitation. We achieved this by randomly removing clustered genomes (i.e., those with 12 or less SNP distances) from the same country of origin, using hierarchical clustering implemented in pvclust package in R (Suzuki and Shimodaira, 2006) on a distance matrix of the 781 genome sequences. We then applied a Bayesian binary based method (BBM) in RASP to reconstruct geographical states at the ancestral nodes on the best-scoring ML tree inferred with RAxML using the 422 L2 genomes. We used geographical regions (according to United Nations geoscheme) as proxy for origins of the L2 strains. In total 14 regions were loaded as geographic distributions (indicated in Table S1). The ancestral reconstruction was performed with the Proto-Beijing clade as outgroup. We finally ran Bayesian analysis with 10 chains and 50,000 generations.
Stochastic Character Mapping
To determine the number of introduction events of L2–Beijing into African regions, we applied stochastic character mapping as implemented in SIMMAP (Bollback, 2006) on the 781 L2 phylogeny inferred from the best-scoring ML tree rooted on the Proto-Beijing clade, using the make.simmap function in phytools package 0.6.60 in R 3.5.0 (Revell, 2012; R Core Team, 2018). Geographical origin of the L2 strains was treated as a discrete trait and modeled onto the phylogeny using ARD model with 100 replicates. This model allows unequal rates of state transition permiting independent region-to-region transfers. We summarized the results of the 100 replicates using the function summary in phytools package 0.6.60 in R (Revell, 2012). We referred to the resulting introductions as migration events “M,” and discuss only those introductions with 5 or more genomes.
Population Genetic Analyses
Nucleotide diversity (pi)
We calculated the mean pair-wise nucleotide diversity per site (Pi) measured by geographic region. We excluded geographic regions represented by <20 genomes. Confidence intervals were obtained by bootstrapping through resampling using the sample function in R with replacement and the respective lower and upper confidence levels by calculating 2.5th and 97.5th quartiles. Resampling was additionally done using the smallest size of the geographical regions to account for the effect of different sample sizes.
Pairwise SNP distances
We used dist.dna function of ape package implemented in R (Paradis et al., 2004) to calculate pairwise SNP distances with raw mutation counts and pairwise deletions for gaps. Mean pairwise SNP distance to all strains of the same geographic population was calculated per strain and the distribution of the mean SNP pairwise distance for all strains plotted. The mean pairwise SNP distances were assumed not to be normally distributed and we therefore used Wilcoxon rank-sum test to test the differences among geographic regions. Additionally, we calculated pairwise SNP distances within African L2–Beijing populations for migration events with more than 10 genomes each.
Drug Resistance
To distinguish between drug-susceptible and drug-resistant strains, we used genotypic drug resistance molecular markers previously described (Steiner et al., 2014). We categorized strains into: susceptible as having no drug resistance specific mutations; monoresistant as having mutations conferring resistance to a single drug; MDR as having mutations conferring resistance to isoniazid and rifampicin; and extensively drug-resistant (XDR) as having mutations conferring resistance to fluoroquinolones and aminoglycosides in addition to being MDR (Table S2).
Bayesian Molecular Dating
Data preparation and preliminary analysis
To estimate the historical period in which L2–Beijing was introduced to Africa, we performed a set of Bayesian phylogenetic analyses using tip-calibration (Rieux and Khatchikian, 2017). Among the 781 studied L2 strains, we had information on the year of sampling for 308. We performed all further analysis on this subset of 308 strains. We excluded all genomic positions that were invariable in this subset and all positions that were undetermined (missing data or deletions) in more than 25% of the strains, and obtained an alignment of 10,769 polymorphic positions.
In tip dating analysis it is important to test whether the dataset contains strong enough temporal signal (Rieux and Balloux, 2016). To do this, we performed a tip randomization test (Ramsden et al., 2008) as follows. We used BEAST2 v. 2.4.8 (Bouckaert et al., 2014) to run a phylogenetic analysis with a HKY + GAMMA model (Hasegawa et al., 1985), a constant population size prior on the tree and a strict molecular clock. Additionally, we used the years in which the strains were sampled to time-calibrate the tree, and we modified the extensible markup language (xml) file to specify the number of invariant sites as indicated by the developers of BEAST2 here: https://groups.google.com/forum/#!topic/beast- (strict_preliminary.xml). We ran three independent runs (245 million generations in total), and we used Tracer 1.7 (Rambaut et al., 2018) to identify the burn-in (8 million generations), to assess that the different runs converged, and to estimate the effective sample size (ESS) for all parameters, the posterior and the likelihood (ESS > 110 for all parameters). We then used TipDatingBeast (Rieux and Khatchikian, 2017) to generate 20 replicates of the xml file in which the sampling dates were randomly reassigned to different strains. For each replication, we ran the same BEAST2 analysis as for the original (observed) dataset (one run per replicate, 50 million generations, 10% burn-in). We used TipDatingBeast to parse the log files output of BEAST2 and compare the clock rate estimates for the observed data and the randomized replications. The estimates of the molecular clock rate did not overlap between the observed and the randomized dataset, indicating that there is a clear temporal signal and that we could proceed with further analysis (Figure S2).
Model selection
To identify the clock model that best fits the data, we estimated the marginal likelihood of three different clock models: UCED and UCLD (Drummond et al., 2006), assuming a coalescent constant population size tree prior and the HKY model of nucleotide substitution. We used the Model selection package of BEAST2 to run a path sampling analysis (Lartillot and Philippe, 2006) following the recommendations of the BEAST2 developers (http://www.beast2.org/path-sampling/). We used the following settings: 100 steps, 4 million generations per step, alpha = 0.3, pre-burn-in = 1 million generations, burn-in for each step = 40% (*PS.xml). For these analyses, we used proper priors as suggested by (Baele et al., 2012).
UCLD analysis
Since the model selection analysis indicated that the UCLD clock was the best fitting model, we repeated the analysis using the UCLD and the same settings used in the path sampling analysis, sampling every 10,000 generations. We ran three independent runs (800 million generations in total), we used Tracer 1.7 (Rambaut et al., 2018) to identify the burn-in (10 million generations), to assess that the different runs converged and to estimate the effective sample size (ESS) for all parameters, the posterior and the likelihood (ESS > 260 for all parameters) (UCLD_final.xml and Table S3).
We checked the sensitivity to the priors by running one analysis of 250 million generation sampling from the prior, and compared the parameter estimates with the analysis using the data. We observed the posterior distribution and the prior distribution of all parameters are very distinct (Table S4), indicating that the parameter estimates are influenced by the data and not by the priors (Bromham et al., 2018). Additionally we repeated the dating analysis with a coalescent exponential population growth tree prior (UCLD + HKY + exponential growth) and with a GTR model of nucleotide substitution (UCLD + GTR + constant size). All these analyses resulted in similar estimates of the age of the introductions of L2 in Africa, thus showing that our results are not strongly influenced by the tree prior and the nucleotide substitution model (Table S6).
We repeated the tip randomization test with the UCLD model as described above (20 replicates, one run per replicate, 105 million generations per replicate or more, burn-in 10%), and again we found a temporal signal (Figure S3).
To summarize the results, we sampled the trees from the three runs (5% burn-in corresponding to 10 million generations or more, sampling every 25,000 generation). We then summarized the 31,758 sampled trees, created a maximum clade credibility tree using the software TreeAnnotator from the BEAST2 package and used FigTree version 1.4.2 (http://tree.bio.ed.ac.uk/software/figtree) for visualization (Figure S4).
Results
Phylogenetic Inference of L2 Strains
We analyzed a total of 781 L2 genomes originating from 14 geographical regions including Eastern and Southern Africa (Figure S1 and Table S1). We focused on seven geographical regions that had more than 20 genomes each, and assigned the remainder to “Other,” including two genomes from Western Africa (Figure 1A). The resulting phylogeny of L2 was divided into two main sublineages: the L2–proto-Beijing and L2–Beijing, supporting previous results (Luo et al., 2015; Shitikov et al., 2017). The L2–proto-Beijing was the most basal L2 sublineage and was restricted to East- and Southeast Asia. L2–Beijing, particularly the “modern” (also known as “typical”) sublineage, was geographically widely distributed and included strains from Africa. We further characterized L2–Beijing using the recently described unified classification scheme for L2 (Shitikov et al., 2017).
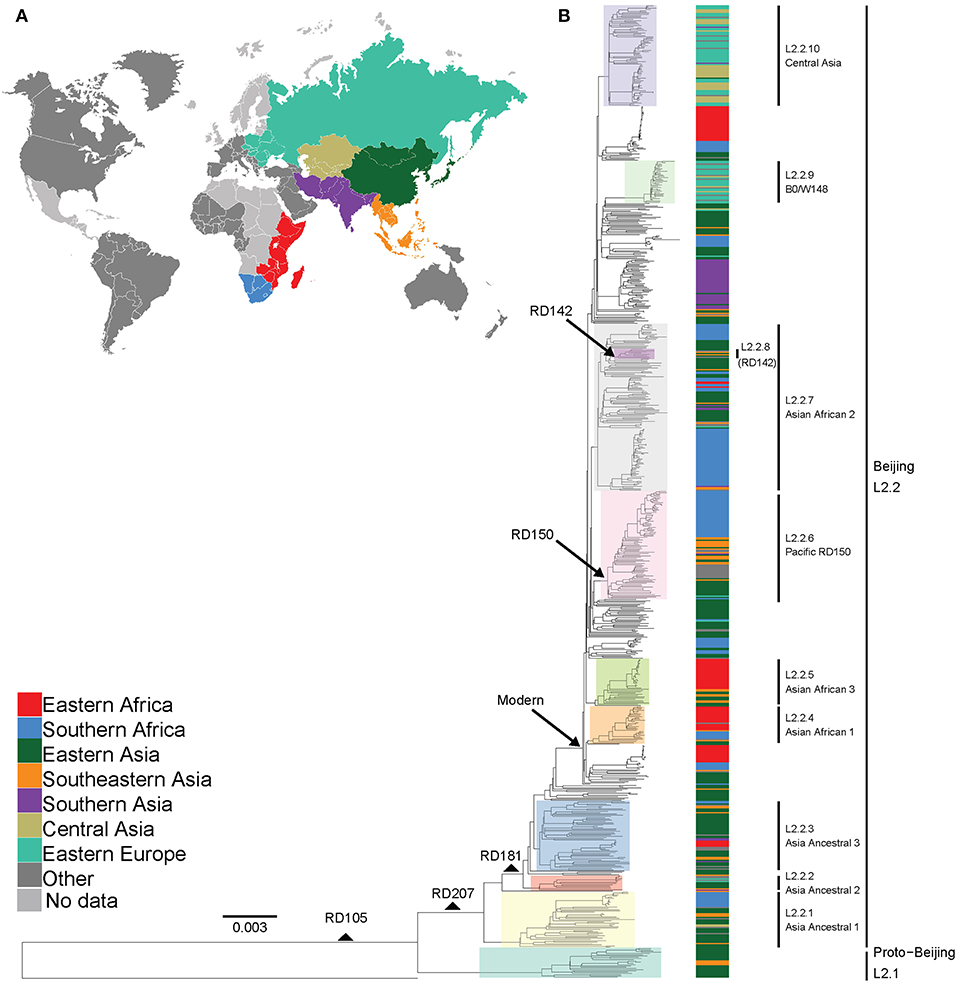
Figure 1. Global phylogeny and geographical distribution of L2 strains. (A) Geographical origin (according to United Nations geoscheme) for the 781 L2 strains. The geographical origins with less than 20 strains are colored dark gray and those with missing data light gray. (B) Maximum likelihood phylogeny inferred from 32,269 variable single nucleotide positions of the 781 strains rooted with the reference strain H37Rv. Taxa are colored according to the geographical origin of the strains and the clades are highlighted according to previously defined sublineages. L2 defining markers i.e., deletions (RD) are also mapped onto the phylogeny.
The Population Structure of L2–Beijing in Eastern and Southern Africa
Our findings showed the population of African L2–Beijing to be heterogeneous (Figures 1B, 2 and Table S5). Most of the African L2–Beijing strains were classified into several groups within the “modern” sublineage, which included primarily the “Asian-African” sublineages (L2.2.4, L2.2.5 and L2.2.7), consistent with previous findings (Merker et al., 2015). We also identified the “ancient” (atypical) strains among the African L2–Beijing. Given that “ancient” L2–Beijing strains (L2.2.1—L2.2.3) are generally uncommon (Luo et al., 2015), it is interesting to observe such strains in both African regions. In several instances, African L2–Beijing strains did not fall into any of the previously defined groups (Figure 2). Of the two African regions studied here, East Africa had higher proportion of previously uncharacterized L2–Beijing strains (43/92, 46.7%).
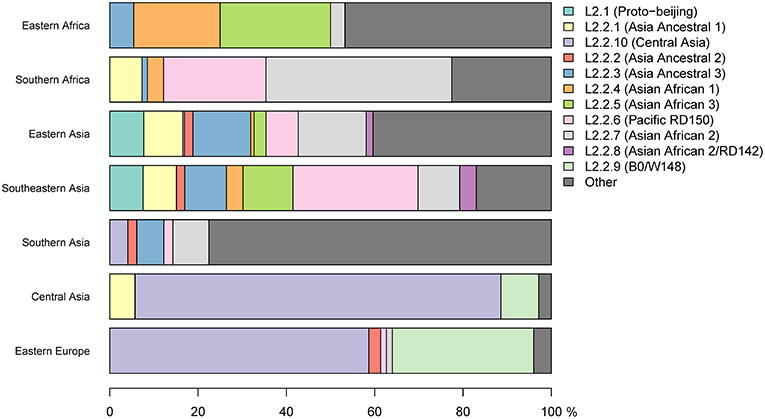
Figure 2. Frequency in proportions of L2 sub-lineages across seven geographical regions.
In summary, our findings show that African regions harbored distinct L2–Beijing populations. This is unlike Eastern Europe and Central Asia, where L2–Beijing is dominated by a few highly similar strains (Casali et al., 2014; Eldholm et al., 2016). Of note, L2–Beijing strains typical Eastern Europe and Central Asia were completely absent from the African populations (Figure 2).
Genetic Diversity of L2–Beijing Strains Across Geographic Regions
The spatial distribution of L2–Beijing sublineages and the prevalence of “ancient” L2–Beijing strains observed in this study and previously (Luo et al., 2015; Merker et al., 2015), suggest that L2–Beijing has expanded worldwide from Asia. This view can further be supported by the measures of genetic diversity of L2–Beijing in the different geographical regions (Figure 3). As expected, East- and Southeast Asia contained the most genetically diverse L2 populations, which is consistent with previous results (Luo et al., 2015). Conversely, L2 populations in other geographies were less genetically diverse, suggesting recent dissemination of L2 to these regions. Within Africa, Southern Africa showed a higher diversity in L2–Beijing populations compared to Eastern Africa.
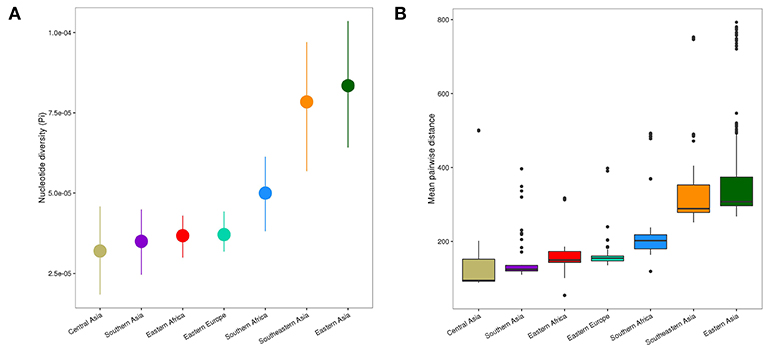
Figure 3. Genetic diversity of L2 strains within geographical regions. (A) Nucleotide diversity (π) per site of L2 strains by geography. Error bars are the 95% confidence intervals obtained by bootstrapping. (B) Pairwise genetic SNP distance of L2 by geography (p-values were obtained from Wilcoxon rank-sum tests). Each box represents the 25% and 75% quartiles and the line denotes the median.
The genetic diversity within the African L2–Beijing populations not only reflects the number and variety of source populations but also local patterns of diversification that occurred after their introduction. Therefore, the higher genetic diversity of the L2–Beijing populations in Southern Africa compared to Eastern Africa likely reflects both aspects.
Multiple Introductions of L2–Beijing From Asia Into Africa
Based on our reconstructed phylogeny, African L2–Beijing strains clustered into several unrelated clades indicating multiple introductions into Africa (Figure 1B). We next investigated the most likely geographical origins of those introductions. As anticipated, our ancestral reconstruction using RASP estimated East Asia as the most likely origin of all L2 (posterior probability of 96.1%) and L2–Beijing (posterior probability 92.5%) (Figure S5). Our data further indicate that L2–Beijing was introduced into Africa from East- and Southeast Asia on multiple occasions independently. Furthermore, we observed both direct introductions from Asia into Africa as well as subsequent dispersal within the continent (Figures S6, S7).
Using stochastic mapping, we estimated a total of 13 introductions or migration events (M1–M13) into Africa (Figure 4). Eight of the African L2–Beijing introductions originated from East Asia and five from Southeast Asia. Out of the 13 introductions, three (M3, M10, and M13) were present in both African regions analyzed here, suggesting initial introductions from Asia followed by subsequent spread within Africa. Overall, our analysis inferred more independent introductions into Southern Africa (n = 7, M1, M4, M7-9, M11 and M12, all of them with extant strains sampled in South Africa) than Eastern Africa (n = 3, M2 sampled in Malawi and Tanzania; M5 and M6 sampled in Kenya and in Malawi, respectively). Taken together, our data suggest that multiple migration events have shaped the populations of L2–Beijing in Africa.
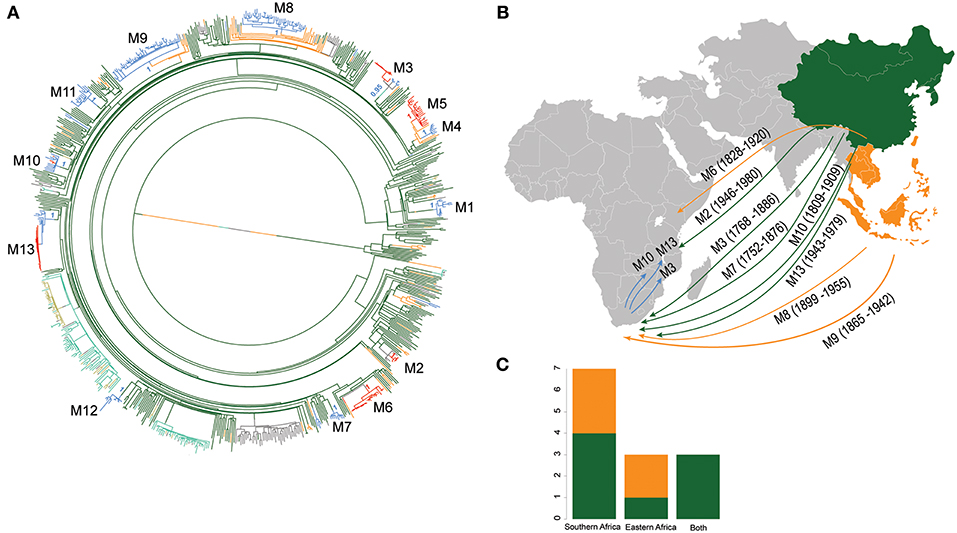
Figure 4. Introductions of L2 strains to Africa. (A) Stochastic mapping of the geographic origin of L2 strain obtained with SIMMAP onto the Maximum Likelihood phylogeny of the 781 MTB Lineage 2 strains. Branches are colored according to the geographical region inferred and one random tree is represented. The 13 migration events to Africa (M1–M13) are indicated and summary posterior probabilities (from 100 runs) of the ancestral states (colored according to their geographical region) are indicated at the nodes defining each M event (B) Proposed scenario for representative events of the multiple introductions of L2–Beijing into Africa. (C) Plot summarizing the number of introduction events to Eastern and Southern Africa from East- and Southeast Asia. Color codes are the same as in Figure 3.
Bayesian Molecular Dating
Different hypotheses have been formulated on the possible timing of the introduction of L2–Beijing into Africa (van Helden et al., 2002). Here we used tip-calibration to date the phylogenetic tree of L2 and estimate the age of its introduction to Africa. For these analyses, we identified 308 strains among the 781 for which the sampling year was known. These strains were sampled during a period of 19 years; 1995–2014 (Figure S8), were evenly distributed on the complete phylogenetic tree (Figure S9) and included 40% members of the African L2–Beijing strains (Figure S10). Eleven of the 13 African introductions were represented in this dataset (M1-M3 and M6-M13).
We performed a Date Randomization Test with a strict clock and with a relaxed clock. With both models we detected no overlap in the 95% credibility interval of the clock rate estimates of observed and randomized datasets indicating that there was sufficient temporal signal in the dataset to perform inference (see methods, Figures S2, S3). Further, We found that the UCLD clock had the highest marginal likelihood and a Bayes Factor of 27 with the second best fitting model, the strict clock (Table 1), indicating strong evidence in favor of the UCLD clock (Kass and Raftery, 1995).
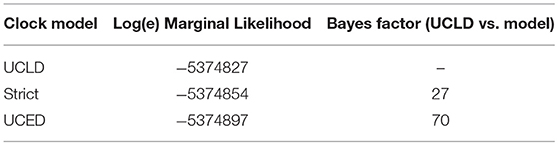
Table 1. Model selection based on path sampling Log-Marginal Likelihood.
We performed a phylogenetic analysis with BEAST2 using the UCLD clock. Under the UCLD model, the coefficient of variation (COV), which is a summary of the branch rates distribution (standard deviation divided by the mean), gives an indication on the clock-likeness of the data (Drummond et al., 2006). A coefficient of variation of zero indicates that the data fit a strict clock, whilst a greater COV indicates a higher heterogeneity of rates through the phylogeny. We obtained a mean COV of 0.22 (95% credibility interval = 0.1732, 0.2732), indicating a moderate level of rate variation across different branches and thus supporting the results of the path sampling analysis that favored the UCLD model.
Recent Origins of the African L2–Beijing Clades
We used the UCLD clock model to infer the clock rate and divergent times of the 308 L2 strains with known sampling dates and estimated a mean substitution rate of 1.34 × 10⁻⁷ [95% Highest Posterior Density (HPD), 9.2867 × 10⁻⁸–1.7719 × 10⁻⁷]. These estimates are in agreement with previously reported rates from epidemiological studies (Walker et al., 2013; Eldholm et al., 2016). However, the estimated rate by Eldholm et al. (2016) is relatively higher compared to our estimates, which likely reflects the fact that our dataset included the entire Lineage 2 as opposed to a only a single particular clade in the case of Eldholm et al. (2016).
We estimated the most recent common ancestor (MRCA) of the extant L2–Beijing of the 308 strains to the year 1225 [95% HPD, 900–1519] (Figure S4). This estimate was slightly younger than the previous estimate for the whole of Lineage 2 by the study of (Bos et al., 2014), likely reflecting the difference in methodology. The latter study used ancient M. pinipeddii DNA recovered from pre-Columbian human remains to calibrate the phylogeny as opposed to tip-dating based on contemporary sampling dates. For each African clade, we estimated the year of introduction using the 0.975 quantile of the HPD of the age of the MRCA as the upper limit (most recent possible year) and the 0.025 quantile of the HPD of the divergence time between the closest non-African L2–Beijing strain (the closest outgroup) and the African clade of interest as lowest limit (most ancient possible year). This approach produced conservative estimates, while relying only on the age of the MRCA of the African clades would systematically underestimate the age of the introductions. Our estimates placed the earliest introductions of the African L2–Beijing (M1, M3, M7, and M12) in the eighteenth and nineteenth century (Figure 5 and Table S6). Four additional migration events (M6, M9, M10, and M11) were estimated to have occurred between the beginning of the nineteenth century and the first half of the twentieth century. Finally, the three most recent introductions to Africa happened in the second half of the twentieth century (M2, M8, and M13). Diversity patterns of the African clades exclusive to Eastern- and Southern Africa could further provide support for the recent introductions of African L2–Beijing. We thus calculated the pairwise SNP distances within the individual introductions to explore the local patterns of diversification associated with regional epidemics after the introductions. Although strains within Southern African introductions were relatively more distantly related, L2–Beijing strains from both African regions were on average 20 to 40 SNPs apart (Figures S11–S13). The latter thresholds were proposed to correspond to strains involved in transmission clusters of estimated 50 to100 years (Meehan et al., 2018), supporting the relatively recent introductions of L2–Beijing into the African continent.
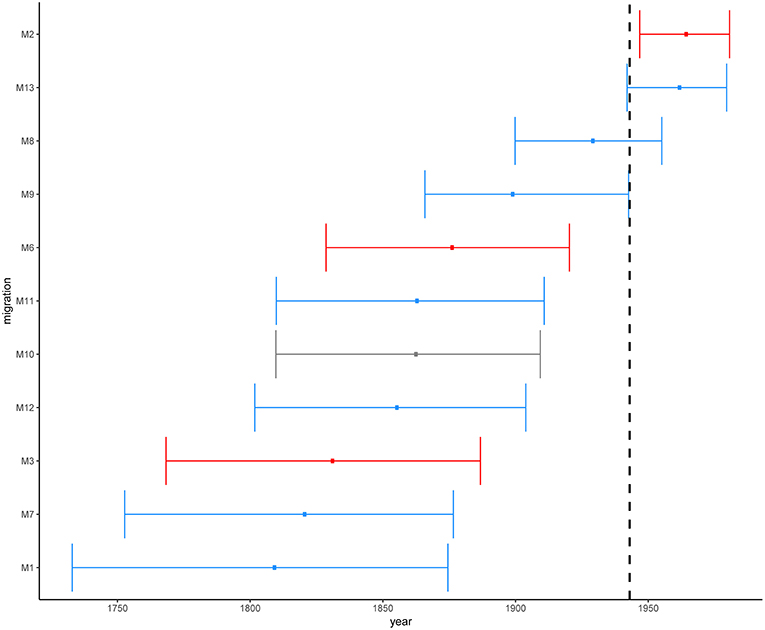
Figure 5. Estimated time in median ages for the introductions of African L2–Beijing (M1-M3 and M6-M13). Introductions to Eastern Africa are colored in red and those to Southern Africa in blue. Migration M10 contained L2–Beijing from both Southern and Eastern Africa. Dotted line marks the year of first anti-TB drug discovery (1943). The error bars correspond to the 95% HPD.
Overall, these results indicate that the different introductions of L2–Beijing to Africa occurred over a period of 300 years. While the earliest introduction is unlikely to have happened after 1732–1874, the most recent is unlikely to have occurred before 1946–1980. However, our 95% HPDs show a wide range of uncertainty, which likely resulted from extrapolating several centuries back in time based on a comparably short calibration interval spanning only 19 years.
Introductions of L2–Beijing Into Africa Unrelated to Drug Resistance
Because of the repeated association of L2–Beijing with antibiotic resistance (Borrell and Gagneux, 2009), the emergence and dissemination of L2–Beijing strains has often been attributed to drug resistance. However, our estimated timing of these introductions suggest that African L2–Beijing strains were introduced prior the discovery of TB antibiotics, and thus must have involved drug-susceptible strains (Figure 5). To explore this question further, we assessed the drug resistance profiles of L2–Beijing strains linked to the various introduction events into the two African regions. We found that all the Eastern African populations contained only drug-susceptible strains and that approximately three-quarters of L2–Beijing strains in the Southern African populations were drug-susceptible, with the remaining being either mono–, multi–, or extensively drug-resistant (Figure 6 and Figure S14). Taken together, these results suggest that the emergence of L2–Beijing in Africa, particularly in Eastern Africa, was not driven by drug resistance. Moreover, our data indicate independent acquisition of drug resistance for the resistant strains detected in the Southern African L2–Beijing population (Figure 6), which might partly contribute to the subsequent spread of L2–Beijing in Southern Africa but not in Eastern Africa.
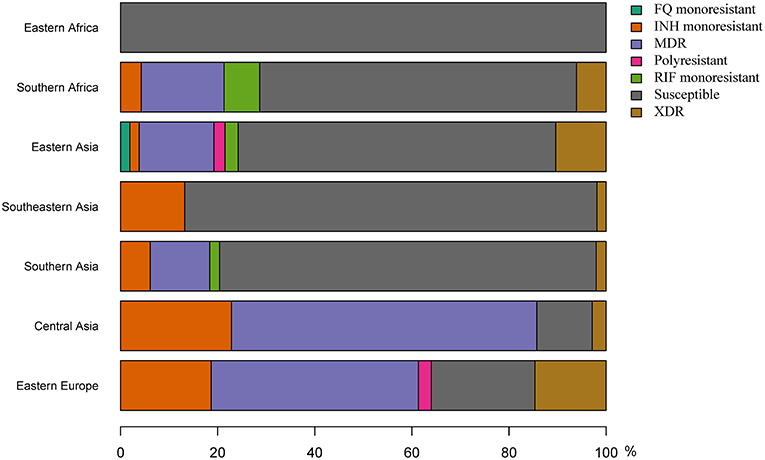
Figure 6. Proportions of drug resistance profiles for L2 strains in seven geographical regions.
Discussion
This study investigated the most likely geographical origin of the L2–Beijing in Africa. In line with previous findings (Luo et al., 2015; Merker et al., 2015), we identified East Asia as the most likely place of origin of L2 and L2–Beijing. Our findings further revealed multiple independent introductions of L2–Beijing into Africa linked to separate populations originating from both East- and Southeast Asia. Some of these introductions were followed by further onward spread of L2–Beijing within African regions. Finally, we demonstrate that most introductions of L2–Beijing on the continent occurred before the age of antibiotics.
L2–Beijing has received much attention given its hypervirulence in infection models (Manca et al., 2001; Ribeiro et al., 2014), faster progression to disease and higher transmission potential in humans (de Jong et al., 2008; Holt et al., 2018), frequent association with drug resistance, and recent emergence in different regions of the world (Bifani et al., 2002; Borrell and Gagneux, 2009; Fenner et al., 2013). Several studies indicate L2–Beijing originated in Asia and spread from there to the rest of the world (Luo et al., 2015; Merker et al., 2015). Our results support this notion by identifying “Asia” as the most likely geographical origin of both L2 and L2–Beijing based on our ancestral reconstructions and the fact the L2–Beijing populations in Asia are much more diverse than in other regions. In addition, our findings show that L2–Beijing was introduced into Africa multiple times from both East- and Southeast Asia. The presence of L2–Beijing in South Africa has previously been proposed to be due to the importation of slaves from Southeastern Asia by Europeans in the seventeenth and eighteenth centuries followed by the import of Chinese labor-forces in the early 1900s (van Helden et al., 2002; Mokrousov et al., 2005). Our Bayesian dating estimates predicted the earliest introductions of L2– Beijing into Africa to have occurred in the eighteenth and nineteenth centuries, concurring with these proposed time periods. However, our findings also point to later introductions of L2–Beijing into the continent in the nineteenth and early twentieth centuries. The timings of the latest three introductions in the second half of the twentieth century coincide with the decolonization and post-colonial period in Africa when investments into infrastructure and other projects by Chinese enterprises substantially increased (Yuan, 2006; Rice, 2011). These activities also brought many Chinese workers to Africa during a time when TB was still very prevalent in China (Murray, 2018). Hence, many of these workers were likely latently infected with L2–Beijing and might have later reactivated (Pescarini et al., 2017). Overall, our findings suggest that L2–Beijing has emerged in Africa over the last 300 years and that these introductions have occurred sporadically ever since.
The repeated association of L2–Beijing with drug resistance (Borrell and Gagneux, 2009) has led some to propose that drug resistance is another reason why this sublineage might successfully compete against and eventually replace other M. tuberculosis genotypes (Parwati et al., 2010). However, the underlying reason for the association of L2–Beijing with drug resistance remains unclear (Borrell and Trauner, 2017), and it is also far from universal, with several reports from e.g., China and other regions finding no such association (Hanekom et al., 2007; Yang et al., 2012). Our results show that most introduction events of L2–Beijing into Africa pre-date the antibiotic era, and because of that, these introductions were most likely caused by drug-susceptible strains. The notion that the initial emergence of L2–Beijing in Africa was not driven by drug resistance is further supported by our findings that none of L2–Beijing strains from Eastern Africa strains analyzed here were drug-resistant. Of note, our observations suggest that drug resistance in South Africa was acquired via independent events post initial introductions from Asia. This is in sharp contrast to the situation in Eastern Europe and Central Asia, where L2–Beijing is highly prevalent but dominated by few recently expanded drug-resistant clones, which account for up to 60% of the L2–Beijing populations in some of these countries (Casali et al., 2014; Eldholm et al., 2016). The association of L2–Beijing with drug resistance in these regions were likely favored by the economic and public health crises that followed the collapse of Soviet Union (Luo et al., 2015; Merker et al., 2015).
Based on our finding that the original introductions of L2–Beijing into Africa involved drug-susceptible strains and that the prevalence of drug-resistant L2–Beijing in Africa overall is comparably low (WHO, 2017), we propose that some of the other characteristics of this sub-lineage, in particular its high virulence, high transmissibility and rapid progression from infection to disease, were responsible for the initial competitive success of L2–Beijing in Africa. Until recently, Africa was considered a Virgin Soil for TB and that TB was only introduced following European contact (Comas et al., 2015). However, this notion is incompatible with the current evidence supporting an African origin for the MTBC overall (Hershberg et al., 2008; Wirth et al., 2008; Comas et al., 2013). Indeed, Africa is the only continent to harbor all seven known human-adapted MTBC lineages, three of which are almost exclusively observed there (Gagneux, 2018), as well as several animal-adapted MTBC ecotypes, which affect several wild African mammals (Brites et al., 2018). Moreover, one study showed that TB epidemics on the continent were caused by many different “native” genotypes prior to foreign contacts (Comas et al., 2015), suggesting that TB existed in Africa before the initial European contact. Perhaps the clinical and epidemiological picture of TB in Africa was different at the time, characterized by a low virulent and slow progressing disease, which would have escaped the attention of European colonial officials reporting the absence of TB in Africa, at a time when the TB epidemic was raging in the cities of Europe and North America, killing up to 20% of the adult population (Comas and Gagneux, 2011). We hypothesized previously that rapid co-expansion of MTBC L2, L3, and L4 with their respective human host populations in China, India and Europe might have selected for higher virulence and shorter latency in these “modern” lineages (Hershberg et al., 2008). The emergence and expansion of these “foreign” genotypes including L2–Beijing into Africa as reported here, and as reported earlier for L4 (Stucki et al., 2016; Brynildsrud et al., 2018), demonstrate the ability of these lineages to successfully compete against the existing genotypes on the continent, likely as a result of their high transmissibility and rapid progression to disease. Following their initial establishment, poor TB treatment programs subsequently selected for drug resistance in L2–Beijing but also in other MTBC lineages including L4, which might have facilitated their further spread in countries such as South Africa (Müller et al., 2013).
Finally, the estimates of the TMRCA for L2 reported here are largely consistent with recent reports using similar tip-dating analyses based on isolation dates (Eldholm et al., 2016), and support the notion that the MTBC overall is younger than what has been proposed in earlier studies, based on a hypothesized co-divergence of the human-adapted MTBC and modern humans since their migration out of Africa (Comas et al., 2013; Luo et al., 2015).
This study is limited by the fact that we analyzed a globally diverse collection of L2 genomes available in public repositories. Hence, these strains might not be fully representative of the respective geographical regions. Moreover, our African L2–Beijing dataset came from convenient sampling and comprised L2–Beijing mainly from Eastern and Southern Africa, as whole genome data of L2–Beijing from the other African regions were unavailable at the time of the study. However, the representation of African L2–Beijing in our sample reflects the overall prevalence of this sub-lineage as recently reported for the continent (Mbugi et al., 2016; Chihota et al., 2018). Moreover, although regions outside of Eastern- and Southern Africa were underrepresented, this is unlikely to invalidate our findings regarding the multiple independents of L2–Beijing into Africa, except by underestimating the number of true introductions.
In conclusion, this is the first study to address the geographical origins of L2–Beijing in Africa using whole genome sequencing data. Our findings indicate multiple independent introductions of L2–Beijing epidemics into Africa from East- and Southeast Asia during the last 300 years that were unrelated to drug resistance. The TB epidemics in Africa have remained fairly stable over the last few decades (WHO, 2017). However, Africa's population growth and increasing urbanization (driven by booming economies) are likely to have an impact on the future of TB in this continent, whether directly by e.g., facilitating transmission or indirectly by promoting new risk factors such as diabetes that increase TB susceptibility (Dye and Williams, 2010). It is therefore crucial to follow the TB epidemics in the continent very closely, especially those related to hypervirulent strains such as L2–Beijing, as these might take particular advantage of this expanding ecological niche (Cowley et al., 2008).
Data Availability
The xml files used for this study can be found here https://github.com/SwissTPH/TBRU_L2Africa.git.
Author Contributions
LR, DB, FM, DS, LF, and SG planned the study. SL, BM, and JF performed the experiments. LR, DB, FM, SMG, SL, BM, CB, SB, KM, MB, LJ, KR, EJC, LD and LF contributed strains and prepared the data. LR, DB, FM, and SG analyzed the data. LR, DB, FM, and SG drafted the manuscript. All authors critically reviewed the manuscript.
Conflict of Interest Statement
The authors declare that the research was conducted in the absence of any commercial or financial relationships that could be construed as a potential conflict of interest.
Acknowledgments
We would like to thank Sebastián Duchêne and Yan Yu for their technical support and Linda-Gail Bekker for contributing strains. All bioinformatics analyses were performed at the scientific computing core facility of the University of Basel, sciCORE (http://scicore.unibas.ch/). This work was supported by the Swiss National Science Foundation (grants 310030_166687 to SG), the European Research Council (309540-EVODRTB to SG) and SystemsX.ch This research was also partially supported (strain collection) by a funding supplement from the National Institutes of Allergy and Infectious Diseases (NIAID) under award numbers U01 AI069924 (IeDEA Southern Africa) and U01 AI069911 (IeDEA East Africa).
Supplementary Material
The Supplementary Material for this article can be found online at: https://www.frontiersin.org/articles/10.3389/fevo.2019.00112/full#supplementary-material
References
Affolabi, D., Faïhun, F., Sanoussi, N., Anyo, G., Shamputa, I. C., Rigouts, L., et al. (2009). Possible outbreak of streptomycin-resistant Mycobacterium tuberculosis Beijing in Benin. Emerging Infect. Dis. 15, 1123–1125. doi: 10.3201/eid1507.080697
Baele, G., Li, W. L., Drummond, A. J., Suchard, M. A., and Lemey, P. (2012). Accurate model selection of relaxed molecular clocks in bayesian phylogenetics. Mol. Biol. Evol. 30, 239–243. doi: 10.1093/molbev/mss243
Bifani, P. J., Mathema, B., Kurepina, N. E., and Kreiswirth, B. N. (2002). Global dissemination of the Mycobacterium tuberculosis W-Beijing family strains. Trends Microbiol. 10, 45–52. doi: 10.1016/S0966-842X(01)02277-6
Bollback, J. P. (2006). SIMMAP: stochastic character mapping of discrete traits on phylogenies. BMC Bioinformatics 7:88. doi: 10.1186/1471-2105-7-88
Borrell, S., and Gagneux, S. (2009). Infectiousness, reproductive fitness and evolution of drug-resistant Mycobacterium tuberculosis. Int. J. Tuberc. Lung dis. 13, 1456–1466.
Borrell, S., and Trauner, A. (2017). Strain diversity and the evolution of antibiotic resistance. Adv. Exp. Med. Biol. 1019, 263–279. doi: 10.1007/978-3-319-64371-7_14
Bos, K. I., Harkins, K. M., Herbig, A., Coscolla, M., Weber, N., Comas, I., et al. (2014). Pre-Columbian mycobacterial genomes reveal seals as a source of new world human tuberculosis. Nature 514, 494–497. doi: 10.1038/nature13591
Bouckaert, R., Heled, J., Kühnert, D., Vaughan, T., Wu, C. H., Xie, D., et al. (2014). BEAST 2: a software platform for bayesian evolutionary analysis. PLoS Comput. Biol. 10:1003537. doi: 10.1371/journal.pcbi.1003537
Brites, D., Loiseau, C., Menardo, F., Borrell, S., Boniotti, M. B., Warren, R., et al. (2018). A new phylogenetic framework for the animal-adapted mycobacterium tuberculosis complex. Front. Microbiol. 9:2820. doi: 10.3389/fmicb.2018.02820
Bromham, L., Duchêne, S., Hua, X., Ritchie, A. M., Duchêne, D. A., and Ho, S. Y. W. (2018). Bayesian molecular dating: opening up the black box. Biol. Rev. Wiley Blackwell 93, 1165–1191. doi: 10.1111/brv.12390
Brynildsrud, O. B., Pepperell, C. S., Suffys, P., Grandjean, L., Monteserin, J., Debech, N., et al. (2018). Global expansion of Mycobacterium tuberculosis lineage 4 shaped by colonial migration and local adaptation. Sci. Adv. 4:eaat5869. doi: 10.1126/sciadv.aat5869
Casali, N., Nikolayevskyy, V., Balabanova, Y., Harris, S. R., Ignatyeva, O., Kontsevaya, I., et al. (2014). Evolution and transmission of drug-resistant tuberculosis in a Russian population. Nat. Genet. 46, 279–286. doi: 10.1038/ng.2878
Casali, N., Nikolayevskyy, V., Balabanova, Y., Ignatyeva, O., Kontsevaya, I., Harris, S. R., et al. (2012). Microevolution of extensively drug-resistant tuberculosis in Russia. Genome Res. 22, 735–745. doi: 10.1101/gr.128678.111
Chihota, V. N., Niehaus, A., Streicher, E. M., Wang, X., Sampson, S. L., Mason, P., et al. (2018). Geospatial distribution of Mycobacterium tuberculosis genotypes in Africa. PLoS ONE 13:e0200632. doi: 10.1371/journal.pone.0200632
Coll, F., McNerney, R., Guerra-Assunção, J. A., Glynn, J. R., Perdigão, J., Viveiros, M., et al. (2014). A robust SNP barcode for typing Mycobacterium tuberculosis complex strains. Nat. Commun. 5:4812. doi: 10.1038/ncomms5812
Comas, I., Chakravartti, J., Small, P. M., Galagan, J., Niemann, S., Kremer, K., et al. (2010). Human T cell epitopes of Mycobacterium tuberculosis are evolutionarily hyperconserved. Nat. Genet. 42, 498–503. doi: 10.1038/ng.590
Comas, I., Coscolla, M., Luo, T., Borrell, S., Holt, K. E., Kato-Maeda, M., et al. (2013). Out-of-Africa migration and Neolithic coexpansion of Mycobacterium tuberculosis with modern humans. Nat. Genet. 45, 1176–1182. doi: 10.1038/ng.2744
Comas, I., and Gagneux, S. (2011). A role for systems epidemiology in tuberculosis research. Trends Microbiol. 19, 492–500. doi: 10.1016/j.tim.2011.07.002
Comas, I., Hailu, E., Kiros, T., Bekele, S., Mekonnen, W., Gumi, B., et al. (2015). Population genomics of Mycobacterium tuberculosis in ethiopia contradicts the Virgin soil hypothesis for human tuberculosis in Sub-Saharan Africa. Curr. Biol. 25, 3260–3266. doi: 10.1016/j.cub.2015.10.061
Coscolla, M., and Gagneux, S. (2014). Consequences of genomic diversity in Mycobacterium tuberculosis. Semin. Immunol. 26, 431–444. doi: 10.1016/j.smim.2014.09.012
Cowley, D., Govender, D., February, B., Wolfe, M., Steyn, L., Evans, J., et al. (2008). Recent and rapid emergence of w-beijing strains of Mycobacterium tuberculosis in Cape Town, South Africa. Clin. Infect. Dis. 47, 1252–1259. doi: 10.1086/592575
de Jong, B. C., Hill, P. C., Aiken, A., Awine, T., Antonio, M., Adetifa, I. M., et al. (2008). Progression to active tuberculosis, but not transmission, varies by Mycobacterium tuberculosis lineage in The Gambia. J. Infect. Dis. 198, 1037–1043. doi: 10.1086/591504
Drummond, A. J., Ho, S. Y., Phillips, M. J., and Rambaut, A. (2006). Relaxed phylogenetics and dating with confidence. PLoS Biol. 4:88. doi: 10.1371/journal.pbio.0040088
Dye, C., and Williams, B. G. (2010). The population dynamics and control of tuberculosis. Science 328, 856–861. doi: 10.1126/science.1185449
Eldholm, V., Pettersson, J. H., Brynildsrud, O. B., Kitchen, A., Rasmussen, E. M., Lillebaek, T., et al. (2016). Armed conflict and population displacement as drivers of the evolution and dispersal of Mycobacterium tuberculosis. Proc. Natl Acad. Sci. 113, 13881–13886. doi: 10.1073/pnas.1611283113
Fenner, L., Egger, M., Bodmer, T., Furrer, H., Ballif, M., Battegay, M., et al. (2013). HIV infection disrupts the sympatric host–pathogen relationship in human tuberculosis. PLoS Genetics. 9:e1003318. doi: 10.1371/journal.pgen.1003318
Gagneux, S. (2018). Ecology and evolution of Mycobacterium tuberculosis. Nat. Rev. Microbiol. 16, 202–213. doi: 10.1038/nrmicro.2018.8
Gehre, F., Kumar, S., Kendall, L., Ejo, M., Secka, O., Ofori-Anyinam, B., et al. (2016). A Mycobacterial Perspective on tuberculosis in West Africa: significant geographical variation of M. africanum and other M. tuberculosis complex lineages. PLoS Negl Trop Dis 10:e0004408. doi: 10.1371/journal.pntd.0004408
Githui, W. A., Jordaan, A. M., Juma, E. S., Kinyanjui, P., Karimi, F. G., Kimwomi, J., et al. (2004). Identification of MDR-TB Beijing/W and other Mycobacterium tuberculosis genotypes in Nairobi, Kenya. Int. J. Tuberc. Lung dis. 8, 352–360.
Glynn, J. R., Alghamdi, S., Mallard, K., McNerney, R., Ndlovu, R., Munthali, L., et al. (2010). Changes in Mycobacterium tuberculosis genotype families over 20 years in a population based study in Northern Malawi. PLoS ONE 5:e12259. doi: 10.1371/journal.pone.0012259
Guerra-Assunção, J. A., Crampin, A. C., Houben, R. M., Mzembe, T., Mallard, K., Coll, F., et al. (2015). Large-scale whole genome sequencing of M. tuberculosis provides insights into transmission in a high prevalence area. eLife 4:e05166. doi: 10.7554/eLife.05166
Hanekom, M., van der Spuy, G. D., Streicher, E., Ndabambi, S. L., McEvoy, C. R., Kidd, M., et al. (2007). A recently evolved sublineage of the Mycobacterium tuberculosis Beijing strain family is associated with an increased ability to spread and cause disease. J. Clin. Microbiol. Am. Soc. Microbiol. 45, 1483–1490. doi: 10.1128/JCM.02191-06
Hasegawa, M., Kishino, H., and Yano, T. (1985). Dating of the human-ape splitting by a molecular clock of mitochondrial DNA. J. Mol. Evol. 22, 160–174.
Hershberg, R., Lipatov, M., Small, P. M., Sheffer, H., Niemann, S., Homolka, S., et al. (2008). High functional diversity in mycobacterium tuberculosis driven by genetic drift and human demography. PLoS Biol. 6:e311. doi: 10.1371/journal.pbio.0060311
Holt, K. E., McAdam, P., Thai, P. V. K., Thuong, N. T. T., Ha, D. T. M., Lan, N. N., et al. (2018). Frequent transmission of the Mycobacterium tuberculosis Beijing lineage and positive selection for the EsxW Beijing variant in Vietnam. Nat. Genet. 50, 849–856. doi: 10.1038/s41588-018-0117-9
Kass, R. E., and Raftery, A. E. (1995). Bayes factors. J. Am. Stat. Assoc. 90, 773–795. doi: 10.1080/01621459.1995.10476572
Kato-Maeda, M., Shanley, C. A., Ackart, D., Jarlsberg, L. G., Shang, S., Obregon-Henao, A., et al. (2012). Beijing sublineages of Mycobacterium tuberculosis differ in pathogenicity in the guinea pig. Clin. Vaccine Immunol. 19, 1227–1237. doi: 10.1128/CVI.00250-12
Klopper, M., Warren, R. M., Hayes, C., Gey van Pittius, N. C., Streicher, E. M., Müller, B., et al. (2013). Emergence and spread of extensively and totally drug-resistant tuberculosis, South Africa. Emerging Infect. Dis. 19, 449–455. doi: 10.3201//EID1903.120246
Koch, A. S., Brites, D., Stucki, D., Evans, J. C., Seldon, R., Heekes, A., et al. (2017). The influence of HIV on the evolution of Mycobacterium tuberculosis. Mol. Biol. Evol. 34, 1654–1668. doi: 10.1093/molbev/msx107
Lartillot, N., and Philippe, H. (2006). Computing bayes factors using thermodynamic integration. Syst. Biol. 55, 195–207. doi: 10.1080/10635150500433722
Luo, T., Comas, I., Luo, D., Lu, B., Wu, J., Wei, L., et al. (2015). Southern East Asian origin and coexpansion of Mycobacterium tuberculosis Beijing family with Han Chinese. Proc Natl. Acad. Sci. U.S.A. 112, 8136–8141. doi: 10.1073/pnas.1424063112
Manca, C., Tsenova, L., Bergtold, A., Freeman, S., Tovey, M., Musser, J. M., et al. (2001). Virulence of a Mycobacterium tuberculosis clinical isolate in mice is determined by failure to induce Th1 type immunity and is associated with induction of IFN-α/β. Proc. Natl Acad. Sci. 98, 5752–5757. doi: 10.1073/pnas.091096998
Manson, A. L., Cohen, K. A., Abeel, T., Desjardins, C. A., Armstrong, D. T., Barry, C. E., et al. (2017). Genomic analysis of globally diverse Mycobacterium tuberculosis strains provides insights into the emergence and spread of multidrug resistance. Nat. Genet. 49:395–402. doi: 10.1038/ng.3767
Mbugi, E. V., Katale, B. Z., Streicher, E. M., Keyyu, J. D., Kendall, S. L., Dockrell, H. M., et al. (2016). Mapping of Mycobacterium tuberculosis complex genetic diversity profiles in tanzania and other African countries. PLoS ONE. 11:e0154571. doi: 10.1371/journal.pone.0154571
Meehan, C. J., Moris, P., Kohl, T. A., Pečerska, J., Akter, S., Merker, M., et al. (2018). The relationship between transmission time and clustering methods in 1 Mycobacterium 2. bioRxiv 11:38. doi: 10.1101/302232
Merker, M., Blin, C., Mona, S., Duforet-Frebourg, N., Lecher, S., Willery, E., et al. (2015). Evolutionary history and global spread of the Mycobacterium tuberculosis beijing lineage. Nat. Publish. Group 47, 242–249. doi: 10.1038/ng.3195
Mokrousov, I., Ly, H. M., Otten, T., Lan, N. N., Vyshnevskyi, B., Hoffner, S., et al. (2005). Origin and primary dispersal of the Mycobacterium tuberculosis Beijing genotype: clues from human phylogeography. Genome Res. 15, 1357–1364. doi: 10.1101/gr.3840605
Müller, B., Borrell, S., Rose, G., and Gagneux, S. (2013). The heterogeneous evolution of multidrug-resistant Mycobacterium tuberculosis. Trends Genetics 29, 160–169. doi: 10.1016/j.tig.2012.11.005
Murray, J. F. (2018). Tuberculosis in China before, during, and after the Sino-Japanese war, in Tuberculosis and war. Karger Publish. 43, 204–212. doi: 10.1159/000481489
Paradis, E., Claude, J., and Strimmer, K. (2004). APE: analyses of phylogenetics and evolution in R language. Bioinformatics 20, 289–290. doi: 10.1093/bioinformatics/btg412
Parwati, I., van Crevel, R., and van Soolingen, D. (2010). Possible underlying mechanisms for successful emergence of the Mycobacterium tuberculosis Beijing genotype strains. Lancet Infect. Dis. 10, 103–111. doi: 10.1016/S1473-3099(09)70330-5
Pescarini, J. M., Rodrigues, L. C., Gomes, M. G., and Waldman, E. A. (2017). Migration to middle-income countries and tuberculosis-global policies for global economies. Global. Health 13:15. doi: 10.1186/s12992-017-0236-6
Portevin, D., Sukumar, S., Coscolla, M., Shui, G., Li, B., Guan, X. L., et al. (2014). Lipidomics and genomics of Mycobacterium tuberculosis reveal lineage-specific trends in mycolic acid biosynthesis. Microbiologyopen 3, 823–835. doi: 10.1002/mbo3.193
Rambaut, A., Drummond, A. J., Xie, D., Baele, G., and Suchard, M. A. (2018). Software for systematics and evolution posterior summarization in bayesian phylogenetics using tracer 1.7. Syst. Biol. 67, 901–904. doi: 10.1093/sysbio/syy032
Ramsden, C., Melo, F. L., Figueiredo, L. M., Holmes, E. C., and Zanotto, P. M., and the VGDN Consortium (2008). High rates of molecular evolution in hantaviruses. Mol. Biol. Evol. 25, 1488–1492. doi: 10.1093/molbev/msn093
Revell, L. J. (2012). phytools: an R package for phylogenetic comparative biology (and other things). Methods Ecol. Evol. 3, 217–223. doi: 10.1111/j.2041-210X.2011.00169.x
Ribeiro, S. C., Gomes, L. L., Amaral, E. P., Andrade, M. R., Almeida, F. M., Rezende, A. L., et al. (2014). Mycobacterium tuberculosis strains of the modern sublineage of the Beijing family are more likely to display increased virulence than strains of the ancient sublineage. J. Clin. Microbiol. 52, 2615–2624. doi: 10.1128/JCM.00498-14
Rieux, A., and Balloux, F. (2016). Inferences from tip-calibrated phylogenies: a review and a practical guide. Mol. Ecol. 25, 1911–1924. doi: 10.1111/mec.13586
Rieux, A., and Khatchikian, C. E. (2017). tipdatingbeast : an r package to assist the implementation of phylogenetic tip-dating tests using beast. Mol. Ecol. Res. 17, 608–613. doi: 10.1111/1755-0998.12603
Shitikov, E., Kolchenko, S., Mokrousov, I., Bespyatykh, J., Ischenko, D., Ilina, E., et al. (2017). Evolutionary pathway analysis and unified classification of East Asian lineage of Mycobacterium tuberculosis. Sci. Rep. 7:9227. doi: 10.1038/s41598-017-10018-5
Stamatakis, A. (2006). RAxML-VI-HPC: maximum likelihood-based phylogenetic analyses with thousands of taxa and mixed models. Bioinformatics 22, 2688–2690. doi: 10.1093/bioinformatics/btl446
Steiner, A., Stucki, D., Coscolla, M., Borrell, S., and Gagneux, S. (2014). KvarQ: targeted and direct variant calling from fastq reads of bacterial genomes. BMC Genomics 15:881. doi: 10.1186/1471-2164-15-881
Stucki, D., Brites, D., Jeljeli, L., Coscolla, M., Liu, Q., Trauner, A., et al. (2016). Mycobacterium tuberculosis lineage 4 comprises globally distributed and geographically restricted sublineages. Nat. Genet. 48, 1535–1543. doi: 10.1038/ng.3704
Suzuki, R., and Shimodaira, H. (2006). Pvclust: an R package for assessing the uncertainty in hierarchical clustering. Bioinformatics. 22, 1540–1542. doi: 10.1093/bioinformatics/btl117
van der Spuy, G. D., Kremer, K., Ndabambi, S. L., Beyers, N., Dunbar, R., Marais, B. J., et al. (2009). Changing Mycobacterium tuberculosis population highlights clade-specific pathogenic characteristics. Tuberculosis. Churchill Livingstone. 89, 120–125. doi: 10.1016/j.tube.2008.09.003
van Helden, P. D., Warren, R. M., Victor, T. C., van der Spuy, G., Richardson, M., and Hoal-van Helden, E. (2002). Strain families of Mycobacterium tuberculosis. Trends Microbiol. 10, 167–168. doi: 10.1016/S0966-842X(02)02317-X
Walker, T. M., Ip, C. L., Harrell, R. H., Evans, J. T., Kapatai, G., Dedicoat, M. J., et al. (2013). Whole-genome sequencing to delineate Mycobacterium tuberculosis outbreaks: a retrospective observational study. Lancet Infect. Dis. 13, 137–146. doi: 10.1016/S1473-3099(12)70277-3
Wirth, T., Hildebrand, F., Allix-Béguec, C., Wölbeling, F., Kubica, T., Kremer, K., et al. (2008). Origin, spread and demography of the Mycobacterium tuberculosis Complex. PLoS Pathog. 4:e1000160. doi: 10.1371/journal.ppat.1000160
Yang, C., Luo, T., Sun, G., Qiao, K., Sun, G., DeRiemer, K., et al. (2012). Mycobacterium tuberculosis Beijing strains favor transmission but not drug resistance in China. Clin. Infect. Dis. 55, 1179–1187. doi: 10.1093/cid/cis670
Yu, Y., Harris, A. J., Blair, C., and He, X. (2015). RASP (Reconstruct Ancestral State in Phylogenies): a tool for historical biogeography. Mol. Phylogenet. Evol. 87, 46–49. doi: 10.1016/j.ympev.2015.03.008
Keywords: tuberculosis, genetic diversity, migration, whole genome sequencing, drug resistance
Citation: Rutaihwa LK, Menardo F, Stucki D, Gygli SM, Ley SD, Malla B, Feldmann J, Borrell S, Beisel C, Middelkoop K, Carter EJ, Diero L, Ballif M, Jugheli L, Reither K, Fenner L, Brites D and Gagneux S (2019) Multiple Introductions of Mycobacterium tuberculosis Lineage 2–Beijing Into Africa Over Centuries. Front. Ecol. Evol. 7:112. doi: 10.3389/fevo.2019.00112
Received: 13 September 2018; Accepted: 20 March 2019;
Published: 16 April 2019.
Edited by:
Enrique P. Lessa, Universidad de la República, UruguayReviewed by:
José Afonso Guerra-Assunção, University College London, United KingdomVegard Eldholm, Norwegian Institute of Public Health, Norway
Thierry Wirth, Ecole Pratique des Hautes Etudes, Université de Sciences Lettres de Paris, France
Hector Romero, Universidad de la República, Uruguay
Copyright © 2019 Rutaihwa, Menardo, Stucki, Gygli, Ley, Malla, Feldmann, Borrell, Beisel, Middelkoop, Carter, Diero, Ballif, Jugheli, Reither, Fenner, Brites and Gagneux. This is an open-access article distributed under the terms of the Creative Commons Attribution License (CC BY). The use, distribution or reproduction in other forums is permitted, provided the original author(s) and the copyright owner(s) are credited and that the original publication in this journal is cited, in accordance with accepted academic practice. No use, distribution or reproduction is permitted which does not comply with these terms.
*Correspondence: Daniela Brites, ZC5icml0ZXNAc3dpc3N0cGguY2g=
Sebastien Gagneux, c2ViYXN0aWVuLmdhZ25ldXhAc3dpc3N0cGguY2g=
†These authors have contributed equally to this work