 Monica M. Acosta
 Luis Zaman
- ZE3 Lab, Department of Ecology and Evolutionary Biology and Center for the Study of Complex Systems, University of Michigan, Ann Arbor, MI, United States
Most of Earth’s diversity has been produced in rounds of adaptive radiation, but the ecological drivers of diversification, such as abiotic complexity (i.e., ecological opportunity) or predation and parasitism (i.e., ecological necessity), are hard to disentangle. However, most of these radiations occurred hundreds of thousands if not millions of years ago, and the mechanisms promoting contemporary coexistence are not necessarily the same mechanisms that drove diversification in the first place. Experimental evolution has been one fruitful approach used to understand how different ecological mechanisms promote diversification in simple microbial microcosms, but these microbial systems come with their own limitations. To test how ecological necessity and opportunity interact, we use an unusual system of self-replicating computer programs that diversify to fill niches in a virtual environment. These organisms are subject to ecological pressures just like their natural counterparts. They experience biotic interactions from digital parasites, which steal host resources to replicate their own code and spread in the population. With the control afforded by experimenting with computational ecologies, we begin to unweave the complex interplay between ecological drivers of diversification. In particular, we find that the complexity of the abiotic environment and the size of the phenotypic space in which organisms are able to interact play different roles depending on the ecological driver of diversification. We find that in some situations, both ecological opportunity and necessity drive similar levels of diversity. However, the phenotypes that hosts uncover while coevolving with parasites are dramatically more complex than hosts evolving alone.
Introduction
The intricate and seemingly well-organized diversity of ecological communities has long captured the curiosity of onlookers (Elton, 1946). This curiosity has driven a rich history of inquiry into how communities are assembled (Gillespie, 2004; Emerson and Kolm, 2005; Mittelbach and Schemske, 2015), which biological and geographical processes are responsible for creating diversity (Weeks et al., 2016), and which are able to maintain that diversity (Chase and Leibold, 2003; Levine and HilleRisLambers, 2009). However, disentangling the myriad of factors at play during formative periods of diversification, all while the relentless passing of time continues to muddy the historical view, is a daunting task (Mittelbach et al., 2007; Sobel et al., 2010; Mittelbach and Schemske, 2015).
Adaptive radiations, where lineages diversify into newly accessible niches, are thought to be the primary driver of biodiversity on Earth (Simpson, 1953; Schluter, 2000; Losos, 2010), but which mechanisms are responsible for the adaptive bits or which mechanisms create the niches in the first place remains controversial (Rabosky, 2009; Sobel et al., 2010). Broadly, most hypotheses are categorized as being driven either by biotic or abiotic factors (Mittelbach et al., 2007). Abiotic drivers, often collected under the phrase ecological opportunity, include resources newly available by the lack of competitors or the evolution of key innovations in a particular lineage (Yoder et al., 2010; Stroud and Losos, 2016). Biotic factors, on the other hand, are driven by interactions between other living organisms in the environment like predators, parasites, or mutualists (Janzen, 1970; Connell, 1971; Vamosi, 2005). These biotic drivers of diversification create ecological necessity (a phrase credited to Brian C. Weeks).
Unsurprisingly, the debate about whether opportunity or necessity drives greater levels of diversification has been intensely studied using historical, phylogenetic, and comparative methods (Mittelbach et al., 2007). More recent and/or dramatic adaptive radiations provide glimpses into several potential mechanisms (Baldwin and Sanderson, 1998; Gillespie, 2004; Grant and Grant, 2006; Alfaro et al., 2009), but the lack of tractable manipulation and the long timescales over which these mechanisms operate in nature make experimental studies infeasible. Evolution experiments enable a different approach to tackling these questions where relatively simple replicated microcosms that diversify in tractable timescales can be studied (Kawecki et al., 2012; Cvijović et al., 2018). Sometimes, diversification has been found despite experiments deliberately designed to avoid it, like Richard Lenski’s long term evolution experiment (LTEE) with E. coli (Lenski et al., 1991). The LTEE has had 12 replicate populations of E. coli starting from the same ancestral genotypes propagated for over 75,000 generations in (what was thought to be) a simple single niche environment. Ignorant of these goals, life found a way to expand into niches that emerged due to nascent biotic interactions, as well as exploit an additive in the media as an alternative carbon source in one of the 12 replicates (Good et al., 2017).
Evolution experiments have been designed to directly test how features of the environment, such as the number of available resources (e.g., abiotic complexity), influence the level of diversification (Rainey et al., 2000; Travisano and Rainey, 2000; Kassen, 2019). These experiments have shown that multiple resources, or otherwise more complex abiotic environments, drive greater levels of diversification (Saxer and Travisano, 2016). Thus, ecological opportunity can be a driver of diversification in microbial experiments. Several studies have also investigated the role of antagonistic interactions such as parasitism or predation on diversification (Bohannan and Lenski, 2000; Meyer and Kassen, 2007; Koskella et al., 2011; Meyer et al., 2012). There, again, antagonistic interactions and coevolution are able to drive diversification. Coevolution with parasites has also been shown to drive increases in the rate of molecular evolution (Paterson et al., 2010), facilitate the eventual evolution of innovations (Gupta et al., 2021), and promote the evolution of complexity (Zaman et al., 2014). In other words, ecological necessity is another major driver of diversification in microbial experiments.
In nature, ecological opportunity and necessity exert pressures on populations simultaneously. How populations respond and diversify in these complex scenarios has been the focus of substantial debate, many comparative studies, and a few evolution experiments. Meyer and Kassen (2007) showed that both predation and abiotic complexity can favor similar levels of diversification in populations of Pseudomonas fluorescens. However, the addition of predators in an abiotically complex environment surprisingly slowed host diversification, although populations eventually reached indistinguishable levels. In another experimental study where the same model adaptive radiation of Pseudomonas fluorescens was subjected to parasitism by bacteriophage (viruses that infect bacteria), biotic interactions prevented host diversification into the available abiotic niches (Buckling and Rainey, 2002). Because diversity was measured primarily by the colony morphology that distinguishes which abiotic niche genotypes exploit, it’s possible that some functional diversification was overlooked. In addition, the abiotic complexity in these systems was defined by the diversification observed during replicated radiations (Rainey and Travisano, 1998), and was only manipulable in an all-or-none fashion.
To overcome such experimental challenges, we turn to Digital Evolution as a way to test how ecological opportunity and necessity jointly affect diversification (O’Neill, 2003). We devise experimental methods to vary the number of substitutable resources in a resource-limited environment (i.e., abiotic complexity or ecological opportunity) and introduce coevolving parasites, which drive ecological necessity. Similar to past work, we find that both parasites and abiotic complexity drive high levels of diversification (Meyer and Kassen, 2007). However, the interaction between ecological opportunity and ecological necessity affects patterns of diversification in interesting ways. Surprisingly, we find the complexity of the phenotypes that host populations diversify into differs between the two ecological drivers, despite sometimes leading to the same level of overall diversity.
Materials and Methods
To study how host-parasite coevolution and abiotic complexity together shape patterns of host diversity, we use the artificial life platform, Avida (Ofria et al., 2009). In Avida, hosts are autonomous self-replicating computer programs executing on virtual hardware (i.e., a virtual central processing unit or CPU). Host organisms compete for globally distributed—but limited—resources in the environment as well as potentially limited physical space. These self-replicating programs are susceptible to infection by parasites, which are themselves self-replicating organisms that obligately attach their execution to the hosts allocated CPU cycles (Zaman et al., 2011).
To reproduce, digital organisms must copy their genome from one location in memory to another instruction-by-instruction. This copying process can be noisy, which introduces genetic mutations, and could manifest as point mutations where a single instruction is copied incorrectly, or as insertions or deletions (indels), where a random instruction is added incorrectly or the writing of an instruction fails. In these experiments, mutations are configured as a per-instruction rate such that hosts had a 25% chance of producing a mutant offspring (where point mutations made up 90% of the mutations) and parasites had a 50% chance of producing a mutant offspring with the same split between point and indel mutations. Because indel mutations are possible, these overall genomic mutation rates may slightly shift as genomes expand or shrink during evolution.
Digital Hosts
Hosts are able to acquire resources from the environment by performing different computational tasks. Because consuming resources requires both performing the appropriate computation (i.e., task) and the presence of an appreciable level of resources in the environment, we distinguish between tasks and reactions. Tasks designate the completion of the associated computation, and Reactions denote acquiring the corresponding resource. In order for hosts to successfully replicate in these experiments, they must complete at least one reaction. To make an analogy with microbial metabolism, a task can be conceptualized as the metabolic pathway and machinery necessary for consuming a particular substrate, while the reaction only occurs when the substrate is present.
When host organisms successfully replicate, their offspring organism is placed in a random cell with preference given to empty locations. If there are no empty locations, a newly spawned organism will overwrite the previous occupant of a randomly selected site. There are a total of 22,500 locations that can house a host organism in the world. Upon successful replication, two cloned programs begin executing their programs anew. This is conceptually similar to a bacterial cell dividing into two daughter cells. Hosts unable to produce offspring will eventually be removed by the scheduling algorithm, or will be overwritten by other hosts’ offspring. In these experiments, the host population is seeded with a single ancestral genotype that is 320 instructions long, capable of only self-reproduction and performing the NOT logic task, which is the simplest logic operation in this environment.
Digital Parasites
Parasites are self-replicating computer programs which insert themselves into the memory of a host organism, steal CPU cycles to execute their own program (i.e., genome) and thus spread. In these experiments, parasites are configured to steal 80% of the CPU cycles allocated to their hosts. Parasites also perform tasks, but rather than acquiring resources, parasite tasks dictate the range of hosts that can be infected. Additionally, hosts can harbor only a single parasitic organism. Therefore, if a host and parasite perform at least one task in common and the host has not already been parasitized, then infection is possible. A random location in the world is selected when a parasite successfully replicates, and if there is a susceptible host there, the parasite offspring begins executing its program using the computing resources allocated to its new host. Because parasites are obligately associated with a host, only parasite offspring that successfully infect a host will persist. If a host successfully replicates while infected, the parasite is removed. Parasites were introduced into the host population after 5,000 Updates. An update is an arbitrary unit of time where on average each host has executed 30 instructions (either its own or its parasite’s). The generation times (average updates needed for self-replication) of the ancestral host and parasite used in these experiments is 63 and 23, respectively. Infection was seeded with approximately 400 parasites that were 80 instructions long, capable of only self-reproduction and performing the NOT logic task, similar to its host.
Abiotic Diversity and Phenotypic Space
Resources in Avida are defined by an inflow and outflow rate, which together define an expected steady state concentration in the absence of consumers (125 units of resource per update, and a 10% outflow in these experiments). To increase the abiotic complexity of the environment, we kept the total inflow of resources constant but varied the number of distinct resources that were available (i.e., 1, 4, 10, and 20 resources; Figure 1). Each resource can be consumed by multiple tasks, which affords us control over the number of possible phenotypes that hosts and parasites can exploit (i.e., 4, 8, 12, 16, 20; Figure 1). Thus, together we have control over the diversity of substitutable resources present in the environment and the size of phenotypic space in which host and parasite interactions coevolve.
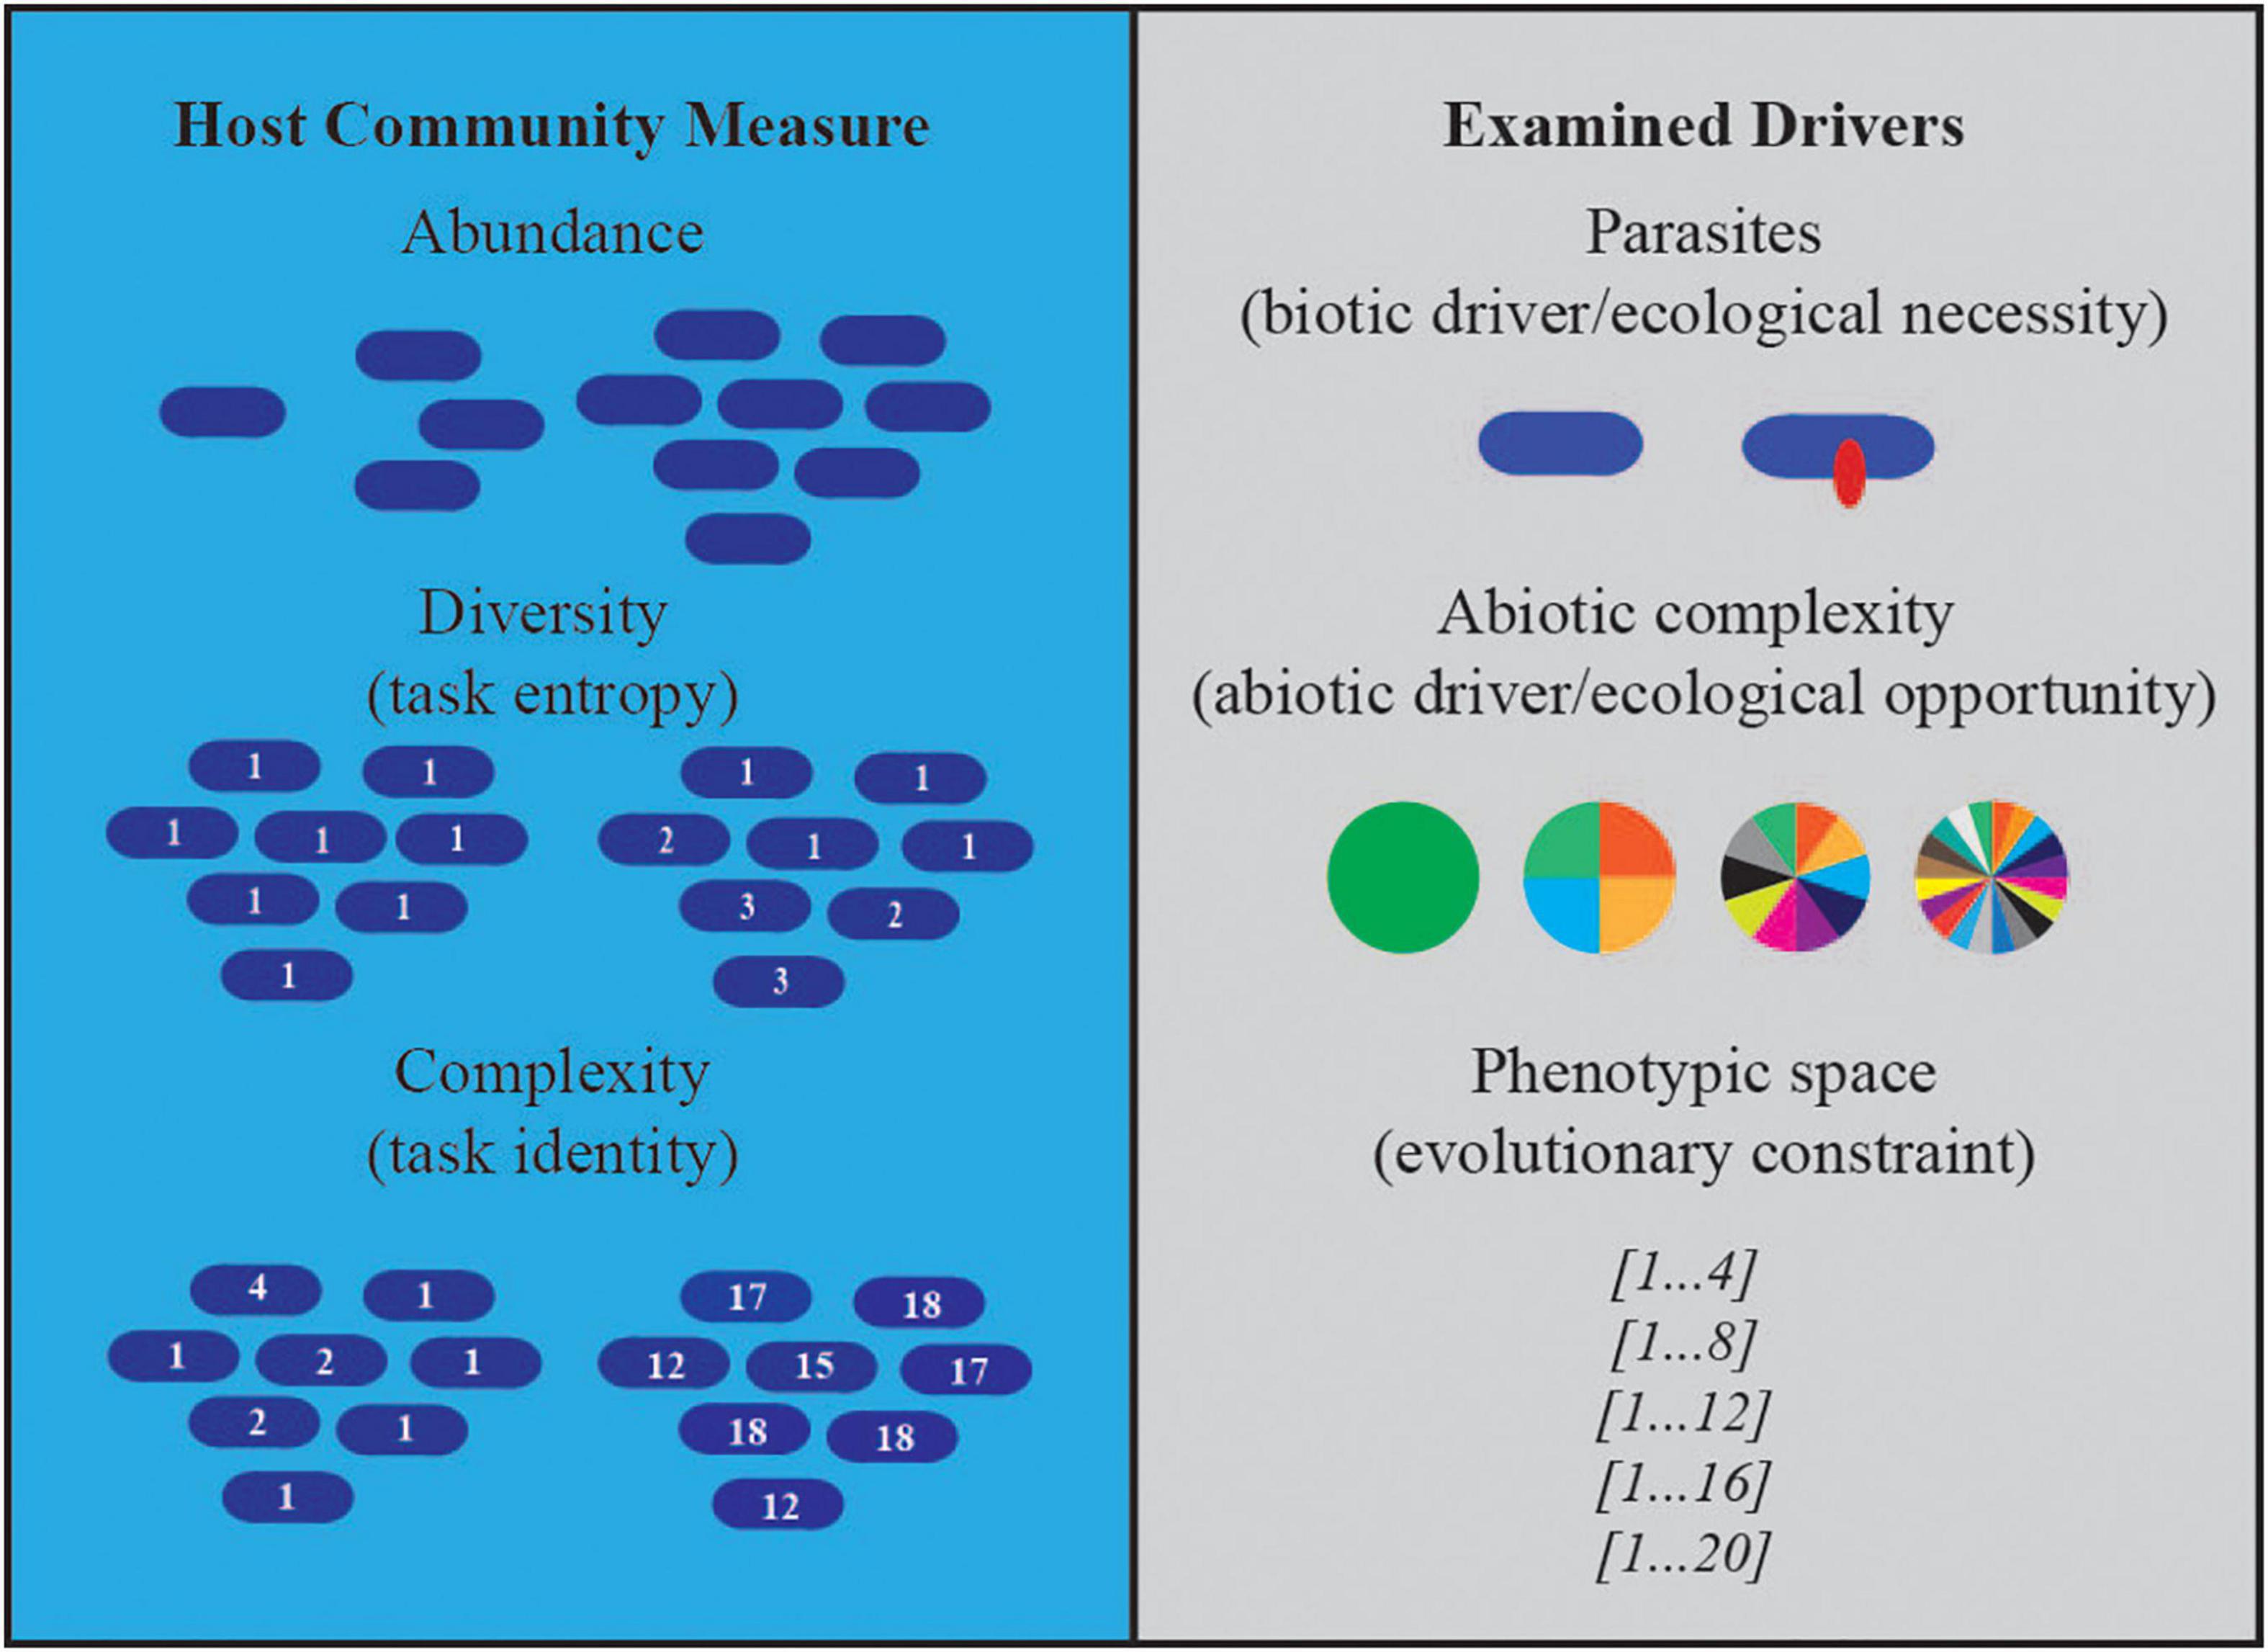
Figure 1. Host community measures and examined drivers. Illustrations depict the three drivers we manipulated in our experiments and the effects on host communities we measured.
In previous work, a set of accessible tasks were identified by equally rewarding all 77 possible 1-, 2-, or 3-input logic tasks in replicate populations with increased CPU cycle allocation (Zaman, 2018). The cumulative number of organisms performing each task was recorded. In this experiment we used the 20 most commonly evolved tasks to control the size of the phenotypic space. We preserve the rank order of the tasks when varying the size of the phenotypic space. This means each smaller phenotypic space is a nested subset of the larger phenotypic spaces.
Phenotype Complexity
Since the tasks are sorted by how frequently evolving populations discovered and maintained a particular phenotype, they are ordered in a manner that reflects how hard a particular task is to evolve. In terms of their genotypes, tasks that evolve quickly and repeatedly are likely occupying relatively large areas of the accessible genetic space, whereas tasks that are only rarely discovered likely take up smaller subsets of this space (Kumawat and Zaman, 2021). In this way, we can think of the rarer tasks (which become available in environments with larger phenotypic spaces) as having higher levels of complexity. Our usage here mirrors Andreas Wagner’s definition of complexity based on information theory, which can be conceptualized as the amount of information gained by observing a phenotype about where in genetic space the organism must reside (Wagner, 2017). This definition of complexity has been shown to correspond to a more traditional algorithmic definition of complexity in Avida, where the true minimum complexity of tasks was known (Lenski et al., 2003; Fortuna et al., 2017). In these experiments, the true minimum complexity of every task is not known and instead we rely on their rank ordering as a measure of complexity.
When increasing the diversity of the abiotic environment, tasks were cycled between resources to avoid conflating complexity with abiotic diversity. For example, when there are 4 resources and 8 tasks, the first resource is assigned tasks 1 and 5, the second resource is assigned tasks 2 and 6, the third resource is assigned tasks 3 and 7, and the final resource is assigned tasks 4 and 8. This is done to ensure that resources are exploitable by comparably complex tasks.
Statistical Analysis
All analyses and visualizations were conducted in R, version 4.0.4 and Rstudio (R Core Team, 2020; RStudio Team, 2020). Each combination of treatments was replicated10 times. For calculations of phenotypic diversity and mean task complexity, coevolving populations in which parasites went extinct were omitted from analysis. Phenotypic diversity was calculated using final host and parasite populations at the end of 300,000 updates by computing Shannon’s entropy (Zaman et al., 2011). Mean task complexity was calculated by multiplying the frequencies of each individual task computed by the population at 300,000 updates by its task number (a value from 1 to 20) and dividing by the total number of tasks performed by the population. Task identifier numbers are sorted from least to most complex (see above) and thus serve as an indicator of complexity. Generalized least squares models were used to analyze differences in the phenotypic entropy of host populations using the R function VarIdent assuming different variances for coevolving and non-coevolving populations within the gls package. Adjusted R2 (Adj. R2) effect sizes were calculated using the yhat package in R. In all instances, we report the effect size calculated using the Pratt formula.
Results
Below, we detail the effects of biotic (parasitism) and abiotic (ecological complexity) drivers on three features of host communities: host abundance, diversity, and complexity (summarized in Figure 1). We find important differences in the effects of these drivers on each component, suggesting that community diversification in the presence of both cannot be wholly captured via a single measurement. We also find that altering the evolutionary space (the possible phenotypic space hosts could occupy/tasks that could be performed) is important in determining how host communities can evolve, especially in the presence of biotic drivers (i.e., parasitism).
We report our findings by first describing the effect of varying the phenotypic space hosts had access to while maintaining ecological complexity constant (at either a single or four resources), and then keeping the phenotypic space large and constant (20 total tasks) and varying ecological complexity. In all described experiments, hosts were allowed to evolve on their own and in the presence of parasites. In some cases, parasites went extinct. Parasite extinction was observed on five occasions in the single resource environment (once when phenotypic space was 16 and four times when phenotypic space was 20; Figure 2A) and on 12 occasions when phenotypic space was 20 and resources were partitioned into 10 and 20 tasks separate resources (five and seven extinction events, respectively; Figure 2C).
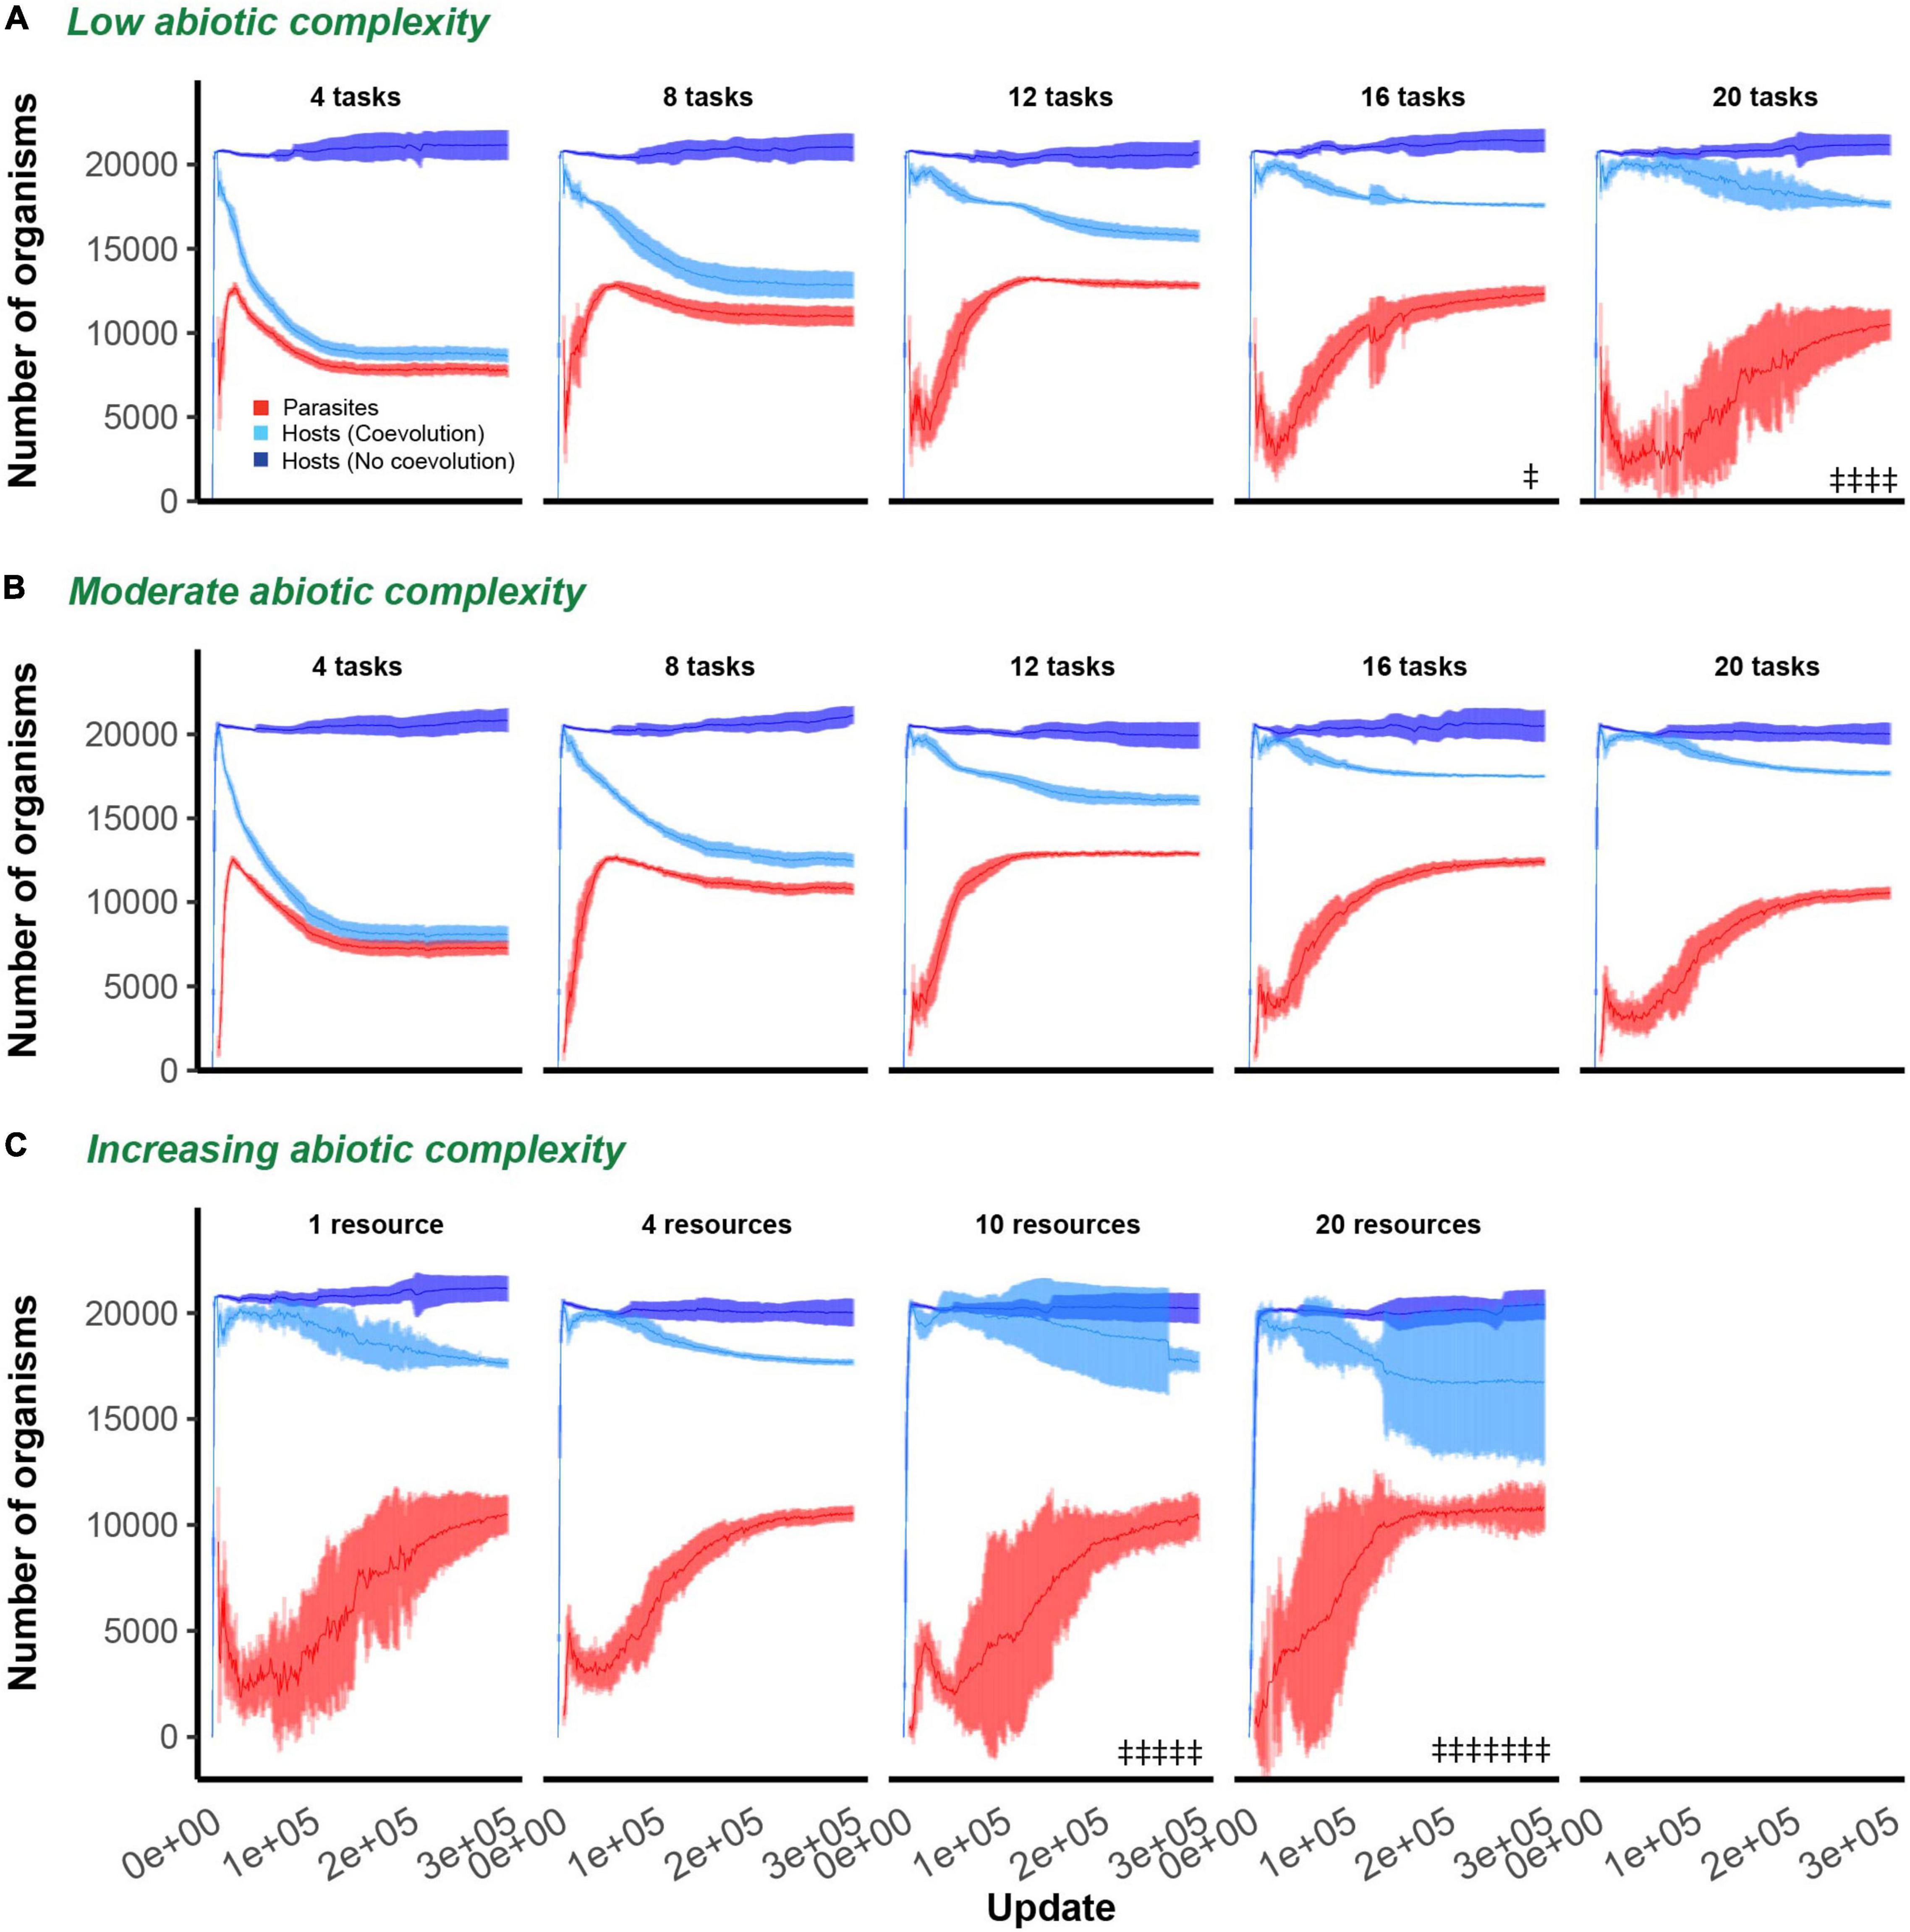
Figure 2. Host and parasite dynamics through time. Mean and 95% confidence intervals are shown for hosts (non-coevolving in dark blue, coevolving in light blue) and parasites (red) through time. In all evolutionary experiments, hosts were allowed to evolve for 300,000 updates. In (A,B), ecological complexity was held constant at either one or four resources, respectively, while varying the available phenotypic space (4, 8, 12, 16, or 20 tasks in each subplot). In (C), the available phenotypic space was held constant at 20 tasks, and dynamics are shown for increasing levels of abiotic complexity (4, 8, 10, or 20 resources in each subplot). Only data from those host populations in which parasites did not go extinct are shown. Double headed daggers indicate runs in which parasites went extinct.
Coevolution Lowers Host Abundance, but Its Effect Depends on the Size of Phenotypic Space
In the absence of parasitism, hosts rapidly expanded to fill their digital world, maintaining large and stable population sizes even in environments of varying ecological complexity (dark blue lines; Figures 2A–C). Following the introduction of parasites, host populations were suppressed. The dynamics and extent of this suppression was dependent on the degree of phenotypic space allotted to hosts and the abiotic complexity (number of resources) of the environment (light blue lines; Figures 2A–C). Hosts that evolved in environments that were allowed greater phenotypic space were able to evade parasite induced suppression to a greater degree [F(1, 94) = 604.3, p < 0.0001, Adj. R2 = 0.87; Figures 3A,B]. While host population sizes of coevolving populations increased monotonically as phenotypic space increased, parasite growth was maximized at intermediate levels of phenotypic space, reflected by a significant quadratic term in this relationship [F(1, 93) = 752.2, p < 0.0001, Adj. R2 = 0.93; Figures 3A,B]. These patterns did not change with abiotic complexity [effect of abiotic condition on population size and phenotypic space, F(1, 93) = 0.9, p = 0.3; effect of abiotic condition on quadratic relationship, F(1, 92) = 0.9, p = 0.4]. In environments where a large phenotypic space was available, changing the abiotic complexity had no overall effect on the final host or parasite densities [F(1, 61) = 2.9, p = 0.1, F(1, 22) = 0.3, p = 0.6, respectively; Figure 3C].
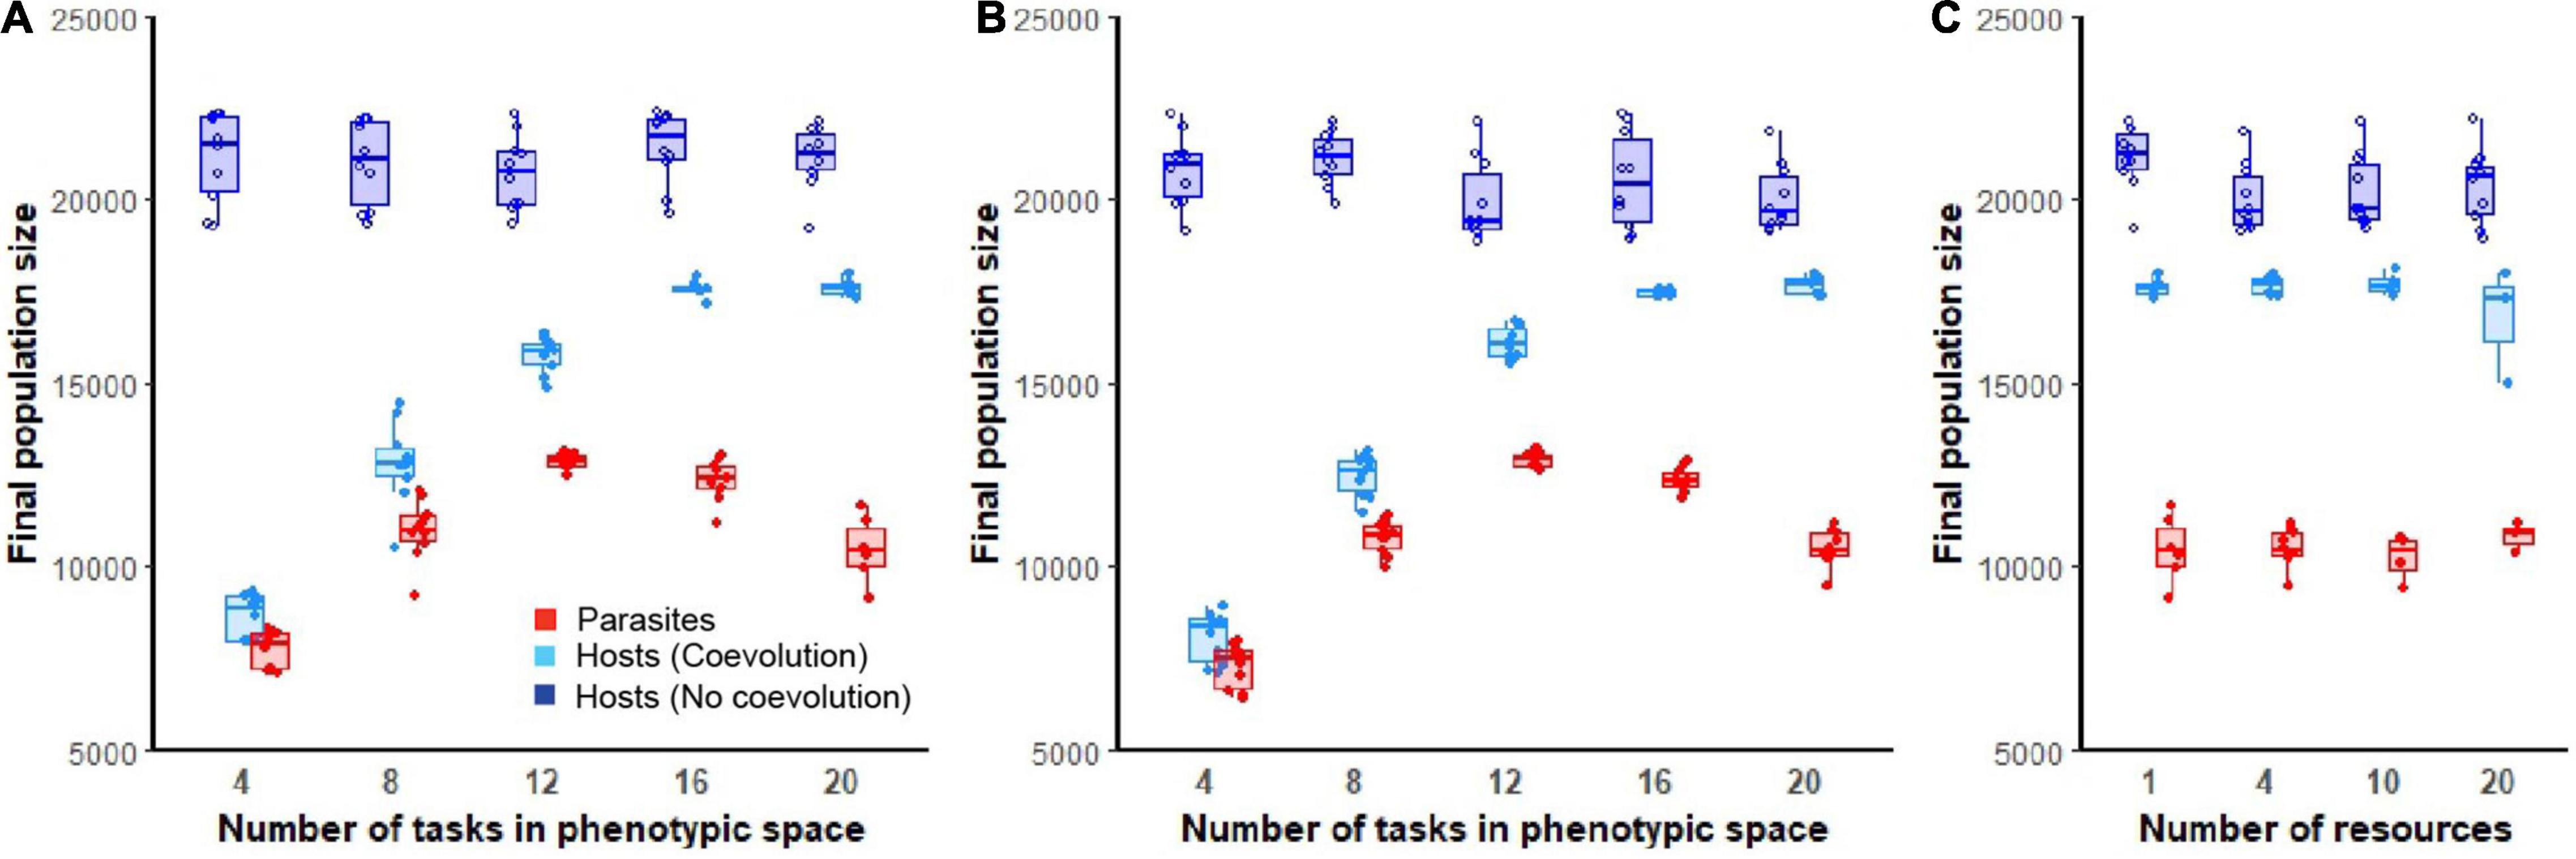
Figure 3. Final host and parasite population sizes. Boxplots show final population sizes (at the end of 300,000 updates) for hosts (non-coevolving in dark blue, coevolving in light blue) and parasite populations (red). In (A,B), ecological complexity was held constant at either one or four resources, respectively, while varying the available phenotypic space (4, 8, 12, 16, or 20 tasks). In (C), the available phenotypic space was held constant at 20 tasks and final populations are shown for increasing levels of abiotic complexity (4, 8, 10, or 20 resources). Only data from those host populations in which parasites did not go extinct are shown.
Coevolution Increases Host Phenotypic Diversity Even in the Absence of Abiotic Complexity
The amount of accumulated phenotypic diversity at the end of evolutionary time was dependent on whether hosts coevolved with parasites, the complexity of the abiotic environment, and the size of the available phenotypic space (Figure 4). In a single resource (i.e., low abiotic complexity) environment, coevolution with parasites increased final host phenotypic diversity, as compared to hosts that evolved in an environment without parasites [F(1, 85) = 97.2, p < 0.0001, Adj. R2 = 0.53; Figure 4A]. This effect was more pronounced when hosts were allowed access to broader phenotypic space [coevolution*phenotypic space: F(1, 83) = 24.1, p < 0.0001, Adj. R2 = 0.72; Figure 4A]. When hosts did not coevolve with parasites, increasing phenotypic space had no effect on the phenotypic diversity of final populations [F(1, 44) = 0.33, p = 0.6; Figure 4A]. In other words, only in the presence of coevolution was there an effect of increasing phenotypic space on host diversity in a single resource environment.
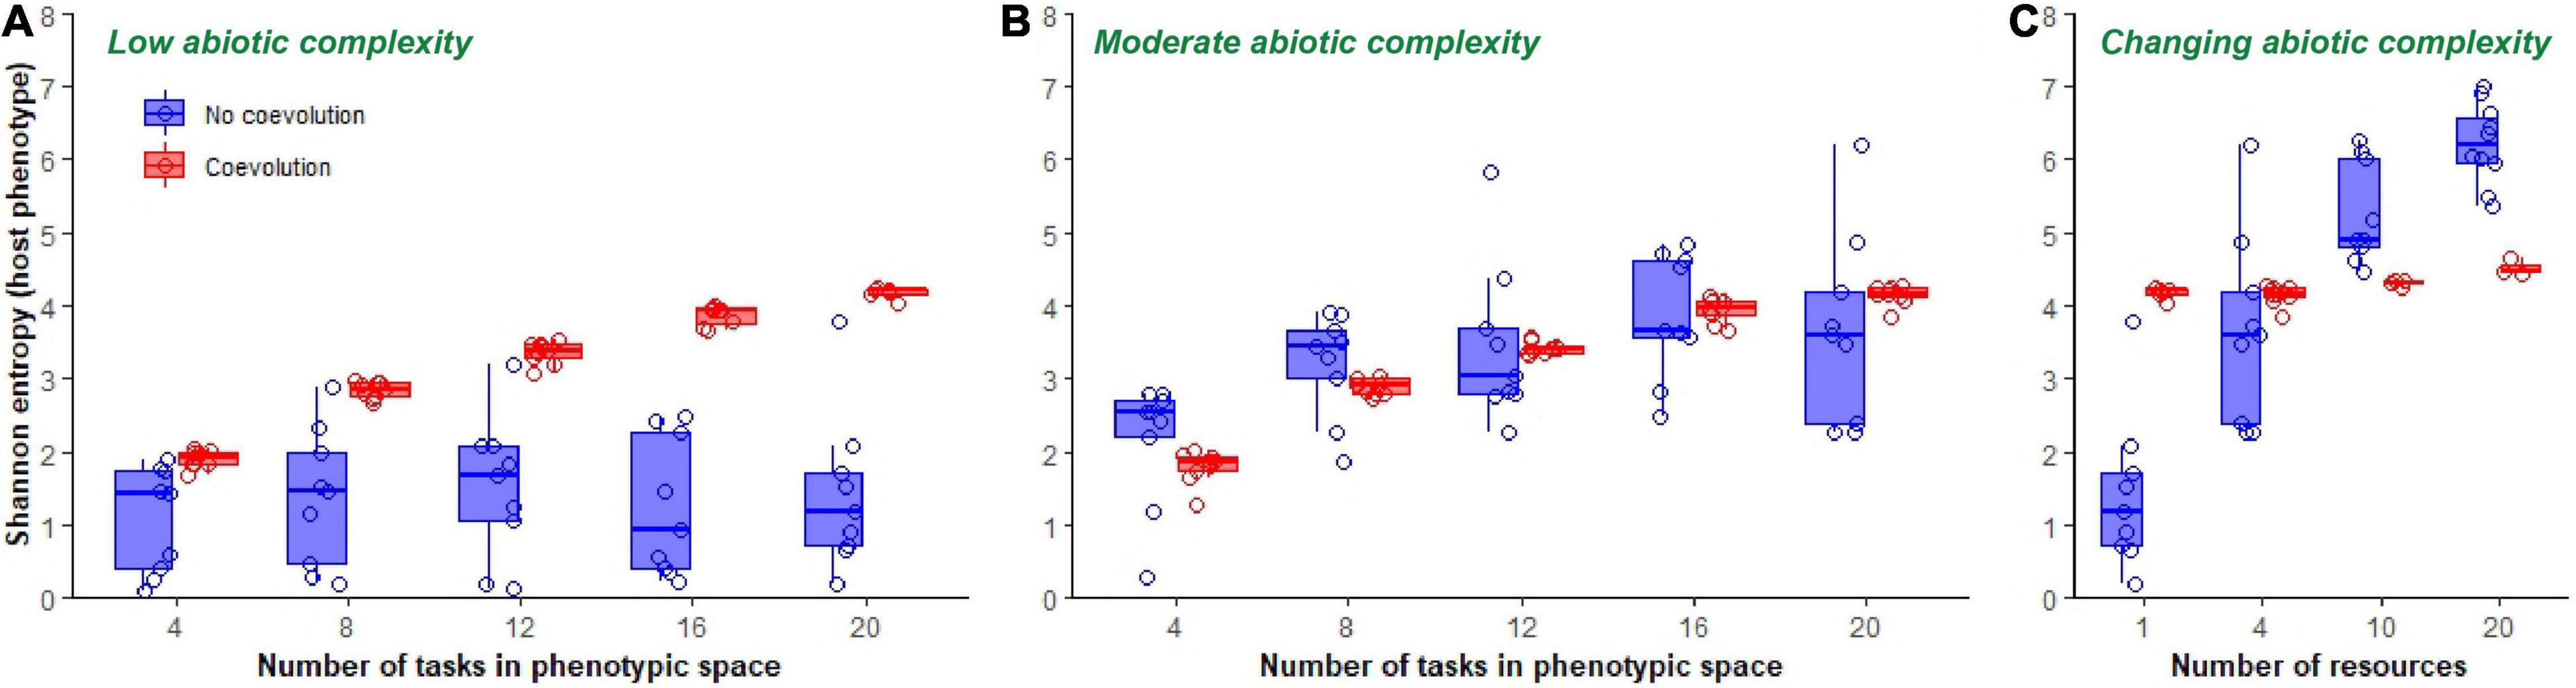
Figure 4. Final phenotypic diversity of hosts. Boxplots show phenotypic diversity (summarized as Shannon’s diversity index) of host populations at the end of 300,000 updates in populations evolving in a single resource environment (A), a four-resource environment (B) and in environments of increasing ecological complexity (C). Data from non-coevolving populations is shown in blue, while data from coevolving populations is shown in red. Only data from those host populations in which parasites did not go extinct are shown.
When the abiotic complexity of the environment was increased to a moderate level (total number of resources subdivided into four pools), there was no difference in host diversity between those populations that had coevolved with parasites and those that did not [F(1, 88) = 0.1, p = 0.8; Figure 4B]. Here, host populations increased in diversity as phenotypic space was increased irrespective of the presence or absence of parasites [F(1, 89) = 73.1, p < 0.0001, Adj. R2 = 0.45; Figure 4B]. In addition, hosts that evolved in this moderately complex abiotic environment reached levels of diversity that were indistinguishable from hosts that had coevolved at low levels of abiotic diversity [F(1, 129) = 0.03, p = 0.9]. As such, introducing coevolution in low complexity environments was able to mimic the levels of diversity observed in host populations that evolved in environments with greater abiotic complexity.
When the abiotic complexity of the environment was further increased to a 10 and 20 resource partitioned environment, we observed an interaction between coevolution and abiotic complexity on host phenotypic diversity [coevolution*number of resources; F(2, 57) = 57.2, p < 0.0001, Adj. R2 = 0.65; Figure 4C]. When abiotic complexity was low (single resource), coevolution increased phenotypic diversity. However, as abiotic complexity increased, coevolution acted instead to depress levels of phenotypic diversity in the population (Figure 4C).
In addition to affecting average phenotypic diversity, coevolution also influenced the total observed variance in host populations. Host populations that coevolved with parasites ended up with less variance in phenotypic diversity than non-coevolving populations at the end of the evolutionary experiments (coevolution relative variance was σ2 = 0.27 in a single resource environment and σ2 = 0.22 in a four-resource environment using a generalized least squares model allowing for variance structure; Figures 4A,B).
Differences in abiotic complexity did not affect the parasite population’s phenotypic diversity [F(1, 91) = 0.3, p = 0.3; Supplementary Figure 1A]. Increasing the phenotypic space of hosts, however, did cause concomitant increases in parasite phenotypic diversity [F(1, 92) = 166.8, p < 0.0001, Adj. R2 = 0.64].
Coevolution Increases the Average Complexity of Evolved Host Tasks
We then observed the effect of abiotic complexity and parasitism on the final evolved complexity of host phenotypes. In the absence of parasites, final host populations evolved to perform subsets of lower ranked tasks (simpler tasks), relative to those of hosts evolving with parasites (Figure 5). This was true of evolution occurring in both low and moderately complex abiotic environments. As such, mean task complexity was substantially higher in host populations that experienced coevolution [single resource environment: F(1, 85) = 85.3, p < 0.0001, Adj. R2 = 0.50; four-resource environment: F(1, 89) = 57.4, p < 0.0001, Adj. R2 = 0.39; Figures 6A,B]. Increasing host’s access to phenotypic space further increased mean complexity values for coevolving populations [F(1, 85) = 4464.4, p < 0.0001, Adj. R2 = 0.98]. In the absence of parasitism, however, increasing the phenotypic space of hosts only increased mean complexity values when abiotic complexity was moderate, not when a single resource was used [single resource environment: F(1, 44) = 1.4, p = 0.25; four-resource environment: F(1, 44) = 21.9, p < 0.0001, Adj. R2 = 0.32; Figures 6A,B].
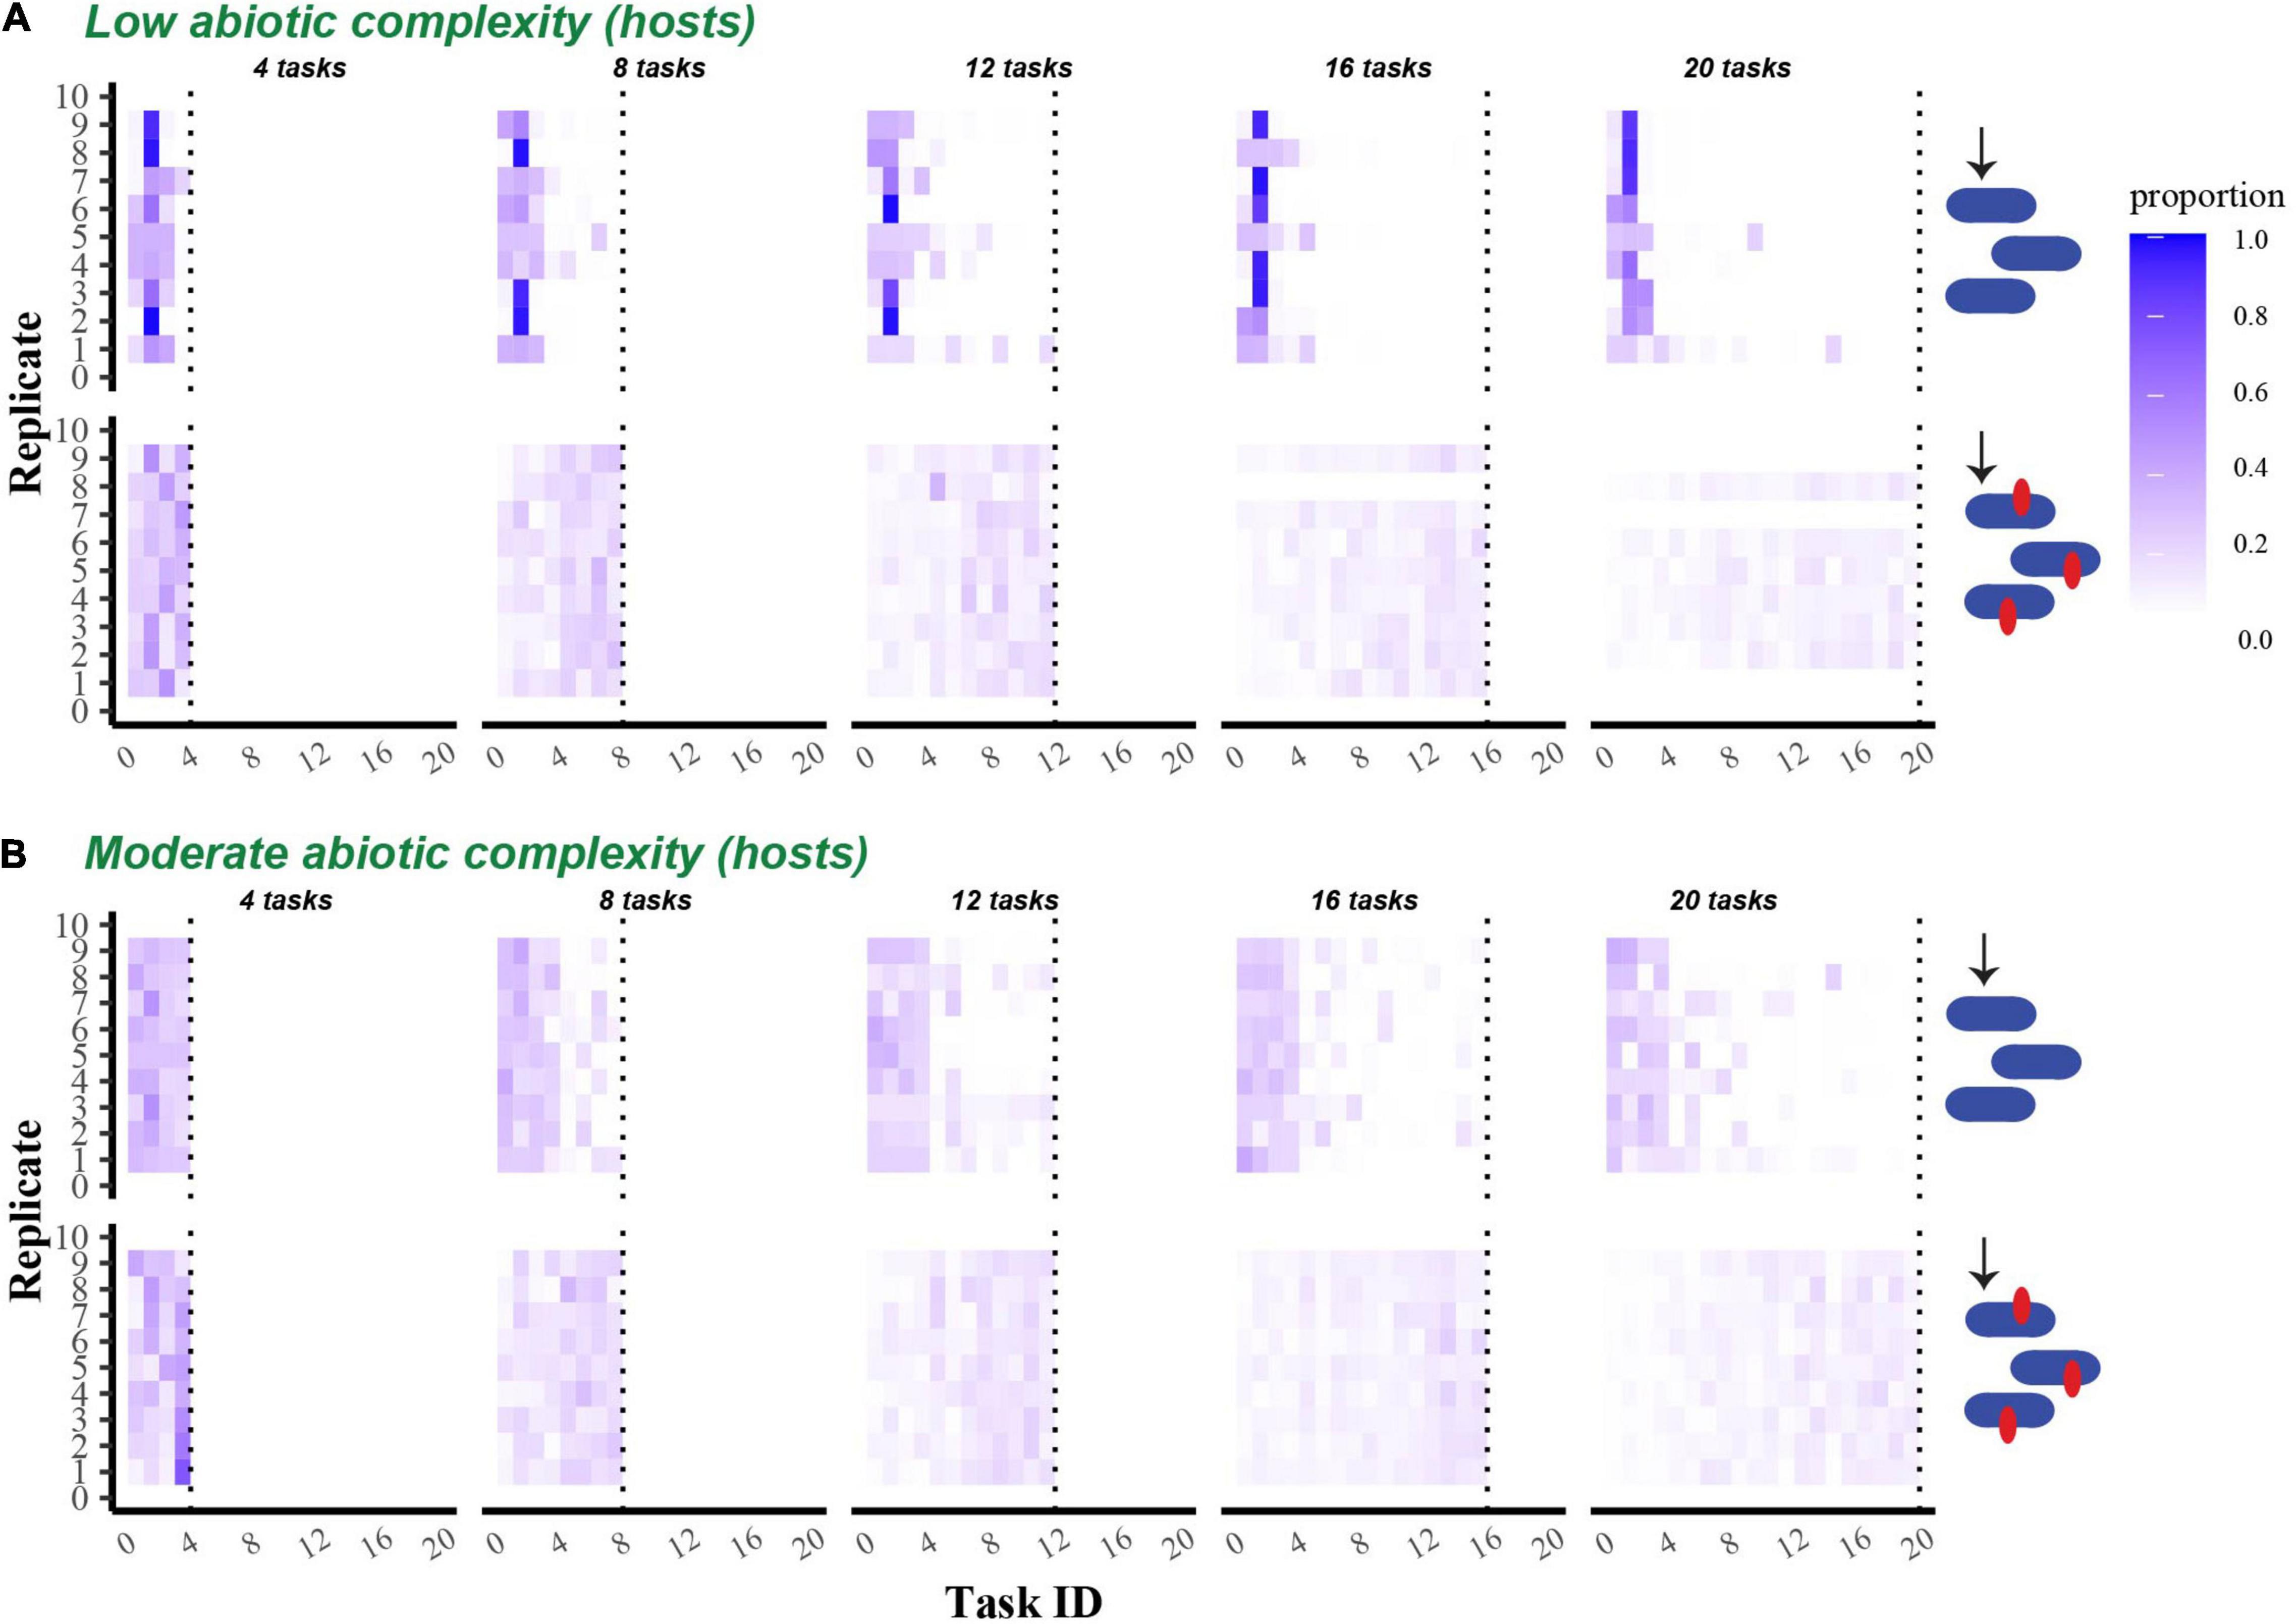
Figure 5. Proportion of the final evolved host population that performed each possible task. Heat maps show the proportion of the final host population at the end of 300,000 updates that successfully performed each task. (A) Shows data from populations that evolved in a single resource environment, while (B) shows data from populations that evolved in a four-resource environment. In both (A,B), the first row shows data from non-coevolving populations, while the second shows data from coevolving populations. Tasks are indicated on the x-axis in rank order (see section “Materials and Methods), and the data from replicate communities are stacked vertically.
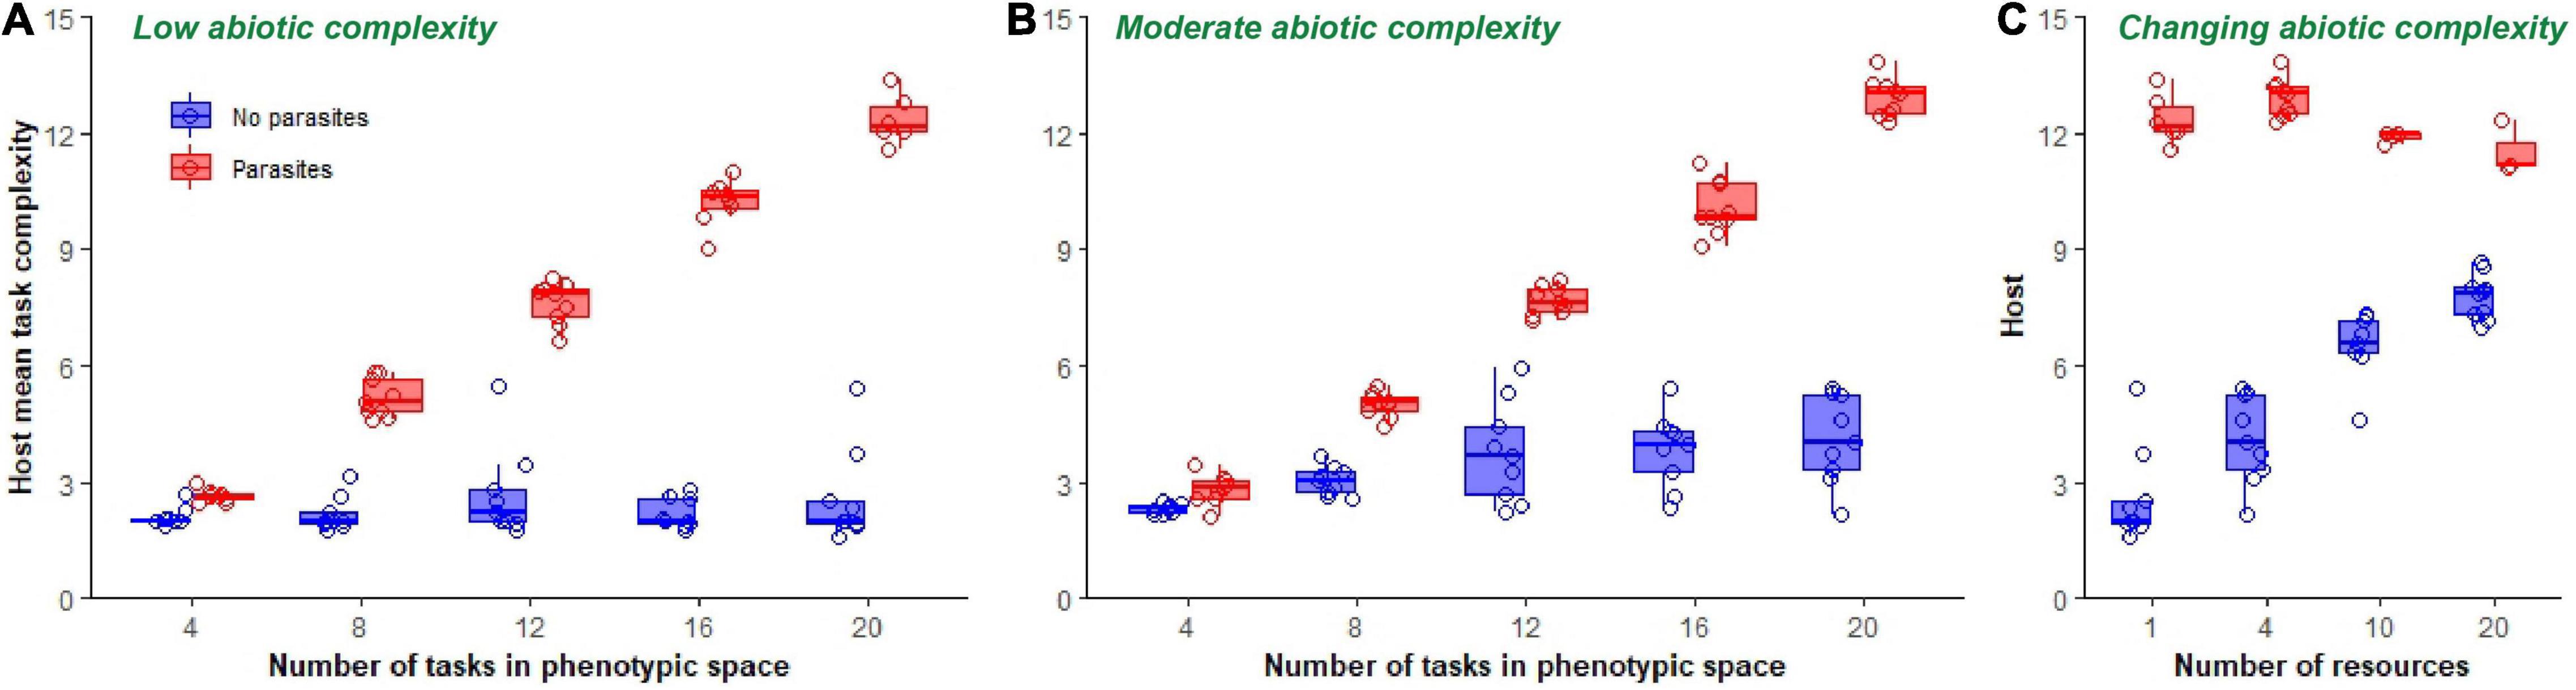
Figure 6. Final mean task complexity of hosts. Boxplots show final mean task complexity of host populations at the end of 300,000 updates in populations evolving in a single resource environment (A), a four-resource environment (B), and in environments of increasing ecological complexity (C). Data from non-coevolving populations is shown in blue, while data from coevolving populations is shown in red. Mean task complexity was calculated by summing the frequencies of each task, multiplying by its rank identifier (which here served as an approximate measure of complexity) and dividing by the total number of tasks performed in each replicate population. Only data from those host populations in which parasites did not go extinct are shown.
The effect of varying abiotic complexity from low (1 resource) to high (20 resources) while keeping the phenotypic space fixed at 20 tasks depended on whether host populations were coevolving with parasites [resource number*coevolution: F(1, 56) = 66.9, p < 0.0001, Adj. R2 = 0.94; Figure 6C]. Increasing abiotic complexity in non-coevolving populations increased mean task complexity monotonically [F(1, 36) = 111.0, p < 0.0001, Adj. R2 = 0.76; Figure 6C]. However, increasing abiotic complexity in coevolving populations resulted in an overall decrease in mean task complexity [F(1, 21) = 8.8, p = 0.01, Adj. R2 = 0.25; Figure 6C]. Despite these trends, host complexity was higher at all levels of ecological complexity in coevolving populations compared to non-coevolving populations [F(1, 58) = 201.6, p < 0.0001, Adj. R2 = 0.78; Figure 6C].
Parasite populations also differed in their mean complexity (Supplementary Figures 1, 2). There was no distinguishable difference in parasite task complexity driven by changing the resource environment from low to moderate levels [F(1, 84) = 0.8, p = 0.4, Supplementary Figure 1B orange vs. green boxplots]. However, increasing task abiotic complexity to very high levels when phenotypic task space in hosts was high (20 tasks) decreased task complexity [F(1, 21) = 30.5, p < 0.0001, Adj. R2 = 0.59; Supplementary Figure 1B boxplots at 20 tasks].
Final Resource Levels Are Influenced by Biotic and Abiotic Drivers
Coevolution also affected the pool of resources left over in the environment (an overall measure of community inefficiency). In the absence of parasites, resources were rapidly depleted and populations continued to exhaust nearly all resources throughout the course of the experiment, with small differences between low and moderately complex abiotic environments (Figure 7A). In the presence of parasites, however, hosts were not able to exploit all the resources. The number of excess resources that accumulated in the environment was inversely proportional to the size of the phenotypic space available. The more constrained the phenotypic space, the larger the pool of resources that accumulated in the environment in both low and moderately complex abiotic environments [F(1, 94) = 1011.1, p < 0.0001, Adj. R2 = 0.91; Figure 7B]. Surprisingly, when abiotic complexity was increased to even higher levels (10 and 20 resources when phenotypic space was 20 tasks), resources once again accumulated in the environment [hosts without coevolution, F(1, 39) = 177.9, p < 0.0001, Adj. R2 = 0.82; hosts with coevolution, F(1, 22) = 15.4, p = 0.001, Adj. R2 = 0.39; Figure 7C].
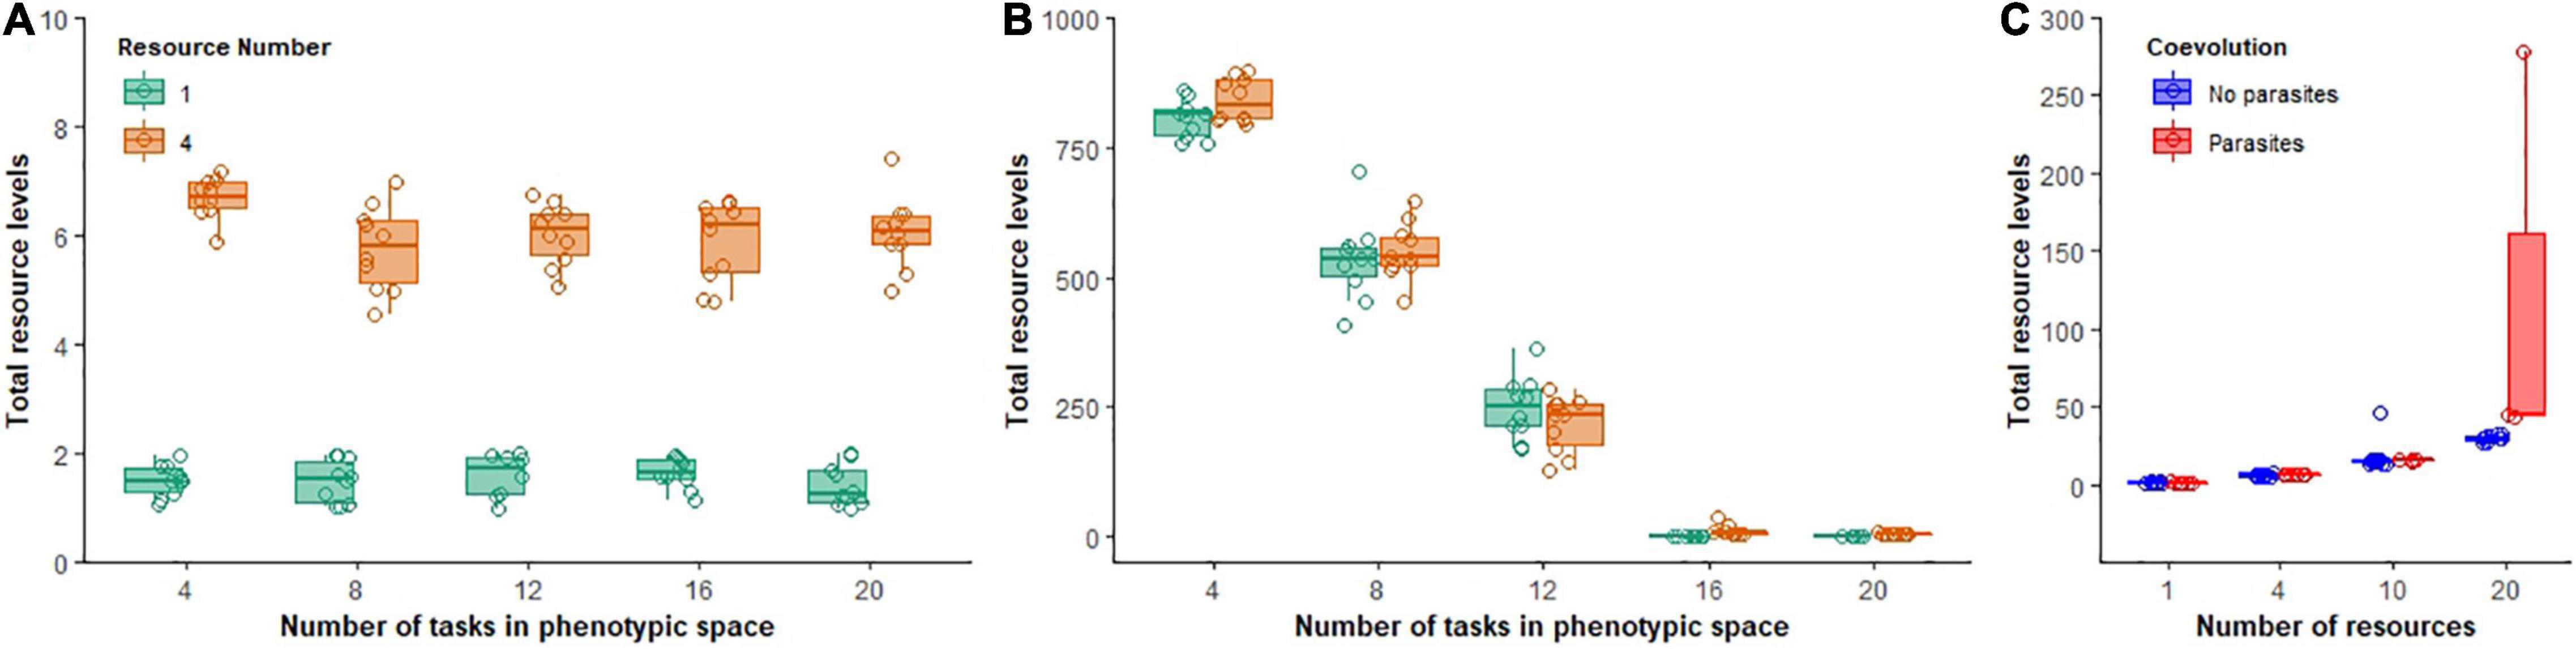
Figure 7. Total excess resource levels that accumulated during evolutionary time. Boxplots show total summed excess resources for non-coevolving populations (A) and coevolving populations (B) in environments of low (green) or moderate ecological complexity (B). In (C), non-coevolving (blue) and coevolving (red) populations are shown as ecological complexity increases.
Discussion
Coevolution Increases Host Phenotypic Diversity Even in the Absence of Abiotic Complexity
Consistent with previously observed phenomenon in microbial systems, we found that parasites were able to drive diversity levels that mimic those observed in abiotically complex environments. With the flexibility afforded by digital evolution systems, we further investigated how these processes interact. The level of diversity achieved in the presence of parasites increased with the available phenotypic space at both low and moderate levels of ecological complexity, while varying phenotypic space had little effect on hosts in the absence of parasites (Figures 4A,B). On the other hand, hosts evolving without parasites reached higher levels of diversity as the abiotic complexity of the environment increased, while this complexity had little effect in the presence of parasites (Figure 4C).
Coevolution Hinders Host Phenotypic Diversity When Abiotic Complexity Is Extremely High
In stark contrast with low and moderate levels of abiotic complexity, when abiotic complexity was very high, parasites actually hampered host diversification (Figure 4C). This could have been driven by several non-mutually exclusive effects. First, because the total amount of resources in the environment stayed constant as it was split into smaller substitutable pools, subpopulations may have competed more strongly. This strong competition could have intensified diversifying selection driven by limited resources. Then, in the presence of parasites, competition was relaxed as additional pressures were placed on the host populations. Consistent with this explanation, as the abiotic complexity increased in the presence of parasites, excess resources accumulated in the environment (Figure 7C), which suggests that at least some host phenotypes began experiencing top-down regulation.
Additionally, when the phenotypic space was expanded, it could have allowed hosts to “out run” the parasite more easily. However, doing so necessarily means certain phenotypes would have become enriched at different time points. This enrichment could have led to a lower Shannon diversity index value. Consistent with this process, though not exclusive of other explanations, the density of the parasite population peaked at intermediate available phenotypic space regardless of the abiotic complexity present in the environment (Figures 3A,B). In other words, increased phenotypic space led to fewer parasites. In fact, parasites were only driven extinct in treatments with large available phenotypic spaces. One way to conceptualize this process is to think of it like a dilution effect driven by the greater number of available phenotypes host populations could maneuver through during coevolution.
Coevolution Dramatically Increases the Average Complexity of Evolved Tasks
Although coevolution with parasites drove similar levels of diversification as in moderately complex abiotic environments, the amount of functional complexity hosts evolved in the presence of parasites far surpassed what was achieved in the absence of parasites (Figure 6). In other words, although similar levels of diversity were achieved in some cases, coevolution pushed hosts into harder to discover genetic spaces. Similar to the patterns of host diversity, abiotic complexity played a larger role in the absence of coevolution (Figure 6C), and available phenotypic space played a larger role in the presence of coevolution (Figures 6A,B).
Ecological Opportunity and Necessity Jointly Drive Patterns of Diversification
We independently varied two important features (abiotic complexity and phenotypic space), but we did not expect their effects to be so dramatically independent from one another. After all, the way resources are exploited by hosts is based on performing tasks in the accessible phenotypic space. The tendency for ecological opportunity and necessity to operate distinctly despite their mechanistic connection in these digital experiments suggests that our results might be relevant even for natural systems where the modes of parasitism can be very independent from the modes of resource exploitation.
Taken together, these results demonstrate that coevolution is fundamentally altering the way host diversity and complexity respond to features of the environment. By carrying out studies on digital evolution systems like Avida, we can begin to disentangle some of the tangled web woven throughout nature. We conclude by suggesting that more focus should be placed on how ecological opportunity and ecological necessity interact, rather than which is more or less responsible for features of natural ecosystems.
Data Availability Statement
The raw data supporting the conclusions of this article will be made available by the authors, without undue reservation.
Author Contributions
MA ran the experiments. MA and LZ analyzed the data and wrote the manuscript. Both authors conceived of the project.
Funding
This work was supported by NSF award DEB-1813069.
Conflict of Interest
The authors declare that the research was conducted in the absence of any commercial or financial relationships that could be construed as a potential conflict of interest.
Publisher’s Note
All claims expressed in this article are solely those of the authors and do not necessarily represent those of their affiliated organizations, or those of the publisher, the editors and the reviewers. Any product that may be evaluated in this article, or claim that may be made by its manufacturer, is not guaranteed or endorsed by the publisher.
Acknowledgments
We would like to thank Brian C. Weeks and Nina Wale for discussions that provided inspiration to these experiments.
Supplementary Material
The Supplementary Material for this article can be found online at: https://www.frontiersin.org/articles/10.3389/fevo.2021.750772/full#supplementary-material
References
Alfaro, M. E., Santini, F., Brock, C., Alamillo, H., Dornburg, A., Rabosky, D. L., et al. (2009). Nine exceptional radiations plus high turnover explain species diversity in jawed vertebrates. Proc. Natl. Acad. Sci. U.S.A. 106, 13410–13414. doi: 10.1073/pnas.0811087106
Baldwin, B. G., and Sanderson, M. J. (1998). Age and rate of diversification of the Hawaiian silversword alliance (Compositae). Proc. Natl. Acad. Sci. U.S.A. 95, 9402–9406. doi: 10.1073/pnas.95.16.9402
Bohannan, B. J. M., and Lenski, R. E. (2000). Linking genetic change to community evolution: insights from studies of bacteria and bacteriophage. Ecol. Lett. 3, 362–377.
Buckling, A., and Rainey, P. B. (2002). The role of parasites in sympatric and allopatric host diversification. Nature 420, 496–499. doi: 10.1038/nature01164
Chase, J. M., and Leibold, M. A. (2003). Ecological Niches. Chicago, IL: University of Chicago Press.
Connell, J. H. (1971). “On the role of natural enemies in preventing competitive exclusion in some marine animals and in rain forest trees,” in Dynamics of Populations, eds P. J. Den Boer and G. R. Gradwell (Wageningen: Centre for Agricultural Publishing and Documentation).
Cvijović, I., Nguyen Ba, A. N., and Desai, M. M. (2018). Experimental studies of evolutionary dynamics in microbes. Trends Genet. 34, 693–703. doi: 10.1016/j.tig.2018.06.004
Elton, C. (1946). Competition and the structure of ecological communities. J. Anim. Ecol. 15, 54–68.
Emerson, B. C., and Kolm, N. (2005). Species diversity can drive speciation. Nature 434, 1015–1017. doi: 10.1038/nature03450
Fortuna, M. A., Zaman, L., Ofria, C., and Wagner, A. (2017). The genotype-phenotype map of an evolving digital organism. PLoS Comput. Biol. 13:e1005414. doi: 10.1371/journal.pcbi.1005414
Gillespie, R. (2004). Community assembly through adaptive radiation in Hawaiian spiders. Science 303, 356–359. doi: 10.1126/science.1091875
Good, B. H., McDonald, M. J., Barrick, J. E., Lenski, R. E., and Desai, M. M. (2017). The dynamics of molecular evolution over 60,000 generations. Nature 551, 45–50.
Grant, P. R., and Grant, B. R. (2006). Evolution of character displacement in Darwin’s finches. Science 313, 224–226. doi: 10.1126/science.1128374
Gupta, A., Zaman, L., Strobel, H. M., Gallie, J., Burmeister, A., Kerr, B., et al. (2021). Host-parasite coevolution promotes innovation through deformations in fitness landscapes. bioRxiv[Preprint]. bioRxiv: 2021.06.25.449783,
Janzen, D. H. (1970). Herbivores and the number of tree species in tropical forests. Am. Nat. 104, 501–528. doi: 10.1086/282687
Kassen, R. (2019). Experimental evolution of innovation and novelty. Trends Ecol. Evol. 34, 712–722. doi: 10.1016/j.tree.2019.03.008
Kawecki, T. J., Lenski, R. E., Ebert, D., Hollis, B., Olivieri, I., and Whitlock, M. C. (2012). Experimental evolution. Trends Ecol. Evol. 27, 547–560.
Koskella, B., Thompson, J. N., Preston, G. M., and Buckling, A. (2011). Local biotic environment shapes the spatial scale of bacteriophage adaptation to bacteria. Am. Nat. 177, 440–451. doi: 10.1086/658991
Kumawat, B., and Zaman, L. (2021). “Architecture of the genotype-phenotype map and the coevolution of complexity,” in Proceedings of the 2021 Conference on Artificial Life, ALIFE 2021 (Cambridge, MA: MIT Press).
Lenski, R. E., Ofria, C., Pennock, R. T., and Adami, C. (2003). The evolutionary origin of complex features. Nature 423, 139–144. doi: 10.1038/nature01568
Lenski, R. E., Rose, M. R., Simpson, S. C., and Tadler, S. C. (1991). Long-term experimental evolution in Escherichia coli. I. Adaptation and divergence during 2,000 generations. Am. Nat. 138, 1315–1341. doi: 10.1086/285289
Levine, J. M., and HilleRisLambers, J. (2009). The importance of niches for the maintenance of species diversity. Nature 461, 254–257. doi: 10.1038/nature08251
Losos, J. B. (2010). Adaptive radiation, ecological opportunity, and evolutionary determinism. American Society of Naturalists E. O. Wilson award address. Am. Nat. 175, 623–639. doi: 10.1086/652433
Meyer, J. R., Dobias, D. T., Weitz, J. S., Barrick, J. E., Quick, R. T., and Lenski, R. E. (2012). Repeatability and contingency in the evolution of a key innovation in phage lambda. Science 335, 428–432. doi: 10.1126/science.1214449
Meyer, J. R., and Kassen, R. (2007). The effects of competition and predation on diversification in a model adaptive radiation. Nature 446, 432–435. doi: 10.1038/nature05599
Mittelbach, G. G., and Schemske, D. W. (2015). Ecological and evolutionary perspectives on community assembly. Trends Ecol. Evol. 30, 241–247. doi: 10.1016/j.tree.2015.02.008
Mittelbach, G. G., Schemske, D. W., Cornell, H. V., Allen, A. P., Brown, J. M., Bush, M. B., et al. (2007). Evolution and the latitudinal diversity gradient: speciation, extinction and biogeography. Ecol. Lett. 10, 315–331. doi: 10.1111/j.1461-0248.2007.01020.x
Ofria, C., Bryson, D. M., and Wilke, C. O. (2009). “Avida: a software platform for research in computational evolutionary biology,” in Artificial Life Models in Software, eds M. Komosinski and A. Adamatzky (London: Springer). doi: 10.1162/106454604773563612
Paterson, S., Vogwill, T., Buckling, A., Benmayor, R., Spiers, A. J., Thomson, N. R., et al. (2010). Antagonistic coevolution accelerates molecular evolution. Nature 464, 275–278. doi: 10.1038/nature08798
R Core Team (2020). R: A Language and Environment for Statistical Computing. Vienna: R Foundation for Statistical Computing.
Rabosky, D. L. (2009). Ecological limits and diversification rate: alternative paradigms to explain the variation in species richness among clades and regions. Ecol. Lett. 12, 735–743. doi: 10.1111/j.1461-0248.2009.01333.x
Rainey, P. B., Buckling, A., Kassen, R., and Travisano, M. (2000). The emergence and maintenance of diversity: insights from experimental bacterial populations. Trends Ecol. Evol. 15, 243–247. doi: 10.1016/s0169-5347(00)01871-1
Rainey, P. B., and Travisano, M. (1998). Adaptive radiation in a heterogeneous environment. Nature 394, 69–72. doi: 10.1038/27900
Saxer, G., and Travisano, M. (2016). Parallelism in adaptive radiations of experimental Escherichia coli populations. Evolution 70, 98–110. doi: 10.1111/evo.12841
Sobel, J. M., Chen, G. F., Watt, L. R., and Schemske, D. W. (2010). The biology of speciation. Evolution 64, 295–315.
Stroud, J. T., and Losos, J. B. (2016). Ecological opportunity and adaptive radiation. Annu. Rev. Ecol. Evol. Syst. 47, 507–532. doi: 10.1146/annurev-ecolsys-121415-032254
Travisano, M., and Rainey, P. B. (2000). Studies of adaptive radiation using model microbial systems. Am. Nat. 156, S35–S44. doi: 10.1086/303414
Vamosi, S. M. (2005). On the role of enemies in divergence and diversification of prey: a review and synthesis. Can. J Zool. 83, 894–910. doi: 10.1139/z05-063
Wagner, A. (2017). Information theory, evolutionary innovations and evolvability. Philos. Trans. R. Soc. Lond. B Biol. Sci. 372:20160416. doi: 10.1098/rstb.2016.0416
Weeks, B. C., Claramunt, S., and Cracraft, J. (2016). Integrating systematics and biogeography to disentangle the roles of history and ecology in biotic assembly. J. Biogeogr. 43, 1546–1559. doi: 10.1111/jbi.12747
Yoder, J. B., Clancey, E., Des Roches, S., Eastman, J. M., Gentry, L., Godsoe, W. K. W., et al. (2010). Ecological opportunity and the origin of adaptive radiations. J. Evol. Biol. 23, 1581–1596. doi: 10.1111/j.1420-9101.2010.02029.x
Zaman, L. (2018). “Investigating open-ended coevolution in digital organisms,” in Proceedings of the Artificial Life Conference (Cambridge, MA: MIT Press).
Zaman, L., Devangam, S., and Ofria, C. (2011). “Rapid host-parasite coevolution drives the production and maintenance of diversity in digital organisms,” in Proceedings of the ACM Genetic and Evolutionary Computation Conference (GECCO-2011), Dublin.
Keywords: coevolution, adaptive radiation, complexity, diversity, ecological opportunity, biotic interactions
Citation: Acosta MM and Zaman L (2022) Ecological Opportunity and Necessity: Biotic and Abiotic Drivers Interact During Diversification of Digital Host-Parasite Communities. Front. Ecol. Evol. 9:750772. doi: 10.3389/fevo.2021.750772
Received: 31 July 2021; Accepted: 23 November 2021;
Published: 09 February 2022.
Edited by:
Miguel A. Fortuna, Doñana Biological Station, Spanish National Research Council (CSIC), SpainReviewed by:
Jomar Fajardo Rabajante, University of the Philippines Los Baños, PhilippinesJurg Spaak, University of Namur, Belgium
Copyright © 2022 Acosta and Zaman. This is an open-access article distributed under the terms of the Creative Commons Attribution License (CC BY). The use, distribution or reproduction in other forums is permitted, provided the original author(s) and the copyright owner(s) are credited and that the original publication in this journal is cited, in accordance with accepted academic practice. No use, distribution or reproduction is permitted which does not comply with these terms.
*Correspondence: Luis Zaman, emFtYW5saEB1bWljaC5lZHU=