 Matthias Rabel
 Michael Laxy2,3
 Filip Mess
- 1Department of Sport and Health Sciences, Technical University of Munich, Munich, Germany
- 2Helmholtz Zentrum München–German Research Center for Environmental Health (GmbH), Institute of Health Economics and Health Care Management, Neuherberg, Germany
- 3German Center for Diabetes Research (DZD), Neuherberg, Germany
- 4Helmholtz Zentrum München–German Research Center for Environmental Health (GmbH), Institute of Epidemiology, Neuherberg, Germany
Background: Health behaviors are of great importance for public health. Previous research shows that health behaviors are clustered and do not occur by chance. The main objective of this study was to investigate and describe the clustering of alcohol consumption, nutrition, physical activity and smoking while also considering the influence of sex, age and education.
Methods: Using data from the population-based KORA S4/F4 cohort study, latent class regression analysis was undertaken to identify different clusters of health behavior patterns. The clusters were described according to demographics. Furthermore, the clusters were described regarding health-related quality of life at baseline and at a 7 year follow-up.
Results: Based on a sample of 4,238 participants, three distinct classes were identified. One overall healthy class and two heterogeneous classes. Classes varied especially according to sex, indicating a healthier behavior pattern for females. No clear association between healthier classes and age, education or physical and mental health-related quality of life was found.
Discussion: This study strengthens the literature on the clustering of health behaviors and additionally describes the identified clusters in association with health-related quality of life. More research on associations between clustering of health behaviors and important clinical outcomes is needed.
Introduction
Health behaviors are closely linked to a person's general health. This is not only postulated in theoretical models like the determinants of health-model (1), but has also been shown empirically (2). In addition to the individual level, health behaviors also have large public health implications. Particularly, alcohol consumption, nutrition, physical activity (PA) and smoking are well-known and important factors regarding public health. In its report on global health risks, the World Health Organization (WHO) lists health behaviors among the leading risk factors for death in high-income countries (3, 4). Plenty of studies have investigated the association between one of these single risk behaviors and health (5–9). However, health-impairing factors usually do not occur apart, but tend to group in clusters (10, 11). A bundling of different health risks can be identified (12) and certain population strata show common patterns of multiple health behaviors (13–15). As there is evidence that multiple health behaviors have synergistic effects and might be targeted simultaneously by interventions, analyzing patterns of health behaviors can be of great importance for public health (16). First, there is evidence that interventions which tackle multiple behaviors seem to be more cost effective (17). Second, with the already described bundling of behaviors and a common culmination of risk factors for individuals (12), considering more than one health behavior to describe individual health patterns seems to be appropriate. Third, in order to design health promoting interventions it is crucial to identify the characteristics of the target group (18), which requires an understanding of how multiple health behaviors are clustered (19). In-depth knowledge about the characteristics of a population might be helpful to identify vulnerable groups, which could profit most from public health interventions (20).
Multiple studies have investigated the general clustering of health behaviors in adults (11, 15, 20, 21). Yet, due to methodological differences (22) as well as different investigated health behaviors (11), the literature is quite heterogeneous. Furthermore, only few studies have investigated the associations between the general clustering of health behaviors and important physical health outcomes like all-cause mortality (7, 23–25).
Health-related quality of life (HRQOL) is an important patient relevant outcome combining physical and mental aspects of health (26). Due to the rise of chronic diseases the concept of HRQOL is crucial for public health (27). Several studies have investigated associations between single health behaviors and HRQOL (28–31). However, little is known about the relationship between patterns of several health behaviors and HRQOL at the population level. Dumuid et al. (32) identified four distinct clusters based on PA, nutrition and screen time in school-aged children. They report differences in HRQOL scores with highest scores for a mixed cluster (low screen time, healthy eating, and moderate PA) (32). Another study investigated associations between a clustering of healthy behaviors (non-smoking, adequate PA, consumption of at least five portions of fruit or vegetables per day) and HRQOL in US adults with diabetes. According to this study, an increase of healthy behaviors is associated with better HRQOL (33). To the best of our knowledge, only one study investigated the relationship of the clustering of health behaviors and HRQOL in a general population (16). Based on smoking, drinking alcohol, PA and nutrition, six health behavior clusters were identified. The scientists report that healthier clusters tend to be associated with better aspects of HRQOL (16). To the best of our knowledge, no study investigated the association between the clustering of health behaviors and HRQOL, including multiple measurements of HRQOL at different time points. Due to this reason, the present study uses data from a population-based cohort study including information on HRQOL at two time points approximately 7 years apart.
The main objective of this study was the identification of clusters that share a similar pattern based on their health behavior. It is assumed that health behavior patterns are closely linked to demographic factors (34). Therefore, sex, age and education are also included in the clustering process. The considered behaviors are smoking, alcohol consumption, leisure time PA, and nutrition. In order to attain comparability with other clustering solutions and with regard to the public health impact of these four behaviors, the present study considers these behaviors in order to identify health behavioral clusters. In order to receive a profound understanding of the identified clusters and characterize their differences, it is helpful to describe them with additional parameters (35). Therefore, the identified clusters will be described regarding sociodemographic parameters. With respect to the sparse scientific background on the association between the clustering of health behaviors and HRQOL, the clusters will be additionally described regarding longitudinal change in physical and mental HRQOL between baseline and a 7-year follow-up.
Methods
Data Source
Our analyses are based on data obtained from the population-based KORA (Cooperative Health Research in the Region of Augsburg) S4/F4 cohort study. In total 4,261 non-institutionalized inhabitants of the Augsburg Region in Southern Germany took part in the baseline health survey conducted in 1999-2001 (S4). All S4 participants were invited to participate in a follow-up examination approximately 7 years later (F4; 2006-2008). A total of 3,080 (72%) participants were investigated at follow-up. The reasons for losses at follow-up are as follows: death (176), claim for data deletion (12), no contact possible (174), refusal to participate (395), illness/lack of time (218), no contact information available (206). At baseline and at follow-up a physical examination and standardized interviews were performed. More detailed information on the KORA S4 study concerning sampling methods and data collection has been published elsewhere (36). All study participants gave written informed consent and the KORA S4/F4 studies were approved by the Ethics Committee of the Bavarian Medical Association.
Measures
Alcohol
Alcohol consumption was calculated based on participants' self-reported information on beer, wine and spirits consumption on the previous workday and weekend. The weekday consumption was multiplied by five and added to the weekend consumption. Total alcohol intake per day [g/day] was derived from dividing this number by seven. Details on the calculation and validation process have already been published (37). For the present study alcohol consumption has been grouped into the following three categories: (1) 0 g/day = “no alcohol,” (2) < 20 g/day = “moderate consumption,” (3) ≥20 g/day = “risky consumption” as suggested by published classifications (38).
Nutrition
Dietary intake was collected by using a food-frequency-questionnaire investigating 24 food groups. Based on recommendations of the German Nutrition Society (DGE) an index was built rating the frequency with which each food was consumed by assigning either 2, 1, or 0 points. Higher scores reflect better compliance to DGE recommendations. A resulting sum score was then rated according to DGE guidelines grouped into the following three categories: (1) “favorable,” (2) “ordinary,” and (3) “adverse.” This approach was established in earlier KORA studies and was validated against a detailed seven-days-dietary protocol (39).
Physical Activity
Participants were asked to report their weekly time spent on leisure-time PA (including cycling) in summer and winter. The two responses were combined and categorized into four groups: (1) “(almost) no activity,” (2) “about 1 h per week irregularly,” (3) “about 1 hour per week regularly,” and (4) “regularly more than 2 h per week.” Categories (2) and (3) were condensed for all statistical analyses because they were not considered adequately distinct. The questions about leisure-time PA originated from the German Cardiovascular Prevention Study conducted between 1979 and 1995 and were validated in the KORA population, by using a PA diary (40).
Smoking
Smoking behavior was classified considering the actual behavior and the regularity with which the behavior was performed. Therefore, participants were asked whether they currently smoke and whether they have ever smoked. Additionally, regularity was surveyed by inquiring whether someone usually smokes regularly (at least one cigarette per day) or irregularly (usually less than one cigarette per day). According to this information, smoking behavior was grouped into (1) non-smoker, (2) ex-smoker, (3) irregular smoker, and (4) regular smoker.
Health-Related Quality of Life
HRQOL was estimated with the SF-12 health survey. This short version of the SF-36 health survey consists of 12 items distinguishing between physical and mental components of HRQOL. Both components can be summarized in a physical component summary score and a mental component summary score with a mean of 50 points and a standard deviation of ten points. Higher scores imply a better HRQOL. Information about psychometric quality criteria can be found elsewhere (41).
Covariates
Information about sex (male, female), age (continuous) and education (main-, middle- and grammar school corresponding to German “Hauptschule,” “Realschule,” and “Gymnasium”) were also collected during the standardized interviews.
Statistical Analysis
In order to identify homogeneous subgroups based on the samples' health behaviors, a latent class analysis was carried out. This method allows to cluster cases into unobserved classes. An advantage of latent class analysis compared to traditional clustering techniques like hierarchical clustering or k-means is that it is a model-based approach. Therefore, this approach is more flexible and the choice of a cluster criterion is less arbitrary (42). Key assumptions to this approach are that the latent class variable and the observed variables, in this case the health behaviors alcohol consumption, nutrition, PA and smoking, are treated as categorical. Another assumption is that the observed variables are locally independent and that dependencies are conditional on the latent classes' variable (43). In a basic, unconditional model, latent class models analyze cross-classification tables of observed variables to estimate the probability of latent class membership. This unconditional model can be extended with covariates which influence latent class membership, into a latent class regression analysis. While in the unconditional model it is assumed that every individual has the same probability for class membership, this approach allows for varying probabilities depending upon observed covariates (44). In our study, sex, age, and education were added to the analysis as covariates, since their importance in this process has been stressed in past studies (11). Latent class membership is based solely on data from the S4 study (1999-2001). Figure A1 in the Appendix gives a visual overview of the latent class regression model. Since in this case, the number of latent classes is unknown, multiple models with an increasing number of classes were fit. To identify the most parsimonious model that represents the data best, several model fit criteria including Akaike information criterion (AIC) and (sample-sized-adjusted) Bayesian Information Criterion (BIC) were deployed. In this study we prioritized BIC as it is the most commonly used criterion which is supposed to be very accurate (45). In addition, model selection should also consider the practical meaning of identified classes (46) and therefore a complex model that cannot provide a new meaningful class is seen as inferior to a simpler model with a marginally worse model fit. Cluster analysis is an analysis to identify groups/clusters. In latent class analysis the term for these groups is class. Therefore, the terms will be used synonymously in this paper.
Descriptive statistics were used to describe and interpret the different latent classes. To investigate differences in HRQOL at baseline (S4) and the follow-up (F4) and to investigate the change in HRQOL between the measurement points a mixed model with a random intercept was fit. In this model HRQOL is the dependent variable and latent class membership, and an interaction between latent class membership and measurement time point are independent variables. Sex, age, and education were introduced as covariates in the model. Altogether two mixed models were fit to differentiate between physical and mental HRQOL.
All data related processes and statistical analyses were conducted using R (Version 3.4.3) (47). Latent class regression analysis was carried out using the “poLCA” package (Version 1.4.1) (44).
Results
Participants
Twenty three participants (0.5%) of the baseline S4 study were excluded from the latent class regression analysis due to missing data in the behavioral variables or the covariates. The remaining sample of 4,238 had a mean age of 49.2 (±13.9) years ranging from 24 to 75 years. 49% of the sample were male, 54% graduated from main school, 23.2% from middle school and 22.7% from grammar school. One third of the population had a normal BMI (≥18.5– <25 kg/m2). Nearly two third of the participants were overweight (BMI≥25– <30 kg/m2) or obese (BMI≥30 kg/m2). Only 0.6% was underweight (BMI <18.5 kg/m2). Figure 1 shows more socio-demographic details and the distribution of the health behavior categories for the overall sample.
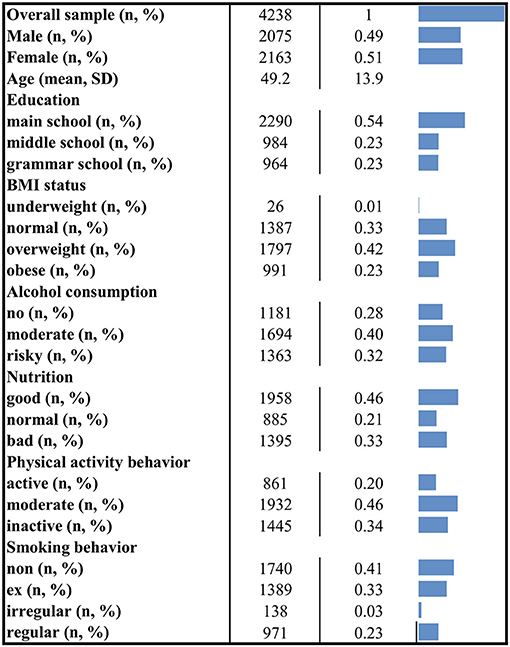
Figure 1. Socio-demographic characteristics and distribution of health behaviors. The figure displays descriptive information for the overall applicable sample. N, number of observations; %, column percent (except for the first row); SD, standard deviation.
Class Selection
Figure 2 shows model fit criteria for the different models. Smaller y-values indicate a better model fit. Multiple models with an increasing number of classes from one to six were fit. The two-class (BIC = 36931.16), three-class (BIC = 36887.63) and four-class (BIC = 36936.96) solutions showed the best model fit regarding the BIC criteria. After a substantial comparison of all solutions, the four-class solution did not reveal any new unique behavioral pattern. Therefore, the three-class solution was chosen as the most appropriate model. For comparison, see Figure 3 and Figures A2, A3 in the Appendix showing the class-conditional item probabilities.
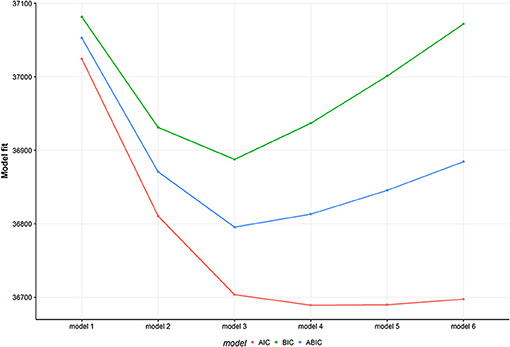
Figure 2. Model fit for multiple models. The figure displays three different model fit criteria for different models. Smaller values indicate a better model fit. The model number represents the number of latent classes. AIC, Akaike Information Criterion; BIC, Bayesian Information Criterion; ABIC, sample size adjusted BIC.
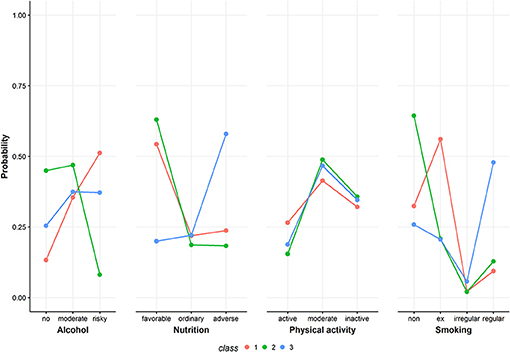
Figure 3. Class-conditional item probabilities. The figure shows the probabilities of each health behavior category conditional on latent class membership.
Description of the Identified Groups
Figure 3 shows the class-conditional item probabilities. This plot displays the probability of an item response given latent class membership. The specific values are presented in Table A1 in the Appendix.
In the following, the three classes from the selected three-class model solution are described regarding their health behavior patterns and socio-demographic characteristics. Figure 4 gives a detailed overview of the health behaviors of the identified classes. Information on the distribution of the three covariates included in the latent class regression can be found in Figure 5. Exact numbers on the distribution of the health behaviors and the covariates can be seen in Table A2 in the Appendix.
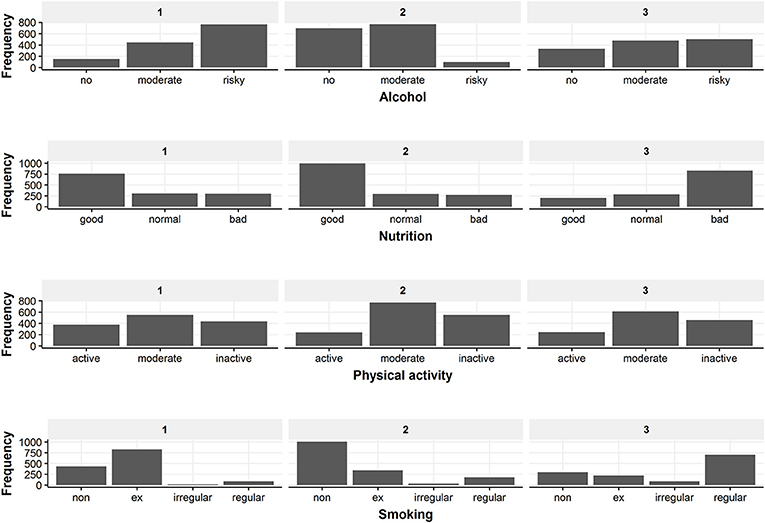
Figure 4. Overview of the behavior distribution in the three latent classes. The figure displays the frequency of every health behavior category for the three classes.
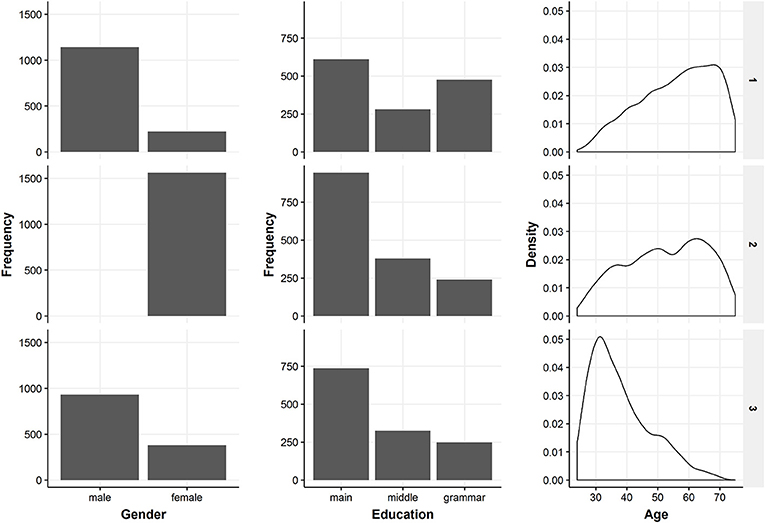
Figure 5. Overview of the included covariates in the three latent classes. The figure shows descriptive information on gender, education and age which were included in the latent class regression.
Class 1
Class 1 has 1,366 members of which 84% are male. Mean age is 56.1 (±11.9) years, 45% are main school attendees and it is the class with the most grammar school graduates (35%). 0.1% are underweight, 26% are of normal weight, 50% are overweight and 24% are obese. Conditional on class 1 membership, class members have the highest probability for risky drinking (51%), a favorable diet (54%), moderate PA (41%) and ex-smoking (56%).
Class 2
Class 2 is the biggest class. Class 2 consists of 1,562 participants and is exclusively female. The biggest share are main school attendees (60%) and the mean age is 52.4 (± 13.0) years. 0.5% are underweight, 34% have a normal weight, 37% are overweight and 29% are obese. Regarding health behavior, class 2 membership has the highest probability for drinking no (45%) or moderately (47%) alcohol, having a favorable diet (63%), being moderately physically active (49%), and being non-smoking (64%).
Class 3
Class 3 is composed of 1,310 participants, 71% thereof are male. Most participants of class 3 received a main school educational degree (56%). Class 3 is the youngest class with a mean age of 38.1 (± 9.8) years. Most participants have normal weight (40%) or are overweight (43%). 1.3% are underweight and 16% are obese. Concerning health behavior, class 3 membership implies highest probabilities for moderate (37%) or risky (38%) alcohol consumption, adverse dietary behavior (58%), moderate PA (47%) and regular smoking (48%).
Associations Between Latent Classes and Health-Related Quality of Life
Based on the mixed model, class 1 (mean = 48.88; 95%-CI = 48.36–49.41) and 2 (mean = 48.47, 95%-CI = 47.89–49.06) have the highest physical HRQOL at baseline. Class 3 has a mean score of 46.96 (95%-CI = 46.28–47.55) concerning physical HRQOL. At follow-up, mean values for physical HRQOL are 47.64 (95%-CI = 47.07–48.21) for class 1, 47.62 (95%-CI = 47.00–48.25) for class 2 and 47.17 (95%-CI = 46.51–47.82) for class 3.
Regarding mental HRQOL, class 1 had a mean score of 51.06 (95%-CI = 51.37–52.17), class 2 had a mean score of 50.77 (95%-CI = 50.14–51.40) and class 3 had a mean score of 50.39 (95%-CI = 49.76–51.02). Follow-up values for mental HRQOL were 51.32 (95%-CI = 50.70–51.95) for class 1, 50.95 (95%-CI = 50.27–51.63) for class 2 and 51.18 (95%-CI = 50.47–51.89) for class 3.
Figure 6 provides a visual overview of the mean physical and mental HRQOL of the three classes.
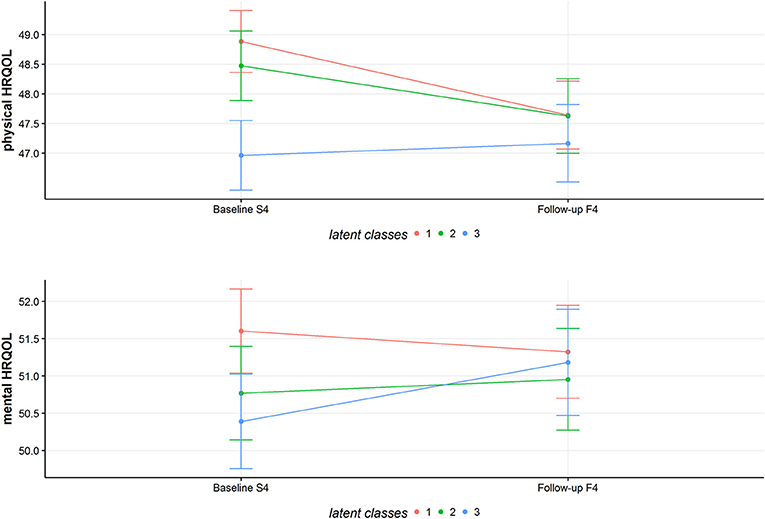
Figure 6. Predicted mean values of physical and mental HRQOL for the latent classes. The figure shows the estimated marginal means for physical and mental HRQOL for the three classes at baseline and follow-up.
Discussion
This study aimed at identifying different subgroups of a population based on the health behaviors alcohol consumption, nutrition, PA and smoking, while also taking the influence of the parameters sex, age and education into account. Three distinct classes were identified. All three classes show a unique pattern regarding the health behaviors. Class 2 represents a healthy cluster, showing a very healthy pattern and the highest item probabilities for healthy behavior categories. Class 1 and class 3 on the other hand show more unhealthy profiles. Class 1 shows highest item probabilities for a risky alcohol consumption. In addition, class 1 has the highest probability for former smoking which has been associated with higher odds for hospital treatments and higher numbers in physician visits (48).
Cluster analysis is very exploratory and although comparisons with other studies are difficult because of different investigated health behaviors and methodological approaches, our results are in line with similar investigations. In line with previous studies, we identified an overall healthy cluster with class 2 (13, 14, 16, 20, 21, 49, 50). Similar to previous studies, we observed a clustering of unhealthy smoking behavior and unhealthy alcohol consumption (11, 15, 16, 20). This clustering becomes very evident for class 3 and partially for class 1 considering the high number of ex-smokers in this class. Some studies report a combination of excessive alcohol consumption and higher PA rates (14, 16, 49). A tendency of this combination could be observed in class 1, which has highest item probabilities for drinking and the highest probability for active PA amongst the three classes.
Regarding socio-demographic characteristics of the identified clusters, the present results are in line with previous studies. Previous research reported a higher male prevalence in more unhealthy clusters (14, 20). Our findings support this result, showing the highest female prevalence rates for the healthy class 2. In our study, age and education were not a good indicator for distinguishing between healthy and unhealthy clusters, as younger and older clusters or more and less educated clusters can be found on both ends of the spectrum. A similar result is also mentioned in the systematic review of Meader et al. (11).
Scientific evidence on associations between clustering of health behaviors and HRQOL is sparse. Conry et al. (16) report a tendency for healthier clusters having a better quality of life. This result could not be replicated by our study. We found no clear association between a healthier behavior pattern and better physical or mental HRQOL. The different latent classes show different adjusted means in physical and mental HRQOL. The classes are also different in their change of physical or mental HRQOL over the years. However, the different changes in physical/mental HRQOL might be due to regression to the mean. Furthermore, the differences in physical/mental HRQOL are too small to be considered as clinically relevant. For the SF-12 questionnaire a difference from three to five points can be seen as the minimal clinically relevant threshold (51).
Our study has several limitations. One problem lies in the way the health behaviors are measured and operationalized. All information on health behaviors is self-reported and thus prone to information bias like recall-bias or social desirability-bias. Furthermore, taking average scores for PA by combining information on winter and summer can be considered as another weakness. However, especially in large cohort studies with many variables, one has to balance the tradeoff between accuracy and feasibility. Another limitation lies in the cross-sectional design of this study. The clustering of the health behaviors is based on the baseline-study and therefore can only be seen as a snapshot. Nevertheless, the questions in the KORA-study are conceptualized to gather information on an established behavior. A further drawback is the assumption that the health behavior pattern which was identified at baseline, remains stable over time. Even though, this assumption might be very bold, this is an adult population and there is evidence, that health behavior patterns are quite stable over time (52, 53). Another limitation of this study concerns the longitudinal description of HRQOL for the established clusters at baseline. The reduced sample size of the KORA-study might result in a biased depiction of HRQOL as healthier people with better HRQOL are more likely to remain in the study. Taking this into account, the observed changes in physical and mental HRQOL might not necessarily reveal a true change on a population level. Although we adjusted our analyses for several variables, chances are high that HRQOL might have been influenced by a factor we did not adjust for, e.g., socio-economic status. Therefore, residual confounding cannot be ruled out.
Besides the aforementioned limitations, this study has several noticeable strengths. The data are collected in a large population-based cohort study. The clustering is based on a latent class model. This approach offers a clustering based on a statistical model instead of more arbitrary cluster criteria and thus might be more sophisticated than traditional clustering approaches (54). Moreover, this methodological approach allows introducing covariates to factor in their influence on health behavior patterns. Another strength of this study is that the clustering is not only based on dichotomous variables like the absence or presence of a risk factor but also on polytomous variables. Despite its limitations and the therefore limited level of inference, addressing the relevance of health behavior clusters by linking them to HRQOL—a clinically important outcome—adds value to this study.
In conclusion, this study identified distinct patterns of health behaviors within a large population-based sample. The observed health behavior patterns and the socio-demographic characteristics of the identified clusters are in line with the few other existing international studies. Knowledge on specific clusters which are common in an adult population are an important step for comprehensive health promoting public health policies. The clustering of lifestyle factors like health behaviors can give valuable information on characteristics of target groups for primary preventions. Combining these findings with further information on big data by health care providers or individual risk probabilities might result in even more effective and comprehensive health care. Further research on health behavior patterns should focus on linking identified clusters to important medical outcomes in order to identify vulnerable groups and to allow for individualized patient-centered primary prevention programs.
Author Contributions
MR, FM, and ML: Conceptualization. MR: Formal analysis, investigation, methodology, and writing-original draft. BT, AP, LS, ML, and FM: Supervision. MR, BT, AP, LS, ML, and FM: Writing–review and editing.
Funding
The KORA research platform (KORA, Cooperative Research in the Region of Augsburg) was initiated and financed by the Helmholtz Zentrum München—German Research Center for Environmental Health, which is funded by the German Federal Ministry of Education and Research and by the State of Bavaria. Furthermore, KORA research was supported within the Munich Center of Health Sciences (MC Health), Ludwig-Maximilians-Universität, as part of the LMU innovative.
Conflict of Interest Statement
The authors declare that the research was conducted in the absence of any commercial or financial relationships that could be construed as a potential conflict of interest.
Supplementary Material
The Supplementary Material for this article can be found online at: https://www.frontiersin.org/articles/10.3389/fpubh.2018.00387/full#supplementary-material
References
1. Dahlgren G, Whitehead M. Levelling Up (part 2): A Discussion Paper on European Strategies for Tackling Social Inequities in Health. Copenhagen: WHO Regional Office for Europe (2006).
2. Cheon C, Oh S-M, Jang S, Park J-S, Park S, Jang B-H, et al. The Relationship between Health Behavior and General Health Status: Based on 2011 Korea National Health and Nutrition Examination Survey. Osong Public Health Res Perspect. (2014) 5:28–33. doi: 10.1016/j.phrp.2013.12.003
3. WHO. Global Health Risks: Mortality and Burden of Disease Attributable to Selected Major Risks. Geneva: World Health Organization (2009).
4. Forouzanfar MH, Alexander L, Anderson HR, Bachman VF, Biryukov S, Brauer M, et al. Global, regional, and national comparative risk assessment of 79 behavioural, environmental and occupational, and metabolic risks or clusters of risks in 188 countries, 1990-2013: a systematic analysis for the Global Burden of Disease Study 2013. Lancet (2015) 386:2287–323. doi: 10.1016/S0140-6736(15)00128-2
5. Ezzati M, Lopez AD. Estimates of global mortality attributable to smoking in 2000. Lancet (2003) 362:847–52. doi: 10.1016/S0140-6736(03)14338-3
6. Ronksley PE, Brien SE, Turner BJ, Mukamal KJ, Ghali WA. Association of alcohol consumption with selected cardiovascular disease outcomes: a systematic review and meta-analysis. BMJ (2011) 342:d671. doi: 10.1136/bmj.d671
7. Loef M, Walach H. The combined effects of healthy lifestyle behaviors on all cause mortality: a systematic review and meta-analysis. Prevent Med. (2012) 55:163–70. doi: 10.1016/j.ypmed.2012.06.017
8. Reiner M, Niermann C, Jekauc D, Woll A. Long-term health benefits of physical activity – a systematic review of longitudinal studies. BMC Public Health (2013) 13:813. doi: 10.1186/1471-2458-13-813
9. Wang X, Ouyang Y, Liu J, Zhu M, Zhao G, Bao W, et al. Fruit and vegetable consumption and mortality from all causes, cardiovascular disease, and cancer: systematic review and dose-response meta-analysis of prospective cohort studies. Br Med J. (2017) 349:g4490. doi: 10.1136/bmj.g4490
10. Singh A, Rouxel P, Watt RG, Tsakos G. Social inequalities in clustering of oral health related behaviors in a national sample of British adults. Prev Med. (2013) 57:102–6. doi: 10.1016/j.ypmed.2013.04.018
11. Meader N, King K, Moe-Byrne T, Wright K, Graham H, Petticrew M, et al. A systematic review on the clustering and co-occurrence of multiple risk behaviours. BMC Public Health (2016) 16:657. doi: 10.1186/s12889-016-3373-6
12. Spring B, Moller AC, Coons MJ. Multiple health behaviours: overview and implications. J Public Health (Oxf) (2012) 34(Suppl. 1):i3–10. doi: 10.1093/pubmed/fdr111
13. Schuit AJ, Van Loon AJM, Tijhuis M, Ocké MC. Clustering of lifestyle risk factors in a general adult population. Prevent Med. (2002) 35:219–24. doi: 10.1006/pmed.2002.1064
14. Poortinga W. The prevalence and clustering of four major lifestyle risk factors in an English adult population. Prevent Med. (2007) 44:124–8. doi: 10.1016/j.ypmed.2006.10.006
15. Mawditt C, Sacker A, Britton A, Kelly Y, Cable N. The clustering of health-related behaviours in a British population sample: Testing for cohort differences. Prev Med. (2016) 88:95–107. doi: 10.1016/j.ypmed.2016.03.003
16. Conry MC, Morgan K, Curry P, Mcgee H, Harrington J, Ward M, et al. The clustering of health behaviours in Ireland and their relationship with mental health, self-rated health and quality of life. BMC Public Health (2011) 11:692. doi: 10.1186/1471-2458-11-692
17. Prochaska JJ, Spring B, Nigg CR. Multiple health behavior change research: an introduction and overview. Prev Med. (2008) 46:181–8. doi: 10.1016/j.ypmed.2008.02.001
18. Carr SM, Lhussier M, Forster N, Geddes L, Deane K, Pennington M, et al. An evidence synthesis of qualitative and quantitative research on component intervention techniques, effectiveness, cost-effectiveness, equity and acceptability of different versions of health-related lifestyle advisor role in improving health. Health Technol Assess (2011) 15:1–284. doi: 10.3310/hta15090
19. Busch V, Van Stel HF, Schrijvers AJP, De Leeuw JRJ. Clustering of health-related behaviors, health outcomes and demographics in Dutch adolescents: a cross-sectional study. BMC Public Health (2013) 13:1118. doi: 10.1186/1471-2458-13-1118
20. Noble N, Paul C, Turon H, Oldmeadow C. Which modifiable health risk behaviours are related? A systematic review of the clustering of Smoking, Nutrition, Alcohol and Physical activity ('SNAP') health risk factors. Prev Med. (2015) 81:16–41. doi: 10.1016/j.ypmed.2015.07.003
21. De Vries H, Van 'T Riet J, Spigt M, Metsemakers J, Van Den Akker M, Vermunt JK, et al. Clusters of lifestyle behaviors: results from the Dutch SMILE study. Prev Med. (2008) 46:203–8. doi: 10.1016/j.ypmed.2007.08.005
22. Mcaloney K, Graham H, Law C, Platt L. A scoping review of statistical approaches to the analysis of multiple health-related behaviours. Prevent Med. (2013) 56:365–71. doi: 10.1016/j.ypmed.2013.03.002
23. Khaw KT, Wareham N, Bingham S, Welch A, Luben R, Day N. Combined impact of health behaviours and mortality in men and women: the EPIC-Norfolk prospective population study. PLoS Med. (2008) 5:e12. doi: 10.1371/journal.pmed.0050012
24. Ford ES, Bergmann MM, Boeing H, Li C, Capewell S. Healthy lifestyle behaviors and all-cause mortality among adults in the United States. Prevent Med. (2012) 55:23–7. doi: 10.1016/j.ypmed.2012.04.016
25. Saint Onge JM, Krueger PM. Health lifestyle behaviors among U.S. adults. SSM – Popul Health (2017) 3:89–98. doi: 10.1016/j.ssmph.2016.12.009
26. Yin S, Njai R, Barker L, Siegel PZ, Liao Y. Summarizing health-related quality of life (HRQOL): development and testing of a one-factor model. Popul Health Metr. (2016) 14:22. doi: 10.1186/s12963-016-0091-3
27. Ellert U, Kurth BM. Health related quality of life in adults in Germany. Bundesgesundheitsblatt - Gesundheitsforschung - Gesundheitsschutz (2013) 56:643–9. doi: 10.1007/s00103-013-1700-y
28. Vogl M, Wenig CM, Leidl R, Pokhrel S. Smoking and health-related quality of life in English general population: implications for economic evaluations. BMC Public Health (2012) 12:203. doi: 10.1186/1471-2458-12-203
29. Valencia-Martin JL, Galan I, Guallar-Castillon P, Rodriguez-Artalejo F. Alcohol drinking patterns and health-related quality of life reported in the Spanish adult population. Prev Med. (2013) 57:703–7. doi: 10.1016/j.ypmed.2013.09.007
30. Milte CM, Thorpe MG, Crawford D, Ball K, Mcnaughton SA. Associations of diet quality with health-related quality of life in older Australian men and women. Exp Gerontol. (2015) 64:8–16. doi: 10.1016/j.exger.2015.01.047
31. Rabel M, Meisinger C, Peters A, Holle R, Laxy M. The longitudinal association between change in physical activity, weight, and health-related quality of life: results from the population-based KORA S4/F4/FF4 cohort study. PLoS ONE (2017) 12:e0185205. doi: 10.1371/journal.pone.0185205
32. Dumuid D, Olds T, Lewis LK, Martin-Fernández JA, Katzmarzyk PT, Barreira T, et al. Health-related quality of life and lifestyle behavior clusters in school-aged children from 12 countries. J Pediatr. (2017) 183:178–83.e172. doi: 10.1016/j.jpeds.2016.12.048
33. Li C, Ford ES, Mokdad AH, Jiles R, Giles WH. Clustering of multiple healthy lifestyle habits and health-related quality of life among US adults with diabetes. Diabetes Care (2007) 30:1770–6. doi: 10.2337/dc06-2571
34. Cockerham WC. Lifestyles, social class, demographic characteristics and health behavior. In: Gochman DS, editor. Handbook of Health Behavior Research I. Personal and Social Determinants. New York, NY: Plenum Press (1997). p. 253–65.
35. Kongsted A, Nielsen AM. Latent Class Analysis in health research. J Physiother (2017) 63:55–8. doi: 10.1016/j.jphys.2016.05.018
36. Rathmann W, Haastert B, Icks A, Lowel H, Meisinger C, Holle R, et al. High prevalence of undiagnosed diabetes mellitus in Southern Germany: target populations for efficient screening. The KORA survey 2000. Diabetologia (2003) 46:182–9. doi: 10.1007/s00125-002-1025-0
37. Wellmann J, Heidrich J, Berger K, Döring A, Heuschmann PU, Keil U. Changes in alcohol intake and risk of coronary heart disease and all-cause mortality in the MONICA/KORA-Augsburg cohort 1987-97. Eur J Cardiovasc Prevent Rehabil. (2004) 11:48–55. doi: 10.1097/01.hjr.0000118174.70522.20
38. Lange C, Manz K, Kuntz B. Alkoholkonsum bei erwachsenen in deutschland: riskante trinkmengen. J Health Monitor. (2017) 2:66–73. doi: 10.17886/RKI-GBE-2017-031
39. Winkler G, Döring A. Validation of a short qualitative food frequency list used in several German large scale surveys. Zeitschrift für Ernährungswissenschaft (1998) 37:234–41. doi: 10.1007/PL00007377
40. Stender M, Döring A, Hense HW, Schlichtherle S, M'harzi S, Keil U. Vergleich zweier methoden zur erhebung der körperlichen aktivität. Sozial- und Präventivmedizin (1991) 36:176–83. doi: 10.1007/BF01352697
41. Ware JJr, Kosinski M, Keller SD. A 12-item short-form health survey: construction of scales and preliminary tests of reliability and validity. Med Care (1996) 34:220–33. doi: 10.1097/00005650-199603000-00003
42. Hagenaars J, Mccutcheon A. Applied Latent Class Analysis. Cambridge: Cambridge University Press (2002).
44. Linzer DA, Lewis JB. poLCA: an R package for polytomous variable latent class analysis. (2011) 42:29. doi: 10.18637/jss.v042.i10
45. Tein J-Y, Coxe S, Cham H. Statistical power to detect the correct number of classes in latent profile analysis. Struc Equ Model. (2013) 20:640–57. doi: 10.1080/10705511.2013.824781
46. Masyn KE. Latent class analysis and finite mixture modeling. In: Little TD, editor. The Oxford Handbook of Quantitative Methods. New York, NY: Oxford University Press (2013).
47. R Core Development Team. R: A Language and Environment for Statistical Computing. Vienna: R Foundation for Statistical Computing (2010).
48. Wacker M, Holle R, Heinrich J, Ladwig KH, Peters A, Leidl R, et al. The association of smoking status with healthcare utilisation, productivity loss and resulting costs: results from the population-based KORA F4 study. BMC Health Serv Res (2013) 13:278. doi: 10.1186/1472-6963-13-278
49. Schneider S, Huy C, Schuessler M, Diehl K, Schwarz S. Optimising lifestyle interventions: identification of health behaviour patterns by cluster analysis in a German 50+ survey. Eur J Public Health (2009) 19:271–7. doi: 10.1093/eurpub/ckn144
50. Dodd LJ, Al-Nakeeb Y, Nevill A, Forshaw MJ. Lifestyle risk factors of students: a cluster analytical approach. Prevent Med. (2010) 51:73–7. doi: 10.1016/j.ypmed.2010.04.005
51. Warkentin LM, Majumdar SR, Johnson JA, Agborsangaya CB, Rueda-Clausen CF, Sharma AM, et al. Weight loss required by the severely obese to achieve clinically important differences in health-related quality of life: two-year prospective cohort study. BMC Med. (2014) 12:1–9. doi: 10.1186/s12916-014-0175-5
52. Fleary SA, Nigg CR. Trends in health behavior patterns among US adults, 2003–2015. Ann Behav Med. (2019) 53:1–15. doi: 10.1093/abm/kay010
53. Burgard SA, Lin KYP, Segal BD, Elliott MR, Seelye S. Stability and change in health behavior profiles of U.S. adults. J Gerontol Series B (2018) doi: 10.1093/geronb/gby088
Keywords: health behavior pattern, latent class analysis, latent class regression, cluster analysis, alcohol, nutrition, physical activity, smoking
Citation: Rabel M, Laxy M, Thorand B, Peters A, Schwettmann L and Mess F (2019) Clustering of Health-Related Behavior Patterns and Demographics. Results From the Population-Based KORA S4/F4 Cohort Study. Front. Public Health 6:387. doi: 10.3389/fpubh.2018.00387
Received: 09 November 2018; Accepted: 31 December 2018;
Published: 22 January 2019.
Edited by:
Onyebuchi A. Arah, University of California, Los Angeles, United StatesReviewed by:
Banu Cakir, Hacettepe University, TurkeyGiridhara R. Babu, Public Health Foundation of India, India
Copyright © 2019 Rabel, Laxy, Thorand, Peters, Schwettmann and Mess. This is an open-access article distributed under the terms of the Creative Commons Attribution License (CC BY). The use, distribution or reproduction in other forums is permitted, provided the original author(s) and the copyright owner(s) are credited and that the original publication in this journal is cited, in accordance with accepted academic practice. No use, distribution or reproduction is permitted which does not comply with these terms.
*Correspondence: Matthias Rabel, bWF0dGhpYXMucmFiZWxAdHVtLmRl