 Luca Paroni1,2
 Clelia D'Apice1,3
 Silvia Ussai4*
 Benedetta Armocida1
 Beatrice Formenti1,5
 Lorenzo De Min1
 Eduardo Missoni1,6
- 1Saluteglobale.It Associazione di Promozione Sociale, Brescia, Italy
- 2Istituto di Ricerche Farmacologiche Mario Negri Istituti di Ricovero e Cura a Carattere Scientifico, Milan, Italy
- 3Department of Medicine and Surgery, University of Parma, Parma, Italy
- 4Directorate General for Food and Health, European Commission, Brussels, Belgium
- 5Division of Infectious Diseases, Aziende Socio Sanitarie Territoriali Spedali Civili of Brescia, Brescia, Italy
- 6Center for Research on Health and Social Care Management (CERGAS), Bocconi University, Milan, Italy
With the beginning of the autumn-winter season, Italy experienced an increase of SARS-CoV-2 cases, requiring the Government to adopt new restrictive measures. The national surveillance system in place defines 21 key process and performance indicators addressing for each Region/Autonomous Province: (i) the monitoring capacity, (ii) the degree of diagnostic capability, investigation and contact tracing, and (iii) the characteristics of the transmission dynamics as well as the resilience of health services. Overall, the traffic light approach shows a collective effort by the Italian Government to define strategies to both contain the spread of COVID-19 and to minimize the economic and social impact of the epidemic. Nonetheless, on what principles color-labeled risk levels are assigned on a regional level, it remains rather unclear or difficult to track.
With the beginning of the autumn-winter season, Italy experienced an increase of SARS-CoV-2 cases, requiring the Government to adopt new restrictive measures (1). The national surveillance system has been implemented according to the Prime Ministerial Decree (DPCM) of November 3, 2020 (2), the previous strategic documents for monitoring for the second wave (3, 4) and the DPCM of April 26, 2020 (5). The latter document defines 21 key process and performance indicators addressing for each Region/Autonomous Province: (i) the monitoring capacity, (ii) the degree of diagnostic capability, investigation and contact tracing, and (iii) the characteristics of the transmission dynamics as well as the resilience of health services (Table 1) (5). Based on a weekly assessment, each region is assigned to different levels of risk (high, medium, and low), which are mapped using a “traffic light” color code (red, orange, and yellow). The criteria are compliant with the European Commission's decision to adopt a common color code to provide strategy to restrict free movement across the European Union (6) and with the WHO frameworks (7).
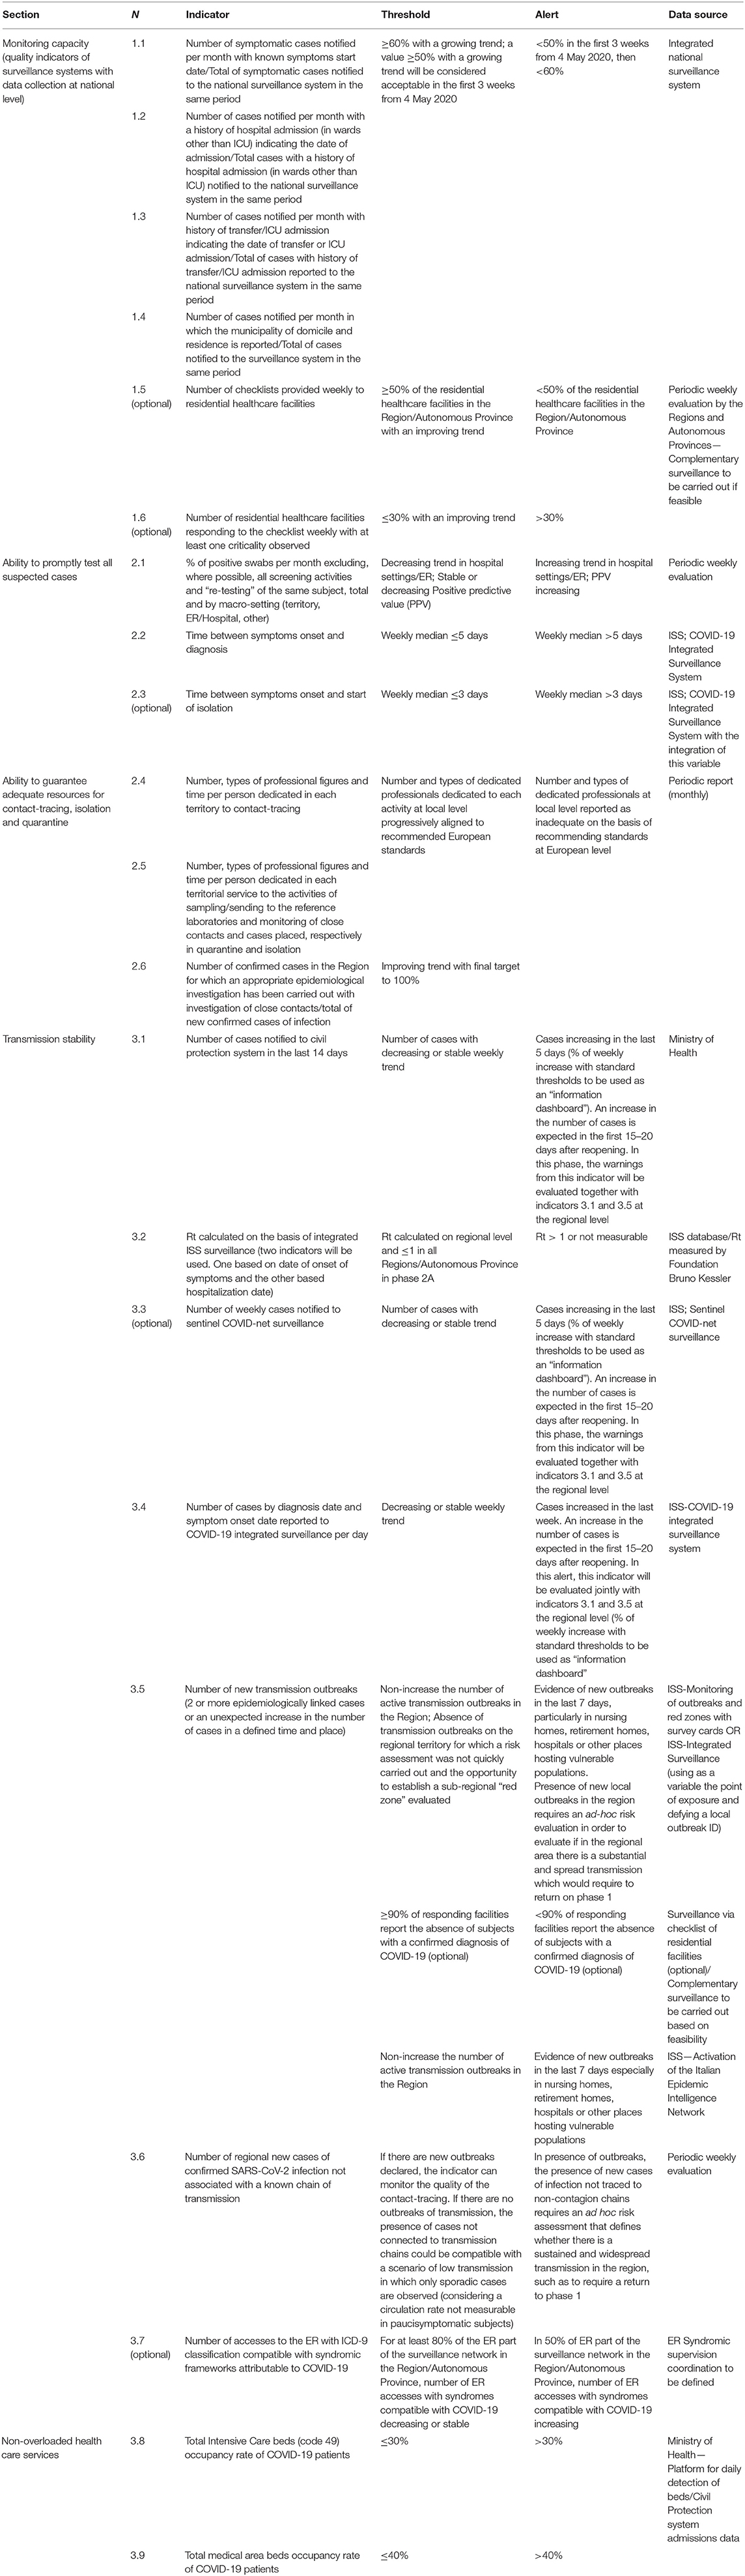
Table 1. List of the 21 Indicators as described in the DPCM of April 26.
The complete algorithm is presented in Figure 1. The overall risk assessment is based on 21 key process and performance indicators (Table 1). Either thresholds or comparative evaluation are defined and monitored on a weekly basis by each region as part of the national integrated surveillance system.
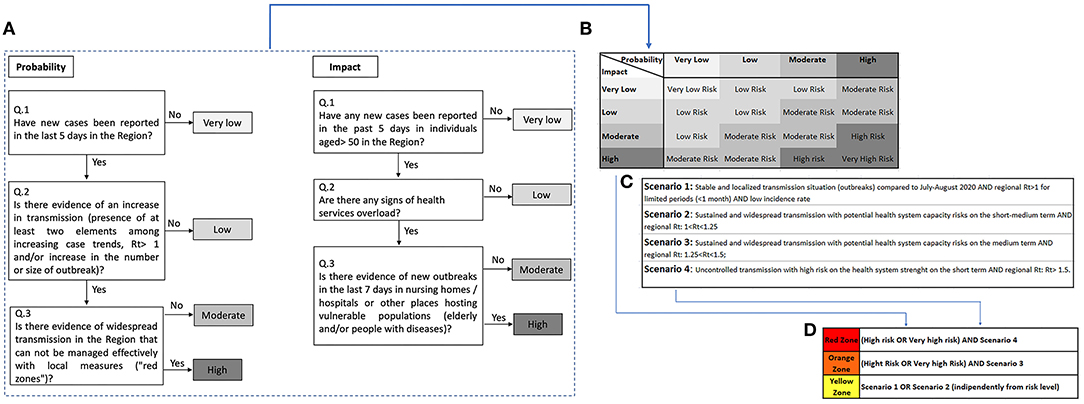
Figure 1. Complete algorithm. (A) Probability and Impact risk evaluation of COVID-19 pandemic from phase 1 to phase 2A in Italy based on the 21 indicators described in the DPCM from April 26. (B) Risk assessment matrix combination of probability and impact evaluation as described in the decree of the Ministry of Health. (C) Description of the four scenarios based on the strategic document developed by the Ministry of Health and ISS on the evolution of strategy and planning in the COVID-19 transition phase for the autumn-winter season (4). (D) Definition of the red, orange, and yellow areas based on the decree of the Ministry of health from November 3.
Indicators 1.1–1.6 are used for an initial assessment of the quality of the information collected. If a region has those indicators above threshold, it is automatically labeled as a high-risk region.
If a region complies with the threshold, two algorithms are used in order to evaluate the epidemic probability risk and epidemic impact risk (Figure 1A). Indicators used to evaluate the probability risk range from 3.1 to 3.7, while indicators used to evaluate the impact risk range from 3.1 to 3.9 (5). A risk assessment matrix (RAM) based on the probability and impact risk defines the risk level as: very low, low, moderate, high, and very high (Figure 1B). An additional classification of the level of risk has been defined assuming four possible scenarios based on the reproductive number (Rt) (Table 1—indicator 3.2) as described in Figure 1C (3).
For each region, the combination of RAM and the four possible scenarios defines the overall high, medium and low risk, which is color coded as red, orange, and yellow (2) (Figure 1D). A region is considered red when the RAM is equal to very high risk or high risk and complies with Scenario 4; orange when the RAM is equal to very high risk or high risk and complies with Scenario 3; and yellow when it is in Scenario 1 or Scenario 2, independently from the RAM results. From December 6 until December 12, the overall distribution of the Regions and Autonomous Provinces was as follows: 12 color-coded as yellow areas, eight color-coded as orange areas, and one as red area.
The risk assessment method outlined by the Italian Government is in line with the WHO and European Commission frameworks (6, 7). Although detailed indicators and the risk assessment process were defined, we draw attention to the following critical issues: (1) some indicators are not clearly outlined either in their meaning or in the proposed threshold (indicators 2.1, 2.4, 2.5, 2.6, 3.1–3.6); (2) the two algorithms of probability and impact risk assessment do not report which specific indicators are used to assess the four questions (Figure 1A); (3) overall, the information needed to define the entire algorithm is fragmented in different documents (2–5); (4) although the 21 indicators have been defined in the DPCM of April 26 (5), the related weekly reports started being described on a regional basis only from October 26 (8); (5) potential enforcement of the risk assessment algorithm by local regional regulation. As an example, the administration of the Abruzzo Region, which was on a Red risk level until December 5, decided to unilaterally self-declare on an orange risk level despite the Italian central Government did not allow the shift until December 12 (9).
The traffic light approach shows a collective effort by the Italian Government to define strategies to both contain the spread of COVID-19 and to minimize the economic and social impact of the epidemic. Nonetheless, on what principles color-labeled risk levels are assigned on a regional level, it remains rather unclear or difficult to track.
Author Contributions
All authors listed have made a substantial, direct and intellectual contribution to the work, and approved it for publication.
Conflict of Interest
The authors declare that the research was conducted in the absence of any commercial or financial relationships that could be construed as a potential conflict of interest.
References
1. Decreto del Presidente del Consiglio dei ministri. Ulteriori disposizioni attuative del decreto-legge 25 marzo 2020, n. 19, convertito, con modificazioni, dalla legge 25 maggio 2020, n. 35, recante ≪Misure urgenti per fronteggiare l'emergenza epidemiologica da COVID-19≫, e del decreto-legge 16 maggio 2020, n. 33, convertito, con modificazioni, dalla legge 14 luglio 2020, n. 74, recante ≪Ulteriori misure urgenti per fronteggiare l'emergenza epidemiologica da COVID-19≫. (2020). Available online at: https://www.gazzettaufficiale.it/eli/gu/2020/10/25/265/sg/pdf (accessed December 8, 2020).
2. Decreto del Presidente del Consiglio dei ministri. Ulteriori disposizioni attuative del decreto-legge 25 marzo 2020, n. 19, convertito, con modificazioni, dalla legge 25 maggio 2020, n. 35, recante ≪Misure urgenti per fronteggiare l'emergenza epidemiologica da COVID-19≫, e del decreto-legge 16 maggio 2020, n. 33, convertito, con modificazioni, dalla legge 14 luglio 2020, n. 74, recante ≪Ulteriori misure urgenti per fronteggiare l'emergenza epidemiologica da COVID-19≫. (2020). Available online at: https://www.gazzettaufficiale.it/eli/gu/2020/11/04/275/so/41/sg/pdf (accessed December 8, 2020).
3. Prevenzione e risposta a COVID-19: evoluzione della strategia e pianificazione nella fase di transizione per il periodo autunno-invernale. Roma: Ministero della Salute, Istituto Superiore di Sanità (2020). Available online at: https://www.trovanorme.salute.gov.it/norme/renderNormsanPdf?anno=2020&codLeg=76597&parte=1%20&serie=null (accessed December 8, 2020).
4. Principi di monitoraggio del rischio sanitario. Available online at: https://www.lavoripubblici.it/documenti2020/lvpb2/Allegato_10_dpcm_26_04_2020.pdf (accessed December 8, 2020).
5. Emergenza COVID-19: attività di monitoraggio del rischio sanitario connesse al passaggio dalla fase 1 alla fase 2A di cui all'allegato 10 del DPCM. (2020). Available online at: https://www.trovanorme.salute.gov.it/norme/renderNormsanPdf?anno=2020&codLeg=77099&parte=1%20&serie=null (accessed December 8, 2020).
6. European Commission Statement on the Coordination of Measures Restricting Free Movement in the European Union Related to the Coronavirus Pandemic. Available online at: https://ec.europa.eu/commission/presscorner/detail/en/statement_20_1871 (accessed December 11, 2020).
7. World Health Organization. COVID-19 Strategic Preparedness and Response Plan. Country Preparedness and Response Status for COVID-19. (2020). Available online at: https://www.who.int/publications/i/item/strategic-preparedness-and-response-plan-for-the-new-coronavirus (accessed December 8, 2020).
8. Ministry of Health of Italy. Nuovo Coronavirus. Notizie–Report settimanale Covid-19. Available online at: http://www.salute.gov.it/portale/nuovocoronavirus/archivioNotizieNuovoCoronavirus.jsp?lingua=italiano&tipo=Report±settimanale±Covid-19&btnCerca=cerca (accessed December 8, 2020).
9. Regione Abruzzo. Ordinanza del presidente della giunta regionale N.106 del 6 Dicembre 2020. Ulteriori misure urgenti per la prevenzione e gestione dell'emergenza epidemiologica da COVID-2019. Available online at: https://www.regione.abruzzo.it/system/files/atti-presidenziali/ordinanze/2020/opgr-106-2020.pdf (accessed December 8, 2020).
Keywords: COVID-19, Italy, guideline, indicators, traffic light algorithms
Citation: Paroni L, D'Apice C, Ussai S, Armocida B, Formenti B, Min LD and Missoni E (2021) The Traffic Light Approach: Indicators and Algorithms to Identify Covid-19 Epidemic Risk Across Italian Regions. Front. Public Health 9:650243. doi: 10.3389/fpubh.2021.650243
Received: 06 January 2021; Accepted: 18 February 2021;
Published: 16 March 2021.
Edited by:
Lara Lengel, Bowling Green State University, United StatesReviewed by:
Penrose Jackson, Vermont Public Health Institute, United StatesAlessandro Rovetta, Mensana srls, Italy
Copyright © 2021 Paroni, D'Apice, Ussai, Armocida, Formenti, Min and Missoni. This is an open-access article distributed under the terms of the Creative Commons Attribution License (CC BY). The use, distribution or reproduction in other forums is permitted, provided the original author(s) and the copyright owner(s) are credited and that the original publication in this journal is cited, in accordance with accepted academic practice. No use, distribution or reproduction is permitted which does not comply with these terms.
*Correspondence: Silvia Ussai, dXNzYWkuc2lsdmlhQGdtYWlsLmNvbQ==