 Daniel Escobar Carbonari1,2,3*
 Godefroy Grosjean2
 Peter Läderach2
 Tran Dai Nghia4
 Bjoern Ole Sander5
 Justin McKinley5,6
 Leocadio Sebastian5
 Jeimar Tapasco7
- 1Department of Physical Geography, Stockholm University, Stockholm, Sweden
- 2CGIAR Research Program on Climate Change, Agriculture and Food Security (CCAFS), Area of Decision and Policy Analysis, International Center for Tropical Agriculture (CIAT), Hanoi, Vietnam
- 3Ecotonos Foundation, Cali, Colombia
- 4Department of Natural Resources and Environmental Economics, The Institute of Policy and Strategy for Agriculture and Rural Development (IPSARD), Hanoi, Vietnam
- 5CGIAR Research Program on Climate Change, Agriculture and Food Security (CCAFS), International Rice Research Institute (IRRI), Hanoi, Vietnam
- 6Department of Economics, Monash University, Clayton, VIC, Australia
- 7CGIAR Research Program on Climate Change, Agriculture and Food Security (CCAFS), Area of Decision and Policy Analysis, International Center for Tropical Agriculture (CIAT), Cali, Colombia
The processes countries use to revise their Nationally Determined Contributions (NDCs) under the UNFCCC's Paris Agreement will be key to ensure that their pledges lead to effective climate change policy. In many developing countries, the agriculture, forestry and other land use (AFOLU) sector is central to their NDCs. For this study, a marginal abatement cost (MAC) curve was used to review Vietnam's mitigation pledges pertaining to the AFOLU sector. We conclude that Vietnam has the potential to increase its NDC pledges, especially in the land use sector and through negative cost mitigation measures including water techniques for rice cultivation, agroforestry, and management of livestock diets and manure. While the MAC curve alone is insufficient to prioritize policy options, this study highlights the fundamental importance of continuous data improvement and refinement for monitoring NDC actions and ultimately achieving the goals set out in the Paris Agreement.
Introduction
The UNFCCC Paris Agreement aims to limit global mean temperatures to 2°C above preindustrial levels and if possible, to 1.5°C. In preparation for the Agreement, 192 countries submitted their Intended Nationally Determined Contributions (INDCs) to reduce global emissions of greenhouse gases. These INDCs became Nationally Determined Contributions (NDCs) when each country ratified the Agreement.
Countries have taken various approaches in designing their NDCs. Some set absolute targets for reducing emissions, while others set targets below forecasted business as usual (BAU) scenarios or by emission intensity (Briner and Moarif, 2016). The NDC system was designed as a bottom-up process based on self-determination and trust in collective action (Deprez et al., 2015). The NDCs therefore reflected both differing emphasis between sectors and differing levels of specificity of mitigation actions. The Agreement also foresees that countries will upgrade their NDCs and make stronger pledges toward its long-term goals (Deprez et al., 2015; Höhne et al., 2017). NDCs are expected to be updated every 5 years starting in 2025, however, countries can increase their pledged contributions at any time.
Before 2020, countries will receive feedback and suggestions generated with the talanoa dialogue1 to improve their NDCs (UNFCCC, 2015; Höhne et al., 2017). However, this process faces certain challenges, such as the limited data available on costs, benefits, and the mitigation potential of different options. These challenges are particularly acute for the agriculture, forestry and other land use (AFOLU2) sector3 (Kunreuther et al., 2014), where an iterative refining process of available mitigation options and their consequences is fundamental to ensure the overall success of the Paris Agreement. This study highlights the importance of such a process, especially in developing countries, and showcases Vietnam as an example of the benefits of refining NDC mitigation commitments.
Vietnam's NDC included specific mitigation targets and actions for its AFOLU sector. However, due to data and time limitations to finalize INDCs, the country's NDC revision process4 could still benefit from further refinement of marginal abatement costs and potential estimates. It could also expand and disaggregate the total number of mitigation options initially included in the INDCs. More disaggregated options represent better the heterogeneity within the sector and support the translation of findings into practical farm advice (Eory et al., 2018). In this paper, we review the abatement options from Vietnam's NDC as well as other options using the marginal abatement cost (MAC) curve methodology.
The MAC curve is a tool used to evaluate mitigation policies and has been adopted by the IPCC, UN agencies and the World Bank (Yang et al., 2017). MAC curves “intuitively show the relationship between the marginal costs and carbon mitigation potential of emission reduction measures” (Yang et al., 2017). Many countries used MAC curves to support and prioritize mitigation options in their NDC's (USAID, 2016). Nevertheless, the assumptions behind the data and the quality of data used to produce the mitigation commitments in the NDCs are not always clear (USAID, 2016). Mitigation measures in the AFOLU sector can also give socio-economic, health, and environmental benefits, which are both difficult evaluate (Smith et al., 2014), and are not considered in the MAC curve.
The AFOLU sector emitted ~24% of global anthropogenic GHGs in 2010 (Edenhofer et al., 2014) and often contributes a substantial share of national emissions in developing countries (Smith et al., 2014). The AFOLU sector must therefore be thoroughly considered to achieve national targets as “excluding agricultural emissions from mitigation targets will increase the cost of mitigation in other sectors or reduce the feasibility of meeting the 2°C limit” (Wollenberg et al., 2016). The AFOLU sector is also a key component in carbon sequestration to limit global warming to 1.5–2°C (Griscom et al., 2017; IPCC, 2018).
Recent literature has provided better insights into the marginal costs of abatement and potentials of agriculture (Grosjean et al., 2018), but has been focused on developed countries. There are fewer analyses of mitigation costs and potential for the AFOLU sector in developing countries and the data are often hard to find. It is therefore difficult for many countries to define feasible goals for the AFOLU sector. This paper contributes to address that gap, using Vietnam as a case study. As current NDCs are insufficient to keep global warming below 2°C in the long term (UNFCCC, 2015; Rogelj et al., 2016; Schleussner et al., 2016; Robiou du Pont et al., 2017), reviewing the mitigation cost and potential, like this study does, is fundamental to increase the effectiveness of mitigation policy and the transparency of NDC under the Paris Agreement Framework.
Vietnam: GHG Profile
The Socialist Republic of Vietnam has a population of 92 million and a fast-growing economy that has outpaced the world average for the last 20 years (O'neill, 2011). It is part of Southeast Asia, a region that is an important emitter of GHGs yet has considerable mitigation potential (Asian Development Bank, 2009). Vietnam's agriculture sector is a source of GHG emissions while its land use sector has net negative emissions (MONRE, 2014).
According to Vietnam's NDC, in 2010, total national emissions amounted to 246.8 Mt CO2eq. By 2020 this figure is estimated to grow to 474.1 Mt CO2eq and will reach 787.4 Mt CO2eq by 2030 under the BAU scenario. The emission data by sector reveal a different trend however. In 1994, Vietnam's agricultural emissions equaled 52.4 Mt of CO2eq, whereas its Forestry and Other Land Use (FOLU) sector emitted 19.4 Mt of CO2eq. As of 2010, agriculture emitted 88.3 Mt CO2eq, or 35.8% of the total national emissions. In contrast, FOLU produced negative net emissions equivalent to 19.2 Mt of CO2eq (MONRE, 2014). Vietnam's NDC proposes quantitative goals for the different mitigation measures in the AFOLU sector. The NDC presents two mitigation scenarios: the unconditional contribution, which aims to reduce GHG emissions by 8% from BAU, and the conditional contribution5, which aims to reduce them by 25%.
Vietnam Compared With Other Southeast Asia6 (SEA) Nations
In comparison with other SEA nations, Vietnam is ranked third highest in terms of total GHG emissions7 after Indonesia and Thailand (Figure 1). Regarding agricultural emissions, Vietnam currently ranks fourth behind Indonesia, Thailand, and Myanmar, but in FOLU sectors, both Malaysia and the Philippines have greater fluxes of emission removals than Vietnam (WRI, 2017).
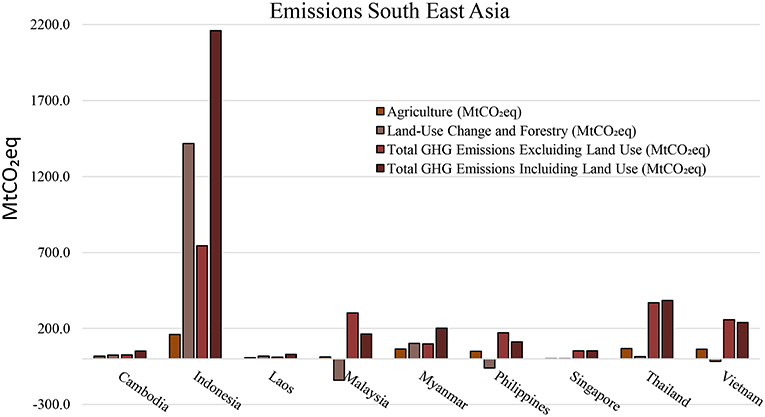
Figure 1. Emissions from the different countries in Southeast Asia for 2017 (WRI, 2017).
AFOLU Sector in Vietnam's NDC
Under the BAU scenario in Vietnam, emissions from the agriculture sector, driven largely by enteric fermentation of livestock and agricultural soils (i.e., fertilizer use) will reach 109 Mt CO2eq by 2030, an increase of 24% from 2010. However, the NDC technical report on agriculture predicts that with foreign aid and the adoption of proactive mitigation measures, GHG emissions from agriculture could fall at least 5.8% and as much as 42% below BAU by 2030. There are currently 15 mitigation measures8 for agriculture listed in the NDC technical reports.
Net removals of GHGs by the FOLU sector is projected to increase to 45.3 Mt CO2eq per year (135%) by 2030. The change comes from simultaneous increased afforestation and decreased deforestation. Vietnam's mitigation commitments for the FOLU sector include an increase of almost 52% in GHG removals by 2030. However, with foreign aid, GHG removal potential reaches almost 145% by 2030. The NDC technical report for the FOLU sector list nine mitigation measures9.
Methods
Using CO2eq to represent Vietnam's GHG balance and costs in constant 2016 U.S. dollars (USD) a MAC curve was constructed for this study to determine the mitigation options for the country's AFOLU sector. In order to improve the comparability of mitigation options, we harmonized data input whenever possible. The study analyzes the period 2020–2030, using the BAU scenario from Vietnam's NDC and emphasizing technological options for mitigation recommended for the AFOLU sector. In total, 41 mitigation measures were identified based on the NDC technical reports and supplemented by the opinions of national and international experts. Furthermore, the mitigation potential and economic costs were used to estimate cost effectiveness of each mitigation measure compared with the corresponding BAU practice (Table 1). Mitigation options were then ranked according to their potential cost effectiveness, noting the limitations and assumptions in their implementation, which could have affected the study's calculations.
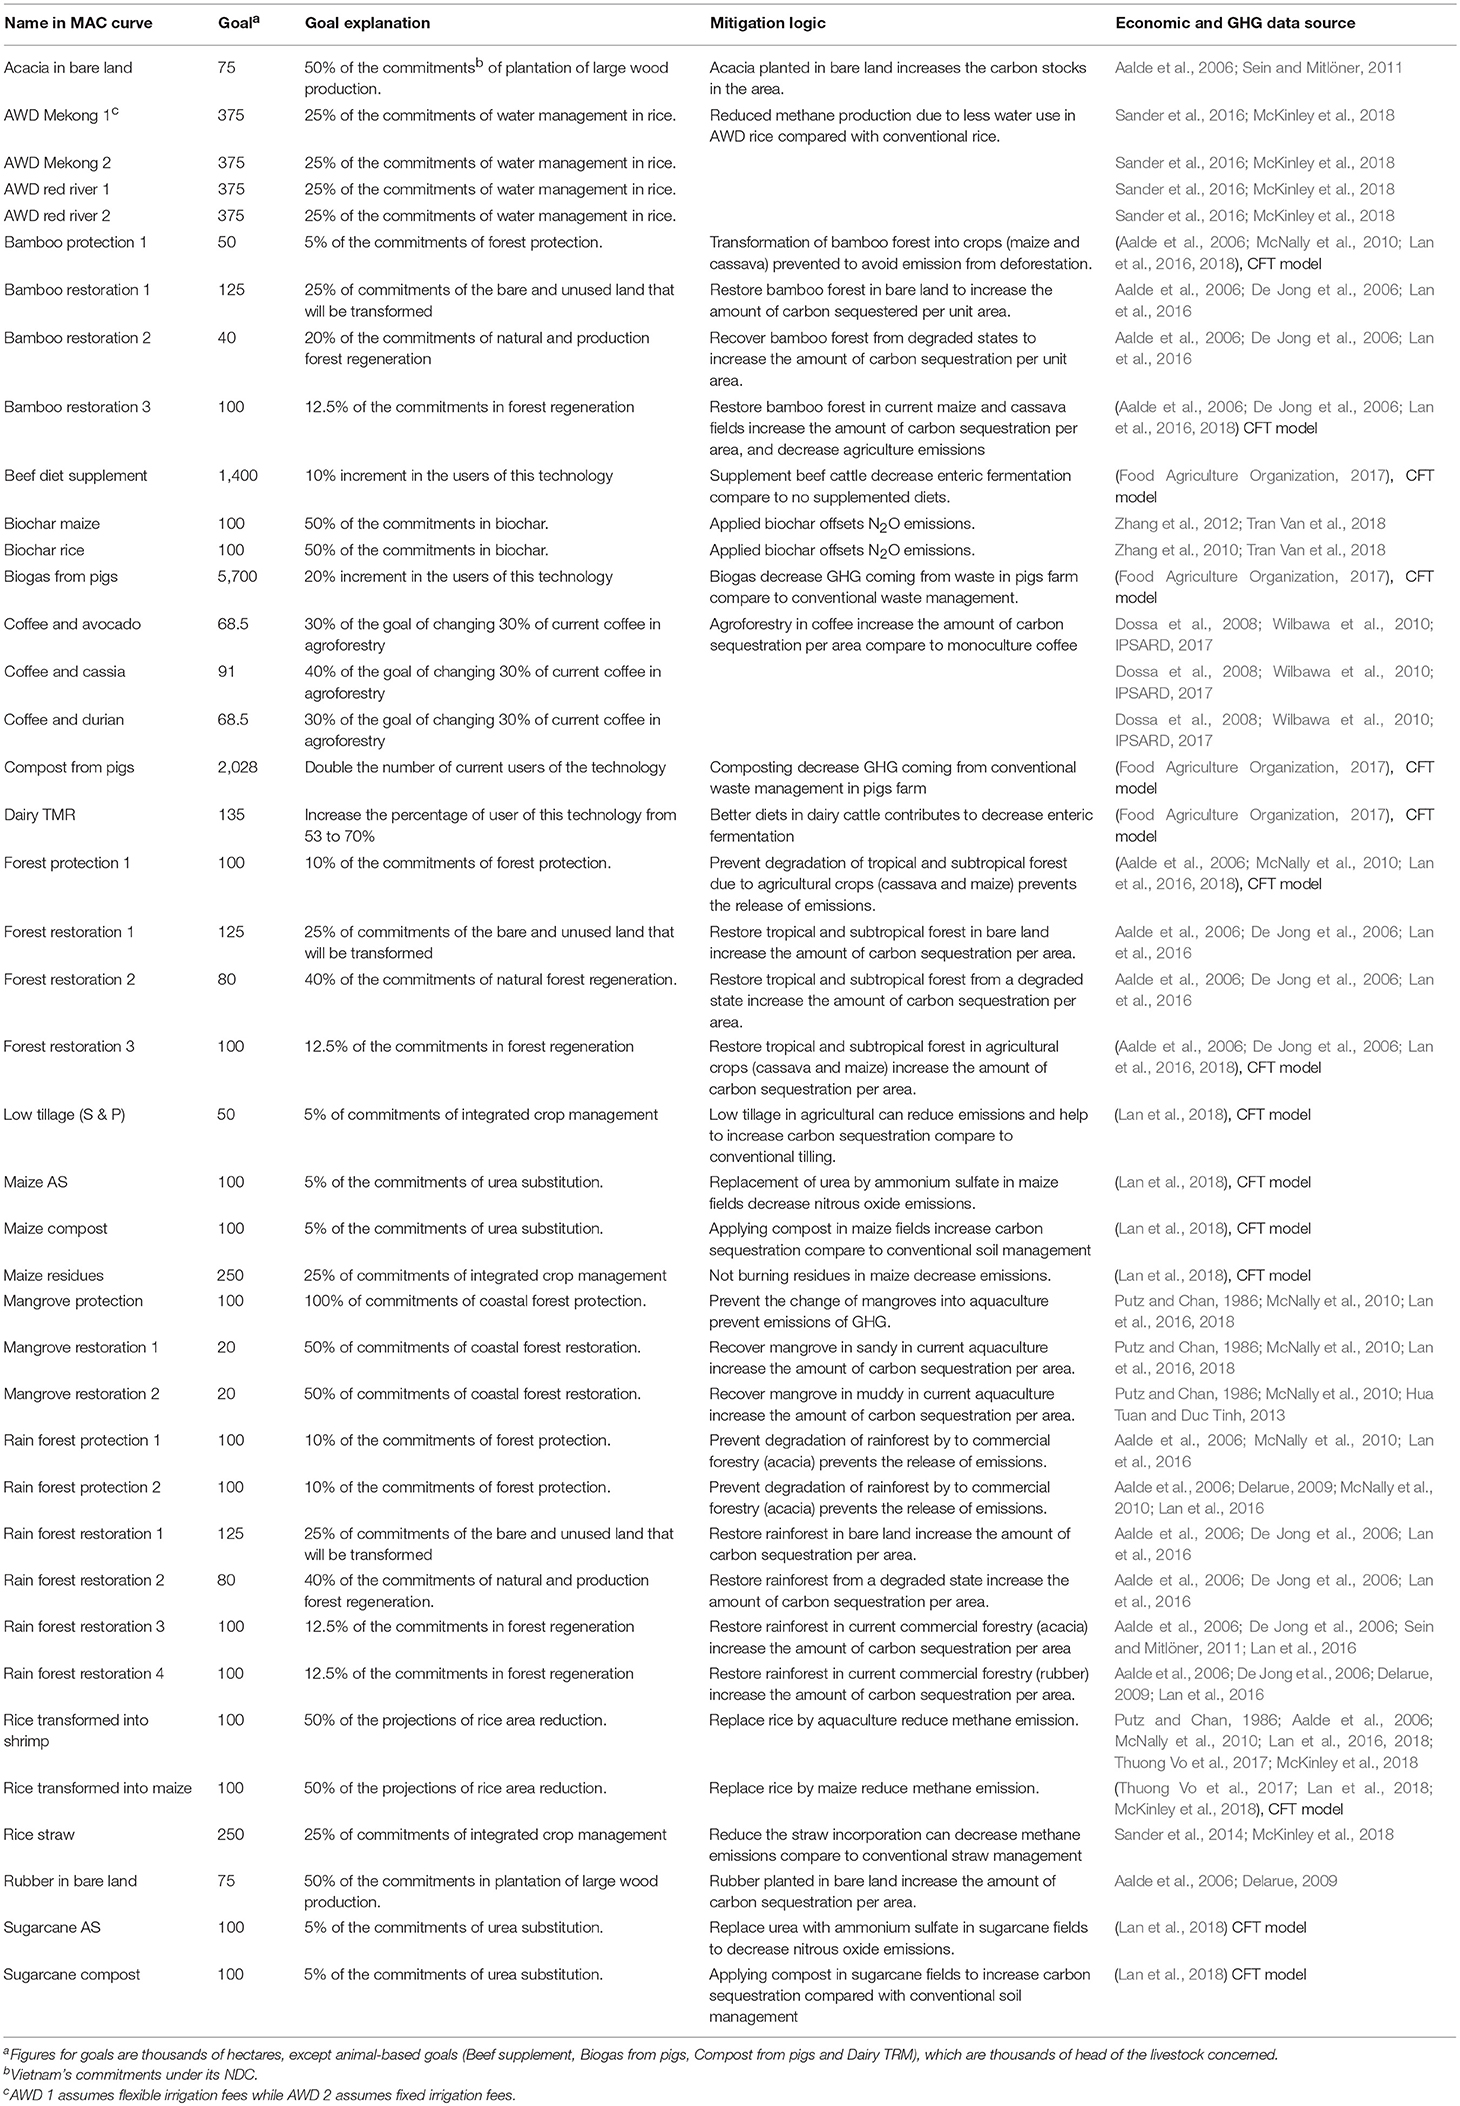
Table 1. Goals for each mitigation option used in generating a MAC curve for Vietnam's AFOLU sector.
Costs and Other Financial Data
A discount rate of 10%10 was used to calculate the net present value of the mitigation measures and an exchange rate of VND 22,000 for USD. We calculated incremental costs, including capital investment where relevant, for each mitigation measure as compared with the corresponding BAU scenario. We ignored hidden costs, such as transactional or environmental costs, which are difficult to estimate and for which there is few reliable data. We refined the cost estimates using financial data collected by international agricultural research institutes working in Vietnam11, together with relevant literature and expert opinions, and reviewed all potential options for mitigation available for Vietnam in the AFOLU sector without preconceived priorities. The sources of the financial data are listed in Table 1.
GHG Data
The information on available GHGs includes negative and positive fluxes from different activities and sources for each mitigation option. We converted CH4 and N2O into CO2eq by multiplying by 34 and 298, respectively (Myhre et al., 2013). The main sources of the GHG fluxes in the AFOLU sector were biomass, soil carbon, organic degradation, enteric fermentation and fertilizer. Emissions from energy production were excluded for the purpose of this study but all the information regarding GHG emissions, regardless of source, was made to be consistent across BAU scenarios and mitigation measures. In addition, the GHG emissions were cumulated across the whole period. We used online searches to identify published literature for the estimations of GHG fluxes. Where necessary, we supplemented these with default values from the IPCC guidelines for national GHG inventories from 2006 and the CoolFarmTool (CFT) model.
Mitigation Goals
It is worth noting that the mitigation measures analyzed do not achieve their targets (Table 1) immediately but reach them progressively, which reduces the total amount of mitigation in the short term. Moreover, most of the mitigation options that were assessed had no feasibility assessments on their adoption potential. The adoption target of each mitigation measure is therefore difficult to assess. Most mitigation goals are the commitments taken from Vietnam's NDC12, which were based on the aspirational goals of local experts documented in the NDC technical reports.
Calculation of Cost Effectiveness and Total Mitigation Potential
We calculated the incremental cost-effectiveness of each mitigation option by subtracting its economic fluxes from the economic fluxes of its BAU scenario equivalent. Total net value of i options during the jth year of the period (NVj) is given by:
Where m is the mitigation option, b is its BAU scenario, I is income and C is cost
Similarly, we calculated the changes in GHG fluxes of each mitigation option by subtracting the net fluxes of the option from the net fluxes of its BAU scenario. The total change in net fluxes of i options during the jth year of the period (NGj) in CO2eq is given by:
Where m is the mitigation option, b is its BAU scenario, E is emissions and A is absorptions.
We calculated both NV and NG on the basis of reference units, either area (ha) or per head for animal-based options, of which there are X units in year j. Total net value and total GHG fluxes of each mitigation option are therefore the their net values (NV) and (NG), multiplied by the number of reference units for each of the j years within the period (Xj). In the case of the financial fluxes, we calculated their NPV using a discount rate of 10%. The total net value (NPV) and total net GHG fluxes (NGT) are given by:
Only options that generate positive NGT in the analysis were considered so that the total mitigation potential excludes options that have negative NGT. Cost-effectiveness (CE) of each mitigation option is given by:
Results
MAC Curve
We created the MAC curve (Figure 2) using 22 mitigation measures for agriculture and 19 for FOLU. The main results are summarized in Table 2. The cumulative mitigation potential from 2020 to 2030 of these 41 options is 405.3 Mt CO2eq (40.5 Mt CO2eq/year) of which FOLU contributes about 73%. This is comparable, for instance, to 51% of the total emissions projected for Vietnam by 2030 under the BAU scenario in country's NDC. The outcomes of BAU and future projections of the mitigation scenario in Vietnam's NDC are only detailed for 2020 and 2030 with no information for the years between. Therefore, we cannot provide a year-by-year comparison between the mitigation potential of the options used in this study and those from the mitigation scenario in Vietnam's NDC.
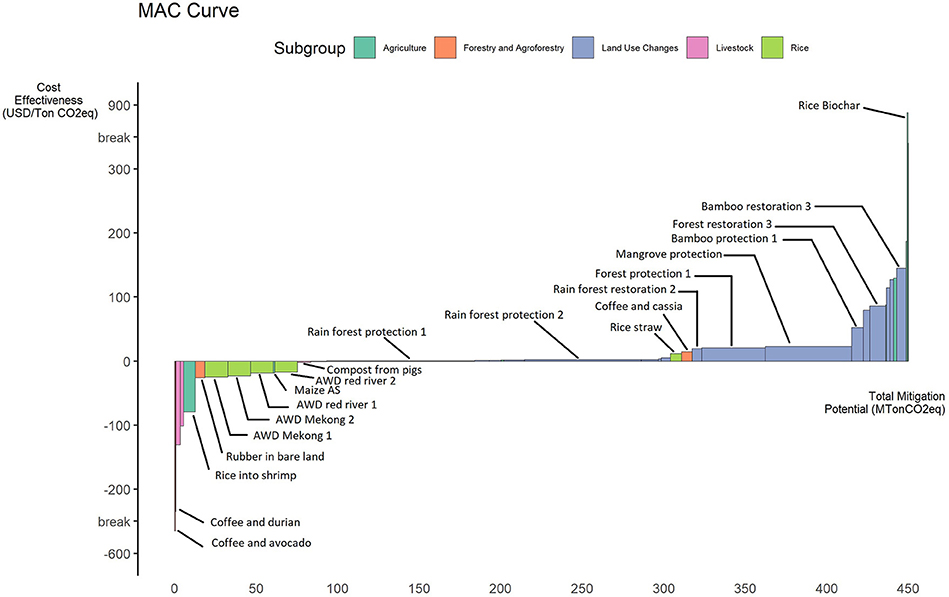
Figure 2. Marginal abatement cost curve for the AFOLU sector in Vietnam.
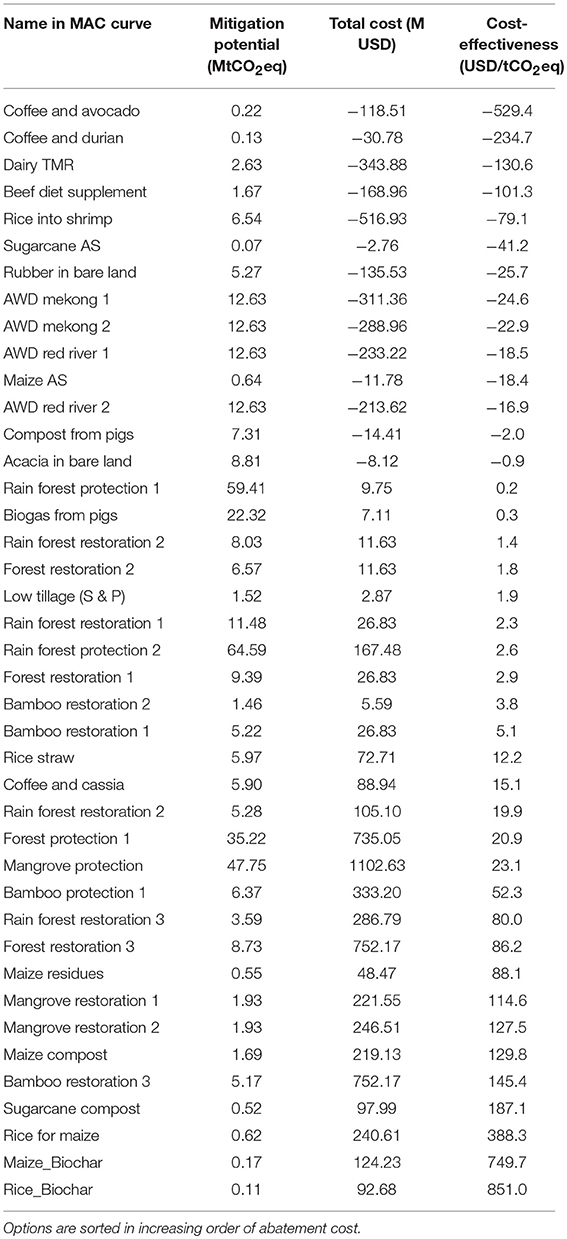
Table 2. Mitigation potential and total costs for mitigation options in the AFOLU sector analyzed for possible inclusion in Vietnam's revised NDC.
The least costly option is the intercropping of coffee and avocado at a marginal cost of -USD529.43/tCO2eq and total mitigation potential of 0.22 MtCO2eq, whereas the most expensive option is biochar in rice at a marginal cost of USD851/tCO2eq and a mitigation potential of 0.11 MtCO2eq. The difference between these two options amounts to USD1380.4/tCO2eq while the standard deviation within the options analyzed is USD215/tCO2eq. The option identified with the highest mitigation potential is rainforest protection 2 (i.e., tropical rainforest protected against acacia plantations driven deforestation) with 64.59 MtCO2eq. Sugarcane AS13 on the other hand, was found to be the option with the lowest mitigation potential at 0.07 MtCO2eq. The standard deviation of the mitigation potential within the options analyzed is 15.15 MtCO2eq.
The options analyzed can be grouped in five subgroups: agriculture, forestry and agroforestry, land use changes, livestock, and rice. Total mitigation potential and average marginal costs vary significantly between the different subgroups. Agriculture has a total mitigation potential of 12.31 MtCO2eq at an average marginal cost of USD156.25/tCO2eq. Forestry and agroforestry has a total mitigation potential of 20.23 MtCO2eq at an average marginal cost of -USD155.12/tCO2eq. Land use changes has a total mitigation potential of 282.14 MtCO2eq at an average marginal cost of USD40.58/tCO2eq. Livestock has a total mitigation potential of 33.94 MtCO2eq at an average marginal cost of -USD58.38/tCO2eq. Rice has a total mitigation potential of 56.61 MtCO2eq at an average marginal cost of USD130.05/tCO2eq.
Negative Marginal Cost14 of Options
In the MAC analysis there are 14 mitigation options whose marginal costs are negative. Their total mitigation potential is 83.8 MtCO2eq with an average marginal cost of USD89.01/tCO2eq but the total benefit of these options with negative marginal costs is equivalent to USD2.3 billion. These mitigation options include converting crops to agroforestry, alternate wetting drying (AWD) in rice, replacing urea fertilizer with ammonium sulfate and with manure and diet management in cattle and pigs. Converting bare land to commercial forestry also has negative marginal cost, but involves doubtful assumptions, which we address in the discussion.
Intercropping of coffee with avocado and durian has mitigation potentials of 0.22 MtCO2eq and 0.13 MtCO2eq, respectively with marginal costs of -USD529.43/tCO2eq and -USD234.65/tCO2eq. We also costed intercropping coffee with cassia, but its marginal cost was not negative (USD15.07/tCO2eq) within the 10-year timeframe we used. Agroforestry also gives ecosystem services (Lin, 2007; Shibu, 2009), which are not yet included in the analyses and could make them economically more attractive.
In livestock, feeding dairy cows with total mixed ration (TMR) has a mitigation potential of 2.63 MtCO2eq at a marginal cost of -USD130.73/tCO2eq for a total benefit of USD343M. Whereas, supplementing the diets of beef cattle has a mitigation potential of 1.67 MtCO2eq at a marginal cost of -USD101.9/tCO2eq, for a total benefit of -USD168M. Although the composting pig manure has a mitigation potential of 7.3 MtCO2eq at marginal cost of USD1.97/tCO2eq, there are important barriers in scaling this measure. Farmers have reported difficulties operating compost practices and limited demand for compost from farmers for crop production (Food Agriculture Organization, 2017).
AWD in the Mekong Delta has a mitigation potential of 25.27 MtCO2eq at a marginal cost of about USD23.7/tCO2eq. In the Red River Delta, the mitigation potential of AWD is comparable but the marginal cost is different at -USD17.6/tCO2eq. The fees applied to irrigation water affects the overall cost-effectiveness of AWD. If higher fees make water costly, AWD is more cost-effective which increases the likelihood of adoption among farmers.
Mitigation Options for FOLU
There are five options for mitigation related to avoiding deforestation but they are dependent on the type of forest and factors driving deforestation. The total mitigation potential of the five equates to 213 MtCO2eq with an average cost of USD19.8/tCO2eq. The cost-effectiveness of each option is determined by the profitability of the economic activities that drive land use change (e.g., shrimp farming, acacia plantations) and the carbon contained in the forest they replace (e.g., bamboo, rainforest). Forests also provide important ecosystem services, which are however rarely accounted for in MAC analyses (Kremen et al., 2000; Ricketts et al., 2004).
Because rainforests contain large amounts of carbon, the two options to protect them provide high mitigation potentials (123.9 MtCO2eq) at low cost (<USD3/tCO2eq). Protecting rainforest is cost effective, even when the drivers of deforestation are commercial plantations with high biomass. Another option with high mitigation potential (47.71 MtCO2eq) is mangrove protection, but the marginal costs are relatively high (USD23/tCO2eq). This is because the BAU scenario of deforested mangroves is shrimp farming, which is highly profitable. Nevertheless, there are multiple co-benefits of mangrove forest such coastal protection, reduced coastal erosion, and soil build up, which are not included in our analysis and could increase substantially the benefits of mangrove protection (Grosjean et al., 2016).
Mitigation Options in Agriculture
Replacing rice with maize could abate 0.62 MtCO2eq, but because rice is more profitable than maize, the replacement costs amount to USD388.2/tCO2eq. Replacing synthetic fertilizer with compost in sugarcane and maize is also costly, USD187.14/tCO2eq and USD129.8/tCO2eq, respectively, whereas applying biochar in maize and rice has an abatement potential of 0.17 and 0.11 MtCO2eq at a cost of USD749/tCO2eq and USD 851/tCO2eq. Finally, the management of rice straw has an abatement potential of 5.9 MtCO2eq but costs USD12.81/tCO2eq because it is more labor intensive. There are however low-cost mitigation options in agriculture such as minimum tillage in sugarcane, peanut and other crops, which can abate 1.52 MtCO2eq at a cost of USD1.88/tCO2eq.
Discussion
Conceptual Limitations of the Mitigation Options in Vietnam's NDC
NDCs globally should be strengthened as countries respond to the limitations in their initial submissions (Keohane and Oppenheimer, 2016; Höhne et al., 2017). The technical report that informed Vietnam's NDC in the AFOLU sector had conceptual limitations that could affect the country's carbon accounting and the transparency of subsequent decisions. We therefore use a MAC curve to provide some examples in which Vietnam's NDC could be modified and strengthened.
Vietnam's NDC includes two mitigation options on forest protection, one that protects 1 Mha of forest using domestic resources and the other protecting of 2.2 Mha of forest with international support. Yet the BAU scenario shows no projected emissions due to deforestation nor degradation of 3.2 Mha of forest. As a result, these mitigation options are not additional to the BAU projections under UNFCCC reporting guidelines15. These measures (USD0.66/tCO2eq and USD0.70/tCO2eq) however represent 69.5% of the combined abatement potential calculated for the AFOLU sector in Vietnam's NDC. This shows that the BAU scenarios in Vietnam's NDC need further review.
Vietnam's NDC BAU describes a matrix of future land uses based on assumptions that need to be reassessed. When one land use category increases, another one simultaneously decreases as land is mostly a finite resource. Most of the expansion of agricultural land has been so far at the expenses of natural land like forest and grasslands. Vietnam's NDC projects that the land area used by agriculture and forested land will increase by 223,800 and 372,586 ha, respectively, and the area of unused land will decrease by 561,000 ha. It is not clear, however, what is included in the land classified as unused, nor what the properties are of its soil and vegetation, as it is a national administrative classification and not defined by the Aalde et al. (2006) guidelines (Aalde et al., 2006). These properties are essential to estimate the GHG trade-offs when land is converted to other uses. The 1.5 Mha of land classified as unused in the technical report of Vietnam's NDC does not appear to be either eroded land or land without vegetation cover (ESA CCI Land Cover, 2017).
Vietnam's NDC targets the adoption of improved cattle diets to the whole national herd, which is a strong assumption given the challenges often encountered in scaling technologies (Tarawali et al., 2011). Nevertheless, the cattle subsector will be key to reduce future growth of emissions, although lack of data can be a major limitation to guide decision-making. Vietnam's NDC foresees that emissions from cattle will grow 62% between 2010 and 2030. A recent analysis (Springmann et al., 2018) expects emissions from the cattle subsector to grow faster than the others in the agriculture sector and could represent 27% of total agriculture emissions by 2030.
Differences Between the MAC Curves and Important Assumptions for Decision Making
Comparing the MAC curve above (Figure 2) with the technical reports of Vietnam's NDC16, we draw several conclusions. First, Vietnam's NDC does not include agroforestry17, which we show has substantial potential for mitigation at negative or low marginal cost. Vietnam has a dynamic forestry sector (FAO, 2009) which could facilitate the implementation of agroforestry. We considered agroforestry only for the coffee sector due to data constraints, but it could likely be extended to other areas and therefore have a higher mitigation potential.
Secondly, we estimate the abatement potential of AWD in rice to be over five times greater than in the NDC. We also find that implementing AWD has a negative marginal cost of USD21.4/tCO2eq compared with a positive marginal cost of USD91/tCO2eq in the NDC technical report for agriculture. Our estimates are based on AWD being more profitable than conventional paddy rice. The overall net benefit of AWD adoption depends on the impacts of two opposing forces. On one hand, the costs of production can increase as a result of higher labor for manual weeding and herbicide expenditures (Kürschner and Henschel, 2010; Rahman, 2015). On the other hand, AWD can reduce water consumption by as much as 35% (Lampayan et al., 2015), which can decrease production costs either directly through water fees or indirectly through fuel costs to run irrigation pumps (Alam et al., 2009; Kürschner and Henschel, 2010; Karim et al., 2014). In our analysis, we considered only on-farm costs and ignored institutional and infrastructure costs, which may explain some of the difference compared with the NDC technical report. These can substantially affect the estimated cost-effectiveness of any mitigation option. We note that the costs used in the technical report of Vietnam's NDC are not explicitly defined.
We concluded that the cost-effectiveness of agricultural technologies such as managing crop residues or integrated crop management differ depending on the crop, technology, and region. Vietnam's NDC, however, estimates a positive marginal cost of USD30/tCO2eq for all crops although it is not clear what costs are included. We find for instance that the marginal cost of replacing urea fertilizer with ammonium sulphate in sugarcane and maize is negative, though more profitable in the case of sugarcane due to higher inputs of nitrogen. Also, we show differences of USD75.9/tCO2eq between residue management in rice and maize and USD57/tCO2eq between compost in sugarcane and maize. Likewise, we provide evidence that AWD in rice is more cost-effective in the Mekong Delta than in the Red River. As a result, aggregating data across crops or regions for a specific technology gives an unintended stimulus to one at the expense of the other. Further disaggregation of technologies, both for crops and geographical areas, is therefore necessary to improve decision-making.
The MAC curve of Vietnam's NDC and the one above (Figure 2) both agree that aggregated measures to protect forests have marginal costs less than USD3/tCO2eq and high abatement potential within the AFOLU sector. Nevertheless, there are differences when we disaggregate the data by type of forest and land use following deforestation. There are further differences in the cost-effectiveness of measures like mangrove protection. Vietnam's NDC estimates a marginal cost of USD0.95/tCO2eq compared with our estimate of USD23/tCO2eq, which uses a BAU scenario of profitable shrimp farming. It is therefore important to study other forest protection measures that integrate different types of managements and could impact the profitability of these mitigation options. Communal forest or sustainable integration of aquaculture and mangrove ecosystems could be interesting options (Klooster and Masera, 2000; Primavera, 2005). Nevertheless, the lack of data prevented us to integrate these measures into our MAC curve. It is worth highlighting that Vietnam has established a scheme for Payment for Forest Environmental Services (PFES). The way the PFES resources are integrated into the mitigation commitments and implementation could affect the cost-effectiveness of measures related to forest protection and restoration. Moreover, our data confirms that it is essential that the BAU scenario is as realistic as possible because of the large effect BAU scenario has on the marginal cost of the proposed option. We believe that to improve its NDC, Vietnam needs to refine its BAU scenarios of land uses changes further and to better define the forest categories included in the analysis. For interpreting the results and discrepancies between different MAC curves it is important to remember that the choice of input data is crucial. Our sources of input data are listed in Table 1 and might differ from the input data of the technical report the NDC of Vietnam is based on.
Limitations of MAC Curves for Decision Making Regarding Mitigation Policy
As applied here, MAC curves are used to assess the economic trade-offs required for a nation to reach a specific level of GHG emission. They contribute to understanding the complex balance between mitigating climate change and economic development and to putting priorities on mitigation options (Huang et al., 2016). They are not without limitations, however, and this requires caution in interpreting their results when they are used to inform decision-making.
The MAC curve is static, which makes it impossible to assess how applying one mitigation measure can affect the cost and mitigation potential of other mitigation measures (Kesicki and Strachan, 2011). Nor is it possible to take account of intertemporal and intersectoral interactions, which also can affect the cost and mitigation potential of other measures (Kesicki and Strachan, 2011). Another important challenge is to make sure that the data include all the cost of a mitigation measure, including hidden or transaction costs, such as technical and institutional barriers, which are seldom available (Garg et al., 2014).
The method applied to rank the data used to generate the MAC curves is important. We ranked measures from lower marginal cost-effectiveness to higher, but options with negative marginal cost-effectiveness may give irrational results 18 (Ward, 2014). Furthermore, MAC curves focus solely on the economic value of GHG fluxes and ignore environmental and socioeconomic factors, which can be relevant to making policy decisions. For example, they do not consider biodiversity, water use, economic equality (Kesicki and Ekins, 2012), or the array of ecosystem services that the AFOLU sector provides (Power, 2010). Failing to consider them can have detrimental effects. Other conceptual frameworks, like climate smart agriculture (CSA), have been proposed to guide agricultural development with consideration to other elements like adaptation to climate change (Lipper et al., 2014)19. As a result, a MAC curve can provide useful information to improve decision-making. However, it cannot be used as a standalone decision tool, particularly in the agriculture sector where building resilience and adapting to climate change is key.
Conclusions and Recommendations
The revision process of national NDCs is crucial to reach the goals set under the Paris Agreement. It can also enhance decision-making and priority-setting regarding climate change policy. This study highlights the importance of constant data refinement regarding the mitigation options considered in the NDCs, with particular importance to those of developing countries and their AFOLU sectors, where data scarcity is more pronounced. This study found that Vietnam specifically could benefit from improved forestry data and refined BAU scenarios. Although the MAC curve did not rank forest protection and restoration as high priority because of their positive marginal cost, the study identified them as having the largest mitigation potential. Overall, better projections of BAU is important to improve the consistency of Vietnam's NDC.
In addition, the disaggregation of technologies shows important differences between the same technology applied to different crops. Further technological disaggregation should therefore take account of regional differences to improve climate change policy and the country's decision making. It is also important to perform a sensitivity analyses of dynamic variables such as fertilizers prices and labor to understand how the cost-effectiveness of different options might respond to different market conditions.
The study also highlights promising options with low positive or negative marginal cost, which could help Vietnam achieve its NDC commitments. Relevant technologies in agriculture such as AWD in rice have high abatement potential and, in the livestock sector, offer high abatement potential with low or negative marginal cost. Given current trends, the livestock subsector will play an important role in future emissions from Vietnam's AFOLU sector, with ruminants being the main emission source while limited feasible mitigation options currently exist. Finally, we show that agroforestry has a cost-effective mitigation potential that justifies consideration in Vietnam's NDC.
Author Contributions
DE, GG, PL, TN, BS, JM, LS, and JT wrote the paper and designed research. DE, GG, TN, BS, and JM performed research and analyzed data.
Funding
This work was implemented as part of the CGIAR Research Program on Climate Change, Agriculture and Food Security (CCAFS), which is carried out with support from the CGIAR Trust Fund and through bilateral funding agreements. For details please visit https://ccafs.cgiar.org/donors. We are thankful to USAID for providing funding for data collection for rice related mitigation options. The position of GG at CIAT has been partly funded by the German development cooperation Centre for International Migration and Development. The position of BS at IRRI has partly been funded by the Climate and Clean Air Coalition (CCAC). The views expressed in this document cannot be taken to reflect the official opinions of these organizations.
Conflict of Interest Statement
The authors declare that the research was conducted in the absence of any commercial or financial relationships that could be construed as a potential conflict of interest.
Acknowledgments
The authors would like to express their gratitude to the reviewers for their valuable comments and to Myles Fisher and John Hildebrand for their support in editing the text. We are also thankful to Kien Tri Nguyen for his support with the graphs in this paper.
Supplementary Material
The Supplementary Material for this article can be found online at: https://www.frontiersin.org/articles/10.3389/fsufs.2019.00014/full#supplementary-material
Footnotes
1. ^Named for the Fijian custom for avoiding conflict in resolving disputes.
2. ^Made up of the Agriculture subsector and the Forestry and Land Use sector.
3. ^Emissions from agriculture depend on local soil, management and climate. The underlying processes are complex (Vermont and De Cara, 2010).
4. ^The reviewing process in Vietnam it was already ongoing by the date this paper was written.
5. ^In their NDCs developing countries usually identified separately targets that do not depend on foreign aid from more ambitious ones that do depend on international support.
6. ^We define Southeast Asia as the region that includes Brunei, Cambodia, Indonesia, Laos, Malaysia, Myanmar, Philippines, Singapore, Thailand, and Vietnam.
7. ^Including Forest and Other Land Uses sector (FOLU).
8. ^Vietnam's NDC mitigation agriculture options: Biogas, agricultural residues (I), agricultural residues (II), AWD (I), AWD (II), Biochar (I), Biochar (II), integrated management of rice, integrated management of crops, substitution of urea fertilizer, cattle diets, improve aquaculture, improve waste in aquaculture, food processing, and waste treatment and irrigation in coffee production. (I) means with national effort and (II) means with international support.
9. ^Vietnam's NDC mitigation FOLU options: Protection of natural forest (I), protection natural forest (II), protection of coastal forest (I), protection of coastal (II), plantation of coastal forest, natural forest regeneration, natural forest assisted regeneration, plantation of production forest, and natural and production forest assisted regeneration.
10. ^Other authors have also used a discount rate of 10% in similar studies in Vietnam (Nguyen and Ha-Duong, 2009).
11. ^International Center for Tropical Agriculture (CIAT), International Rice Research Institute (IRRI), and Institute of Policy and Strategy for Agriculture and Rural Development (IPSARD).
12. ^The abatement goal for coffee agroforestry, which is not included in Vietnam's NDC technical documents, is based on official goals for recuperating degraded plantations.
13. ^AS stands for Ammonium Sulphate.
14. ^Negative marginal cost is when a proposed option cost less than the current BAU practice.
15. ^“Additionality is a determination of whether a proposed activity will produce some ‘extra good’ in the future relative to a reference scenario” (Gillenwater, 2012).
16. ^The cost-effectiveness analysis done for the AFOLU sector done in Vietnam to support the NDC can be found in the Supplementary Material.
17. ^NDC are currently being revised however and agroforestry appears to be likely to be taken into consideration as of 15 Nov 2018. Our paper therefore provides additional supporting evidence to this decision-making process.
18. ^Take a hypothetical example where there are two mitigation options each with the same negative marginal cost of USD1000. One of them mitigates 1 tCO2eq, while the other mitigates 1000 tCO2eq. The MAC curve would prioritize the one that mitigates the less because its cost effectiveness would be -USD1000/tCO2eq while the other that mitigates more would have a cost effectiveness of -USD1/tCO2eq.
19. ^A table with adaptation benefits of the options studied can be found in the Supplementary Material.
References
Aalde, H., Gonzales, P., Gytarsky, M., Krug, T., Kurz, T., Ogle, S., et al. (2006). 2006 IPCC Guidelines for National Greenhouse Gas Inventories: Chapter 4: Forest Land. Cambridge: Cambridge press.
Alam, M., Islam, M., Salam, M., and Islam, M. (2009). Economics of alternate wetting and drying method of irrigation: evidences from farm level study. Agriculturists 7, 82–95. doi: 10.3329/agric.v7i1.5258
Asian Development Bank (2009). The Economics of Climate Change in Southeast Asia: A Regional Review. Metro Manila: Asian Development Bank.
Briner, G., and Moarif, S. (2016). Unpacking Provisions Related to Transparency of Mitigation and Support in the Paris Agreement. Paris: OECD.
De Jong, W., Van Hung, T., and Dihn, S. D (2006). Forest Rehabilitation in Vietnam: Histories, Realities and Future. Jakarta: Center for International Forestry Research (CIFOR).
Deprez, A., Colombier, M., and Spencer, T. (2015). Transparency and the Paris Agreement: Driving Ambitious Action in the New Climate Regime. Paris: Working Papers N°03/15, IDDRI.
Dossa, E., Fernandes, C., and Reid, W. E. (2008). Above- and belowground biomass, nutrient and carbon stocks contrasting an open-grown and a shaded coffee plantation. Agroforestry Syst. 72:117. doi: 10.1007/s10457-007-9075-4
Edenhofer, O., Pichs-Madruga, R., Sokona, Y., Kadner, S., Minx, J., Brunner, S., et al. (2014). “Technical summary,” in Climate Change 2014: Mitigation of Climate Change. Contribution of Working Group III to the Fifth Assessment Report of the Intergovernmental Panel on Climate Change (Cambridge: Cambridge University Press).
Eory, V., Pellerin, S., Garcia, G., Lehtonen, H., Licite, I., Mattila, H., Lund-Sørensen, T., et al. (2018). Marginal abatement cost curves for agricultural climate policy: state-of-the art, lessons learnt and future potential. Cleaner Product. 182, 705–716. doi: 10.1016/j.jclepro.2018.01.252
Food and Agriculture Organization (2017). Feasibility Assessment of a Livestock-IFES NAMA Program to Support Implementation of the Nationally Determined Contribution (NDC) in Vietnam. Hanoi: Food and Agriculture Organization.
Garg, A., Shukla, P., Maheshwari, J., and Upadhyay, J. (2014). An assessment of household electricity load curves and corresponding CO2 marginal abatement cost curves for Gujarat state, India. Energy Policy 66, 568–584. doi: 10.1016/j.enpol.2013.10.068
Gillenwater, M. (2012). What is Additionality? Part 1: A Long Standing Problem. Discussion Paper. New Jersey, NJ: GHG Management institute. Princeton University.
Griscom, B., Adams, J., Ellis, P., Houghton, R., Lomax, G., and Miteva, D. A. (2017). Natural climate solutions. Proc. Natl. Acad. Sci. U.S.A. 114, 11645–11650. doi: 10.1073/pnas.1710465114
Grosjean, G., Fuss, S., Kock, N., Bodirsky, B., De Cara, S., and Acworth, W. (2018). Options to overcome the barriers to pricing European agricultural emissions. Clim. Policy 18, 151–169. doi: 10.1080/14693062.2016.1258630
Grosjean, G., Monteils, F., Hamilton, S. B.-R., Talsma, T., Bourgoin, C., Sebastian, L. C., et al. (2016). Increasing Resilience to Droughts in Vietnam; The Role of Forests, Agroforests and Climate Smart Agriculture. Hanoi: CCAFSCIAT-UN-REDD.
Höhne, N., Kuramochi, T., Warnecke, C., Röser, F., Fekete, H., Hagemann, M., Day, T., et al. (2017). The Paris Agreement: resolving the inconsistency between global goals and national contributions. Climate Policy 17, 16–32. doi: 10.1080/14693062.2016.1218320
Hua Tuan, T., and Duc Tinh, B. (2013). Cost–Benefit Analysis of Mangrove Restoration in Thi Nai Lagoon, Quy Nhon City, Vietnam. Hanoi: Asian Cities Climate Resilience.
Huang, S., Kuo, L., and Chou, K. (2016). The applicability of marginal abatement cost approach: a comprehensive review. J. Cleaner Product. 127, 59–71. doi: 10.1016/j.jclepro.2016.04.013
Karim, M., Alam, M., Ladha, J., Islam, M., and Islam, M. (2014). Effect of different irrigation and tillage methods on yield and resource use efficiency of Boro rice (Oryza sativa). Bangl. J. Agril. Res. 39, 151–163. doi: 10.3329/bjar.v39i1.20165
Keohane, R., and Oppenheimer, M. (2016). Paris: beyond the climate dead end through pledge and review? Polit. Gover. doi: 10.17645/pag.v4i3.634
Kesicki, F., and Ekins, P. (2012). Marginal abatement cost curves: a call for caution. Clim. Policy. doi: 10.1080/14693062.2011.582347
Kesicki, F., and Strachan, N. (2011). Marginal abatement cost (MAC) curves: confronting theory. Environ. Sci. Policy 14, 1195–1204. doi: 10.1016/j.envsci.2011.08.004
Klooster, D., and Masera, O. (2000). Community forest management in Mexico: carbon mitigation and biodiversity conservation through rural. Glob. Environ. Change. 10, 259–272. doi: 10.1016/S0959-3780(00)00033-9
Kremen, C., Niles, J. O., Dalton, M. G., Daily, G. C., Ehrlich, P. R., Fay, J. P., et al. (2000). Economic incentives for rain forest conservation across scales. Science 288, 1828–1832. doi: 10.1126/science.288.5472.1828
Kunreuther, H., Gupta, S., Bosetti, V., Cooke, R., Dutt, V., Ha-Duong, M., et al. (2014). “Integrated risk and uncertainty assessment of climate change response policies,” in Climate Change 2014: Mitigation of Climate Change. Contribution of Working Group III to the Fifth Assessment Report of the Intergovernmental (Cambridge: Cambridge University Press).
Kürschner, E., and Henschel, C. (2010). Water Saving in Rice Production-Dissemination, Adoption, and Short Term Impacts of Alternate Wetting and Drying (AWD) in Blangladesh. Series of the Departament of Rural Development 241. Available online at: http://agriwaterpedia.info/images/1/16/SLE_(2010)_Water_Saving_in_Rice_Production.pdf
Lampayan, R., Rejesus, R., Singleton, G., and Bouman, B. (2015). Adoption and economics of alternate wetting and drying water management for irrigated lowland rice. Field Crops Res. 170, 95–108. doi: 10.1016/j.fcr.2014.10.013
Lan, L., Sain, G., Czaplicki, S., Guerten, N., Shikuku, K. M., Grosjean, G., et al. (2018). Farm-level and community aggregate economic impacts of adopting climate smart agricultural practices in three mega environments. PloS ONE 13:e0207700. doi: 10.1371/journal.pone.0207700
Lan, L., Whichelns, D., Milan, F., Hoanh, H. C., and Phuong, N. (2016). Household opportunity costs of protecting and developing forest lands in Son La and Hoa Binh Provinces, Vietnam. Int. J. Commons 10, 902–928. doi: 10.18352/ijc.620
Lin, B. (2007). Agroforestry management as an adaptive strategy against potential microclimate extremes in coffee agriculture. Agric. For. Meteorol. 144, 85–94. doi: 10.1016/j.agrformet.2006.12.009
Lipper, L., Thornton, P., Campbell, B., Baedeker, T., Braimoh, A., Bwalya, M., et al. (2014). Climate-smart agriculture for food security. Nat. Clim. Change 4, 1068–1072. doi: 10.1038/nclimate2437
McKinley, J., Quynh, V., Trinh, M., and Sander, O. (2018). Unpublished Raw Data: Household Survey Collected for USAID Low-Emission Development: Assessment of Low-Emissions Development Technologies and Practices for Rice Production in Bangladesh and Vietnam.
McNally, R., McEwin, A., and Holland, T. (2010). The Potential for Mangrove Carbon Projects in Vietnam. SNV.
Myhre, G., Shindell, D., Bréon, F., Collins, W., Fuglestvedt, J. H., Kock, D., et al. (2013). Climate Change 2013: The Physical Science Basis. Contribution of Working Group I to the Fifth Assessment Report of the Intergovernmental Panel on Climate Change (Cambridge: Cambridge University Press).
Nguyen, N. T., and Ha-Duong, M. (2009). “The potential for mitigation of CO2 emissions in Vietnam's power sector,” Fourth GMSARN International Conference: Energy Security and Climate Change Problems and Issues in GMS (Ha Long).
O'neill, J. (2011). The Growth Map: Economic Opportunity in the BRICs and Beyond. London: Penguin UK.
Power, A. (2010). Ecosystem services and agriculture: tradeoffs and synergies. Phil. Trans. R. Soc. B 365, 2959–2971. doi: 10.1098/rstb.2010.0143
Primavera, J. (2005). Mangroves, fishponds, and the quest for sustainability. Science 310, 57–59. doi: 10.1126/science.1115179
Putz, F., and Chan, H. (1986). Tree growth, dynamics and productivity in a mature mangrove forest in Malaysia. For. Ecol. Manag. 17, 211–230.
Rahman, M. (2015). Case Studies on Farmers' Perceptions and Potential of AWD in Two Districts of Bangladesh. Dhaka.
Ricketts, T. H., Daily, G. C., Ehrlich, P. R., Michener, C. D., Ricketts, T., Daily, G., et al. (2004). Economic value of tropical forest to coffee production. PNAS 101, 12579–12582. doi: 10.1073/pnas.0405147101
Robiou du Pont, Y., Jeffery, L., Gütschow, J., Rogelj, J., Christoff, P., and Meinshaussen, M. (2017). Equitable mitigation to achieve the Paris Agreement goals. Nat. Clim. Change,7, 38–43. doi: 10.1038/nclimate3186
Rogelj, J., den Elzen, M., Höhne, N., Fransen, T., Fekete, H., Winkler, H., et al. (2016). Paris agreement climate proposals need a boost to keep warming well below 2°C. Nature 534, 631–639. doi: 10.1038/nature18307
Sander, B., Samson, M., and Buresh, R. (2014). Methane and nitrous oxide emissions from flooded rice fields as affected by water and straw management between rice crops. Geoderma 235–236, 355–362. doi: 10.1016/j.geoderma.2014.07.020
Sander, B., Wassmann, R., and Siopongo, J. (2016). Mitigating greenhouse gas emissions from rice production through water-saving techniques: potential, adoption and empirical evidence. in Climate Change and Agricultural Water Management in Developing Countries,eds C. Hoanh, R. Johnston, and V. Smakhtin (Los Baños: International Rice Research Institute (IRRI)).
Schleussner, C., Rogelj, J., Schaeffer, M., Lissner, T., Licker, R., Fischer, E. K., et al. (2016). Science and policy characteristics of the Paris Agreement temperature goal. Nat. Clim. Change 6, 827–835. doi: 10.1038/nclimate3096
Sein, C., and Mitlöner, R. (2011). Acacia Hybrid: Ecology and Silviculture in Vietnam. Bogor: CIFOR.
Shibu, J. (2009). Agroforestry for ecosystem services and environmental benefits: an overview. Agrofor. Syst. 76, 1–10. doi: 10.1007/s10457-009-9229-7
Smith, P., Bustamente, M., Ahammad, H., Clark, H., Dong, H., Elsiddig, E. H., et al. (2014). “Agriculture, Forestry and Other Land Use (AFOLU),” in Climate Change 2014: Mitigation of Climate Change. Contribution of Working Group III to the Fifth Assessment Report of the Intergovernmental Panel on Climate Change (Cambridge: Cambridge University Press).
Springmann, M., Clark, M., Mason-D'Croz, D., Wiebe, K., Bodirsky, B. L., Lassaletta, L., et al. (2018). Options for keeping the food system within environmental limits. Nature 562, 519–525. doi: 10.1038/s41586-018-0594-0
Tarawali, S., Herrero, M., Descheemaeker, K., Grings, E., and Blümmel, M. (2011). Pathways for sustainable development of mixed crop livestock systems: taking a livestock and pro-poor approach. Livestock Sci. 139, 11–21. doi: 10.1016/j.livsci.2010.02.014
Thuong Vo, T., Wassmann, R., Tirol-Padre, A., Cao, V., MacDonald, B., Espaldon, M., et al. (2017). Methane emission from rice cultivation in different agro-ecological zones of the Mekong river delta: seasonal patterns and emission factors for baseline water management. Soil Sci. Plant Nutr. 64, 47–58. doi: 10.1080/00380768.2017.1413926
Tran Van, T., Mai Van, T., Loan, B. T., and Do, T. D. (2018). Cost and Benefit Analysis (CBA) and Farmer's Acceptability on Biochar. Hanoi: IPSARD.
Vermont, B., and De Cara, S. (2010). How costly is mitigation of non-CO2 greenhouse gas emissions from agriculture?: a meta-analysis. Ecol. Econ. 69, 1373–1386. doi: 10.1016/j.ecolecon.2010.02.020
Ward, D. (2014). The failure of marginal abatement cost curves in optimising a transition to a low carbon energy supply. Energy Policy 73, 820–822. doi: 10.1016/j.enpol.2014.03.008i
Wilbawa, A., Yuliasmara, F., and Erwiyono, R. (2010). Estimation of carbon stocks in coffee plantation in East Java. Pelita Perkebunan 26, 1–11. doi: 10.22302/iccri.jur.pelitaperkebunan.v26i1.118
Wollenberg, E., Richards, M., Smith, P., Havlík, P., Obersteiner, M., Tubiello, F. N., et al. (2016). Reducing emissions from agriculture to meet the 2°C target. Glob. Change Biol. 3859–3864. doi: 10.1111/gcb.13340
Yang, X., Teng, F., Xi, X., Khayrullin, E., and Zhang, Q. (2017). Cost-benefit analysis of China's Intended Nationally Determine Contributions based on carbon marginal cost curves. Appl. Energy 227, 415–425. doi: 10.1016/j.apenergy.2017.08.016
Zhang, A., Bian, R., Li, L., Wang, X., Zhao, Y., Hussain, Q., et al. (2010). Effect of biochar amendment on yield and methane and nitrous oxide emissions from a rice paddy from Tai Lake plain, China. Agric. Ecosyst. Environ. 139, 469–475. doi: 10.1016/j.agee.2010.09.003
Keywords: AFOLU, climate change mitigation, developing countries, marginal abatement cost curve, Nationally Determined Contribution, Vietnam
Citation: Escobar Carbonari D, Grosjean G, Läderach P, Nghia TD, Sander BO, McKinley J, Sebastian L and Tapasco J (2019) Reviewing Vietnam's Nationally Determined Contribution: A New Perspective Using the Marginal Cost of Abatement. Front. Sustain. Food Syst. 3:14. doi: 10.3389/fsufs.2019.00014
Received: 16 November 2018; Accepted: 25 February 2019;
Published: 10 April 2019.
Edited by:
Mario Herrero, Commonwealth Scientific and Industrial Research Organisation, Brisbane, AustraliaReviewed by:
Tek B. Sapkota, The International Maize and Wheat Improvement Center (CIMMYT), IndiaFrancisco Javier Solorio, Universidad Autónoma de Yucatán, Mexico
Copyright © 2019 Escobar Carbonari, Grosjean, Läderach, Nghia, Sander, McKinley, Sebastian and Tapasco. This is an open-access article distributed under the terms of the Creative Commons Attribution License (CC BY). The use, distribution or reproduction in other forums is permitted, provided the original author(s) and the copyright owner(s) are credited and that the original publication in this journal is cited, in accordance with accepted academic practice. No use, distribution or reproduction is permitted which does not comply with these terms.
*Correspondence: Daniel Escobar Carbonari, ZHNjb3ZhcjkwQGdtYWlsLmNvbQ==