 Juncheng Dai
 Yuanyuan Yan1
- 1PetroChina Southwest Oil and Gasfield Company, Chengdu, China
- 2Guizhou Zhongkai Transportation Construction Co., Ltd., Guiyang, China
Exploration and development of tight gas reservoirs are pivotal in augmenting oil and gas reserves and production. Tight sandstone reservoirs, characterized by intricate geological environments, nuanced physical property variations, substantial fluid heterogeneities, and ambiguous seismic rock physics responses, necessitate a departure from conventional isotropic reservoir sensitivity parameters. This study introduces an innovative lithofacies identification strategy and methodology grounded in anisotropic rock physics sensitivity parameters. The investigation revolves around 20 core samples from the fourth member of the Xujiahe Formation in Jianyang. A multi-scale approach, encompassing imaging logging, core analysis, porosity/permeability measurements, and cast thin section examinations, was employed to classify the samples into four distinct categories: dry and water-saturated pore types, alongside dry and water-saturated fractured pore types. Subsequently, an enhanced full-angle ultrasonic anisotropy testing system was utilized to conduct multi-directional acoustic wave measurements. The results revealed that gas-bearing fractured pore samples exhibit pronounced velocity and amplitude anisotropy, setting them apart from other lithofacies types. To quantify these distinguishing features, a rock physics template encompassing P-wave anisotropy (ε) and amplitude anisotropy (εA) parameters was established. By setting thresholds for ε and εA (>20%), the dry fractured pore lithofacies can be effectively discriminated. Moreover, leveraging the full-angle waveform similarity coefficient spectrum, we used a special parameter, εslow, for slowness anisotropy, along with its theoretical derivation. Notably, water-saturated pore types exhibited slowness anisotropy parameters consistently below 0.01. Integration of the (λρ-μρ) template and its thresholds (λρ < 60 & μρ < 30) further facilitated the selection and differentiation of all four lithofacies types. These research outcomes contribute significantly to advancing the prediction of tight sandstone reservoirs and fluid identification, offering a robust framework for future exploration endeavors.
1 Introduction
Tight sandstone gas reservoirs, with their significant exploitable reserves, are increasingly vital for enhancing natural gas storage and production capacities. They have become strategically important in the global oil and gas landscape (Zou, 2013; Zou et al., 2018; Sun et al., 2019; Liu et al., 2022; Jiang et al., 2023). Characterized by widespread distribution and large reserve volumes, China’s tight sandstone gas deposits have seen major advancements since the turn of the century, particularly with breakthroughs in exploration and development technologies. Notable discoveries include sizable tight sandstone gas fields in the Sulige Gas Field of the Ordos Basin and the Xujiahe Formation in the Sichuan Basin, marking significant progress in the exploration and exploitation of domestic tight sandstone gas resources. This has resulted in rapid annual growth in both proven reserves and output of tight sandstone gas, propelling China to become the world’s third-largest producer of tight gas (Jia et al., 2022; Zou et al., 2022). However, compared to conventional natural gas resources, tight sandstone reservoirs face challenges such as low porosity and permeability, complex lithology, high heterogeneity, and limited lateral continuity (Zou et al., 2013; Zhao et al., 2017; Zeng et al., 2021; Lv et al., 2021; Sun et al., 2022). These geological characteristics contribute to lower relative proven rates for China’s tight sandstone gas (Luguang, 2021), highlighting the need for intensified exploration and development of tight sandstone resources to reduce energy dependence and ensure energy security.
In response, the Southwest Oil & Gas Branch Company has stepped up its efforts to explore and develop tight gas in the Sichuan Basin. This includes a multi-layered, three-dimensional exploration approach along the slope belt, with the Jianyang area selected as a promising new block (Yang et al., 2024). The region offers favorable geological conditions for hydrocarbon accumulation, with significant natural gas discoveries in the Upper Triassic Xujiahe Formation (Tang et al., 2024). Wells like W1, TF101, and W104 have shown substantial gas flows, underscoring the area’s potential as a key site for future reserve upgrades and field development. However, deeper investigations during exploration have revealed substantial variation in gas accumulation between adjacent well locations. The production of individual wells often varies significantly, with the main influencing factors being sedimentary microfacies and fracture development (Lai et al., 2018; Lai et al., 2016; Wu et al., 2017). For instance, production testing at wells W102 and W104 showed stark differences, with W102 primarily producing water, while W104 yielded over 2 million cubic meters of gas per day (Wang et al., 2012). The presence of fractures can significantly improve the physical properties of tight sandstone reservoirs, while also providing effective migration pathways for the continuous charging of hydrocarbons from source rocks into the tight sandstone reservoirs (Camac and Hunt, 2009; Olson et al., 2009). Despite these successes, research on the Xujiahe Formation’s tight sandstones in the Jianyang area remains limited, focusing predominantly on aspects such as geochemical characteristics and origins of formation waters (Pang et al., 2023), deformational features and causes of structures (Zheng et al., 2024), variations in reservoir characteristics and mechanisms of premium reservoir formation (Yi et al., 2013; Zhao et al., 2013), as well as hydrocarbon generation and distribution patterns of reservoirs (Lan et al., 2023; Shen et al., 2005; Quakenbus et al., 2006). A notable scarcity persists of comprehensive and in-depth studies on geophysical reservoir prediction methodologies and fluid discrimination techniques, hindering precise predictions of gas-bearing properties and production capacities at varying well sites and stratigraphic intervals. Effective fluid identification is a pivotal component in reservoir prediction, heavily reliant on dependable fluid indicators for predicting reservoir gas content. Establishing clear rock physics response rules lays the foundation for developing effective fluid indicators, effectively reducing exploration risks and enhancing drilling success rates. Considerable theoretical and experimental researches have been conducted globally targeting fluid-sensitive parameters, encompassing the construction of highly sensitive composite fluid identification factors via discrepancies among triple-porosity curves and array sonic logs (Goodway et al., 1997; Sun et al., 2012; Feng et al., 2021; Bai et al., 2019); formulation of empirical relationships involving velocity-porosity, gas saturation-Poisson’s ratio, P-wave to S-wave velocity ratios-saturation, Russell fluid factor-gas-bearing status derived from rock physics experiment data and logging outcomes (Wang et al., 2018); and pre-stack reservoir prediction and fluid identification research anchored on seismic rock physics parameter analyses utilizing logging and seismic data (Carcione and Avseth, 2015; Chen et al., 2018; Chen et al., 2020; Guo et al., 2022). Nonetheless, preliminary drilling and logging studies indicate that reservoir types in the fourth member of the Xujiahe Formation in the Jianyang area can be categorized into porous and fracture-porous varieties, with average porosity around 8%. These reservoirs display minimal variation in petrophysical properties, yet are significantly influenced by complex fracture characteristics and varying fluid saturations, leading to ambiguous seismic rock physics responses. Consequently, traditional reservoir sensitivity parameters and fluid identification factors, which were developed under isotropic assumptions, are no longer applicable. Considering that fractures' formation and evolution are governed by anisotropic stress fields, fracture orientations tend not to occur randomly in most cases, resulting in fractured reservoirs commonly displaying certain degrees of anisotropy. Previous research demonstrated that fracture parameters exert a profound influence on the elastic anisotropy properties of reservoirs (Ding et al., 2020; Xie et al., 2022; Xie et al., 2024), highlighting the broad potential application of elucidating anisotropic responses of various reservoir types (porous and fracture-porous) under diverse fluid saturations, encompassing the interpretation of four-dimensional seismic datasets, fluid classification, and the monitoring of subsurface storage processes (Yin et al., 2018; Yin et al., 2022; Bakulin et al., 2000a; Bakulin et al., 2000b). Furthermore, azimuthal anisotropic reservoir prediction, utilizing pre-stack five-dimensional seismic OVT gathers (Grechka, 2007; Chen et al., 2023; Chen and Zong, 2022), represents a significant breakthrough for the effective exploration of tight sandstone reservoirs in the Xujiahe Formation of the Jianyang area. The successful application of these advanced technologies requires a thorough understanding of the elastic anisotropic properties of various tight sandstone reservoir types within the study area. To sum up, there is an urgent need to conduct systematic experimental studies on anisotropic rock physics on porous and fracture-type tight sandstones in the Jianyang area. This endeavor aims to clarify anisotropic rock physics responses under varying reservoir parameter conditions, ascertain favorable response characteristics and elastic sensitivity parameters, thereby providing robust support for subsequent quantitative seismic interpretations and high-precision reservoir predictions.
Anisotropic rock physics, particularly with regard to fracture-porous and porous reservoirs, plays a critical role in enhancing the exploration of tight sandstone formations in the Jianyang area. To address this need, the present study conducts a comprehensive series of anisotropic rock physics experiments, considering varying fluid saturation conditions, using core samples extracted from representative wells within the Xujiahe Formation. The study integrates core observations, petrophysical analyses, whole-rock analysis, image logs, and microstructural data to systematically classify lithofacies and investigate wave behavior under anisotropic conditions. The outcomes of this research are expected to offer valuable insights into fluid identification, enabling the prediction of potential sweet spots in tight sandstone gas reservoirs through seismic methods. Ultimately, this work provides a robust foundation for more accurate reservoir predictions in the Jianyang area, paving the way for enhanced exploration and development strategies.
2 Sample selection, description, and categorization
The Jianyang Block, located within the boundaries of Jianyang City in the central Sichuan Basin, structurally belongs to the Sichuan Central Gentle Fold Belt structurally. Geologically, it belongs to the foreland slope belt of the Late Triassic foreland basin. Predominant tectonics consist of NW-trending monocline structures, with the area hosting major strike-slip faults and minor reverse faults. To enhance representativeness and comparability, the study meticulously selects ten core samples (20 in total) from the fourth member of the Xujiahe Formation in two adjacent wells, W102 and W104, respectively (Figures 1a,b). These samples are sequentially numbered #1–#20. Well W102 reveals, through integrated logging interpretation, a predominantly porous tight sandstone interval in the fourth member of the Xujiahe Formation, identified as a poor-quality gas layer. Cores were extracted from a depth range of 3370.35–3404.04 m. Conversely, well W104 exhibits a fracture-porous tight sandstone interval, marked by anomalous gas readings, with core sampling also performed within the same depth range. The criteria for core selection are carefully designed to account for the stratigraphic representation of both reservoir and non-reservoir sections, core drillability, and the representativeness of distinct lithofacies (porous vs. fracture-porous). After precise cutting and polishing, the samples are shaped into cylindrical plugs sized at 25 mm in diameter and 50 mm length, with dimensional accuracy maintained within ±0.1 mm. Core observation indicates that the majority of samples exhibit dense characteristics, with few visible macroscopic fracture observable to the naked eye. Sample #9 displays subtle microfractures, while sample #4 shows evident filled bedding plane fractures. Imaging log results suggest that only samples #9, #15, and #17 exhibit characteristic indications of fracturing at this scale (Figure 1). However, due to the impact of scale on core type definition, exhibiting fracture characteristics at the well logging scale does not conclusively imply that the retrieved core must categorically be of a fractured type. Similarly, samples devoid of discernible macroscopic fractures should not automatically be classified as porous, since they may still be influenced by fractures at a microscale level. Therefore, to perform anisotropic rock physics experiments on various types of tight sandstones aimed at optimizing the selection of rock physics-sensitive parameters, it is essential to establish more refined distinctions among the aforementioned sample categories.
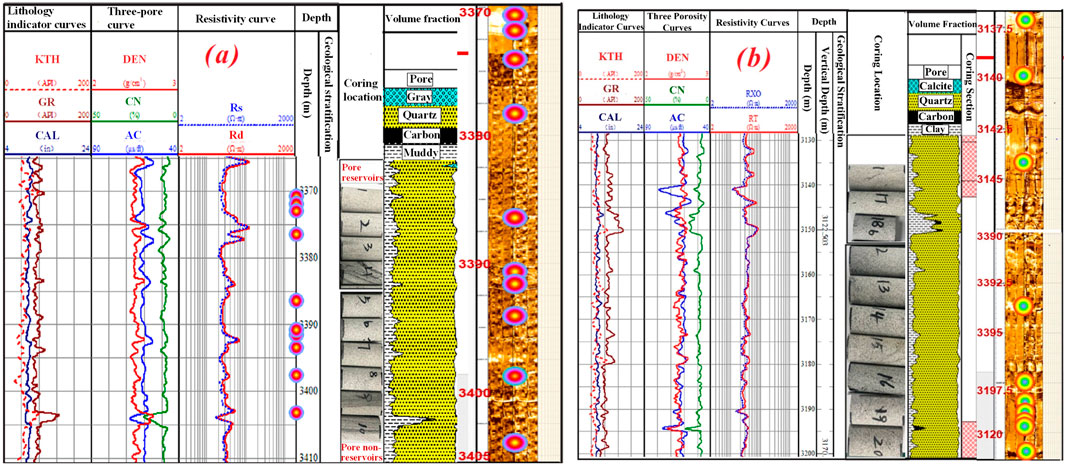
Figure 1. (a) Logging curves of well W102 showing the coring location (Section IV of the Xujiahe formation, burial depth ranging from 3370.35 to 3404.04 m). (b) Logging curves of well W104 illustrating the coring location (Section IV of the Xujiahe formation, burial depth ranging from 3370.35 to 3404.04 m).
Twenty core samples underwent physical property tests utilizing the AP608 autoclave pore permeability tester (Table 1). Results demonstrated that the porosity of the core samples from well W102 predominantly ranged between 3% and 8%, with an average of 5.83%; however, the permeability varied from 0.06 to 0.28 mD. Collectively, well W102 exhibits characteristics of a porous type, aligning with previous logging interpretations. In contrast, core samples from well W104 had porosity distributions between 3% and 9%, with an average of 6.4%; their permeability spanned from 0.05 to 2 mD. A crossplot analysis of permeability versus porosity was performed for both sets of samples from wells W102 and W104 (illustrated in Figures 2a,b). Figure 2a represents the permeability-porosity crossplot for samples #1 through #10 from well W102. It reveals that the chosen samples from this well display predominantly low porosity and low permeability characteristics; imaging log results did not indicate any pronounced cosine curve patterns (Figure 1a). However, prior core observations highlighted distinct features in samples #4 and #9 (Figures 1a, 2a). Although sample #4 exhibited notably low porosity and permeability, it displayed distinct filled bedding-plane fracture structures. In contrast, sample #9 showed evidence of minor microfractures. Based on core observations alone, it is therefore reasonable to tentatively classify samples #4 and #9 as fracture-porous types.
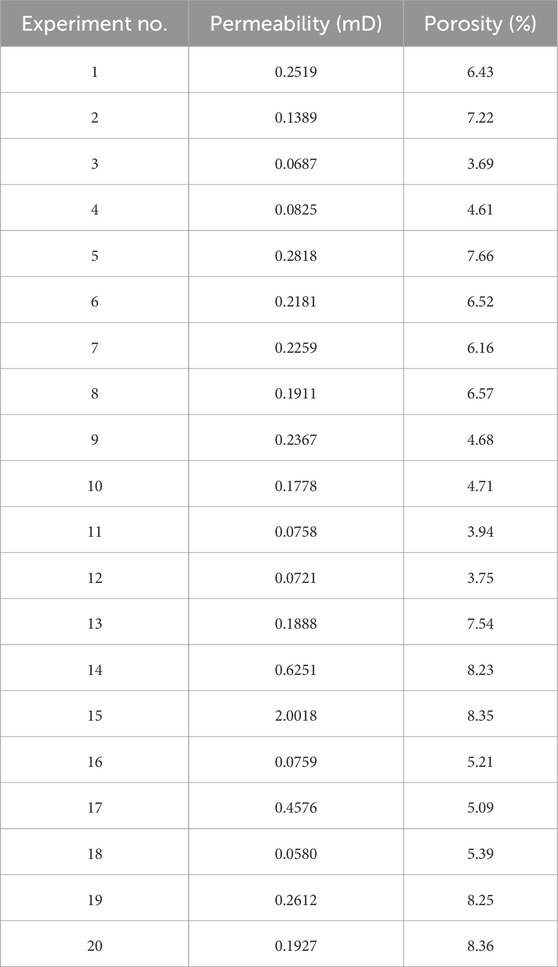
Table 1. Measured porosity and permeability values of tested samples.
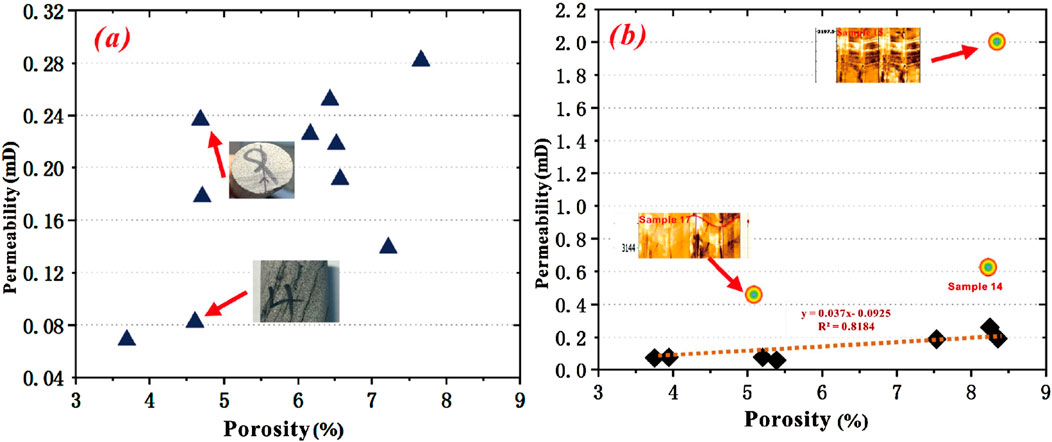
Figure 2. (a) Porosity-permeability crossplot of core samples obtained from well W102. (b) Porosity-permeability crossplot of core samples obtained from well W104.
To further validate the accuracy of this classification and facilitate the microscopic delineation of tight sandstone types, cast thin-section observations were conducted on each of the aforementioned samples. Figures 3b,c depict the observation results for samples #4 and #9 respectively. These reveal that sample #4 exhibits developed lamination fractures and abundant mica development; while sample #9 showcases developed banded clay laminae and large quantities of lightly metamorphosed rock fragments, displaying a dense undulating contact feature macroscopically indicative of fracturing. This comprehensively validates the rationality of categorizing samples #4 and #9 as fracture-porous type, as previously discussed. Additionally, integrated observation and analysis discovered that although no fracture developmental characteristics are visible in sample #1 at the core scale, cast thin section observations demonstrate typical conjugate fracture development (Figure 3a). Red-stained sections indicate calcite cement development, with pores primarily manifesting as feldspar intragranular dissolution holes—typical characteristics of a fracture-porous type. Conversely, samples represented by #3 exhibit extraordinarily dense characteristics, showing no evidence of fracture development across microscopic, core, or imaging log scales; these can thus be classified as porous types. Figure 2b represents the permeability vs porosity crossover diagram for core samples from Well W104. It indicates all samples show low porosity traits; however, observing from a permeability perspective, samples #14, #15, and #17 display significant differences, each exceeding 0.4 mD, suggesting these three samples exhibit low porosity-high permeability characteristics, hinting at possible internal microfracture presence. To substantiate this conjecture, imaging log (Figure 2b) comparisons and microscopic cast thin section observation results (Figures 3d–f) both confirm the microfracture features in samples #14, #15, and #17. Therefore, it is justified to classify samples #14, #15, and #17 as fracture-porous type. Excluding the intersection points of these three fracture-porous type samples in the crossover diagram of Figure 2b, we observe that remaining samples consistently exhibit low porosity-low permeability traits. A linear regression analysis demonstrates a strong correlation between porosity and permeability, with a goodness-of-fit exceeding 0.8. In conjunction with imaging log observations and cast thin-section analyses, these findings provide robust support for the classification of the remaining samples as porous-type tight sandstones. The specific classifications are detailed in Table 2.
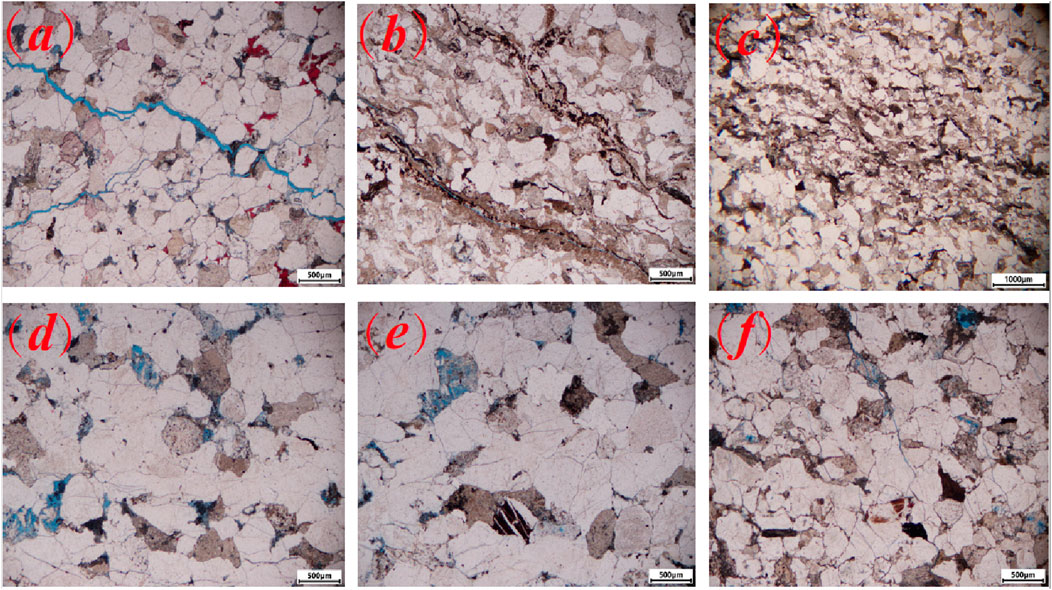
Figure 3. Observation results of cast thin Sections, (a) Sample #1, (b) Sample #4, (c) Sample #9, (d) Sample #14, (e) Sample #15, (f) Sample #17.
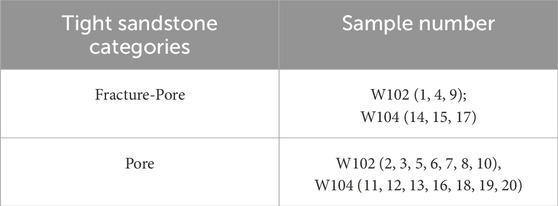
Table 2. Determination results of sample types.
3 Anisotropic ultrasound testing system and theoretical foundations
To address the limitations of traditional anisotropic rock physics testing—such as prolonged test durations, stringent sample specifications, challenges in multi-angle coring, complex processing requirements, significant noise interference, low signal-to-noise ratios, sparse sampling densities, and poor coupling effects, this study has independently developed and designed a comprehensive ultrasonic pulse transmission testing system (Figure 4). Figure 4a illustrates the high-precision holder, where the adjustability of the base ensures low dimensional requirements for the tested samples, allowing a wide range of diameters (5–50 mm) and lengths (>30 mm); the vernier caliper-like angle control principle guarantees high-density and high-accuracy sampling demands, enabling dense, high SNR collection every 2° across a 0–360° range; the transducer’s main frequency is 0.5 MHz, including both longitudinal wave probes and shear wave probes with high waveform signal-to-noise ratios, achieving velocity accuracy up to ±1%, or up to ±1.2%. Self-developed waveform display and processing software ensures automatic and precise post-collection waveform handling, while specially formulated coupling agents guarantee optimal contact surface coupling effect between probe and sample. The experimental process includes: (1) Sample Preparation: the sample is carefully processed into a cylindrical shape, ensuring that the sample’s length is uniform and the diameter is consistent throughout, the primary focus is on achieving a smooth cylindrical surface that allows for uniform wave propagation. The ends of the sample are cleaned thoroughly to remove any dirt, dust, or contaminants that could interfere with the coupling of waves or affect the measurement accuracy. A micrometer or precision caliper is used to measure the diameter and length of the sample to ensure that the dimensions meet the required specifications for the testing procedure. (2) Fixing the Sample in the Holder: Once the sample is properly shaped, it is carefully placed onto the base of the holder. The holder is designed to secure the sample without applying undue pressure that could alter the sample’s properties. The base is typically equipped with adjustable clamps or grips to hold the sample firmly in place. The sample is positioned in such a way that its cylindrical surface is aligned with the axis of the testing system. This alignment is critical for accurate wave transmission and reception. (3) Transducer Positioning and Coupling: Depending on the type of waves to be generated (such as P-waves, S-waves, or other types of acoustic waves), the appropriate transducers are selected. Each transducer is designed to either generate or receive the waves within a specific frequency range and orientation. The transducers are then positioned on either side of the cylindrical sample. The emitting transducer (source) is placed on one end of the sample, and the receiving transducer is placed on the opposite end. The distance between the transducers is adjusted to accommodate the diameter of the sample and the intended wave propagation path. The probe end faces of the transducers are placed in direct contact with the cylindrical surface of the sample. A coupling agent is applied between the transducer and the sample surface to minimize the air gap and ensure efficient wave transmission. In some cases, a slight pressure is applied to ensure a tight coupling. (4) Wave Generation and Transmission: The signal generator is used to excite the source transducer, generating the desired waveform (e.g., P-wave). The receiving transducer, located on the opposite end of the sample, captures the wave after it has traveled through the sample. The received signal is then fed into the signal processing system for analysis. (5) Recording and Analyzing Waveforms: The waveform received by the transducer is recorded by the data acquisition system. This system is capable of capturing high-fidelity signals with a high signal-to-noise ratio, ensuring accurate measurements of the wave characteristics. After each angle adjustment, the test is repeated to capture waveforms at different orientations. This step ensures that the anisotropic properties of the sample are fully characterized, providing valuable data on how wave propagation varies with direction.
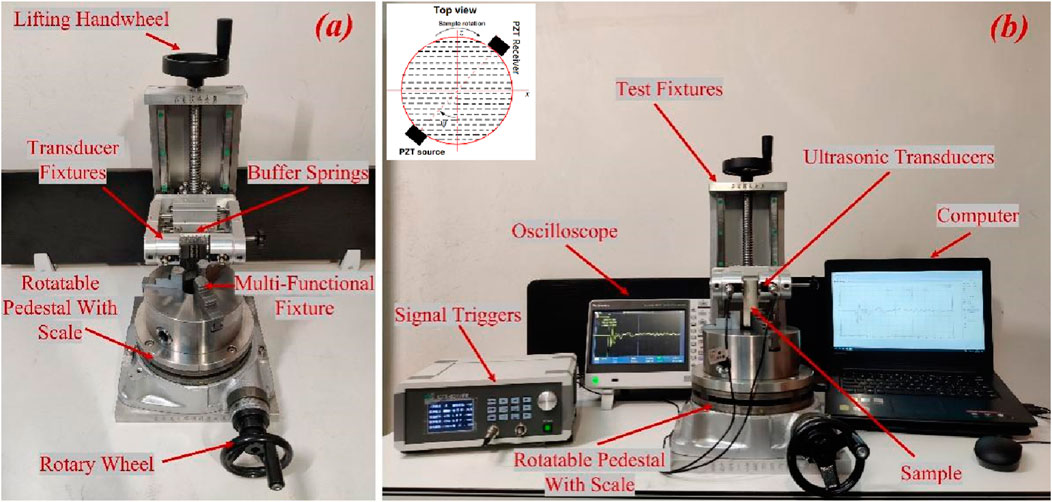
Figure 4. (a) Sample and transducer mounting device; (b) full-angle ultrasonic transducer testing system.
When a medium contains cracks, it can be idealized as either transversely isotropic or longitudinally isotropic media (TI: Transversely Isotropic). Transversely isotropic media exhibit symmetric properties, and the elastic constitutive equation for a transversely isotropic medium can be characterized using the following stiffness matrix (Equation 1):
The stiffness parameters in the elastic constitutive equations for VTI (Vertical Transversely Isotropic) media can be calculated by measuring the velocities of P-waves and S-waves as well as the density in different orientations. The specific calculation formulas are given below (Equations 2–6):
Among them,
On this basis, Thomsen (1986) provided the calculation formula for describing the velocity anisotropy intensity of TI media:
Among them, ε and γ represent the intensities of P-wave anisotropy and S-wave anisotropy respectively. δ determines the propagation characteristics of P-waves and slow S-waves. According to the aforementioned formula, to determine the above anisotropic parameters, it is necessary to measure the P-wave velocities in different directions. In addition, the amplitude anisotropy parameter (εA) is defined as the percentage of the relative size of the maximum and minimum amplitudes of the first waves in the waveform sets obtained by performing full-angle acoustic testing on a single sample. The specific expression is as follows:
In the formula, εA refers to the amplitude anisotropy parameter, Amax and Amin respectively refer to the maximum and minimum values of the amplitudes of the first waves in the waveform sets obtained by performing full-angle acoustic testing on a single sample.
4 Analysis of anisotropic sensitivity parameters in fluid-saturated dense sandstones under different fluid conditions
Firstly, rock samples are placed in an oven at temperatures range from 100°C to 110°C for more than 12 h followed by natural cooling, resulting in dry conditions (air-filled) for the dense sandstone samples. Under these conditions, full-angle anisotropic ultrasonic tests are conducted with a testing range from 0 to 180°, measured every 5°, yielding ultrasonic waveform data for different types (porous type, fracture-porous type) under dry conditions. After completing the experiments under dry conditions, the samples are subsequently placed into a ZYB-II vacuum pressure saturation device for air evacuation and water saturation (vacuum-saturated water). The process is maintained for over 24 h before conducting anisotropic rock physics tests on the water-saturated samples, capturing corresponding waveforms. Based on sample categorization and varying fluid saturation conditions, the samples can be classified into four distinct petrophysical phases: dry porous, water-saturated porous, dry fracture-porous, and water-saturated fracture-porous types.
A comprehensive analysis of the anisotropic ultrasonic waveforms (0.5 MHz) obtained from various types of dense sandstones under both dry and saturated conditions reveals consistent directional variation patterns within each rock type tested under the same conditions (dry or saturated). This further corroborates the validity of our earlier classification of sample types from an additional perspective. For comparative analysis, two fractured-porous dense sandstones (#1, #4) and one porous dense sandstone (#10) were selected from well W102, while two fractured-porous dense sandstones (#14, #17) and one porous dense sandstone (#12) were chosen from well W104; results from these representative samples will be analyzed in depth (Figures 5, 6). On the waveform diagrams, red background markings denote the initial arrival waves tested under dry conditions at different orientations, whereas blue backgrounds highlight the initial arrival waves measured under water-saturated conditions. It should be noted that P-wave velocities are calculated based on first arrival times, and amplitude values are derived from the peak of the first wave. Overall, the waveforms exhibit high signal-to-noise ratios, providing a solid foundation for accurate picking of initial arrivals and amplitudes. Results demonstrate pronounced P-wave velocity and amplitude anisotropy features in fractured-porous samples (#1, #4, #14, #17) when gas-saturated (Figures 5a,b, 6b,c). Waveforms display symmetry, with minimum speeds and amplitudes perpendicular to fractures, gradually increasing with deviation angles until reaching maximum values parallel to the fracture direction. Upon water saturation, waveforms reveal enhanced amplitudes perpendicular to fractures, reducing differences compared to measurements taken parallel to fractures, exhibiting weak amplitude anisotropy. Additionally, variations in velocity become less intense, tending towards isotropic behavior (Figures 5d,e, 6e,f). For porous dense sandstones (#10, #12), strong amplitude features are present under both dry and saturated conditions, yet significant directional variation patterns are lacking. Moreover, regardless of whether the samples are water-saturated or gas-saturated, velocity differences across different directions remain minimal. This suggests that amplitude anisotropy and P-wave velocity anisotropy may serve as anisotropic elastic-sensitive parameters for gas-saturated fracture-porous tight sandstones.
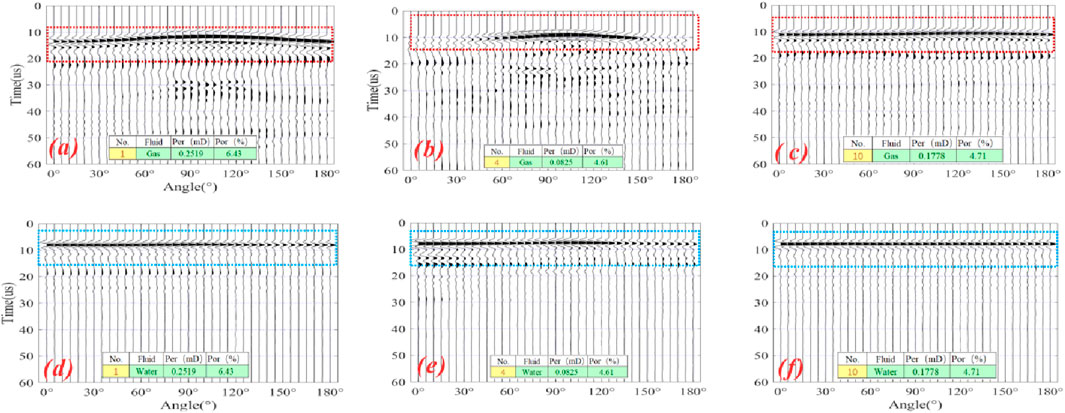
Figure 5. Anisotropic test waveforms of different types of dense sandstones from well W102 under dry and water-saturated conditions: (a) Sample #1 - dry (fractured-porous type), (b) Sample #4 - dry (fractured-porous type), (c) Sample #10 - dry (porous type), (d) Sample #1 - water Saturated (fractured-porous type), (e) Sample #4 - water Saturated (fractured-porous type), (f) Sample #10 - water Saturated (porous type).
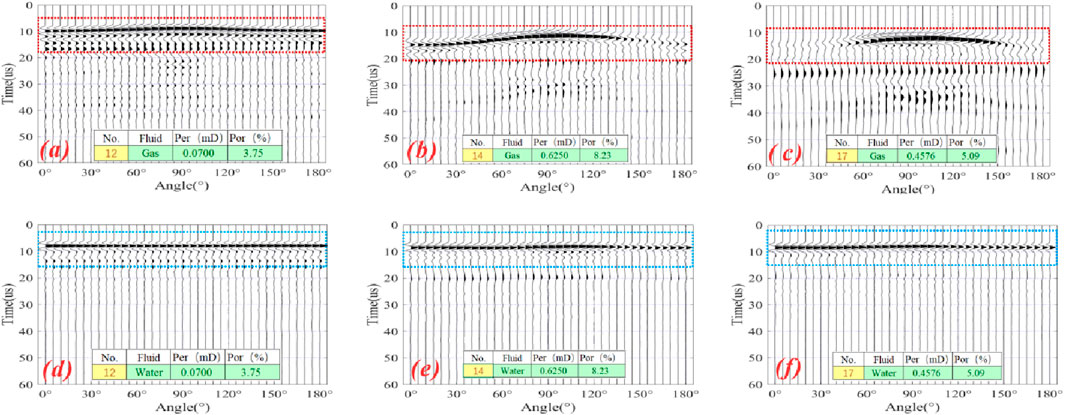
Figure 6. Anisotropic test waveforms of different types of dense sandstones from well W104 under dry and water-saturated conditions: (a) Sample #12 - dry (porous fractured-porous type), (b) Sample #14 - dry (fractured-porous type), (c) Sample #17 - dry (porous type), (d) Sample #12 - water Saturated (porous type), (e) Sample #14 - water Saturated (fractured-porous type), (f) Sample #17 - water Saturated (fractured-porous type).
To quantitatively analyze the angular dependence of waveform parameters and identify potential indicators of anisotropic elastic sensitivity, we extract first-arrival times and amplitude data from the waveforms of various dense sandstone samples under both gas and water saturation conditions. These data allow us to calculate longitudinal and transverse wave velocities, as well as amplitude values across different directions for the tested samples. Building upon Equations 7–10, we derive anisotropic parameters for both types of waves and the intensity of amplitude anisotropy. Figure 7 illustrates the varying strengths of different anisotropic parameters (Thomsen parameters and amplitudes) for distinct samples. Red squares represent the results for dry porous dense sandstones, red-highlighted circles correspond to dry fractured-porous dense sandstones, and blue indicates water-bearing dense sandstones. Notably, fractured-porous dense sandstones under dry conditions display robust longitudinal wave anisotropy (ε) characteristics (Figure 7a), with intensities exceeding 20%, which is significantly higher than those observed in other dense sandstones subjected to various conditions. This highlights the sensitivity of (ε) to fractured-porous dense sandstones under dry conditions. Noteworthily, some gaseous porous samples (e.g., #3, #7, #11, #12) and water-saturated fractured-porous (e.g., #4) samples also exhibit strong (ε) characteristics (>10%), potentially complicating the use of (ε) as a sensitive parameter. Shear wave anisotropy (γ) exhibits minimal sensitivity to variations in sandstone types under different conditions (water-saturated, gas-saturated) (Figure 7b). There is substantial overlap between the dry fractured-porous test results and those under other conditions, with overall intensities remaining below 10%. Consequently, γ fails to effectively differentiate between these conditions. Parameter δ demonstrates limited sensitivity to different sandstone types under both dry and saturated conditions (Figure 7c), lacking distinct correlation patterns or the ability to clearly differentiate between them. Furthermore, most fractured-porous dense sandstones under dry conditions exhibit greater amplitude anisotropy parameters compared to other experimental results under different conditions (Figure 7d). Exceptions do occur, such as in Sample #1, where, despite being a fractured-porous dense sandstone, εA under dry conditions is lower than under water-saturated conditions. In conclusion, while longitudinal wave anisotropy and amplitude anisotropy parameters partially distinguish dry fractured-porous dense sandstones from other lithologies. In conclusion, although longitudinal wave anisotropy parameters and amplitude anisotropy parameters partially distinguish dry fractured-porous dense sandstones from others among varying lithologies, anomalies persist. To enhance discrimination further, this study proposes integrating longitudinal wave and amplitude anisotropy parameters to construct a joint anisotropic petrophysical constraint plot (ε-εA). The (ε-εA) plot effectively separates gas-bearing fractured-porous dense samples from other lithologies, facilitating threshold extraction. By setting thresholds for longitudinal wave anisotropy and amplitude anisotropy strength at >20%, sensitive parameters are identified, distinguishing gas-bearing fractured-porous dense sandstones from diverse lithologies. Remarkably, this plot seems capable of discriminating dry porous dense sandstones (red squares in the diagram) and water-saturated lithologies (blue circles) to some extent (Figure 8). However, the overlap between water-saturated test results for three porous samples (#8, #10, #13) and dry lithology outcomes raises concerns about applicability, warranting further discussion on the differentiation and selection criteria for other lithologies.
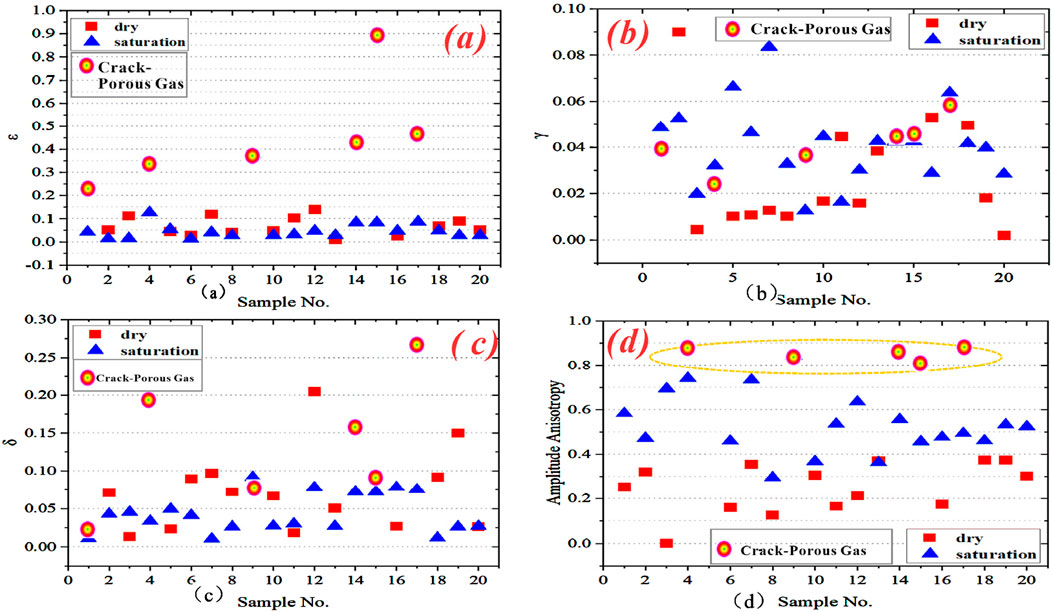
Figure 7. Anisotropic parameters of different types of dense sandstones under various fluid saturation conditions: (a) Longitudinal wave anisotropy parameter (ε), (b) transverse wave anisotropy parameter (γ), (c) thomsen anisotropy parameter (δ), (d) amplitude anisotropy parameter (εA).
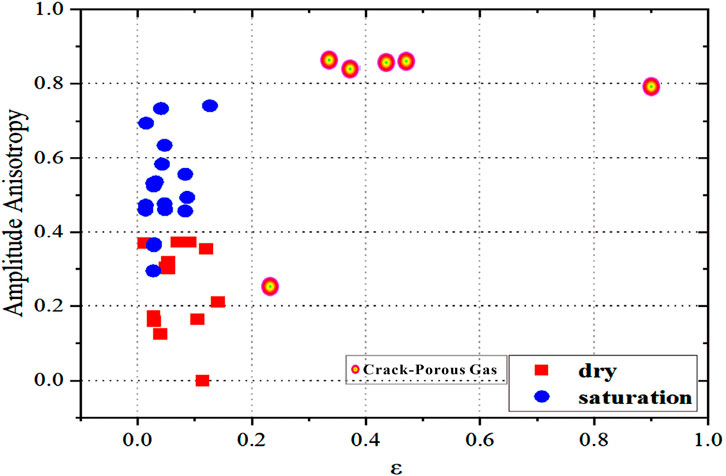
Figure 8. Cross-plot of longitudinal wave anisotropy parameter versus amplitude anisotropy parameter (ε-εA) for different types of dense sandstones under various fluid saturation conditions.
Following the selection of dry, fractured-porous rock types via the (ε-εA) cross-plot and associated thresholds, further discrimination is sought for other lithologies, including gas-saturated porous, water-saturated porous, and water-saturated fractured-porous dense sandstones. Our study proposed to used a approach to represent anisotropy sensitivity—the slowness anisotropy parameter, which has been extensively studied and applied in the field of rock mechanics (Armstrong et al., 1995; Market et al., 2015; Market and Tudge, 2017; Zheng et al., 2009). Its calculation involves the following steps: Firstly, the ultrasonic signal received in the direction parallel to the fracture is taken as the reference waveform. Then, the cross-correlation coefficient between this reference waveform and those received at other angles is computed utilizing the cross-correlation algorithm. Specifically, the calculation proceeds as follows (Equation 11):
Among these,
Wherein,
In the equation,
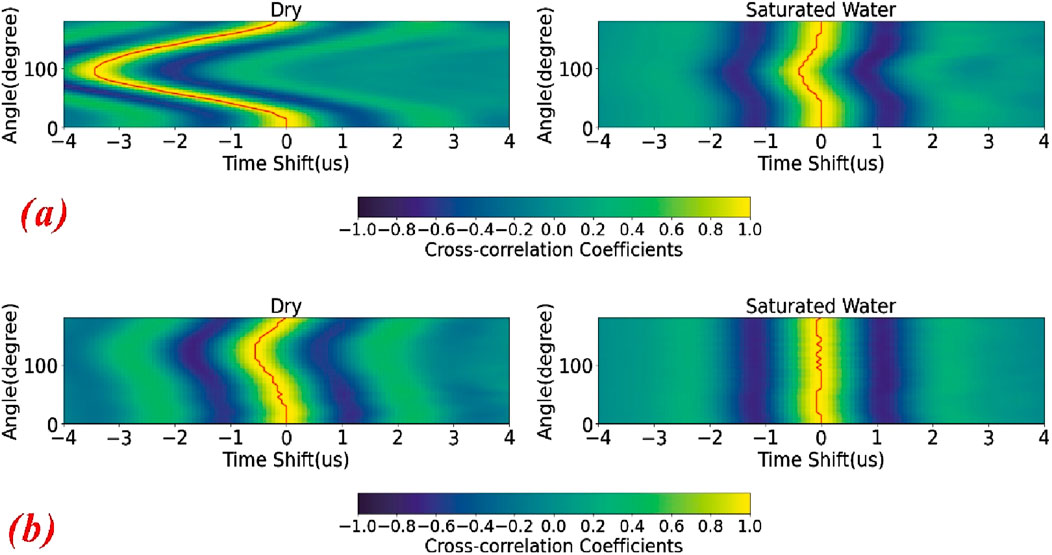
Figure 9. Illustrates the normalized cross-correlation coefficient spectra for anisotropic waveforms tested under various conditions, specifically for (a) the fracture-porosity type (#17) and (b) the pore type (#10).
To further quantify these discrepancies, the slowness anisotropy parameters (
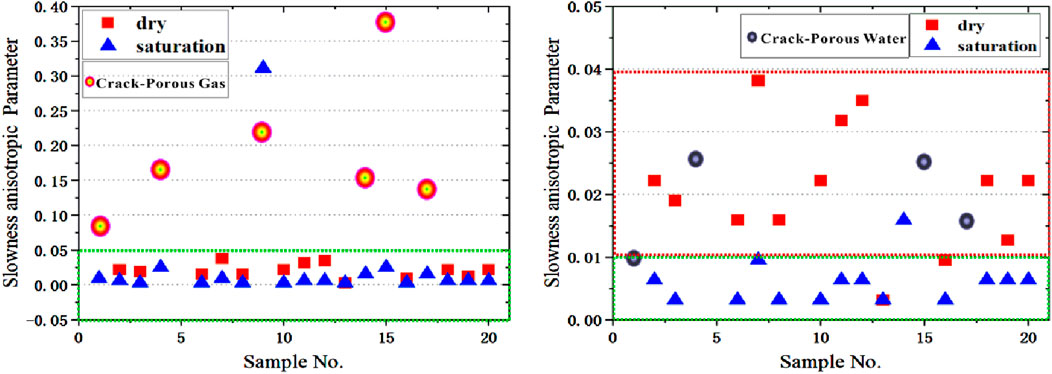
Figure 10. Displays the outcomes of the slowness anisotropy parameter analyses for various types of tight sandstones under differing conditions.
Integrating the aforementioned analyses and findings, the dry fractured-porous and water-bearing porous lithotypes can be sequentially identified via the (ε-εA) crossplot and subsequent application of slowness anisotropy parameters alongside relevant thresholds. Building upon this foundation, Lame parameters (shear modulus μ and bulk modulus λ) can be calculated utilizing P-wave and S-wave velocities, as well as density measurements for the remaining two lithotypes. The subsequent construction of a (μρ-λρ) crossplot, as illustrated in Figure 11, enables clear differentiation between the two lithologies. By establishing rational thresholds on the horizontal and vertical axes (specifically, μρ < 30 and λρ < 60), the distinction between dry porous and water-saturated fractured-porous tight sandstones becomes distinctly apparent.
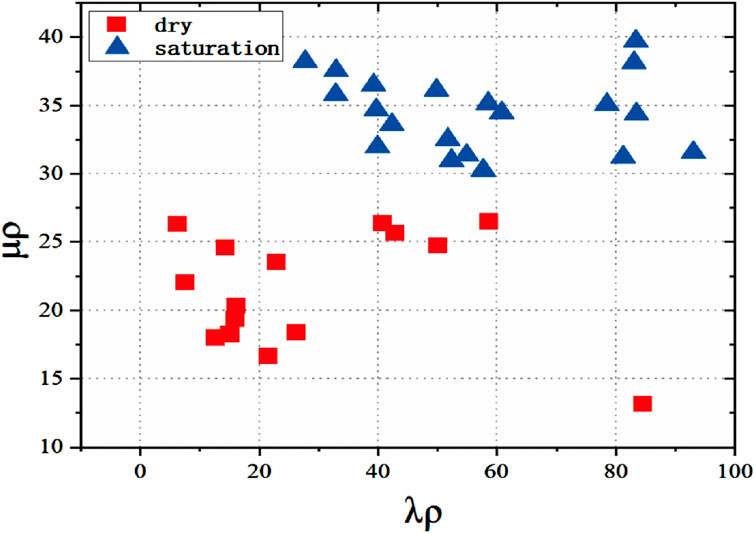
Figure 11. Presents the μρ-λρ elasticity parameter rock physics sensitivity plot, the units of both the horizontal and vertical axes are GPag/cm3.
5 Discussion
The findings of this study advance the understanding of anisotropic rock physics in tight sandstone reservoirs by integrating multi-parameter thresholds and laboratory-scale validation, addressing critical gaps in existing literature. Previous studies on anisotropy in fractured reservoirs, such as those by Thomsen (1986), Bakulin et al. (2000a), Bakulin et al. (2000b), established foundational frameworks for velocity anisotropy but primarily focused on seismic-scale applications or theoretical models. This work bridges the gap between laboratory experiments and field-scale seismic interpretations by introducing amplitude anisotropy (εA) and slowness anisotropy (εslow) as complementary parameters to Thomsen’s ε, γ, and δ. These innovations enable a more granular discrimination of lithofacies under varying fluid saturations, a challenge highlighted in earlier works by Market et al. (2015), Market and Tudge, (2017), who emphasized the complexity of acoustic anisotropy in heterogeneous formations.
A key contribution lies in the development of the (ε-εA) crossplot with empirically derived thresholds (ε > 20%, εA > 20%) for identifying gas-bearing fractured-porous lithofacies. This approach contrasts with seismic-based methods, such as those utilizing OVT gathers (Yin et al., 2018; Yin et al., 2022), which lack laboratory validation of anisotropic sensitivity parameters. The integration of ultrasonic testing with petrophysical analysis aligns with Xie et al. (2022), who demonstrated pore structure impacts on velocity anisotropy, but extends their findings by quantifying amplitude variations. For instance, the pronounced velocity and amplitude anisotropy observed in gas-saturated fractured samples (#1, #4, #14, #17) corroborates theoretical models by Thomsen (1986) and experimental results from Ding et al. (2020), while introducing practical thresholds for field applications. The novel slowness anisotropy parameter (εslow) further enhances lithofacies discrimination, particularly for water-saturated porous types (εslow <0.01). This parameter addresses limitations in prior studies, such as those by Armstrong et al. (1995), which focused on field-scale elastic anisotropy but lacked microscale resolution. The workflow’s reliance on cross-correlation coefficient spectra builds on methodologies proposed by Zheng et al. (2009) for stress-induced anisotropy but adapts them to ultrasonic data, offering higher precision for tight sandstone characterization. The development of a full-angle ultrasonic testing system represents a significant improvement over traditional methods, which often suffered from sparse sampling and low signal-to-noise ratios (Quakenbus et al., 2006). Our system’s high-density angular sampling (every 2°) and enhanced coupling align with advancements in shale anisotropy studies (Xie et al., 2024) while achieving superior resolution compared to regional-scale seismic approaches.
Three key limitations warrant attention. First, the sample size (n = 20 cores) is constrained compared to basin-scale studies (Jia et al., 2022), potentially limiting the universal applicability of thresholds. Second, cylindrical sample geometries may inadequately replicate in situ stress conditions—a caveat also noted in shale anisotropy research (Xie et al., 2024). Third, the empirically derived thresholds (e.g., λρ < 60, μρ < 30) are calibrated for the Jianyang Block’s lithology and stress regime, necessitating validation in divergent basins. In summary, this study advances anisotropic rock physics by providing a multi-parameter, threshold-driven framework tailored to tight sandstones. By addressing the shortcomings of isotropic models and introducing novel parameters, it complements existing methodologies while offering practical tools for fluid identification. However, the regional specificity of thresholds and sample-scale limitations underscore the need for validation in diverse geological settings. These contributions align with global efforts to enhance unconventional resource exploration, as advocated by Zou et al. (2018), while addressing the unique challenges of the Sichuan Basin’s Xujiahe Formation.
6 Conclusion
This study proposes a stepwise identification strategy and methodology for lithofacies based on anisotropic rock physics sensitive parameters. Initially, by synthesizing observations from image logging, core analysis, permeability-porosity tests, and petrographic thin section examinations at varying scales, the tested samples are classified into four lithofacies categories: dry porous, water-saturated porous, dry fracture-porous, and water-saturated fracture-porous. Building on this foundation, an advanced full-angle ultrasonic anisotropy testing system was employed to conduct high-density, high-precision ultrasonic waveform tests with a high signal-to-noise ratio across multiple directions. Analytical results revealed that dense sandstones characterized by a dry fracture-porous nature exhibited strong P-wave anisotropy (ε) and strong amplitude anisotropy (εA). Accordingly, an (ε-εA) anisotropic rock physics crossplot was constructed; by establishing thresholds (ε>20% and εA>20%), the dry fracture-porous dense sandstones could be efficiently selected and differentiated. Furthermore, based on the similarity coefficient spectrum derived from full-angle waveforms, a special parameter, slowness anisotropy (Δ), and its theoretical derivation method were introduced. It was observed that the slowness anisotropy parameters for water-saturated porous lithofacies consistently remained below 0.01, suggesting that slowness anisotropy can serve as an effective elastic-sensitive parameter for identifying water-saturated porous lithofacies. Finally, by integrating the (λρ-μρ) diagram with its defined thresholds (λρ < 60 and μρ < 30), gas-bearing porous and water-saturated fracture-porous lithofacies can be effectively selected and differentiated. These findings provide significant support for reservoir and fluid identification predictions in the Shijiahe Formation’s pore-fractured dense sandstone reservoirs in the Jianyang region. It is expected that these results will play a foundational role in interpreting 4D seismic data, recognizing fluid types, and predicting azimuthal anisotropic reservoirs in dense sandstone formations in other regions.
Data availability statement
The original contributions presented in the study are included in the article/supplementary material, further inquiries can be directed to the corresponding author.
Author contributions
JD: Conceptualization, Investigation, Writing – original draft, Writing – review and editing. YY: Investigation, Methodology, Validation, Writing – review and editing. WW: Investigation, Methodology, Writing – review and editing. CX: Data curation, Validation, Writing – review and editing. GY: Investigation, Validation, Writing – review and editing. JY: Investigation, Resources, Supervision, Validation, Writing – review and editing.
Funding
The author(s) declare that no financial support was received for the research and/or publication of this article.
Conflict of interest
Authors JD, YY, WW, CX, and GY were employed by PetroChina Southwest Oil and Gasfield Company. Author JY was employed by Guizhou Zhongkai Transportation Construction Co., Ltd.
Generative AI statement
The author(s) declare that no Generative AI was used in the creation of this manuscript.
Publisher’s note
All claims expressed in this article are solely those of the authors and do not necessarily represent those of their affiliated organizations, or those of the publisher, the editors and the reviewers. Any product that may be evaluated in this article, or claim that may be made by its manufacturer, is not guaranteed or endorsed by the publisher.
References
Armstrong, P., Ireson, D., Chmela, B., Dodds, K., Esmersoy, C., and Miller, D. (1995). Oilfield anisotropy: the promise of elastic anisotropy. Schlumnerger Oilfield Rev., 36–47. doi:10.1016/0148-9062(95)99526-4
Bai, Z., Tan, M., Li, G., and Shi, Y. (2019). Analysis of low-resistivity oil pay and fluid typing method of Chang 81 member, Yanchang Formation in Huanxian area, Ordos Basin, China. J. Petroleum Sci. Eng. 175, 1099–1111. doi:10.1016/j.petrol.2019.01.015
Bakulin, A., Grechka, V., and Tsvankin, I. (2000a). Estimation of fracture parameters from reflection seismic data-part I: HTI model due to a single fracture set. Geophysics 65 (6), 1788–1802. doi:10.1190/1.1444863
Bakulin, A., Grechka, V., and Tsvankin, I. (2000b). Estimation of fracture parameters from reflection seismic data—Part II: fractured models with orthorhombic symmetry. Geophysics 65 (6), 1803–1817. doi:10.1190/1.1444864
Camac, B. A., and Hunt, S. P. (2009). Predicting the regional distribution of fracture networks using the distinct element numerical method. AAPG Bull. 93 (11), 1571–1583. doi:10.1306/07230909040
Carcione, J. M., and Avseth, P. (2015). Rock-physics templates for clay-rich source rocks. Geophysics 80, D481–D500. doi:10.1190/geo2014-0510.1
Chen, F., and Zong, Z. (2022). PP-wave reflection coefficient in stress-induced anisotropic media and amplitude variation with incident angle and azimuth inversion. Geophysics 87 (6), C155–C172. doi:10.1190/geo2021-0706.1
Chen, F., Zong, Z., Yin, X., and Stovas, A. (2023). Stress dependence of elastic wave dispersion and attenuation in fluid-saturated porous layered media. Sci. China Earth Sci. 66 (11), 2622–2634. doi:10.1007/s11430-022-1147-7
Chen, H., Innanen, K. A., and Chen, T. (2018). Estimating P-and S-wave inverse quality factors from observed seismic data using an attenuative elastic impedance. Geophysics 83 (2), R173–R187. doi:10.1190/geo2017-0183.1
Chen, H., Li, J., and Innanen, K. A. (2020). Inversion of differences in frequency components of azimuthal seismic data for indicators of oil-bearing fractured reservoirs based on an attenuative cracked model. Geophysics 85 (3), R163–R175. doi:10.1190/geo2019-0152.1
Ding, P., Wang, D., and Li, X (2020). An experimental study on scale-dependent velocity and anisotropy in fractured media based on artificial rocks with controlled fracture geometries. Rock Mech. Rock Eng. 53 (7), 3149–3159. doi:10.1007/s00603-020-02095-2
Feng, S., Xie, R., Wen, Z., Yin, S., Deng, M., Chen, J., et al. (2021). A new method for logging identification of fluid properties in tight sandstone gas reservoirs based on gray correlation weight analysis — a case study of the middle Jurassic Shaximiao Formation on the eastern slope of the Western Sichuan Depression, China. Interpretation 9 (4), T1167–T1181. doi:10.1190/int-2020-0247.1
Goodway, W., Chen, T., and Downton, J. (1997). Improved AVO fluid detection and lithology discrimination using Lame petrophysical parameters; “Lambda-Rho”, “Mu-Rho”, and “Lambda/Mu fluid stack” [C], from P- and S-inversions: 67 annual International meeting, SEG, Expanded Abstracts. 183186. doi:10.1190/1.1885795
Grechka, V. (2007). Multiple cracks in VTI rocks: effective properties and fracture characterization. Geophysics 72 (5), D81–D91. doi:10.1190/1.2751500
Guo, Z. Q., Zhao, D. Y., and Liu, C. (2022). Gas prediction using an improved seismic dispersion attribute inversion for tight sandstone gas reservoirs in the Ordos Basin, China. J. Nat. Gas Sci. Eng. 101, 104499. doi:10.1016/j.jngse.2022.104499
Jia, A. L., Wei, Y. S., Guo, Z., Wang, G., Meng, D., and Huang, S. (2022). Development status and prospect of tight sandstone gas in China. Nat. Gas. Ind. 42 (1), 83–92. doi:10.3787/j.issn.1000-0976.2022.01.008
Jiang, L., Zhao, W., Bo, D. M., Hong, F., Gong, Y. J., and Hao, J. Q. (2023). Tight sandstone gas accumulation mechanisms and sweet spot prediction, Triassic Xujiahe Formation, Sichuan Basin, China. Petroleum Sci. 20 (6), 3301–3310. doi:10.1016/j.petsci.2023.07.008
Lai, J., Wang, G., Fan, Z., Chen, J., Wang, S., Zhou, Z., et al. (2016). Insight into the pore structure of tight sandstones using NMR and HPMI measurements. Energ Fuel 30, 10200–10214. doi:10.1021/acs.energyfuels.6b01982
Lai, J., Wang, G. W., Wang, S., Cao, J., Li, M., and Pang, X. (2018). Review of diagenetic facies in tight sandstones: diagenesis, diagenetic minerals, and prediction via well logs. Earth Sci. Rev. 185, 234–258. doi:10.1016/j.earscirev.2018.06.009
Lan, Li, Wu, C., and Wang, X. (2023). “Fine Description of the first member reservoir of tight sandstone gas reservoir in the Jianyang block of Tianfu gas field—a case study of the Y3 Platform natural gas Professional Committee of the Chinese petroleum Society, petroleum Engineering Professional Committee of the Chinese petroleum Society, research Institute of petroleum exploration and development, CNPC, National Engineering laboratory for exploration and development of low permeability oil and gas fields,” in Proceedings of the Second China natural gas development Technology annual Conference, 3.
Liu, J. D., Zhang, C. J., Jiang, Y. L., and Bai, G. S. (2022). Overpressure and gas charging in tight sandstone: Xujiahe formation, northeastern Sichuan Basin. Petroleum Sci. 19 (6), 2583–2600. doi:10.1016/j.petsci.2022.08.023
Luguang, Li (2021). Review and prospects of the development of China's natural gas Industry. Nat. Gas. Ind. 41 (08), 1–11. doi:10.3787/j.issn.1000-0976.2021.08.001
Lv, W. Y., Zeng, L. B., Chen, S. Q., Lv, P., Dong, S. Q., and Hui, C. (2021). Characterization methods of multi-scale natural fractures in tight and low-permeability sandstone reservoirs. Geol. Rev. 67 (2), 543–556.
Market, J., Mejia, C., Mutlu, O., Shahri, M. P., and Tudge, J. (2015). “Untangling acoustic anisotropy. Society of Petrophysicisits and well log Analysts (SPLWA),” in Presented at the SPLWA 56th annual logging Symposium, Oklahoma, USA.
Market, J., and Tudge, J. (2017). “A Layman's Guide to acoustic anisotropy. Society of Petrophysicisits and well log Analysts (SPLWA),” in Presented at the SPLWA 58th annual logging Symposium. Long Beach, California, USA, 18–22.
Olson, J. E., Laubach, S. E., and Lander, R. H. (2009). Natural fracture characterization in tight gas sandstones: integrating mechanics and diagenesis. AAPG Bull. 93 (11), 1535–1549. doi:10.1306/08110909100
Pang, X., Zhang, X. L., Wang, X. J., Chen, S. L., Wu, C. J., Pan, K., et al. (2023). Development Characteristics and Main Controlling Factors of Tight Sandstone Reservoirs in the Shaximiao Formation of the Jianyang Area, Sichuan Basin [C] Abstracts of the 17th National Conference on Palaeogeography and Sedimentology - Session 15: Reservoir Characteristics and Formation Mechanisms, 2.
Quakenbus, H. M., Shang, B., and Tuttle, C. (2006). Poisson impedance. Lead. Edge 25 (2), 128–138. doi:10.1190/1.2172301
Shen, H., Shi, Z., Qiao, G., and Yi, M. X. (2005). Study on Deep gas layer identification methods. Nat. Gas. Ind. (10), 71–72+12. doi:10.3321/j.issn:1000-0976.2005.10.016
Sun, L. D., Zou, C. N., Jia, A. L., Wei, Y., Zhu, R., Wu, S., et al. (2019). Development characteristics and orientation of tight oil and gas in China. Petroleum Explor. Dev. 46 (06), 1073–1087. doi:10.1016/s1876-3804(19)60264-8
Sun, L., Xiao, H., Tan, L., Li, B. W., Sun, D.-M., and Wang, P. (2022). Pore structure comparison and difference mechanism between tight sandstone and tight conglomerate reservoirs. Acta Geol. Sin. 96 (6), 2155–2172. doi:10.3969/j.issn.0001-5717.2022.06.017
Sun, X., Wen, W., and Hongmei, Li (2012). Fluid sensitivity analysis of rock physics parameters. Reserv. Eval. Dev. 2 (01), 37–40+49. doi:10.3969/j.issn.2095-1426.2012.01.009
Tang, Y. J., Xu, W. C., Wang, X. J., Pang, X. T., Chen, S. L., Zhang, X. L., et al. (2024). Hydrochemical characteristics and genesis of Xujiahe Formation formation water in Jianyang central Sichuan: evidence from hydrochemistry and strontium isotope. Fault-Block Oil Gas Field 31 (3), 444–452.
Wang, K., Chen, X., Wang, D., Zhao, Y., Li, J., Wang, P., et al. (2018). “A new insight into the hydrocarbon indicator of tight sandstone reservoir,” in SEG International Exposition and Annual Meeting. Society of Exploration Geophysicists, SEG-2018-2989731.
Wang, Z. C., Li, Z. Y., Li, Z. R., Fan, B., Zhang, H. J., Li, L., et al. (2012). Discussion on the causes of structural deformation of the Xujiahe Formation in the central Sichuan area and its exploration significance. Nat. Gas. Ind. 32(4), 13–18.
Wu, H., Ji, Y., Liu, R., Zhang, C., and Chen, S. (2017). Insight into the pore structure of tight gas sandstones: a case study in the ordos basin, NW China. Energ Fuel 31, 13159–13178. doi:10.1021/acs.energyfuels.7b01816
Xie, J. Y., Fang, Y. P., Wu, X. H., Zhao, J., Dai, J. C., Cao, J. X., et al. (2024). Quantitative characterizations of anisotropic dynamic properties in organic-rich shale with different kerogen content. Petroleum Sci. 21, 855–865. doi:10.1016/j.petsci.2023.10.005
Xie, J. Y., Zhang, J. J., Xiang, W., Fang, Y. P., Xue, Y. J., Cao, J. X., et al. (2022). Effect of microscopic pore structures on ultrasonic velocity in tight sandstone with different fluid saturation. Petroleum Sci. 19 (6), 2683–2694. doi:10.1016/j.petsci.2022.06.009
Yang, W., Li, Y., Qiu, Y. C., Wang, X. J., Chen, S. J., Zheng, C., et al. (2024). Controlling factors for high-Yield gas enrichment in tight sandstone of the fourth member of the Xujiahe Formation in the Jianyang area. J. Chengdu Univ. Technol. Nat. Sci. Ed., 1–19. doi:10.3969/j.issn.1671-9727.2024.06.01
Yi, S. W., Lin, S. G., Yang, W., Shi, Z. S., and Li, J. (2013). Condition of Xujiahe Formation large gas Province Formation in Sichuan Basin. Nat. Gas. Geosci. 24 (1), 1–8.
Yin, X., Ma, Z., Zong, Z., and Shang, S. (2022). Research status and progress in seismic rock physics-driven fracture prediction technology (Part II) - five-dimensional seismic fracture prediction technology. Pet. Explor. Geophys. 61 (03), 373–391.
Yin, X., Zhang, H., and Zhaoyun, Z. (2018). Research status and progress in interpretation techniques of 5D seismic data in the OVT data Domain. Pet. Explor. Geophys. 57 (02), 155–178. doi:10.3969/j.issn.1000-1441.2018.02.001
Zeng, F., Zhang, C., Wei, Z., Nguyen, B. T., Song, W., Li, Z., et al. (2021). Main enrichment controlling factors and reservoir characteristics of tight sandstone gas under the influence of volcanic activity. Acta Geol. Sin. 95 (3), 895–912. doi:10.3969/j.issn.0001-5717.2021.03.020
Zhao, J. L., Liu, J. J., Zhang, Q. H., and Qu, X. R. (2017). Overview of geophysical exploration methods and technical of tight sandstone gas reservoirs. Prog. Geophys. 32 (2), 840–848.
Zhao, Z. W., Xie, J. R., Li, N., Zhu, H., and Wu, C. J. (2013). Gas exploration of the 1st, 3rd and 5th members of Xujiahe Fm reservoirs in the Sichuan Basin. Nat. Gas. Ind. 33 (6), 23–28.
Zheng, C., Jin, Z. M., Cao, Z. L., Liu, M., Zhao, Z. W., Bai, H., et al. (2024). Differences in reservoir characteristics and mechanisms of high-quality reservoir formation in the tight sandstone of the Xujiahe Formation in the central to Western Sichuan Transitional Zone. J. Mineral. Petrol 44 (03), 152–164. doi:10.19719/j.cnki.1001-6872.2024.03.12
Zheng, Y., Tang, X., and Patterson, D. (2009). “Identifying stress-induced anisotropy and stress direction using cross-Dipole acoustic logging. Society of Petrophysicists and well log Analysts (SPLWA),” in Presented at the SPWLA 50th annual logging Symposium. The Woodlands, Texas, United States, 21–24. June. SPLWA-2009-21660.
Zou, C. N., Qiu, Z., Zhang, J. Q., Li, Z., Wei, H., Liu, B., et al. (2022). Unconventional petroleum Sedimentology: a key to understanding unconventional hydrocarbon accumulation. Engineering 18, 62–78. doi:10.1016/j.eng.2022.06.016
Zou, C. N., Yang, Z., He, D. B., Wei, Y., Li, J., Jia, A., et al. (2018). Theory, technology and prospects of conventional and unconventional natural gas. Petroleum Explor. Dev. 45 (4), 604–618. doi:10.1016/s1876-3804(18)30066-1
Keywords: tight sandstone, anisotropy, fluid identification, rock physics, quantitative interpretation
Citation: Dai J, Yan Y, Wei W, Xi C, Yang G and Yao J (2025) Anisotropic rock physics characteristics and patterns of pore-fracture type tight sandstone reservoirs. Front. Earth Sci. 13:1525693. doi: 10.3389/feart.2025.1525693
Received: 10 November 2024; Accepted: 15 April 2025;
Published: 09 May 2025.
Edited by:
Peng Wu, Dalian University of Technology, ChinaReviewed by:
Zhaoyun Zong, China University of Petroleum (East China), ChinaWengang Dang, National Sun Yat-sen University, Taiwan
Rasoul Sorkhabi, The University of Utah, United States
Copyright © 2025 Dai, Yan, Wei, Xi, Yang and Yao. This is an open-access article distributed under the terms of the Creative Commons Attribution License (CC BY). The use, distribution or reproduction in other forums is permitted, provided the original author(s) and the copyright owner(s) are credited and that the original publication in this journal is cited, in accordance with accepted academic practice. No use, distribution or reproduction is permitted which does not comply with these terms.
*Correspondence: Juncheng Dai, OTM1ODkyNzEzQHFxLmNvbQ==