 Christoph Werner
 Abigail Colson
 Alec Morton2
- 1Simul8 Corporation, Glasgow, United Kingdom
- 2Department of Management Science, University of Strathclyde, Glasgow, United Kingdom
The increasing impact of antibacterial resistance concerns various stakeholders, including clinicians, researchers and decision-makers in the pharmaceutical industry, and healthcare policy-makers. In particular, possible multidrug resistance of bacteria poses complex challenges for healthcare risk assessments and for pharmaceutical companies’ willingness to invest in research and development (R&D). Neglecting dependencies between uncertainties of future resistance rates can severely underestimate the systemic risk for certain bug-drug combinations. In this paper, we model the dependencies between several important bug-drug combinations’ resistance rates that are of interest for the United Kingdom probabilistically through copulas. As a commonly encountered challenge in probabilistic dependence modelling is the lack of relevant historical data to quantify a model, we present a method for eliciting dependence information from experts in a formal and structured manner. It aims at providing transparency and robustness of the elicitation results while also mitigating common cognitive fallacies of dependence assessments. Methodological robustness is of particular importance whenever elicitation results are used in complex decisions such as prioritising investments of antibiotics R&D.
1 Introduction
The emergence of antibacterial resistance is a pressing concern for everyone who works in and makes use of healthcare services. Addressing this issue requires coordinated action by clinical practitioners and researchers, policymakers, the pharmaceutical industry and the public. The growth in antibacterial resistance is often attributed to mis- and over-prescription of antibiotics by clinicians together with patients’ failure to follow the treatment course, or even patients’ expectation to receive antibiotics [1,2]. The prevalence of antibiotics in meat products through their frequent use in livestock [3] and environmental contamination more generally [4,5] are also important contributing factors.
Characterising our uncertainty about the future development of antibacterial resistance poses a particular challenge. Because some resistance mechanisms confer resistance to multiple drugs and can be shared across multiple pathogens and because changing resistance patterns influence prescribing behaviour, which in turn impacts the emergence and spread of resistance, we cannot regard the resistance rates of different bug-drug combinations as independent from one another. In fact, doing so would severely underestimate the risk of multidrug or even pan-resistance (the latter is the resistance to all available antibiotics). Yet, the emergence of multidrug resistance, where many or all drugs used to treat a particular infection fail simultaneously, is a worrying scenario—and one for which investment in clinical research and development (R&D) is often neglected [6].
Therefore, a better understanding of multidrug resistance, i.e., the dependency relationships between the proportions of different pathogens resistant to different antibiotics, is crucial for clinical decisions on drug prescribing together with investment and policy decisions about drug discovery. Investing into research of first- and second-line drugs1 to which a bug is already or will quickly become resistant severely undermines diversification efforts for an antibiotic’s portfolio.
In this paper, we focus on probabilistic modelling of the dependencies between future resistance rates (i.e., the percent of isolates of a given pathogen resistant to a given antibiotic) using copula models with the aim of providing a framework to better understand and model the risk of multidrug resistance and establish the value of its research. The main reason for using copulas is their modelling convenience of explicitly considering upper and lower tail dependencies in addition to central dependence strength. As such, random variables can exhibit no (or little) dependence in a joint distribution’s central region while they are strongly dependent for joint extreme values in their lower, upper or both tails [7]. Thus, this is an important feature to capture in a joint distribution as neglecting it can lead to poor understanding of the overall risk and therefore poor decision-making when events, possibly evoking joint extreme values, occur. We explain throughout this paper how this feature of copulas applies to multidrug resistance.
A common challenge when modelling dependencies probabilistically is the lack of relevant historical data for quantifying a model. When data is scarce and simplifying assumptions, such as independence, are not justifiable, eliciting dependence information from experts is the most sensible approach to risk assessment. Hence, in this paper, we consider dependencies in a subjective probability context. This means that we refer to the situation in which there are multiple uncertain quantities, future resistance rates for several bug-drug combinations, and gaining information about one changes experts’ assessment about another. In the case of independence, experts simply not change the quantity’s assessment when given information about the other. We consider the potential sources of the resistance rates’ uncertainties to be mostly of epistemic nature. That is, the uncertainties stem from an imperfect state of knowledge (see [8] for a more detailed discussion on classifying different types of uncertainty). Here, this is about the emergence of antibiotic resistance and its future development, influenced by complex, possible contributing factors, which can be known in principle but are often not well understood in practice. As such, the experts’ individual assessments and resulting copulas from the combined assessments represent the (individual and aggregate) lack of knowledge and hence uncertainty about how a certain bug-drug combination’s resistance is impacted by a change in another bug-drug pair’s resistance, i.e., their dependence. This is also shown in the experts’ rationales that are elicited together with the quantitative assessments. In the context of imperfect knowledge, note that while experts’ assessments might be influenced (partially) by the historical development of resistance and rates of resistance in the United Kingdom and other geographical areas, expert judgement is needed to evaluate the relevance of historical data in projecting the future trajectory of resistance in the United Kingdom.
A formal and structured process to dependence elicitation supports transparency and reproducibility of the expert judgement study, mitigates experts’ potential cognitive fallacies and ensures confidence in the results of modelling [9]. These are important desiderata for an elicitation process given the complex uncertainties commonly prevalent in medical decision-making (MDM) and possible misconceptions about the concept of probability in the communication of health risks in probabilistic form [10,11].
Structured Expert Judgement (SEJ) methods have been used previously in several areas of MDM (even though only univariate uncertainties were considered), for instance in health technology assessment [12–18], assessment of surgery effectiveness [19], modelling the risk and efficacy of treatment types [20] and antibacterial resistance risk assessment [21,22].
In the remainder of this paper, we present a structured process for eliciting dependence information from experts in form of conditional probabilities and we use these assessments to quantify several copula models for multidrug resistance rates. In addition to outlining the main elements of our elicitation process, we present an illustrative case study in which it has been applied for quantifying the dependence between the uncertainties of the specific bug-drug pairs’ resistance rates in the United Kingdom. This paper’s focus is on Klebsiella pneumonia and Escherichia coli isolates resistant to Carbapenems given a resistance to third generation Cephalosporins in invasive clinical isolates (i.e., bacteria taken from a body fluid that is typically sterile, like blood, in a patient with a symptomatic infection). This excludes community-acquired urinary tract, skin and soft tissue infections and other non-invasive infections. The elicitations presented here were done in summer 2017 (with each expert individually and remotely) for (at that time) future resistance rates in 2021. Our study is part of a series of studies resulting from the initiative of DRIVE-AB2 (Driving reinvestment in R&D and responsible antibiotic use) which underlines that such an application is of particular relevance for informing policy-making and guidance-setting in antibiotics research and prescribing.
The paper’s first contribution is the presentation of (according to the authors’ knowledge) one of the first applications of using expert judgement for quantifying dependencies and modelling copulas in a healthcare context, and more specifically for multidrug resistance. The second, methodological contribution is the combined application of methods addressing various aspects in an elicitation process for dependence assessments, including methods for their aggregation together with a method for supporting experts’ reasoning on the dependence relationships. Previously, the methods presented here have been introduced separately and we discuss the broader literature on assessing dependencies and elaborate on our method’s novelty and place within it later.
In the Section 2, we provide a brief overview on multidrug resistance, the risk which poses the main motivation for the illustrative case study. In Section 3, we present our method for eliciting dependence from experts and structuring their knowledge on the dependence relationships. The results of our case study elicitations together with the corresponding models are presented in Section 4. Finally, in Section 5 we briefly reflect on our method and present how it can inform policy-making and guidance provision on antibiotics’ use and research before we conclude the paper.
2 Dependence Between Uncertainties of Resistance Rates Through Multidrug Resistance
In this section, we briefly discuss the importance of considering multidrug resistance and its possible causes when discussing antibiotic resistance. This underlines the question of why an antibiotic risk assessment should account for dependencies between resistance rates.
When we use the term “resistance rate” in this paper, note that although a rate would usually refer to a frequency in a population over time, we use the term here as the percentage of bacterial isolates which tested resistant or non-susceptible to a certain drug out of all tested bacterial isolates. Hence, an estimate of it can be obtained through:
According to [23] antibiotic resistance is defined as:
“Bacteria have antibiotic resistance when specific antibiotics have lost their ability to kill or stop the growth of the bacteria. Some bacteria are naturally resistant to certain antibiotics (intrinsic or inherent resistance). A more worrying problem is when some bacteria, that are normally susceptible to antibiotics, become resistant as a result of genetic changes (acquired resistance). Resistant bacteria survive in the presence of the antibiotic and continue to multiply causing longer illness or even death. Infections caused by resistant bacteria may require more care as well as alternative and more expensive antibiotics, which may have more severe side effects.”
Following from that. [24] define multidrug resistance as a microorganism’s, such as a bacteria’s, resistance to several administered drugs even with a previous sensitivity to them. This is despite the drugs being structurally unrelated, with diverse mechanisms and having different molecular targets. Bacteria’s ability to combat antimicrobial drugs can lead to ineffective treatment and spreading of infections. Resistance to multiple antibiotics seems to be concentrated on the same strains, such that multidrug resistant strains’ frequency is higher than expected if frequencies of individual resistance determinants were randomly distributed in a population [25].
2.1 Multidrug Resistance Risk in the Past, Present and Future
Currently, around 700,000 deaths related to antibiotic resistance are recorded annually with a potential increase up to 10 million by 2050 [26,27]. While such an “antibiotic apocalypse” might be regarded as media hysteria or even scaremongering by various researchers in the field, the occurrence of multidrug resistance together with its impact on healthcare is evident (see e.g., [1,24,28]). As such, multidrug resistant infections likely lead to poorer clinical outcomes together with higher treatment costs than other infections [25].
Although resistance to individual antibiotics was observed earlier (and the underlying mechanisms have been reviewed extensively, see e.g., [26] and references therein), the first bacteria that became resistant to multiple drugs were enteric ones, such as Escherichia coli, Shigella and Salmonella. Their multidrug resistance has been observed first in the late 1950s to early 1960s. Nevertheless, at this time these discoveries did not lead to changes in health policy-making as they were regarded as of little concern. However, this changed a decade later when Haemophilus influenzae and Neisseria gonorrhoeae, organisms causing respiratory and genitourinary infections, started to develop resistance to multiple drugs. From then onwards, multidrug resistance and even pan-resistance scenarios have become established as public health concerns. For a more extensive historical overview on multidrug resistance, see. [29] and [30].
More recently, multidrug resistant pathogens such as Klebsiella pneumoniae and Pseudomonas aeruginosa isolates have appeared globally, even though the case of MRSA (methicillin-resistant Staphylococcus aureus strains) has (most arguably) attracted the most public attention [1,31]. It has been observed globally as a main cause of bacterial infections in community and healthcare settings since its initial appearance in the 1960s. To be more precise, note that methicillin is no longer in use in clinical practice, however its replacements, such as oxacillin, flucloxacillin and dicloxacillin, are still often referred to as MRSA [31]. While MRSA strains show varying resistance in different parts of the world, other occurrences of multidrug resistance pose a risk more specifically to certain global regions. For instance, while in this paper we focus explicitly on Escherichia coli and Klebsiella pneumonia resistance to Fluoroquinolones in the United Kingdom, it is estimated that in Southeast Asia and China as of 2004 about 60–70% of Escherichia coli were resistant to Fluoroquinolones in addition to five other drug families [30].
2.2 Contributing Factors for Multidrug Resistance
While multidrug resistance is a natural phenomenon [24], several factors favor its increasing development.
A first factor contributing to the rise in multidrug resistance is the misuse of antibiotics treatment [1,2]. [32] list high prescription rates of antibiotics as a main reason that has led to the emergence of multidrug resistance. In that context, they highlight that in both, hospital and outpatient settings, prescribing broad-spectrum antibiotics is often unnecessary, for example in the case of patients with viral infections and non-infectious diseases. Especially, patients with prolonged drug exposure are prone to develop multidrug resistant bacteria [30]. At the same time, the success rate for the development of antibiotics that can be used against multidrug resistant pathogens is low [32]. Further in this context. [31] mention the case of high methicillin resistance rates in Asia due to inappropriate use in form of self-medication and over-the-counter use.
Next, the rise in immunocompromised conditions, such as HIV, diabetes and organ transplants, might increase the spread of multidrug resistance due to these patients’ susceptibility to hospital-acquired infections [24].
Other influencing factors for dependence between resistance rates of bugs to several drugs stem from the transmission of resistant bacteria between agricultural animals and humans [33]. Here, the use of antibiotics in livestock for meat products is a main factor [3]. In particular the use of antibiotics in livestock for non-medical reasons, such as animal growth (see e.g., [34]), poses additional pressures on the spread of multidrug resistance. However, in this context [35] emphasize that high resistance rate correlations among humans and animals do not pose evidence for causation. This remark is of particular importance when analyzing the results of our elicitation together with the experts’ rationales (in Section 3.2). Additionally, to meat consumption, other agricultural products, such as milk [36] and fruits from trees treated with antibiotics as aerosols [34] can spread bacteria resistance to multiple antibiotics.
In addition to the misuse of antibiotics in medical treatment settings and agricultural production, multidrug resistance also increases due to broader environmental factors [4,5]. For instance, multidrug resistant bacteria have been found in municipal wastewater systems [37].
3 Structured Expert Judgment for Multidrug Resistance Rates
After having introduced the motivation for eliciting dependencies between antibacterial resistance rate uncertainties from experts and modelling these, in this section we present the main components of our SEJ process for assessing the risk of multidrug resistance. A structured process provides robust assessments as it aims to ensure several underpinning principles (see [38]). These include transparency of elicitation results (they can be reviewed by everyone, including people not involved in an assessment), fairness (experts are not pre-judged) and neutrality (elicitation methods do not bias results).
As outlined in the Introduction, our methodological contribution is the combined application of several methods which address different aspects of a dependence elicitation. In this paper, the main foci are on eliciting the resistance rates’ marginal distributions (Section 3.1), structuring the experts’ knowledge about the dependencies between resistance rates (Section 3.2.2) and eliciting dependence assessments together with combining these (Section 3.2.3 and Section 3.2.4).
3.1 Eliciting the Marginal Distributions of Antibacterial Resistance Rates
Before we elicit dependence information from experts, we first specify the marginal distributions of our variables of interest, i.e., the individual (univariate) resistance rates of the chosen bug-drug combinations. While in some cases we can quantify marginal distributions through relevant historical data, in our case we need to obtain this information from subject matter experts. This is due to the predictive nature and lack of validated predictive models for the marginal uncertainties given that we were concerned with (at the time of the elicitations) future resistance rates of bug-drug combinations, such as Klebsiella pneumonia and Escherichia coli isolates resistant to Carbapenems and third generation Cephalosporins, in the United Kingdom in the year 2021.
The elicitation method used for eliciting the marginal distributions is the Classical model (see [38,39]). Briefly, in this method the experts are asked to provide their uncertainty assessments about continuous quantities. Rather than only providing a single point estimate, they give a number of quantiles in order to capture the quantities’ uncertainty distributions. For that, the
We ask the experts to assess two types of questions. The first are calibration (or seed) questions and the second are the actual target questions. The former assessments are used for combining the experts through linear pooling in which each expert’s weight is performance-based. Thus, the answer for each calibration question is known to the analyst or will be known within the time frame of the study, but it is not known to the experts at the moment of the elicitation. An expert is regarded as a good probability assessor if the provided assessments for the calibration questions capture the true values with the correct expected relative frequencies (statistical accuracy) while the given distributions are relatively narrow (informativeness). For example, perfect statistical accuracy means that across the calibration questions half of the true values fall above the median quantiles and half fall below. 90% of the true values fall within the given 90% interval (from the 5th to the 95th quantile) and 50% of true values between the 25th and 75th quantiles. The degree of statistical accuracy is measured using a Chi-square distribution. Informativeness on the other hand takes into account how concentrated the given distributions are with respect to a chosen background distribution. For determining the overall weighting scheme, statistical accuracy is more important than informativeness, i.e., non-informative but statistically accurate assessments are still useful as this result might entail an important message regarding the overall uncertainty in the field.
As such, the Classical model produces a single distribution by taking a weighted combination of expert distributions, where the weights are performance-based.
3.2 Eliciting and Modelling the Dependence Between Antibacterial Resistance Rates
With the marginal distributions of the individual resistance rates specified, we can now elicit and then model the drug-bug pair dependencies.
Eliciting probabilistic dependencies through expert judgement has been done previously for quantifying different models in various application areas. [9,42] provide extensive overviews on common dependence models and on eliciting dependence information for these in form of several association measures.
As mentioned in the introduction, in this paper we apply a method to elicit dependence information for choosing parametric copula forms that fit the experts’ assessments suitably well (we introduce copula theory in more detail in the Section 3.2.1). This is different to other methods eliciting information for modelling with copulas. For instance [43]. [44] and. [45] present modelling and elicitation approaches for minimum information copulas which do not assume a specific parametric copula form. Similarly, [46] introduce an expert judgement method for quantifying Diagonal Band copulas. Some papers, which also consider the specification of parametric copulas through expert judgement, are: [47] assessing the fit of experts’ judgements to a Gumbel and Gaussian copula (with a given rank correlation) resulting from historical data in the context of analysing extreme precipitation; [48] eliciting a Gaussian copula as a prior distribution to specify multinomial models while overcoming deficiencies of its common conjugate prior distribution of a Dirichlet distribution; [49] eliciting information from experts about possible conditions of an engineering structure for specifying a Vine copula as prior distribution to multinomial models; [50] discussing both, Gaussian and Vine copulas as priors for multinomial models; [51] using a preliminary version of the one presented here in a financial planning context of a higher education institution. Nevertheless, the main part of the dependence elicitation literature is on quantifying Bayesian Belief networks [52].
Regarding possible elicited association measures. [53] and [54] provide comparisons and overviews of eliciting dependence information in different forms, such as conditional and joint probabilities or also correlation coefficients. We elicit dependence information in the form of conditional exceedance probabilities. These consider the assessment of the variable of interest exceeding chosen quantiles (similar to the previous case of eliciting the marginal distributions) however, conditional on another variable of interest doing so for its own corresponding distribution. Conditional exceedance probabilities have been proposed before as a suitable way for eliciting dependence information from experts (see [55] and references therein). In applications. [56] and. [57] elicit conditional exceedance probabilities (together with conditional rank correlations) to quantify non-parametric Bayesian Belief networks [58].
Lastly, most of the above references do not include the aggregation of multiple dependence assessments. Only [57] and [47], with summaries presented in. [42], consider this in more detail by introducing a dependence calibration score which is also used later in this paper.
Before we present our method, we introduce copulas in more detail next.
3.2.1 Probabilistic Modelling of Multidrug Resistance Dependencies: Background on Copulas
Various ways to probabilistically model the dependence between resistance rates can be chosen, and each offers certain modelling conveniences and captures specific aspects of the dependence relationships. For example, graphical models, such as Bayesian (belief) nets [52], can allow for a high involvement even of non-statistical experts in determining the (structural) dependence relationships. Other dependence models, such as regression models, explain and quantify dependencies through auxiliary variables which can offer a way to assess dependence through only a low number of assessments and hence (in some cases) a convenient quantification of their uncertainties. [9,42] discuss the applicability of dependence models in certain modelling contexts and their influence on the expert judgement process in more detail.
In this paper, we use a copula approach to model the dependencies in a way that captures the experts’ assessments. We refer to [59], [60] and [61] for an introduction to copula theory and advanced discussions. Briefly, recall that (in two dimensions)
As mentioned in the introduction, a main reason for choosing a copula approach is the possibility of explicitly accounting for upper and lower tail dependencies. For a pair of random variables, tail dependence measures their joint movement in the distribution tails [60]. Formally, upper tail dependence (for the later chosen parametric forms which are of interest in this paper) is defined as:
when a limit
We use it later to distinguish our different copula choices.
Several common parametric copulas can be grouped either into the Elliptical copula class or the Archimedean one. Copulas in the former class are radially symmetric. Copulas in the latter class can capture upper and lower tail dependence explicitly [7]. The case of multidrug antibacterial resistance (Section 2) highlights the importance of identifying especially potential asymmetric, upper tail dependencies as the spread and increase of resistance affecting multiple drugs shows a possibly prevalent systemic risk.
Next, we briefly introduce and define the parametric copula forms that are chosen later in the case study based on a good fit to the experts’ assessments and for comparison.
A common Elliptical parametric copula choice, for which a main property is tail independence, is the Gaussian copula, defined as:
Here,
Another Elliptical copula chosen in the case study is the Student-t copula:
with
A common Archimedean parametric copula relevant for our case study, which exhibits asymmetric, upper tail dependence, is the Gumbel copula. It is defined as:
and parameterized by
Another one of our Archimedean parametric copula choices with asymmetric, upper tail dependence is the survival Clayton copula. For this, note first that for a copula
These types of copulas do not model different dependence characteristics, but rather are flipped functions of other copulas. Hence, the Clayton copula (with possible lower tail dependence) is defined as:
which leads to the corresponding closed form of the survival Clayton copula with possibly upper tail dependence of:
Other choices considered in our case study are the Joe copula:
which again offers the option to model (asymmetric) tail dependence explicitly and the Frank copula, defined as:
which is an Archimedean copula offering a symmetric dependence structure with possible tail dependence.
3.2.2 Structuring Experts’ Knowledge About Resistance Rate Dependencies Through Conditional Scenarios
In the later case study, all assessments are made in a conditional probability form as we regard it as more intuitive than eliciting other dependence parameters. For instance, joint probabilities are cognitively difficult to conceptualise and understand by experts [53] while correlation coefficients are only reliably assessed directly for dependence relationships in which experts get frequent feedback [62]. Nevertheless, assessing dependencies in the form of conditional probabilities that then serve as inputs for a copula, can be cognitively challenging for experts. For instance. [45] present an application of refining conditional probability assessments in the form of
Before presenting this method, we briefly explain which cognitive fallacies are common when assessing conditional probabilities, the assessment form chosen in the illustrative case study.
While it is common to conceptualise probabilistic dependence through conditionality (see e.g., [9]), studies show that not only specific cognitive fallacies can easily occur by using that form, but that understanding and interpreting conditionality is (still) a challenge in today’s statistics and probability education [63].
Some specific cognitive fallacies, which are of particular relevance for conditional probabilities, are confusion of the inverse [64–66], confusion of joint and conditional probabilities [67] and the causality heuristic [68,69]. An extensive introduction to these and other cognitive fallacies for assessing dependencies can be found in. [42]. Briefly, these fallacies can affect dependence judgements as follows.
The confusion of the inverse states that experts might confuse an elicited conditional probability
The confusion of joint and conditional probabilities is often explained by the semantic misinterpretation of “and”. It might be interpreted by some experts as an indicator of temporal order instead of the intersection of two events. As such, they might assess a joint probability instead of an elicited conditional one or just experience confusion more generally. In the case of dependent resistance rates, (unwillingly) assessing the joint probability between two bug-drug combinations instead of a conditional probability can result in a severe underestimation of the multidrug resistance risk as an expert would typically assess a joint extreme event with a very small probability while, in a conditional scenario, systemic risks actually increase the extreme event’s probability.
Lastly, the causality heuristic refers to experts’ mental (causal) models about dependence relationships and how a preference for seeking causal explanations, reasoning from causes to effects, can affect a conditional probability assessment. For instance, it is problematic if non-causal information, such as a base-rate with no causal implication, is neglected in an assessment due to such a preference. Further, [69] shows that people assess relationships presented as cause to effect as more probable than when presented from effect to cause. This shows again how causal information, presented in a specific format, might bias an assessment in a certain way. When we discuss the results of the elicitation together with the experts’ conditional scenarios underlying their assessments, various causal and non-causal rationales are given.
As a way to mitigate these cognitive fallacies and improve experts’ understanding of the conditional judgements, we use a conditional scenario mapping method introduced in [51] as a step prior to making quantitative assessments. For that, we regard scenarios as “sequences that link triggering events to specified consequences or final states through intermediate conditions”. We refer to [51] for a detailed definition. Thus, the experts were first presented with the final state for the event that we condition onto, i.e., a bug’s resistance to third generation Cephalosporins being higher than either its
3.2.3 Eliciting Dependence Between the Resistance Rates
The following elicitation process might be regarded as a pragmatic approach to modelling dependence as the final copula model is only based on a low number of assessments. Nevertheless, we argue that the following elicitation method and the resulting model offer a good balance between assessing detailed dependence information on the one hand, e.g., it includes the behaviour of the random variables in the extreme parts (tails) of their joint distribution, and on the other hand ensuring a low cognitive complexity for experts. Further, it can be easily extended if we felt necessary to include more quantile assessments for finding a fitting copula.
The part of the elicitation process that focuses on eliciting the target variables is briefly described in the following steps. In addition to presenting the elicited conditional probabilities together with the framing of their elicitation questions, Figure 1 shows the elicited part of the distribution schematically. On the left, the elicitation of the conditional median is shown while on the right of Figure 1 the elicitation of the conditional 95th quantile is displayed. The light and dark grey areas combined show the unconditional distribution parts while the dark grey areas give the conditional distribution.
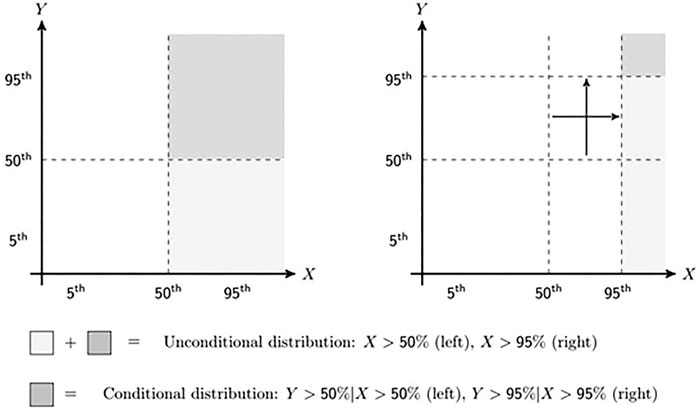
FIGURE 1. Schematic representation of elicitation sequence with first assessment on the left and last on the right.
The complete elicitation protocol, including all elicitation questions and training material given to experts, can be found in the Supplementary Material.
1) First, we elicit the conditional median in the form of
“For the year 2021, given that in the United Kingdom the rate of Escherichia coli isolates resistant to third generation Cephalosporins is higher than 16.21% [
The quantile values come from the previous elicitation of the marginal distributions (Section 3.1) and correspond to the resulting DM combinations. Thus, all experts condition onto the same quantile values and their assessed conditional probabilities are comparable. A prerequisite is that the experts agree on the resulting marginal distributions (from the DM combination). Therefore, as preparation to the dependence elicitation, it is important to introduce experts to the marginal distributions, explain how they are derived and clarify any questions on agreement to these. As we elaborate later on in more detail, in our case the experts were also included in eliciting the marginal distributions, so we reminded them about these results and how they were obtained. Note that the process - first combining expert judgements to obtain single marginal distributions for each unknown quantity and then asking for further judgements about dependency—ensures that we can sensibly aggregate the expert assessments [42].
2) As an intermediate step, we then vary the conditional variables, typically to explore a single distribution tail, i.e., the more extreme scenarios for one variable, more explicitly. For that, we elicit the conditional probability of
“For the year 2021, given that in the United Kingdom the rate of Escherichia coli isolates resistant to third generation Cephalosporins is higher than 38.59% [
3) In a similar way, we now vary the other quantile, so that both refer to their distribution tail, i.e. the joint tail dependence for which we elicit
“For the year 2021, given that in the United Kingdom the rate of Escherichia coli isolates resistant to third generation Cephalosporins is higher than 38.59% [
4) With the above assessments in place, we can now compare each expert’s judgements with different parametric copula forms. We already stressed that we consider our method of fitting a parametric copula to an expert’s assessments to be pragmatic. This is due to the low number of assessments that we base our chosen parametric copula together with its parameters, i.e. dependence strength, onto. For instance, here we only use the assessments of
(⁃) First, note that we can generate
(⁃) Here, we generate the conditional probabilities for the
(⁃) Next, we compare an expert’s assessments for these two conditional probabilities with the ones of the various parametric copulas and choose the parametric copula together with its parameter(s) for which the (absolute) distance of the assessments to the generated points is minimized.
(⁃) If more than one copula choice fits equally well, we either use linear interpolation for obtaining more points between an expert’s assessments or we elicit another quantile from an expert and do another comparison. The latter is usually more appropriate when experts’ assessments indicate low or no tail dependence as for these the tail dependence function is not as linear as it is for high tail dependence. However, including more quantiles can result in overspecified copulas, i.e. incoherent assessments, for which no parametric form fits. Figures 4, 5 show the comparison of parametric copulas at the
3.2.4 Aggregating Dependence Assessments From Various Experts
In many expert judgement studies, it is of interest to elicit assessments from more than one expert in order to capture a broader range of knowledge and beliefs about the uncertainties of interest. Whenever we elicit assessments from more than one expert, an important question concerns how to aggregate several judgements in a sensible way. Some methods are based on behavioral aggregation. Proponents of these methods advocate experts should achieve a consensus opinion for the variable of interest. Other methods combine experts’ judgements mathematically. French (2010) discusses advantages and disadvantages of both approaches in detail. For instance, for behavioural aggregation methods, group-think, i.e., experts trying to avoid discussion and conflict about elicited result, might be a concern. In our case study we only consider mathematical aggregation methods. The main reasons are that, first, our elicitations were done remotely and individually with each expert (we present the elicitations’ details in more detail later) and mathematical aggregation was more practical in that case. Second, only few research results on mathematical aggregation approaches for dependence assessments exist and we aim to contribute to this literature. Constructing aggregations using various methods allows for comparing the methods’ impact on the elicited assessments and hence offers more insight on the sensitivity of the resulting copula choices to them. This is of interest, not just for increasing transparency for decision-makers in antibiotics’ R&D investment, who base their decisions on the dependence models, but it also offers a way to provide more detailed feedback to the experts of our elicitations about how their assessments propagate to the model output. Both points are of particular importance considering that the topic of aggregating dependence assessments is not well explored in the expert judgement literature.
3.2.4.1 Equal Weighting
A first way to construct a linear pool of combined assessments is by using an equal weighting scheme. In other words, we simply assign each expert the same weight so that the aggregated outcome is simply the average of all assessments. In the context of dependence elicitation, [73] show that statistical accuracy for directly elicited correlation coefficients increased within an equally weighted linear pool of experts as the number of experts increased. Nevertheless, in the same study [73], it is shown that the difference in statistical accuracy for the top performing experts (as measured by the mean absolute error of assessments) is yet considerably better than the equally weighted pool, a finding which motivates further investigation into performance-based pooling methods.
3.2.4.2 Performance-Based Weighting: Cooke’s Classical Model
Another way of combing expert judgments is through the weights determined by the earlier calibration questions for the marginal distributions (Section 3.1). In other words, we assume that each expert’s performance on the previous calibration questions together with the resulting weights not only reflects their ability to assess marginal probabilities, but to make accurate probabilistic assessments more generally, also about probabilistic dependencies. While some research [47,57] suggests that experts who perform well with the Classical model cannot be regarded as good dependence assessors, we remark that these are indicative results which is why we include a linear pool weighting scheme based on the previous marginal probability calibration questions.
3.2.4.3 Performance-Based Weighting: Dependence Calibration Score
The last aggregation method requires the elicitation of calibration variables on dependence relationships in addition to the actual target variables. This is similar to the Classical Model, even though an information score is not derived. Experts’ assessments are then combined based on a dependence calibration score which is introduced by [57] while an extensive discussion of this measure is given in [47] and [9,42]. It uses the Hellinger distance to measure the divergence of the copula resulting from an expert’s calibration assessments to the copula fitted from the actual values (realisations). Formally, the Hellinger distance [74] between the copula from the actual realisations
The dependence calibration score is simply:
The score is 1 when experts’ assessments correspond exactly to the realisations and is lower otherwise, with 0 being the worst score. Lastly, experts’ weights are normalized and then used for a combination similarly to the Classical Model and a cut-off level to exclude experts with lower scores can be included in the same way.
The data used for calibration purposes and hence for fitting a copula from the actual realisations
Our first type of calibration question is:
“Given that in the United Kingdom in 2015, the rate of resistance for Escherichia coli isolates to third generation Cephalosporins was above its median of 10.09% (2010–2015), what is the probability that the rate of resistance for Escherichia coli isolates to Carbapenems was also above its median of 0.433%?”
This type of calibration question together with its framing is based on the dependence over time, i.e. the median (and other quantiles) resistance rates are obtained across the years from 2010 to 2015.
For the second type of calibration question, we ask:
“Given that the United Kingdom in 2015, the rate of resistance was below the European (Italy, Spain, France, United Kingdom) median of 25.43% for the rate of resistance of Escherichia coli isolates to third generation Cephalosporins, what is the probability that it is also below the median (1.23%) for Escherichia coli isolates to Carbapenems?”
The second type of calibration question considers the dependence over various countries but within the same year. Table 1 shows all calibration results together with their fitted copulas.
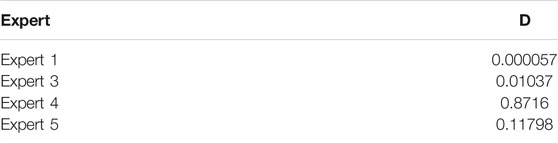
TABLE 1. Experts’ weights from dependence calibration score.
The resulting experts’ weights for
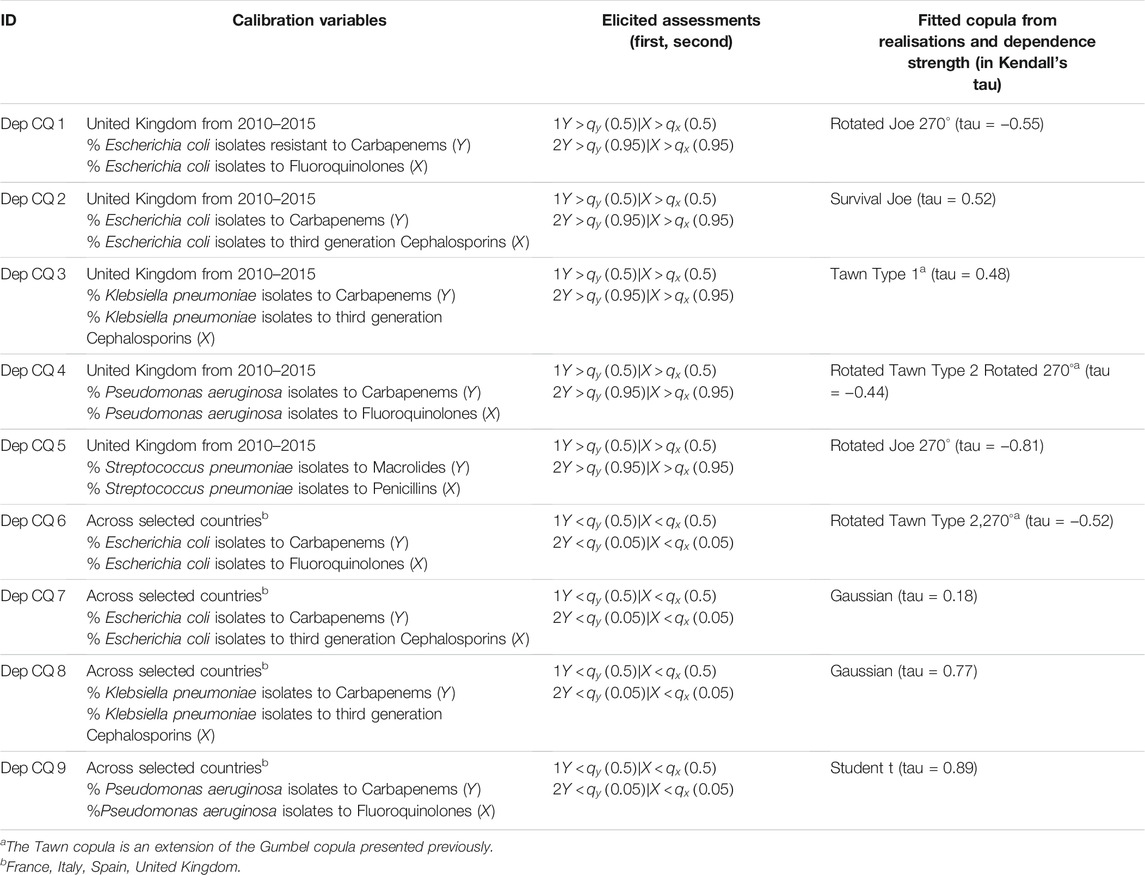
TABLE 2. Provides an overview of all calibration variables together with the fitted copulas from the realisations. We used the R packages “VineCopula” [71] and “Copula” [72] to identify the corresponding best-fitting copulas and parameters according to maximum likelihood estimation.
4 Elicitation Results of Illustrative Case Study: Future Multidrug Resistance in the United Kingdom
After having presented the main components of our dependence elicitation process, in this section we present the corresponding results. In accordance with the previously presented calibration and target questions, in the following we show the results for the dependence between invasive clinical Escherichia coli isolates’ resistance to third generation Cephalosporins and its resistance to Carbapenems. For a complete overview of the case study results including the other bug-drug combination of Klebsiella pneumonia to the same drugs, which also has been considered relevant for the United Kingdom, we refer to. [21], [77] and the Supplementary Material.
In total, six experts participated in the elicitation of the marginal distributions (see [21]) while four (of them) participated in the dependence elicitation (Expert 1, 3–5). Experts were identified initially through recommendations by colleagues in DRIVE-AB. Identified experts were then asked for recommendations of other experts in the area, and the process was repeated until no new names were provided. This process is also known as snowballing [78]. Regarding our experts’ backgrounds, relevant areas of expertise for the elicitations include public health, epidemiology, microbiology and (clinical) infectious diseases. Further, it is desirable that experts understand resistance rate development broadly and therefore have experience in antimicrobial resistance at a macro level (instead of solely clinical or laboratory experience). All our experts meet these expertise requirements and desiderata. All experts have a broad subject matter expertise ranging from clinicians with daily experience of prescribing antibiotics and overseeing infectious disease programs to epidemiologists and health protection specialists focused on antibiotic resistance in the United Kingdom. Even though, antimicrobial resistance can have environmental and veterinary factors (see Section 2), we did not recruit experts with this expertise but with knowledgeable in human health.
We elicited the marginal distributions and dependence from each expert in separate expert judgement sessions. Figures 2, 3 show the elicited marginal distributions for the resistance rate in 2021 of the bug-drug pairs of Escherichia coli isolates to Carbapenems and Escherichia coli isolates resistant to third generation Cephalosporins accordingly. In addition to each expert’s individual assessment, we show the performance-based combination according to the Classical model (DM) and the equal weight combination (EW).
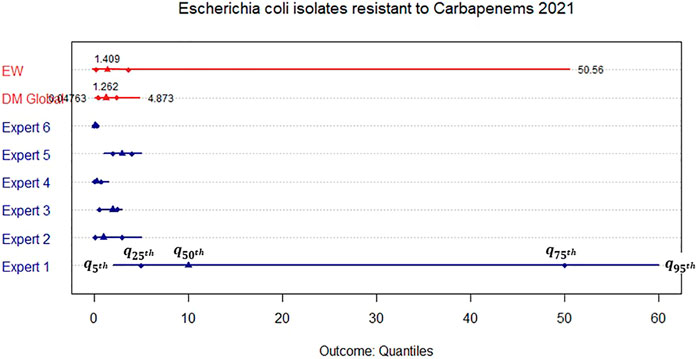
FIGURE 2. Elicited marginal distribution (5th, 25th, 50th, 75th, and 95th quantile) for the rate of resistance of Escherichia coli isolates resistant to Carbapenems in the United Kingdom in 2021.
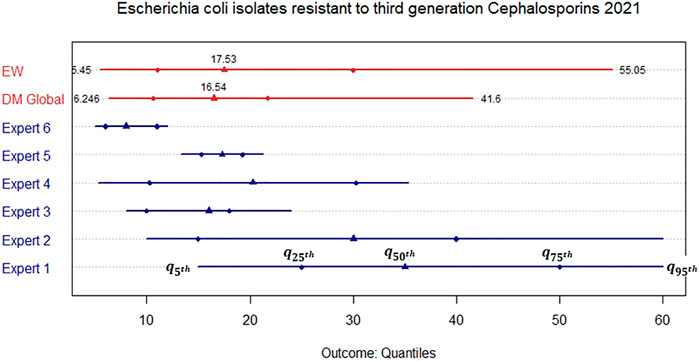
FIGURE 3. Elicited marginal distribution (5th, 25th, 50th, 75th, and 95th quantile) for the rate of resistance of Escherichia coli isolates resistant to third generation Cephalosporins in the United Kingdom in 2021.
We observe that for resistance to Carbapenems, all experts apart from Expert 1 assess narrow distributions while their medians are close to each other. This is reflected in both combinations through similar median values. Nevertheless, the DM is much more informative than the EW combination as Expert 1 receives less weight in the former. For the resistance to third generation Cephalosporins, the assessments are less in agreement and we therefore obtain a much wider DM distribution even though it is still more informative than the EW combination.
Based on the elicitation results for the marginal distributions, we then elicited the dependence between both resistance rates according to the procedure in Section 3.2.2. Figure 4 shows each expert’s assessment on the dependence between the (at the time of the elicitation) future resistance rates of the bug-drug pairs together with some fitted parametric copula choices. Similarly, Figure 5 presents the combined assessments (for each of the different aggregation methods), again together with the fit of various parametric copulas.
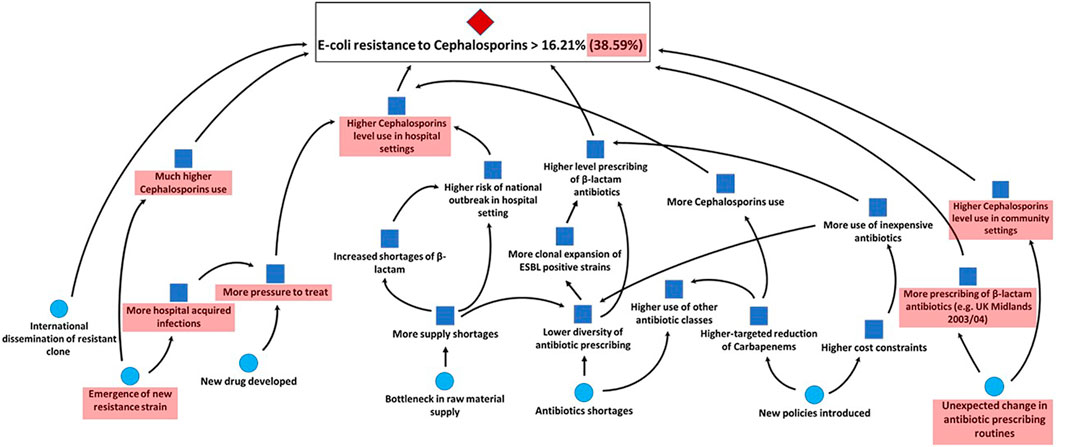
FIGURE 4. Elicited conditional exceedance probabilities for the 50th and 95th quantiles (per expert) with fitted copulas through the tail dependence coefficient for u between 0.5 and 1.
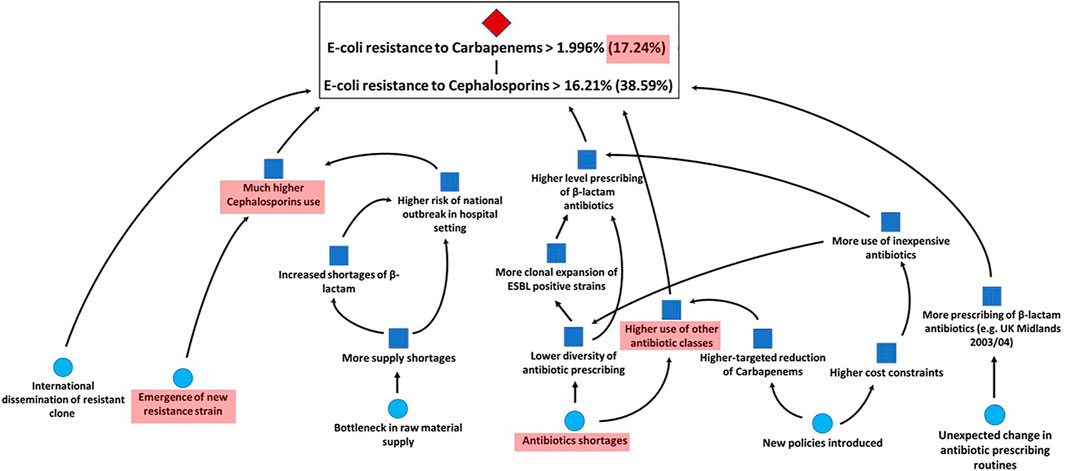
FIGURE 5. Combined conditional exceedance probabilities for the 50th and 95th quantiles (per weighting scheme) with fitted copulas through the tail dependence coefficient for u between 0.5 and 1.
We observe that the experts’ assessments and resulting best fitting copulas differ considerably. Two experts’ best fitting copulas are symmetric, Expert 1’s assessments result in a Frank copula with rank correlation 0.92 and Expert 5’s assessments correspond to a Gaussian copula with a rank correlation of 0.68 or alternatively a Student-t copula with rank correlation 0.67 and 8 degrees of freedom. The other two experts’ assessments fit asymmetric copulas with upper tail dependence. Expert 3’s assessments correspond to a Joe copula with rank correlation of 0.46 or alternatively, a Survival Clayton copula with rank correlation of 0.47. Expert 4’s assessments match a Gumbel copula with rank correlation of 0.44. In contrast to these individual differences, we see that the combined assessments for all aggregation methods result in Archimedean copulas with upper tail dependence (Joe and Survival Clayton copulas with rank correlations 0.44 and 0.45 accordingly for the performance-based weighting schemes and a Gumbel copula with rank correlation of 0.54 for equal weighting). Table 2 We observe that tail independent copulas, such as the Gaussian copula, do not fit well. Table 3 summarises the assessment results.
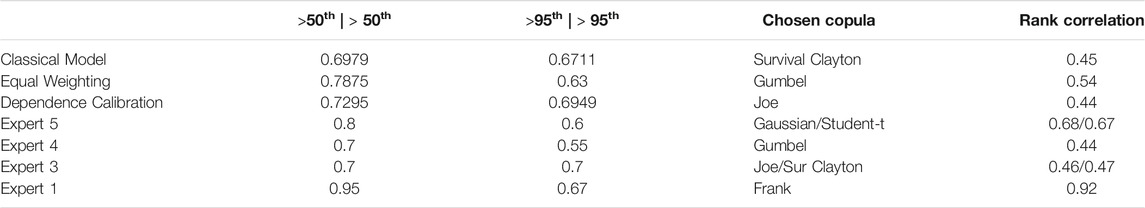
TABLE 3. Individual and combined dependence assessment results.
As mentioned in Section 3.2.3, this is a pragmatic way of eliciting dependencies given the low number of quantiles used for fitting copulas. While we acknowledge this, we can see that all aggregation methods fit well with copulas exhibiting upper tail dependence. Thus, we do not further distinguish between these results, but rather conclude that this indicates a possible systemic risk between our chosen bug-drug resistance rates given this upper tail dependence.
The results of the aggregated assessments are supported by the experts’ combined rationales. Each expert’s assessment has been supported by the conditional scenario mapping method presented in section 3.2.2. We then combined all rationales and fed these back to the experts for sharing their overall knowledge and giving them a possibility to adjust their assessments. While no expert modified their assessments, all agreed on the combined unconditional and conditional scenarios for the previously discussed bug-drug combinations shown in Figures 6, 7. We can see which trigger events for the unconditional probability space are impacting the conditional one together with the sub-set of events which are still relevant for the extreme (95th quantile) scenarios (in the red shaded areas). For instance, we observe that a main scenario for upper tail dependence between Escherichia coli resistance to third generation Cephalosporins and Escherichia coli resistance to Carbapenems is the potential emergence of a new strain. A new strain may mean that the United Kingdom’s approach to reduce prescribing of Carbapenems and third-generation Cephalosporins through setting targets within the National Health Service (NHS) is no longer sufficient to keep prescribing levels low and prevent resistance rates from increasing. Other scenarios supporting upper tail dependence consider trigger events that lead to a higher beta-lactam antibiotics’ use and bottlenecks in the raw material supply chain. A scenario countering possible tail dependence is that Carbapenem use might decrease until 2021 which then leads to an increase in the use of third generation Cephalosporins.
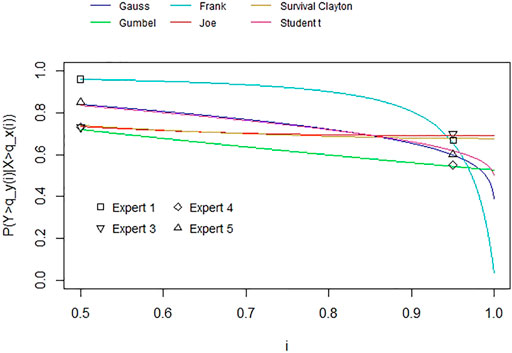
FIGURE 6. Combined unconditional scenario of all experts for Escherichia coli resistance to third generation Cephalosporins in the United Kingdom in 2021.
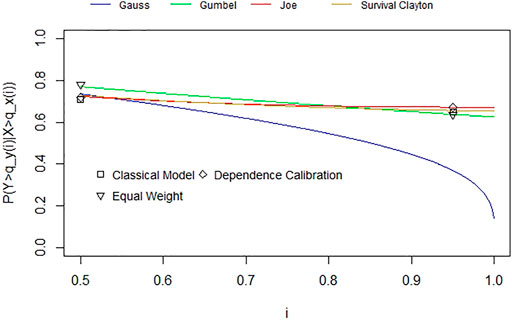
FIGURE 7. Combined conditional scenario of all experts for Escherichia coli resistance to Carbapenems in the United Kingdom in 2021.
5 Conclusion and Discussion on Informing the Value of Future Antibiotics’ R&D
In this paper we have addressed the challenge of using quantitative risk assessment techniques to model future antibacterial resistance to multiple drugs. Given the lack of relevant historical data for quantifying a probabilistic dependence model in this context, we have presented a SEJ process for eliciting dependencies between future resistance rates uncertainties. Proposing such prescriptive decision-aiding methods is in line with the trend that decision models are gaining importance and acceptance as formal methods to inform health policy-making [79].
Before we discuss the elicitation results in the context of antibiotics’ R&D and the potential benefits of using expert judgement on probabilistic dependencies for informing prioritization efforts, we briefly reflect on some learning points from the elicitations themselves.
A first learning point is that the chosen expert judgement methods worked well for eliciting 1) the marginal uncertainties on the resistance rates and 2) their probabilistic dependencies. As such, the assessed calibration questions (for both) show that the experts were able to make the required assessments sensibly (i.e., most experts being well-calibrated) and for the latter that they were able to do so in form of conditional exceedance probabilities. In addition to this empirical validity from the calibration assessments, no expert mentioned any difficulties with making the required assessments nor with interpreting the elicitation questions. With regards to the target variables, the resulting scenario maps (Section 4) additionally indicate that the experts were able to address the complex uncertainties around the (at the time of the elicitation) future resistance rates.
Nevertheless, in future elicitations it is desired to increase the number of experts and gauge the potential benefit of including more experts for a possibly better understanding on the complex uncertainties around resistance rates’ development. This is despite the general indication in the expert judgement literature that diminishing returns to accuracy improvements for including additional experts (after a certain number) have been reported [78].
As another learning point from the scenario maps, we observe that mainly clinical factors have been considered for the quantitative assessments of the resistance rates’ dependencies. While we did not restrict or encourage our experts to specifically consider clinical factors, it shows that in future research including experts with different backgrounds is desirable to address and model dependencies for multidrug resistance. This could allow for capturing the impact of antibiotics’ use in livestock for instance in addition to clinical factors.
In the introduction, we mention that a main motivation for our case study is to offer a method that informs decision-makers who manage a portfolio of antibiotics and make decisions about adding new ones to it through R&D investments. In this context, a main result of our case study is the identification of possible upper tail dependencies between certain bug-drug resistance rates, indicating a potential systemic risk which negatively affects the usefulness of some common first- and second-line drugs against their corresponding bugs. As a learning from our illustrative case study, we will now briefly discuss more generally how our findings and structured dependence elicitation can be used in medical decision-making informing policy-making in this area.
In the last decade, several countries have put forward prioritization efforts for understanding the threat of antibiotic resistance with regards to their national public health relevance, such as the Public Health Agency of Sweden in 2011, the United States Centers for Disease Control and Prevention in 2013, the Public Health Agency of Canada in 2015 and the World Health Organization (WHO) in 2016 [6]. From these, the WHO priority lists aim at being the first global effort in prioritizing the R&D of new antibiotics, including against multi-drug resistant bugs. In order to achieve this. [6] use a multicriteria decision analysis. We propose that SEJ elicitation on the marginal and dependent uncertainties for future resistance rate complexities together with the resulting dependence models can be of particular value in identifying the risk of multidrug resistance and hence inform and support such efforts. In that context, as mentioned in point 5 of the process described in Section 3.2.3, note that our method can be extended easily by including more elicited quantiles of the upper and if desired also lower tail. That way, we can identify more unique or also different copulas from Figures 4, 5 which currently show the tail dependence coefficient along all upper quantiles. As such, for some bug-drug combinations we might require the elicitation of the conditional 75th or 90th quantiles as well.
Furthermore, the methods we applied in this study aim at supporting other quantitative risk assessments in the area of antibiotic resistance risk. An example for the importance of developing new methods that address current challenges to understand risks, such as that of multidrug resistance, is given by. [80]. He highlights the advantage of quantitative risk assessments for informing policy-making on the veterinary use of antibiotics by comparing the different outcomes of a precautionary policy in Europe, based on qualitative concerns, and one informed by quantitative methods in the United States From 1996 to 2004, Europe experienced a significant increase in foodborne illnesses after its precautionary policy of banning several antibiotics for animal use while at the same time the United States saw a decrease. Similarly, and referring to the term “concern-driven risk management”, [81] criticises the WHO for basing their recommendations and guidance to identifying critically important antibiotics and thus prioritising R&D activities on qualitative levels of concern. This means that risk-based decisions are taken if a regulatory agency “is sufficiently concerned about risks from current human behaviours” (such as antibiotic use) rather than considering quantitative modelling methods. In fact, quantitative risk assessment methods are deemed “inadequate” due to the uncertainty and complexity in the field of antibiotic resistance. In this case, our method provides a way of addressing such modelling challenges and provide evidence-based decisions.
Data Availability Statement
The original contributions presented in the study are included in the article/Supplementary Material, further inquiries can be directed to the corresponding author.
Author Contributions
CW and AC conducted the dependence elicitation together with the later analysis of the results. CW prepared the resulting copula models. CW, AC, AM, and TB wrote the final manuscript for this paper.
Funding
The research leading to these results has received support from the Innovative Medicines Initiative Joint Undertaking under grant agreement n°115618 (Driving re-investment in R&D and responsible antibiotic use, DRIVE-AB, www.drive-ab.eu), resources of which are composed of financial contribution from the European Union’s Seventh Framework Programme (FP7/2007–2013) and EFPIA companies’ in kind contribution. The funders had no role in study design, data collection and analysis, decision to publish, or preparation of the manuscript.
Conflict of Interest
Author CW is employed by Simul8 Corporation. The company was not involved in the study design, collection, analysis, interpretation of data, the writing of this article or the decision to submit it for publication.
The remaining authors declare that the research was conducted in the absence of any commercial or financial relationships that could be construed as a potential conflict of interest.
The handling editor declared a past collaboration with one of the authors TB.
Publisher’s Note
All claims expressed in this article are solely those of the authors and do not necessarily represent those of their affiliated organizations, or those of the publisher, the editors and the reviewers. Any product that may be evaluated in this article, or claim that may be made by its manufacturer, is not guaranteed or endorsed by the publisher.
Acknowledgments
We would like to thank the experts participating in the elicitations and the reviewers for the valuable feedback on improving the initial version of this manuscript. Lastly, we would like to thank the initiatives mentioned in the Funding section.
Supplementary Material
The Supplementary Material for this article can be found online at: https://www.frontiersin.org/articles/10.3389/fams.2021.669391/full#supplementary-material
Footnotes
1First-line drugs are the drugs that are typically the first, recommended option to be administered for a specific disease, usually because they have fewer side effects, promise higher clinical effectiveness, are easier to administer, and/or are cheaper than alternative treatments. Second-line drugs are the “second choice” option if the first-line drugs are ineffective, show side effects, or are contraindicated.
2DRIVE-AB is a project funded by the Innovative Medicines Initiative aiming to identify new economic models for addressing the R&D and optimal use of new classes of antibiotics. See: http://drive-ab.eu/.
References
1. Cox, JAG, and Worthington, T The 'Antibiotic Apocalypse' - Scaremongering or Scientific Reporting. Trends Microbiology (2017) 25(3):167–9. doi:10.1016/j.tim.2016.11.016
2. Broniatowski, DA, Klein, EY, and Reyna, VF Germs Are Germs, and Why Not Take a Risk? Patients' Expectations for Prescribing Antibiotics in an Inner-City Emergency Department. Med Decis Making (2015) 35(1):60–7. doi:10.1177/0272989x14553472
3. Vieira, AR, Collignon, P, Aarestrup, FM, McEwen, SA, Hendriksen, RS, Hald, T, et al. Association between Antimicrobial Resistance inEscherichia coliIsolates from Food Animals and Blood Stream Isolates from Humans in Europe: An Ecological Study. Foodborne Pathog Dis (2011) 8(12):1295–301. doi:10.1089/fpd.2011.0950
4. Larsson, DGJ, Andremont, A, Bengtsson-Palme, J, Brandt, KK, de Roda Husman, AM, Fagerstedt, P, et al. Critical Knowledge Gaps and Research Needs Related to the Environmental Dimensions of Antibiotic Resistance. Environ Int (2018) 117:132–8. doi:10.1016/j.envint.2018.04.041
5. Berendonk, TU, Manaia, CM, Merlin, C, Fatta-Kassinos, D, Cytryn, E, Walsh, F, et al. Tackling Antibiotic Resistance: the Environmental Framework. Nat Rev Microbiol (2015) 13(5):310–7. doi:10.1038/nrmicro3439
6. Tacconelli, E, Carrara, E, Savoldi, A, Harbarth, S, Mendelson, M, Monnet, DL, et al. Discovery, Research, and Development of New Antibiotics: the WHO Priority List of Antibiotic-Resistant Bacteria and Tuberculosis. Lancet Infect Dis (2018) 18(3):318–27. doi:10.1016/s1473-3099(17)30753-3
7. Embrechts, P, McNeil, AJ, and Straumann, D Correlation and Dependence in Risk Management: Properties and Pitfalls. Risk Manag value Risk beyond (2002) 1:176–223. doi:10.1017/cbo9780511615337.008
8. Bedford, T, and Cooke, R Probabilistic Risk Analysis: Foundations and Methods. Cambridge: Cambridge University Press (2001).
9. Werner, C, Bedford, T, Cooke, RM, Hanea, AM, and Morales-Nápoles, O Expert Judgement for Dependence in Probabilistic Modelling: a Systematic Literature Review and Future Research Directions. Eur J Oper Res (2017) 258(3):801–19. doi:10.1016/j.ejor.2016.10.018
10. Eyler, RF, Cordes, S, Szymanski, BR, and Fraenkel, L Utilization of Continuous “Spinners” to Communicate Risk. Med Decis Making (2017) 37:725–9. doi:10.1177/0272989x17707198
11. Cuite, CL, Weinstein, ND, Emmons, K, and Colditz, G A Test of Numeric Formats for Communicating Risk Probabilities. Med Decis Making (2008) 28(3):377–84. doi:10.1177/0272989x08315246
12. Vella Bonanno, P, Morton, A, and Godman, B Structured Expert Judgement for Decisions on Medicines Policy and Management. In: AM Hanea, GF Nane, T Bedford, and S French, editors. Expert Judgement in Risk and Decision Analysis. Cham: Springer International Series in Operations Research and Management Science (2021). p. 419–39. doi:10.1007/978-3-030-46474-5_19
13. Soares, MO, and Bojke, L Expert Elicitation to Inform Health Technology Assessment. In: LC Dias, A Morton, and J Quigley, editors. Elicitation: The Science and Art of Structuring Judgement. Cham: Springer International Series in Operations Research and Management Science (2018). p. 479–94. doi:10.1007/978-3-319-65052-4_18
14. Bojke, L, Grigore, B, Jankovic, D, Peters, J, Soares, M, and Stein, K. Informing Reimbursement Decisions Using Cost-Effectiveness Modelling: A Guide to the Process of Generating Elicited Priors to Capture Model Uncertainties. Pharmacoeconomics (2017) 35:867–77. doi:10.1007/s40273-017-0525-1
15. Grigore, B, Peters, J, Hyde, C, and Stein, K. A Comparison of Two Methods for Expert Elicitation in Health Technology Assessments. BMC Med Res Methodol (2016) 16(1):85–11. doi:10.1186/s12874-016-0186-3
16. Soares, MO, Bojke, L, Dumville, J, Iglesias, C, Cullum, N, and Claxton, K Methods to Elicit Experts' Beliefs over Uncertain Quantities: Application to a Cost Effectiveness Transition Model of Negative Pressure Wound Therapy for Severe Pressure Ulceration. Statist Med (2011) 30(19):2363–80. doi:10.1002/sim.4288
17. Bojke, L, Claxton, K, Bravo-Vergel, Y, Sculpher, M, Palmer, S, and Abrams, K Eliciting Distributions to Populate Decision Analytic Models. Value in Health (2010) 13(5):557–64. doi:10.1111/j.1524-4733.2010.00709.x
18. Leal, J, Wordsworth, S, Legood, R, and Blair, E Eliciting Expert Opinion for Economic Models: an Applied Example. Value in Health (2007) 10(3):195–203. doi:10.1111/j.1524-4733.2007.00169.x
19. Colson, AR, Adhikari, S, Sleemi, A, and Laxminarayan, R Quantifying Uncertainty in Intervention Effectiveness with Structured Expert Judgement: an Application to Obstetric Fistula. BMJ open (2015) 5(6):e007233. doi:10.1136/bmjopen-2014-007233
20. Stevenson, MD, Oakley, JE, Lloyd Jones, M, Brennan, A, Compston, JE, McCloskey, EV, et al. The Cost-Effectiveness of an RCT to Establish whether 5 or 10 Years of Bisphosphonate Treatment Is the Better Duration for Women with a Prior Fracture. Med Decis Making (2009) 29(6):678–89. doi:10.1177/0272989x09336077
21. Colson, AR, Megiddo, I, Alvarez-Uria, G, Gandra, S, Bedford, T, Morton, A, et al. Quantifying Uncertainty about Future Antimicrobial Resistance: Comparing Structured Expert Judgment and Statistical Forecasting Methods. PloS one (2019) 14(7):e0219190. doi:10.1371/journal.pone.0219190
22. Morton, A, Colson, A, Leporowski, A, Trett, A, Bhatti, T, and Laxminarayan, R. How Should the Value Attributes of Novel Antibiotics Be Considered in Reimbursement Decision Making. MDM Pol Pract (2019) 4(2):2381468319892237–12. doi:10.1177/2381468319892237
23.European Centre for Disease Prevention and Control (ECDC) (2021). Factsheet for the General Public - Antimicrobial Resistance. Available at: https://www.ecdc.europa.eu/en/antimicrobial-resistance/facts/factsheets/general-public [Accessed May 14, 2021]
24. Tanwar, J, Das, S, Fatima, Z, and Hameed, S Multidrug Resistance: An Emerging Crisis. Interdiscip Perspect Infect Dis, 2014 (2014). 1–7. doi:10.1155/2014/541340
25. Lehtinen, S, Blanquart, F, Lipsitch, M, and Fraser, C On the Evolutionary Ecology of Multidrug Resistance in Bacteria. Plos Pathog (2019) 15(5):e1007763. doi:10.1371/journal.ppat.1007763
26. Mwangi, J, Hao, X, Lai, R, and Zhang, Z-Y Antimicrobial Peptides: New hope in the War against Multidrug Resistance. Zoolog Res (2019) 40(6):488–505. doi:10.24272/j.issn.2095-8137.2019.062
27. de Kraker, MEA, Stewardson, AJ, and Harbarth, S Will 10 million people die a year due to antimicrobial resistance by 2050. Plos Med (2016) 13(11):e1002184. doi:10.1371/journal.pmed.1002184
28. Karam, G, Chastre, J, Wilcox, MH, and Vincent, J-L Antibiotic Strategies in the Era of Multidrug Resistance. Crit Care (2016) 20(1):136–45. doi:10.1186/s13054-016-1320-7
29. Klemm, EJ, Wong, VK, and Dougan, G Emergence of Dominant Multidrug-Resistant Bacterial Clades: Lessons from History and Whole-Genome Sequencing. Proc Natl Acad Sci USA (2018) 115(51):12872–7. doi:10.1073/pnas.1717162115
30. Levy, SB, and Marshall, B. Antibacterial Resistance Worldwide: Causes, Challenges and Responses. Nat Med (2004) 10(12):S122–9. doi:10.1038/nm1145
31. Lee, AS, de Lencastre, H, Garau, J, Kluytmans, J, Malhotra-Kumar, S, Peschel, A, et al. Methicillin-resistant Staphylococcus aureus. Nat Rev Dis Primers (2018) 4(1):18033–23. doi:10.1038/nrdp.2018.33
32. Fanelli, U, Chiné, V, Pappalardo, M, Gismondi, P, and Esposito, S Improving the Quality of Hospital Antibiotic Use: Impact on Multidrug-Resistant Bacterial Infections in Children. Front Pharmacol (2020) 11:745. doi:10.3389/fphar.2020.00745
33. Mourkas, E, Florez‐Cuadrado, D, Pascoe, B, Calland, JK, Bayliss, SC, Mageiros, L, et al. Gene Pool Transmission of Multidrug Resistance Among Campylobacter from Livestock, Sewage and Human Disease. Environ Microbiol (2019) 21(12):4597–613. doi:10.1111/1462-2920.14760
35. Cox, LA, and Singer, RS Confusion over Antibiotic Resistance: Ecological Correlation Is Not Evidence of Causation. Foodborne Pathog Dis (2012) 9(8):776. doi:10.1089/fpd.2012.1160
36. Arenas, NE, Abril, DA, Valencia, P, Khandige, S, Soto, CY, and Moreno-Melo, V Screening Food-Borne and Zoonotic Pathogens Associated with Livestock Practices in the Sumapaz Region, Cundinamarca, Colombia. Trop Anim Health Prod (2017) 49(4):739–45. doi:10.1007/s11250-017-1251-6
37. Harnisz, M, and Korzeniewska, E The Prevalence of Multidrug-Resistant Aeromonas Spp. In the Municipal Wastewater System and Their Dissemination in the Environment. Sci Total Environ (2018) 626:377–83. doi:10.1016/j.scitotenv.2018.01.100
38. Cooke, R Experts in Uncertainty: Opinion and Subjective Probability in Science. Oxford: Oxford University Press (1991).
39. Quigley, J, Colson, A, Aspinall, W, and Cooke, RM Elicitation in the Classical Model. In: LC Dias, A Morton, and J Quigley, editors. Elicitation: The Science and Art of Structuring Judgement. Cham: Springer International Series in Operations Research and Management Science (2018). 15–36. doi:10.1007/978-3-319-65052-4_2
40. Hemming, V, Burgman, MA, Hanea, AM, McBride, MF, and Wintle, BC A Practical Guide to Structured Expert Elicitation Using the IDEA Protocol. Methods Ecol Evol (2018) 9(1):169–80. doi:10.1111/2041-210x.12857
41. Morgan, MG, and Henrion, M Uncertainty: A Guide to Dealing with Uncertainty in Quantitative Risk and Policy Analysis. New York: Cambridge University Press (1990).
42. Werner, C, Hanea, AM, and Morales-Nápoles, O Eliciting Multivariate Uncertainty from Experts: Considerations and Approaches along the Expert Judgement Process. In: LC Dias, A Morton, and J Quigley, editors. Elicitation: The Science and Art of Structuring Judgement. Cham: Springer International Series in Operations Research and Management Science (2018). 171–210. doi:10.1007/978-3-319-65052-4_8
43. Meeuwissen, AMH, and Bedford, T Minimally Informative Distributions with Given Rank Correlation for Use in Uncertainty Analysis. J Stat Comput Simulation (1997) 57(1-4):143–74. doi:10.1080/00949659708811806
44. Bedford, T, Daneshkhah, A, and Wilson, KJ Approximate Uncertainty Modeling in Risk Analysis with Vine Copulas. Risk Anal (2016) 36(4):792–815. doi:10.1111/risa.12471
45. Werner, C, Bedford, T, and Quigley, J Sequential Refined Partitioning for Probabilistic Dependence Assessment. Risk Anal (2018) 38(12):2683–702. doi:10.1111/risa.13162
46. Kotz, S, and Van Dorp, JR Generalized diagonal Band Copulas with Two-Sided Generating Densities. Decis Anal (2010) 7(2):196–214. doi:10.1287/deca.1090.0162
47. Morales-Nápoles, O, Paprotny, D, Worm, D, Abspoel-Bukman, L, and Courage, W Characterization of Precipitation through Copulas and Expert Judgement for Risk Assessment of Infrastructure. Asce-asme J Risk Uncertainty Eng Syst A: Civ Eng (2017) 3(4):04017012. doi:10.1061/ajrua6.0000914
48. Elfadaly, FG, and Garthwaite, PH Eliciting Dirichlet and Gaussian Copula Prior Distributions for Multinomial Models. Stat Comput (2017) 27(2):449–67. doi:10.1007/s11222-016-9632-7
49. Wilson, KJ Specification of Informative Prior Distributions for Multinomial Models Using Vine Copulas. Bayesian Anal (2018) 13(3):749–66. doi:10.1214/17-ba1068
50. Wilson, KJ, Elfadaly, FG, Garthwaite, PH, and Oakley, JE Recent Advances in the Elicitation of Uncertainty Distributions from Experts for Multinomial Probabilities. In: AM Hanea, GF Nane, T Bedford, and S French, editors. Expert Judgement in Risk and Decision Analysis. Cham: Springer International Series in Operations Research and Management Science (2021). 19–51. doi:10.1007/978-3-030-46474-5_2
51. Werner, C, Bedford, T, and Quigley, J Mapping Conditional Scenarios for Knowledge Structuring in (Tail) Dependence Elicitation. J Oper Res Soc (2020) 72(4):889–907. doi:10.1080/01605682.2019.1700767
52. Pearl, J Probabilistic Reasoning in Intelligent Systems: Networks of Plausible Inference. San Francisco: Morgan Kaufmann (1988).
53. Clemen, RT, Fischer, GW, and Winkler, RL Assessing Dependence: Some Experimental Results. Manage Sci (2000) 46(8):1100–15. doi:10.1287/mnsc.46.8.1100.12023
54. Clemen, RT, and Reilly, T Correlations and Copulas for Decision and Risk Analysis. Manage Sci (1999) 45(2):208–24. doi:10.1287/mnsc.45.2.208
55. Kurowicka, D, and Cooke, RM Uncertainty Analysis with High Dimensional Dependence Modelling. Chichester: John Wiley & Sons (2006).
56. Morales, O, Kurowicka, D, and Roelen, A Eliciting Conditional and Unconditional Rank Correlations from Conditional Probabilities. Reliability Eng Syst Saf (2008) 93(5):699–710. doi:10.1016/j.ress.2007.03.020
57. Morales-Nápoles, O, Hanea, AM, and Worm, DTH Experimental Results about the Assessments of Conditional Rank Correlations by Experts: Example with Air Pollution Estimates. In: 2013: Proceedings of the 22nd European Safety and Reliability Conference ‘Safety, Reliability and Risk Analysis: Beyond the Horizon’; 29 September-2 October 2013; Amsterdam, The Netherlands. ESRELCRC Press/Balkema-Taylor & Francis Group (2013).
58. Hanea, A, Morales Napoles, O, and Ababei, D Non-parametric Bayesian Networks: Improving Theory and Reviewing Applications. Reliability Eng Syst Saf (2015) 144:265–84. doi:10.1016/j.ress.2015.07.027
62. Wunderlich, K, Symmonds, M, Bossaerts, P, and Dolan, RJ Hedging Your Bets by Learning Reward Correlations in the Human Brain. Neuron (2011) 71(6):1141–52. doi:10.1016/j.neuron.2011.07.025
63. Díaz, C, Batanero, C, and Contreras, JM Teaching independence and Conditional Probability. Boletín de Estadística e Investigación Operativa (2010) 26(2):149–62.
64. Meehl, PE, and Rosen, A Antecedent Probability and the Efficiency of Psychometric Signs, Patterns, or Cutting Scores. Psychol Bull (1955) 52:194–216. doi:10.1037/h0048070
65. Eddy, DM Probabilistic Reasoning in Clinical Medicine: Problems and Opportunities. In: D Kahneman, P Slovic, and A Tversky, editors. Judgment under Uncertainty: Heuristics and Biases. New York: Cambridge University Press (1982). 249–67. doi:10.1017/cbo9780511809477.019
67. Einhorn, HJ, and Hogarth, RM Judging Probable Cause. Psychol Bull (1986) 99(1):3–19. doi:10.1037/0033-2909.99.1.3
68. Ajzen, I Intuitive Theories of Events and the Effects of Base-Rate Information on Prediction. J Personal Soc Psychol (1977) 35(5):303–14. doi:10.1037/0022-3514.35.5.303
69. Hastie, R Causal Thinking in Judgements. In: G Keren, and G Wu, editors. The Wiley Blackwell Handbook of Judgment and Decision Making. Chichester: Wiley & Sons (2015).
70. Hanea, AM, McBride, MF, Burgman, MA, and Wintle, BC Classical Meets Modern in the IDEA Protocol for Structured Expert Judgement. J Risk Res (2018) 21(4):417–33. doi:10.1080/13669877.2016.1215346
71. Schepsmeier, U, Stoeber, J, Brechmann, EC, Graeler, B, Nagler, T, Erhardt, T, et al. Package ‘VineCopula. R Package Version (2015) 2(5).
72. Yan, J Enjoy the joy of Copulas: with a Package ‘copula. J Stat Softw (2007) 21(4):1–21. doi:10.18637/jss.v021.i04
73. Winkler, RL, and Clemen, RT Multiple Experts vs. Multiple Methods: Combining Correlation Assessments. Decis Anal (2004) 1(3):167–76. doi:10.1287/deca.1030.0008
74. Hellinger, E Neue Begründung der Theorie quadratischer Formen von unendlichvielen Veränderlichen. J für die reine Angew Mathematik (in German) (1909) 1909:210–71. doi:10.1515/crll.1909.136.210.JFM.40.0393.01
75.European Centre for Disease Prevention and Control (ECDC) (2016). Surveillance Atlas of Infectious Diseases, Available at: http://atlas.ecdc.europa.eu/public/index.aspx
76.European Centre for Disease Prevention and Control (ECDC) (2015). Antimicrobial Resistance Surveillance in Europe, Available at: http://ecdc.europa.eu/en/publications/Publications/antimicrobial-resistance-europe-2015.pdf
77. Colson, AR Expert Judgment Evaluation of the Future Risk of Antimicrobial Resistance. Glasgow: University of Strathclyde PURE (2017). doi:10.15129/953210ee-27c0-4042-8fd6-f1c5b7325eae
78. Bolger, F The Selection of Experts for (Probabilistic) Expert Knowledge Elicitation. In: LC Dias, A Morton, and J Quigley, editors. Elicitation: The Science and Art of Structuring Judgement. Cham: Springer International Series in Operations Research and Management Science (2018). 393–443. doi:10.1007/978-3-319-65052-4_16
79. John-Baptiste, A, Schapira, MM, Cravens, C, Chambers, JD, Neumann, PJ, Siegel, J, et al. The Role of Decision Models in Health Care Policy. Med Decis Making (2016) 36(5):666–79. doi:10.1177/0272989x16646732
80. Cox, LA, Popken, DA, and Carnevale, R Quantifying Human Health Risks from Animal Antimicrobials. Interfaces (2007) 37(1):22–38. doi:10.1287/inte.1060.0275
Keywords: antibacterial resistance, dependency modeling, risk assessment, structured expert judgment, copula modeling
Citation: Werner C, Colson A, Morton A and Bedford T (2021) Risk Assessment of Future Antibiotic Resistance—Eliciting and Modelling Probabilistic Dependencies Between Multivariate Uncertainties of Bug-Drug Combinations. Front. Appl. Math. Stat. 7:669391. doi: 10.3389/fams.2021.669391
Received: 18 February 2021; Accepted: 08 November 2021;
Published: 24 December 2021.
Edited by:
Anca Maria Hanea, The University of Melbourne, AustraliaReviewed by:
Malcolm Farrow, Newcastle University, United KingdomKevin Wilson, Newcastle University, United Kingdom
Copyright © 2021 Werner, Colson, Morton and Bedford. This is an open-access article distributed under the terms of the Creative Commons Attribution License (CC BY). The use, distribution or reproduction in other forums is permitted, provided the original author(s) and the copyright owner(s) are credited and that the original publication in this journal is cited, in accordance with accepted academic practice. No use, distribution or reproduction is permitted which does not comply with these terms.
*Correspondence: Christoph Werner, V2VybmVyc0NocmlzdG9waEB3ZWIuZGU=