 Lauren L. Luciani1
 Lauren M. Nichols1Brydie R. Huckestein2,3
 John F. Alcorn2,3
 Jason E. Shoemaker1,4,5,6*
- 1Department of Chemical & Petroleum Engineering, University of Pittsburgh, Pittsburgh, PA, United States
- 2Department of Pediatrics, UPMC Children’s Hospital of Pittsburgh, Pittsburgh, PA, United States
- 3Department of Immunology, University of Pittsburgh, Pittsburgh, PA, United States
- 4Department of Computational and Systems Biology, University of Pittsburgh, Pittsburgh, PA, United States
- 5The McGowan Institute for Regenerative Medicine, Pittsburgh, PA, United States
- 6Department of Bioengineering, University of Pittsburgh, Pittsburgh, PA, United States
Children are uniquely susceptible to severe influenza infection, with one million children experiencing severe life-threatening disease each year. However, there is little evidence that an underdeveloped immune system or differences in viral loads are responsible, implicating the host inflammatory response as responsible for increased lung injury in juveniles. Here, we used mechanism-based mathematical modeling, age-specific lung immune data from influenza-infected mice, Bayesian statistics, and rigorous Monte Carlo-based methods to identify immune mechanisms that may be differently regulated in juvenile animals. We hypothesized that the immunological mechanisms between juvenile and adult mice are primarily conserved, and that immune response differences arise due to a minimal set of parameter differences. First, we developed and identified parameter bounds for an ordinary differential equation (ODE) model of the innate immune response to influenza infection which capture the dynamic changes of select parameters. Using publicly available juvenile and adult murine data, we then conducted a computational screen of different age-specific model scenarios and evaluated the scenarios using the Akaike Information Criterion (AIC) and Bayesian Information Criterion (BIC) to select the optimal scenario. These results suggest that the rate of production of JAK–STAT pathway activators, like type I IFNs and IL-6, is age-specific. Preconditioned Monte Carlo (PMC) analysis revealed that JAK–STAT activator production is higher in juveniles than adults. Additional simulations suggest antiviral therapeutics may be more effective in juvenile populations. While not significantly suppressing virus replication, age-specific IFN or IL-6 production may be responsible for increased inflammation, lung injury, and mortality observed in juvenile influenza infection.
Introduction
Influenza virus and other respiratory viruses remain a large global threat with seasonal influenza alone resulting in 3–5 million cases and between 290,000 and 650,000 death each year (1). Pandemics escalate this threat and affect significantly more individuals, with the 1918 influenza pandemic estimated to be responsible for 50 to 100 million deaths (2). Young children, the elderly, and those with pre-existing medical conditions, such as asthma, are at an increased risk of severe influenza infection (3). While risk factors include being under the age of 6 months and having co-morbidities, the majority of influenza-associated pediatric deaths have occurred in older children (median age of seven), with over 40% of these deaths occurring in previously healthy children (4–6).
Even though the underlying mechanisms driving severe disease in children remain unclear, there are several potential explanations for the disparities in age-specific outcomes. One leading hypothesis for why children experience more severe outcomes is due to increased viral load resulting from differences in viral replication and clearance. Influenza infection severity has been shown to correlate with increased viral load (7). Current literature exploring the differences in viral load, clearance, and replication between juveniles and adults is mixed. In animal studies, differences in viral replication and clearance between juvenile and adult populations have been observed. Influenza-infected primary airway epithelial cells from infant rhesus monkeys showed increased viral load and decreased type I interferons (IFN), a crucial component of the anti-viral response, compared to adult monkeys (8). Additionally, higher viral titers and increased lung injury were observed in influenza-infected juvenile mice compared to older adult mice (9). However, several murine and human studies have revealed similar viral burden between influenza infected juveniles and adults despite differences in illness severity and lung injury (10–14). Thus, the host immune response has been implicated in driving age-specific outcomes.
Studies have shown that the immune responses in children are vastly different than those of adults, with children relying more heavily on their innate immune responses as their adaptive immune systems develop (15–17). Although it is tempting to attribute children’s increased susceptibility and mortality to an underdeveloped adaptive immune response, there is little evidence that these factors are primarily responsible for severe outcomes in pediatric populations (4). While both the innate and adaptive immune systems are activated in response to viral infection, innate immunity plays a pivotal role in determining infection outcomes (18–21). For example, a study performed by Epstein et al. found that mice deficient in mature B cells and all antibodies were able to survive primary influenza infection (22). Additionally, antibody and specific T-cell arrival occurs 4 days post infection, by which time viral levels are typically decreasing (23). The reliance on the innate immune response in juveniles is also highlighted in a study by Prigge et al. (24), which showed a delayed T-cell and IFN-γ response in juvenile mice infected with influenza compared to adult mice. Furthermore, the innate immune response consists of the secretion of pro-inflammatory cytokines, where elevated levels are associated with increased lung damage and more severe outcomes of influenza infection (4, 25–29). Altogether, this indicates the outcome of infection depends heavily on the innate immune response. In juveniles, heightened reliance on the innate immune system may particularly contribute to more severe, inflammation-induced lung injury. Consistent with this hypothesis, studies of influenza-infected juvenile mice by Onufer et al. (30) and Kumova et al. (31) indicate that type I IFNs exacerbate lung inflammation and infection severity but do not lower virus titers. Still, the underlying mechanisms by which age-dependent innate immune responses to influenza infection result in increased mortality in juveniles remain unclear.
Nonlinear ordinary differential equation (ODE) models are highly effective at characterizing complex biological systems and have proven to be an invaluable tool for understanding influenza infection dynamics. These models have been employed to identify the mechanisms involved in predicting the duration, severity, and outcome of influenza infection (32–34). For instance, ODE models have been used to elucidate key influenza kinetic parameters, such as the viral clearance rate (35). Additionally, these models have analyzed the signaling pathways that play an important role during influenza infection, determined key components of the innate and adaptive immune response, and explored the effects of antiviral therapeutics (34, 36–49). Mathematical models have also been used to determine differences in immune dynamics due to viral strains (50, 51), sex, and age (50–55). However, while previous models have advanced our understanding of influenza pathogenesis, they are insufficient to explore the key mechanisms driving severe infection in pediatric populations. Previous modeling studies considering age differences have primarily focused on the differences in immune response between adults and the elderly rather than juvenile populations (52, 56, 57). Pre-existing models were unable to replicate published results, missing key components of the innate immune response, and/or unable to capture differences in disease outcomes without varying levels of viral burden.
Therefore, to elucidate the immunological mechanisms that lead to distinct, age-specific pathologies, we expanded the Baccam et al. (43) model to develop a mechanism-based, ODE model of the innate immune response to influenza infection. We then performed multiple parameter optimizations across several scenarios to identify the biological mechanisms that are differentially regulated between juveniles and adults. To perform these parameter estimations, the model parameters were fit to viral load, cytokine, and myeloid cell data from juvenile and adult mice infected with Influenza A/WSN/1933. The models were then assessed using the Akaike Information Criteria (AIC) and Bayesian Information Criteria (BIC), which account for the goodness-of-fit and the number of parameters in the model. Preconditioned Monte Carlo (PMC) (58) was employed to obtain a rigorous estimation of the age-specific parameter distributions of the optimal model (58). Together with global sensitivity analysis, PMC establishes the parameter(s) that primarily drive differences in the innate immune responses. Altogether, this modeling-based approach suggests that a higher production rate of JAK–STAT activators like type I IFNs and IL-6 is primarily responsible for the distinctive immune response observed in severe pediatric cases.
Materials and methods
Mathematical model development
A six state ODE model (Figure 1) was developed to describe the innate immune response to influenza infection. We aimed to develop a minimal mechanistic model that minimizes the number of parameters to be estimated while maintaining a high level of confidence in the immunological mechanisms of the model. Here, we describe the relevant innate immune responses to influenza infection and then describe how these mechanisms are mathematically modeled.

Figure 1. Schematic of ODE model. Healthy epithelial cells (H) are infected by virus at a rate of βHV. Infected epithelial cells (I) are produced at a rate of βHV and are removed by neutrophils (N) at a rate of bINNI. Influenza virus (V) is produced by infected cells at a rate of aVI and is inhibited by IFN where bVA is the rate constant. Type I IFN (A) is produced by infected cells at a rate constant of aAI. Monocytes (M) are recruited by JAK-STAT activators, IFN and IL-6, at a rate constant of aMA, and neutrophils (N) are recruited by monocytes at a rate of aNMM. Degradation rates for infected cells, virus, JAK-STAT activators, monocytes and neutrophils are not shown in the schematic but included in the model. Created with BioRender.com.
During influenza infection, the virus attacks the host respiratory tract and infects healthy epithelial cells and other lung resident cells (59). The virus replicates within the infected epithelial cells, and newly synthesized viruses are then released by the infected cells (60). Infected epithelial cells also secrete type I IFNs, which induce an antiviral state in nearby cells and stimulate the production of IFN-stimulated genes (ISGs) via the JAK–STAT pathway (61–65). ISGs inhibit viral replication both by inducing enzymes that degrade viral RNA and proteins and by inhibiting viral translation, transcription, and assembly (66, 67). IL-6 joins type I IFNs to converge as activators of the JAK–STAT pathway (68–72). Both IL-6 and type I IFNs help to recruit myeloid cells, such as monocytes, macrophages, and neutrophils, to the lungs (73–75). In particular, they promote the production of monocyte chemoattractant protein 1 (MCP-1) which is the primary chemokine responsible for both recruiting monocytes and CCR2 + macrophages to the site of infection (64, 76). MCP-1 and IL-6 additionally promote the differentiation of recruited monocytes to macrophages (77). Type I IFNs also aid in the recruitment of neutrophils by stimulating inflammatory monocytes to produce IL-18 (64). Neutrophils clear infected host cells both by directly phagocytosing infected epithelial cells and removing released virions by casting neutrophil extracellular traps (NETs), which reduce the number of infected host cells capable of effecting downstream immune responses (64, 78–80).
The innate immune system described above is modeled as follows. Healthy epithelial cells (H) are modeled in Equation 1, where cells become infected by virus at a rate of βHV, where β is the rate constant of infection. We do not include a regeneration term for healthy cells, as regeneration of the epithelium begins approximately 5 days post infection, and complete regeneration takes up to 1 month (81). Additionally, Saenz et al. (49) and Baccam et al. (43) found that incorporating a logistic growth term for epithelial regeneration did not affect infection dynamics or improve the fit of the model to experimental data. Infected epithelial cells (I) are modeled in Equation 2, where infected cells are produced at a rate of βHV and are removed by neutrophils at a rate of bINNI. Influenza virus (V), modeled in Equation 3, is produced by infected cells at a rate of aVII and is inhibited by IFN with mass action kinetics, where bVA is the rate constant. The loss of virus to infection is neglected, since infected cells can produce up to 20,000 virions. Thus, the loss of one virion to infect a cell can be considered negligible (82). Equation 4 models JAK–STAT activators (A), such as the concentrations of type I IFNs and IL-6. These activators were considered to be produced at the rate constant aAI to model the production of IFN by infected cells. Here, we initially assume mass action-based kinetics instead of a Hill kinetic to limit the number of parameters. While other models incorporate a Hill kinetic, we found the mass-action kinetic to be sufficient to capture the data, thus eliminating the need for an extra parameter (50). Monocytes (M) are modeled in Equation 5, where they are recruited by IFN and IL-6 at a rate of aMAA. The change in the numbers of neutrophils (N) are modeled in Equation 6. Neutrophils are recruited by monocytes (via IL-18) at a rate of aNMM. All states include a degradation term except for healthy epithelial cells whose degradation is negligible over the course of infection.
Experimental data collection and alignment with model states
To parameterize the model, published literature was reviewed for dynamic data that best corresponded to the model states. Mouse data was reconstructed from Coates et al. (10). As reported in their work, adult (8–10 week old) and juvenile (4 week old) mice were infected intratracheally with 25 PFU of Influenza A/WSN/1933. Virus titer, body chemokine/cytokine levels, and cell counts from lung homogenates were measured at days 0-, 5- and 7-days post infection. Day 3- post infection data was also collected for virus titers, IFN-β, and IL-6. Experimental data was obtained from the published figures using WebPlotDigitizer. From the data available, we selected viral levels, monocyte cell counts, and neutrophil cell counts. IL-6 measurements were used to represent levels of JAK–STAT pathway activators due to of the unavailability of IFN-α data and the lower abundance of IFN-β relative to IFN-α (10). The dynamics of IL-6 and type I IFNs have been shown in multiple studies to be highly correlated over the course of infection (83–85).
Parameter fitting
The viral load, IL-6, monocyte, and neutrophil data collected from juvenile and adult mice (Figure 2) was used. Parameter fitting was performed using the basin-hopping algorithm with Nelder–Mead to minimize the log likelihood:

Figure 2. Experimental data used in model parameterization which was reconstructed from Coates et al. (10). See original paper for experimental details. Juvenile data are shown in blue; adult data are shown in red. * Indicates significance between juveniles and adults at each time point where p < 0.05. Juvenile and adult mice were infected intratracheally with 25 PFU WSN/1933. (A) Influenza A viral titers of lung homogenates 3-, 5-, and 7-days post infected (dpi). (B) IL-6 concentrations in bronchoalveolar lavage fluid (BALF) 3, 5, and 7 dpi. (C) Total number of recruited monocytes per dry lung weight 5 and 7 dpi. (D) Total number of neutrophils per dry lung weight 5 and 7 dpi.
Where is the likelihood, n is the number of observations, is the predicted value, is the observed value, and σ is the standard deviation.
Parameter bounds
To ensure alignment of model and parameter estimates with known biology of the innate immune response to influenza infection, we imposed parameter bounds on the fitted model parameters based on experimental measurements and mathematical modeling estimates from literature. The rate constant of infection has been estimated in several mathematical models of influenza infection and consistently found to be between 5.0e-08 and 8.0e-05 (43, 47, 86, 87). We therefore used this range as the parameter bound for β.
Unfortunately, the removal rate of infected cells by neutrophils has not been directly measured or estimated in previous mathematical models to our knowledge. In general, this is difficult to measure as there are several effector cells that play a role in removing infected cells. Other studies have estimated the killing rate of infected cells by natural killer cells (86), cytotoxic T lymphocytes (35), and CD8+ T cells (47, 56), with these rates ranging from 1.1e-10 to 2.0e-03. However, since these are not estimates of the removal rates by myeloid cells, we used this range to start and then iteratively reduced our range to the range listed in Table 1.

Table 1. Parameter descriptions and bounds.
A study by Zdanov and Bukrinskaja (88) found that a single epithelial cell can release up to 103–104 virus particles in a day. Several modeling studies (45, 47, 86, 87) set the production rate of virus by infected epithelial cells to be between 1 and 1,000 virions per day, which we have similarly done here. For the rate of inhibition on viral replication by type I IFNs, we adapted the parameter bounds from Liparulo et al. (55) and Ackerman et al. (50) to be [1.0e-03 mL/pg.·day, 2.0e+01 mL/pg.·day]. This parameter bound aligns with the estimated value of the clearance rate of free virus due to the innate immune system from a study conducted by Pawelek et al. (89). Unfortunately, the rate of type I IFN production by infected epithelial cells, used to model JAK–STAT activators, is not well known and has only been estimated in a couple of studies. Price et al. (86) estimated the value to be between 2.7e-02 pg./mL·cell·day to 1.1e+01 pg./mL·cell·day, while Cao et al. (90) estimated the value to be 10−5 units/cell·day. Considering the units of measurement and models, we set the parameter bounds as listed in Table 1. The bounds for the rates of monocyte and neutrophil recruitment were set by first considering the bounds for maximum chemotactic attraction of neutrophils and for the substrate affinity for attraction of neutrophils as outline in the study by Price et al. (86). Using these bounds as a guide, we then iteratively estimated the bounds through multiple fitting exercises to get biologically feasible bounds.
Several studies, performing direct experimental measurements, have estimated that influenza infected epithelial cells have an average lifespan of 12–48 h and have set the decay rate of infected epithelial cells according to this range (91–97). Additionally, numerous experimental studies have measured the average lifespan of a virion to be between 0.5 and 3 h (98–101). In line with these experimental values, a recent study by Schuit et al. (102) estimated a half-life of 31.6 min for influenza virus particles in aerosols. Thus, the viral decay rate parameter bounds were set accordingly. Harari et al. (103) reported that type I IFNs typically have a half-life between 0.5 and 4 h in mice, which served as the basis for the parameter bounds for the decay rate of JAK–STAT activators in our model. Similarly, Patel et al. (104) showed that the half-life of classical monocytes in mice was around 20 h, while the half-life of non-classical monocytes was around 2.2 days. This range informed our parameter bounds for the decay rate of monocytes. This was also true for the parameter bounds for the decay rate of neutrophils, as neutrophils were shown to typically have a half-life as high as 12.5 h and as low as 6 h (104, 105).
Model selection
In this study, we generated 30 different model scenarios where juvenile and adult models are, respectively, fit to juvenile and adult experimental data simultaneously. The models generated included a scenario where no parameters were considered to be age-specific and a scenario where all the parameters were allowed to take on unique, age-specific values. Additionally, each combination of one and two age-specific parameters were considered, excluding degradation rates. This approach produced 30 different model scenarios that allowed us to determine which immune mechanisms were age-specific while accounting for hypotheses found in literature. To compare the different model scenarios, we used the Akaike Information Criterion (AIC) (Equation 8) and the Bayesian Information Criterion (BIC) (Equation 9). The lower the AIC/BIC, the better the model is. The AIC and BIC equations are comprised of two terms: a goodness-of-fit term that incorporates the log likelihood ( (Equation 7) and a penalty term for an increasing number of parameters, k, in the model. The BIC increases the penalty for increased numbers of parameters by multiplying the number of parameters by the log number of samples. Thus, these criteria evaluate model fitness by mediating the tradeoff between goodness-of-fit and model simplicity; a larger model with a better (lower) log likelihood value will not necessarily result in a lower AIC/BIC.
Preconditioned Monte Carlo analysis
Preconditioned Monte Carlo (PMC) analysis was performed using the python package, pocomc (58, 106). PMC uses a Normalizing Flow to precondition the geometry of the posterior parameter space and then employs a Sequential Monte Carlo algorithm to effectively sample from highly dimensional and complex posterior distributions. The log priors were set to be the parameter bounds for the degradation rates while log priors for the remaining parameters were set to be within one order of magnitude of the best fit value in each direction. These log priors all fell within the parameter bounds and were limited to these smaller ranges to reduce the computational cost. The log-likelihood (Equation 7) was used along with the log priors to evaluate the PMC samples.
Global sensitivity
A global sensitivity analysis was performed using linear regression-based approach. First, 1,000 parameter sets were randomly generated with ±10% of the best fit values for both the juvenile and adult models independently for the model of interest. The model was then simulated using each of the 1,000 parameter sets, and the area under the curve (AUC) was calculated for each state in the model. The parameter values and AUC values were then normalized using the best fit values for the juvenile and adult models. A linear model was constructed to relate the percent change in the parameter values to the percent change in the AUC across all parameter sets tests. Regression was performed using Python’s scikit-learn package (107) to estimate the sensitivity of the AUC to each parameter.
Results
Mathematical model of innate immunity fits immune response data from juvenile and adult mice
This study aims to determine which age-specific immunological mechanisms may be responsible for disparities in outcomes following influenza infection in juvenile and adult mice. These differentially regulated immune response(s) can be represented by differences in parameter values within a mathematical model. Thus, we first developed a mathematical model of the innate immune response to influenza infection. In our model (Figure 1), healthy epithelial cells become infected with influenza virions (60) and in turn produce virus particles and type I IFNs (59). Type I IFNs inhibit viral replication (63) and converge with IL-6 on the JAK–STAT pathway to recruit monocytes to the site of infection (64, 68–73). Through the production of cytokines, monocytes help to recruit neutrophils to the site of infection (10, 75, 77). In turn, neutrophils directly clear infected epithelial cells and prevent their released virions from infecting other cells using neutrophil extracellular traps (64, 65, 80). A further explanation of the rationale behind the model and its equations can be found in Materials & Methods.
To employ our model, we first reconstructed the experimental data from Coates et al. (10), as shown in Figure 2. The viral levels for the juvenile and adult mice were similar across the course of infection, 3-, 5-, and 7-days post infection (dpi), and were not significantly different. JAK–STAT activator levels, measured by IL-6 levels, were significantly elevated 7 dpi in juvenile mice [p-value < 0.05 as reported in Coates et al. (10)] compared to adult mice. Similarly, monocytes were significantly higher in juveniles 0 and 7 dpi, while monocyte levels were similar between juvenile and adult mice 5 dpi. Neutrophil counts were similar across the course of infection between juveniles and adults and were not significantly different. The Coates et al. (10) study also reported higher levels of TNF, inflammation, lung injury, and mortality in juvenile mice compared to adult mice. Given the similar viral titers between juvenile and adult mice, the elevated proinflammatory immune response in juvenile mice is likely a major driver of the increased mortality in juvenile mice compared to adult mice.
In this study, we propose several different scenarios where a subset of parameters are allowed to take on unique, age-specific values to test different hypotheses on immunological differences between juveniles and adults (Figure 3). However, we first wanted to determine if the model could sufficiently capture both the juvenile and adult immune responses to influenza infection. To accomplish this, the model was independently trained to the juvenile and adult data (Figure 2) resulting in separate juvenile and adult estimates for each parameter in the model. The model parameterization was accomplished using a minimization algorithm with a Basin-hopping optimizer (see Materials & Methods) with parameter bounds based on experimental literature values and bounds from previous modeling studies (Table 1). Allowing all the parameters in our model to take on age-specific values results in a good fit to the juvenile and adult data, with the best fit trajectory falling within one standard deviation of all the data points (dark blue line, Figures 4C,D). Additionally, this fit results in the biologically feasible range for healthy and infected epithelial cell counts observed by Myers et al. (108). Overall, this demonstrates that a mass-action based model can recapitulate the juvenile and adult immune responses to influenza infection with biological feasible rates.

Figure 3. Juvenile and adult model scenarios. Multiple model scenarios are considered to determine age specific parameters in the innate immune response to influenza infection. In the “All Shared” model, all parameters must share values and are trained to juvenile and adult data simultaneously. In the “All Different” scenario, each parameter is able to take on unique, age-specific values. In the remaining model scenarios, a subset of parameters is allowed to take on age-specific values while the remaining parameters must share values while being fit simultaneously to juvenile and adult data. Model schemes demonstrate the different outcomes that occur under each scenario. Black lines indicate parameter rates that share the same value when fitting the model to juvenile and adult data. Red, dashed lines represent parameters that can take on unique, age-specific values. For the “one age-specific difference” and “two age-specific differences” scenarios, all parameters (and combinations of two parameters) are considered, with the exception of the degradation rates. Each model is then evaluated using the Akaike Information Criterion (AIC) and Bayesian Information Criterion (BIC) which predict the best model by accounting for the goodness-of-fit to the experimental data and the number of parameters.

Figure 4. Model selection results. Notable model scenarios are highlighted across the results. The “All Shared” model is shown in blue, the “All Different” model in magenta, the “aFI” model in cyan/light blue, the “bVA, aAI” model in yellow, and the “β, aVI” model in orange. (A) Plot showing the BICs for all 30 model scenarios considered. A lower BIC indicates a better model where BIC differences of 4–5 are considered to be significant. (B) Table summarizing a subset of the model selection results. (C) Juvenile trajectories for model outputs. (D) Adult trajectories for model outputs.
After confirming the model could sufficiently recapitulate the juvenile and adult immune responses, we considered multiple hypotheses or model scenarios where a subset of parameters is allowed to take on age-specific values. Each of the proposed scenarios was elevated using the Akaike Information Criterion (AIC) and Bayesian Information Criterion (BIC) values which account for the goodness-of-fit and penalize the model for requiring more parameters to fit the experimental data. Thus, the lower the AIC/BIC, the better the model represents the experimental data. As shown in the paragraph above, the first scenario considered is the “All Different” model scenario where all parameters in the model are able to take on unique, age-specifics for juveniles and adults. The AIC for this scenario is 680, and the BIC is 687 (Figure 4B), which serve as the benchmark for future scenarios considered in this study.
Model screening suggests the rate of JAK–STAT activator production differs between juvenile and adult mice
The next scenario considered was the “All Shared” scenario where none of the parameters in the model are allowed to take on unique values between juveniles and adults (Figure 3). This hypothesis assumes that there are no age-specific immunological differences between juveniles and adults, and thus, all parameters share the same value. In this scenario, the model is trained simultaneously to the juvenile and adult data. As we see from the magenta line in Figure 4, forcing all parameters in the model to have the same value for the juvenile and adult fits results in a poor fit to the data and subsequently an AIC of 703 and a BIC of 707. These AIC/BIC values are significantly higher than that of the “All Different” scenario, indicating that the “All Different” scenario is a better model of the juvenile and adult immune response data and confirms our broad hypothesis that juveniles and adults have different immunological dynamics related to influenza infection.
Next, we sought to determine if there exists a smaller subset of parameters that, when allowed to take on age-specific values, can explain the differences in immune responses in juveniles and adults. To do so, we consider 28 additional scenarios where one or two different parameters are allowed to take on age-specific values. These scenarios account for the combinations of all the parameters in the model, except for the degradation rates, which are assumed to be the same for juvenile and adult populations. In these scenarios that only consider one age-specific difference, a single parameter can have a different value between the juvenile and adult models (Figure 3). Similarly, in the two age-specific differences’ scenarios, two parameters can take on unique values when trained to the age-specific data (Figure 3). The BIC values for all 30 scenarios screened are plotted in Figure 4A, with a subset of scenarios highlighted throughout Figure 4. The BIC values and the trajectories for this subset of scenarios are shown in Figures 4B–D.
The computational screen found that allowing the rate of JAK–STAT activator production, modeled as type I IFNs production by infected host cells, to take on unique values resulted in the best model, with an AIC of 666 and a BIC of 670. Moving forward, we will refer to this scenario as the “Age-Specific IFN Production” or ASFP scenario. While one model scenario (cell infectivity and IFN production) produced a slightly lower BIC as seen in red in Figure 4A, the BIC of this scenario is only about 2 less than the ASFP scenario, which does not indicate a significant difference between models (109). Additionally, Preconditioned Monte Carlo (PMC) analysis revealed that there were not distinct parameter distributions for the juvenile and adult estimates of cell infectivity, suggesting the rate of cell infectivity is unable to take on unique, age-specific values (Supplementary Figure 6). Thus, the optimal model is the ASFP model. This model scenario fits the experimental data extremely well, with the model outputs all falling within one standard deviation of the data with the sole exception of viral loads 5 dpi in juveniles which falls within two standard deviations of that data point (light blue line, Figures 4C,D).
In addition to the top performing model scenarios, we also considered other leading hypotheses from the literature for why children experience more severe influenza infection. Thus, we next consider the modeling scenario where the rate of monocyte recruitment is allowed to take on age-specific values, since the increased presence of monocytes in juveniles has been shown to cause excess inflammation and lung injury (10). Allowing the rate of monocyte recruitment to take on age-specific values, however, resulted in a poor fit to the data, as the model fails to capture the JAK–STAT activator (type I IFNs and IL-6) dynamics in juveniles and adults (yellow line, Figures 4C,D). The model’s poor performance is highlighted by the AIC of 703 and BIC of 707, the same as the “All Shared” scenario (Figure 4B).
Last, we test the hypothesis that differences in viral replication and infection dynamics can explain differences in infection severity among children and adults by allowing the rate of cell infectivity and rate of viral replication to take on age-specific values. Looking at the trajectories for the resulting juvenile and adult models (red line, Figures 4C,D), we observe that the models are unable to recapitulate the either JAK–STAT activator or initial monocyte dynamics in both juveniles and adults. While the AIC of 701 and BIC of 705 are slightly lower than those of the “All Different” scenario, the ASFP scenario shows significantly lower AIC and BIC values. Overall, the model screening reveals that IFN production contributing to JAK–STAT dynamics is the most likely age-specific parameter leading to the differences in infection severity and immunologic dynamics observed between juveniles and adults.
Activators of the JAK–STAT pathway are differentially regulated in juvenile and adult mice
While the model screening identifies the best model for the data, the analysis relies on two estimates of the parameters and does not provide a rigorous estimate of the parameter ranges that may fit the data. To estimate the parameter distributions for which the model reasonably fits the juvenile and adult data, we employ Preconditioned Monte Carlo (PMC) analysis (see Materials & Methods) (58, 106). PMC analysis is useful to analyze the distributions of parameter values that uphold the model, as there is more than one exact value for each parameter that fits the experimental data. This is an appropriate method for exploring and analyzing the parameter distributions given the inherent heterogeneity in biological systems. We first want to ensure the PMC fits result in reasonable model fits to the juvenile and adult data. Figure 5 shows the 95% range of 4,163 model trajectories from the PMC analysis for the juvenile and adult models in the ASFP scenario. The majority of fits fall within one standard deviation of the experimental data with all trajectories following the dynamics of the experimental data. Altogether, this indicates that the parameter distributions identified by the PMC analysis result in good fits to the data.

Figure 5. Model trajectories from the PMC analysis of the ASFP scenario. The results from the PMC samples were summarized to show the trajectories of 95% of the model solutions. The mean prediction is demonstrated by the blue line and the 95% range of predictions are shown by the light blue shading. Experimental data from Coates et al. (10) is shown in black. (A) Juvenile trajectories for model outputs. (B) Adult trajectories for model outputs.
The parameter distributions for the ASFP model are shown in Figure 6. The parameter values shown on the x-axes are log10 scaled and fall within the parameter bounds (Table 1) suggested from prior evidence. For the ASFP scenario, we see that aAI takes on age-specific values and has distinct parameter density distributions for juvenile and adult values, shown in blue and red, respectively (Figure 6). These results suggest that the rate of JAK–STAT activator (type I IFNs and IL-6) production is greater in juveniles than in adults. Last, we analyze the parameter distributions to identify significant correlations between model parameters in the ASFP scenario (Figure 7). There is a near perfect positive correlation between aAI, Juvenile and aAI, Adult, aAI, Juvenile and dA, and aAI, Adult and dA. Figure 7B reveals the ratio of log10 (aAI, Adult) to log10 (aAI, Juvenile) is above 1 for each simulation run from the PMC analysis and shows the relationship between this ratio and dA. We observe a positive, albeit weaker, positive correlation between this ratio and dA. We also see a very strong positive correlation between aVI and bVA, aVI and dV, and bVA and dV (Figure 7A). Given the availability of our source data, the independence of production and degradation rates cannot be established. However, the near perfect correlations between the viral decay rate, rate of viral replication, and inhibition of viral replication by IFN suggest the model could be further simplified according to these correlations.

Figure 6. Parameter distributions for the ASFP scenario. The purple shading indicates parameters that were shared between juvenile and adult models. Juvenile specific parameters are shown in blue and adult specific parameters are shown in red.
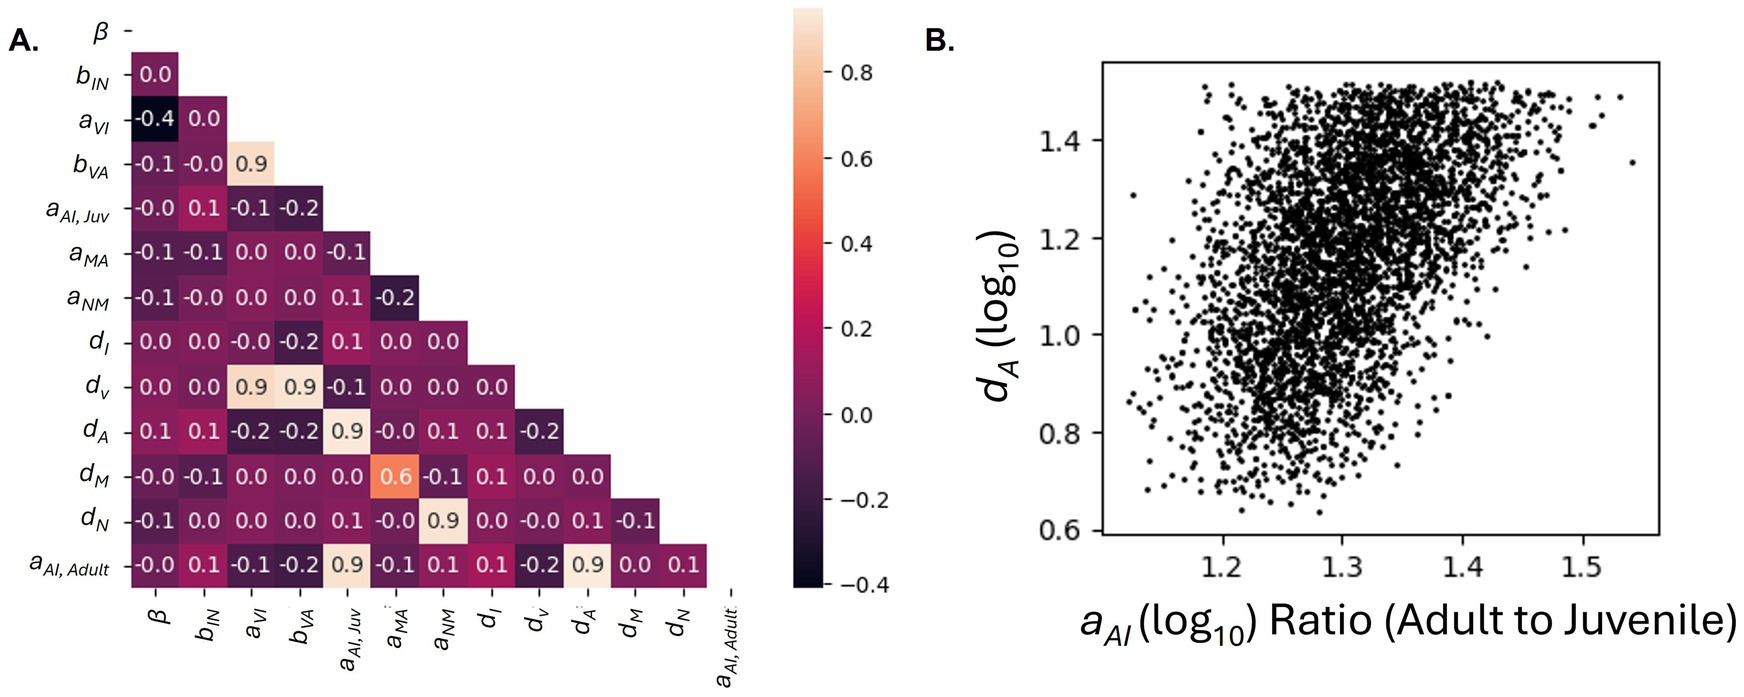
Figure 7. Parameter correlations for the ASFP scenario based on the samples generated from the PMC run. (A) Correlation coefficient heatmap. Correlation between parameters is indicated by the heatmap legend and with the correlation coefficient. (B) Scatterplot depicting the relationship between the ratio of aAI, Adult to aAI, Juvenile and dA.
Juvenile and adult models of innate immunity have different parametric sensitivities
Next, we perform a global sensitivity analysis on the ASFP model scenario (Figure 8). The JAK–STAT activator and monocyte states are highly sensitive to β (rate of cell infectivity) and aVI (rate of viral replication). Additionally, these states are moderately sensitive to aAI (rate of JAK–STAT activator production), and bVA (rate of viral inhibition by IFN) in the juvenile and adult models. The JAK–STAT activator and monocyte states in juvenile model are more sensitive to β, aVI, and bVA, compared to those in the adult model. Meanwhile, the JAK–STAT activator and monocyte states in the adult model are more sensitive to aAI than those of the juvenile model. Differences in the juvenile and adult model sensitivities could indicate therapeutics targeting these pathways would result in different treatment effectiveness among juveniles and adults. While production terms are not possible to evaluate independently from their respective degradation terms, we observe that the model is not highly sensitive to the degradation rates, providing additional support for not allowing degradation rates to take on age-specific values. Last, the global sensitivity analysis reveals the juvenile and adult models are not sensitive to bIN, the rate of neutrophil removal of infected cells, indicating this rate may not play a pivotal role in the model and could be simplified in future work.

Figure 8. Global sensitivity analysis for the ASFP scenario. Blue indicates the sensitivity for the juvenile model and red shows the sensitivity for the adult model.
Model simulations suggest drug therapies are more effective in juveniles than adults
Last, we wanted to use the ASFP model to predict the effectiveness of different potential therapeutics in juveniles and adults. Using the ASFP model, we first perform a knock-down study where we decrease the rate of cell infectivity by 25, 50, 75 and 100% (for a complete knock-out) in both juvenile and adult models to simulate an antiviral therapeutic (Figure 9). We observe that all six states (Supplementary Figure 5) are significantly more affected in the juvenile model compared to the adult cohort in response to the simulated anti-viral. For example, in the 50% knock-down case, monocyte counts decrease 76% in juveniles compared to 70% in adults. This difference is more pronounced in the 25% knock-down scenario, where we observe that monocyte levels decrease by 32% in juveniles and only 15% in adults. Similarly, in the 50% knock-down case, peak JAK–STAT activator levels are 41% of peak JAK–STAT activator levels in juveniles and 52% of peak JAK–STAT activator levels in adults 8 dpi. Altogether, these results suggest that administering an anti-viral drug targeting cell infectivity would be more effective in lowering inflammation in juveniles compared to adults during the first 8 dpi. While these results indicate differences in the effectiveness of an antiviral between juveniles and adults, it is important to note that the simulations were stopped at day 8 post infection, and the true peaks of JAK–STAT activators, like IFNs and IL-6, and monocytes may occur after this point.

Figure 9. Simulating effects of antiviral drug treatment. The cell infectivity (β) parameter is reduced to simulate the effect of an antiviral compound. The JAK–STAT activator and monocyte model trajectories are normalized to the maximum value of each state to the 0% knock-down scenario. (A) Juvenile trajectories for simulated model outputs. (B) Adult trajectories for simulated model outputs.
We also considered the effect of increasing JAK–STAT activator production rates via increasing IFN production rates, as a study by Beilharz et al. (110) found that the administration of low-dose IFN-α to H1N1 influenza infected mice protected the mice from lethal challenge. Figure 10 shows the simulated ASFP model trajectories for 25, 50, 75 and 100% increases in the rate of IFN production. In the 50% increase case, we can see that the decrease in viral loads and infected epithelial cells is greater in juveniles (22 and 21% respectively) compared to that in adults (19 and 17% respectively). Additionally, this simulated scenario reveals that the increase in JAK–STAT activator concentrations and monocyte counts is higher in adults than in juveniles. Adults experience a 30% increase in levels of JAK–STAT activators and a 34% increase in monocyte cell counts at 8 dpi while juveniles only show a 16% increase in JAK–STAT activator concentrations and 12% increase in monocytes. These results suggest that a therapeutic increasing IFN production would be slightly more effective (or comparable) at reducing viral loads and infected cell counts in juveniles, while in adults, the same treatment would lead to a greater increase in type I IFNs and monocytes, components of the immune response associated with higher levels of inflammation. However, it is important to note that the overall JAK–STAT activator and monocyte levels are still higher in juveniles than adults (Supplementary Figure 2), and thus, careful consideration should be given before administering type I IFNs to either cohort. Other interventions, such as simulating CCR2 knock-out studies, were tested but did not result in any age specific outcomes in the model (Supplementary Figures 1, 3).

Figure 10. Simulating effects of JAK–STAT activator treatment. The JAK–STAT activator production (aAI) parameter is increased to simulate the effect of administrating IFN. The model trajectories are normalized to the maximum value of each state to the 0% increase scenario. (A) Juvenile trajectories for simulated model outputs. (B) Adult trajectories for simulated model outputs.
Discussion
Overall, our mathematical model of the innate immune response to influenza infection is able to capture age-specific differences in immune responses. To our knowledge, this is the first mathematical model that captures the juvenile immune response to influenza infection. While other studies have considered the effect of age on innate and adaptive immune responses to influenza infection (52–54), this is the first mathematical model to identify age-specific differences between juveniles and adults. Our results suggest that allowing the rate of JAK–STAT activator production to take an age-specific parameter is sufficient to recapitulate the trajectory of immune responses observed in juvenile and adult mice. Additional independent studies lend credibility to these findings. Importantly, studies by Kumova et al. and Onufer et al. independently concluded type I IFNs, not virus titers, are the most important drivers of severe influenza infection in juvenile mice. A study by Davidson et al. (25) found that increased levels of type I IFNs resulted in more severe outcomes among mice. Similarly, human studies suggest elevated IFN concentrations drive severe disease pathogenesis in pediatric populations (14). Conversely, other studies contradict the hypothesis that higher amounts of type I IFNs are produced and drive disease severity in children compared to adults. A study by Clay et al. (8) found that IFN-α levels were significantly lower in juvenile rhesus macaques compared to their adult counterparts. However, even though some animal studies suggest that viral clearance and production of type I IFNs are impaired in juveniles, emerging data from human studies suggests that pathological host inflammatory responses, and not unchecked viral clearance, are to blame (13, 14, 25). Furthermore, independent modeling studies also confirm the importance of production of type I IFNs being a key determinant of influenza infection severity (43, 48–50).
Interestingly, the modeling screening does not identify monocyte induction as an age-specific parameter. The study by Coates et al. (10) showed that limiting monocyte induction through a CCR2 agonist results in lower IFN concentrations and monocyte cell counts, as well as increased survival rates and less inflammation and lung injury in juvenile mice. The modeling results shown here instead suggest that the difference in monocyte cell counts between juveniles and adults is driven by differences in type I IFNs/IL-6 concentrations and not necessarily the rate of monocyte recruitment. More research needs to be conducted to fully understand the relationship between production rates of type I IFNs and monocyte recruitment and activity. Additional data in this area could not only greatly aid in our understanding of the complex interplay between cytokines and myeloid cells during the innate immune response to influenza infection but could also provide model validation to the ASFP model scenario. Unfortunately, while the Coates et al. (10) study provided the experimental data (Figure 2) for parameterization of our model, the CCR2 knock-out study does not provide the same type I IFN measurements or measurements for IL-6 or neutrophil cell counts as the original study. Thus, we cannot use this knock-out study to validate our model.
Additionally, our model suggests that other leading hypotheses, such as age-specific differences in viral replication and infectivity, are not the primary drivers of lung injury and disease severity in pediatric populations. The model screening did not identify viral replication, viral decay, or the rate of cell infectivity as age-specific parameters. Further examination into these model scenarios revealed that allowing viral replication and cell infectivity to take on unique values between juveniles and adults resulted in poor fits to the experimental data and failure to capture key immune dynamic differences between juveniles and adults. Despite this, our therapeutic simulations suggest that an antiviral therapeutic targeting the rate of cell infectivity may be more effective in juveniles than adults (Figure 9; Supplementary Figure 5). These results support the need for further exploration into the effects of neuraminidase inhibitors, which reduce the ability of influenza virus to penetrate the mucus and infected other cells, or other antiviral drugs on influenza infection in pediatric populations (111). We believe future work using our model could be combined with techniques developed in other studies (112–115) to isolate the mechanisms of specific antiviral drugs of interest (115).
While our model suggests that increased production of JAK–STAT pathway activators like IL-6 and type I IFNs are the primary drivers of severe disease pathology in juveniles, this does not negate the possibility of related mechanisms also playing a pivotal role in determining infection outcomes. In addition to increased levels of IL-6 and type I IFNs, Coates et al. and other studies have found high levels of inflammatory cytokines, like TNF, in children compared to adults, which correlate with the severity of symptoms observed in pediatric influenza patients (4, 14, 116, 117). The involvement of TNF, particularly, is qualitatively supported by the conclusions of this model. While TNF-producing macrophages could not be incorporated due to lack of data on infiltrating macrophages, progenitor monocyte cell counts were also identified by Coates et al. as significantly different in adult and juvenile populations at 7 dpi (10, 118–120). Despite the exclusion of macrophages and TNF in our model, it is reasonable to expect that increases in the production rate of pro-inflammatory JAK–STAT activators also precipitates increased levels of downstream TNF. Another potential mechanism driving severe infection in juvenile populations is the decreased production of IL-12 and IFN-γ observed in children (121–123). While the exclusion of these data weakens our model, we believe our model is a good starting point for future experimental and computational work to build a more complete model of the juvenile and adult responses to influenza.
While the results of this study are extremely promising in aiding our understanding of influenza pathogenesis and potential treatment in children, there are a few limitations of this study. First and foremost, there was extremely limited data available for investigating the immune responses to influenza infection in both juveniles and adults. More complete data is necessary to understand the dynamics of the innate immune response and the recruitment of monocytes and neutrophils to the site of infection. To this end, additional measurements at early time points and the quantification of other cell types involved in clearance of infected cells would be critical (35). The first few days of influenza infection are a pivotal period for understanding the IL-6, type I IFNs, and pro-inflammatory cytokine production rates and their dynamics. Determining the differences between juveniles and adults during the initial stages of infection could aid in identifying and refining the main drivers of severe pediatric infection (25). Additionally, future work is needed to elucidate the specific mechanisms driving differential production of JAK–STAT activators in juveniles and adults. Wu et al. discovered that the transcription factor Wiz1 causes lowered production of type I IFNs during IAV infection (124). Greater understanding of the regulation of JAK–STAT activators could clarify the reason for their production parameter taking age-specific values in future models. Lastly, the global sensitivity and correlation analyses suggest that some of the parameters in the model are unidentifiable. For example, bIN has an extremely low sensitivity across all the outputs, suggesting its value cannot be confidently estimated given the model and data available. Additionally, the correlation analysis reveals that aAI, Juvenile and aAI, Adult and dA are highly correlated with one another. While we cannot independently estimate their parameter values, we can still confidently assert that aAI, Juvenile is greater than aAI, Adult as the ratio of log10 aAI, Adult to log10 aAI, Juvenile remains above one for all simulations produced by the PMC analysis. Overall, to improve upon the study, future work should incorporate data that has multiple time points, especially at early timepoints of infection, and data from knockout studies to validate and expand upon the current model.
Data availability statement
The original contributions presented in the study are included in the article/Supplementary material, further inquiries can be directed to the corresponding author.
Author contributions
LL: Data curation, Formal analysis, Investigation, Methodology, Software, Visualization, Writing – original draft. LN: Formal analysis, Investigation, Methodology, Writing – original draft. BH: Data curation, Investigation, Methodology, Writing – original draft. JA: Conceptualization, Data curation, Formal analysis, Funding acquisition, Methodology, Project administration, Resources, Supervision, Visualization, Writing – original draft. JS: Conceptualization, Data curation, Formal analysis, Funding acquisition, Investigation, Methodology, Project administration, Resources, Software, Supervision, Validation, Visualization, Writing – original draft, Writing – review & editing.
Funding
The author(s) declare that financial support was received for the research and/or publication of this article. The work is supported by NIH/NIAID R21AI153882, NIH/NIAID R01AI180382, and NSF CAREER award #1943777.
Conflict of interest
The authors declare that the research was conducted in the absence of any commercial or financial relationships that could be construed as a potential conflict of interest.
Generative AI statement
The authors declare that no Gen AI was used in the creation of this manuscript.
Any alternative text (alt text) provided alongside figures in this article has been generated by Frontiers with the support of artificial intelligence and reasonable efforts have been made to ensure accuracy, including review by the authors wherever possible. If you identify any issues, please contact us.
Publisher’s note
All claims expressed in this article are solely those of the authors and do not necessarily represent those of their affiliated organizations, or those of the publisher, the editors and the reviewers. Any product that may be evaluated in this article, or claim that may be made by its manufacturer, is not guaranteed or endorsed by the publisher.
Supplementary material
The Supplementary material for this article can be found online at: https://www.frontiersin.org/articles/10.3389/fams.2025.1694710/full#supplementary-material
SUPPLEMENTARY FIGURE 1 | Simulating effects of an antiviral drug treatment. The monocyte recruitment (aMA) parameter is reduced to simulate the effect of an antiviral compound. Raw magnitudes of the model trajectories are shown. (A) Juvenile trajectories for simulated model outputs. (B) Adult trajectories for simulated model outputs.
SUPPLEMENTARY FIGURE 2 | Simulating effects of JAK-STAT activator treatment. The JAK-STAT activator production (aAI) parameter is increased to simulate the effect of administrating IFN. Raw magnitudes of the model trajectories are shown. (A) Juvenile trajectories for simulated model outputs. (B) Adult trajectories for simulated model outputs.
SUPPLEMENTARY FIGURE 3 | Simulating effects of antiviral drug treatment. The monocyte recruitment (aMA) parameter is reduced to simulate the effect of an antiviral compound. The model trajectories are normalized to the maximum value of each state to the 0% knock-down scenario. (A) Juvenile trajectories for simulated model outputs. (B) Adult trajectories for simulated model outputs.
SUPPLEMENTARY FIGURE 4 | Simulating effects of antiviral drug treatment on all model outputs. The cell infectivity (β) parameter is reduced to simulate the effect of an antiviral compound. Raw magnitudes of the model trajectories are shown. (A) Juvenile trajectories for simulated model outputs. (B) Adult trajectories for simulated model outputs.
SUPPLEMENTARY FIGURE 5 | Simulating effects of antiviral drug treatment on all model outputs. The cell infectivity (β) parameter is reduced to simulate the effect of an antiviral compound. The model trajectories for all six states are normalized to the maximum value of each state to the 0% knock-down scenario. (A) Juvenile trajectories for simulated model outputs. (B) Adult trajectories for simulated model outputs.
SUPPLEMENTARY FIGURE 6 | Parameter distributions for the age-specific cell infectivity and JAK-STAT activator production via IFN production scenario. The purple shading indicates parameters that were shared between juvenile and adult models. Juvenile specific parameters are shown in blue and adult specific parameters are shown in red.
References
1. WHO. Influenza (seasonal). (2025). Available online at: https://www.who.int/news-room/fact-sheets/detail/influenza-(seasonal) (accessed Jul 23, 2025).
2. Johnson, NPAS, and Mueller, J. Updating the accounts: global mortality of the 1918-1920 ‘Spanish’ influenza pandemic. Bull Hist Med. (2002) 76:105–15. doi: 10.1353/bhm.2002.0022,
3. Centers for Disease Control and Prevention (CDC). (2024). Influenza-associated pediatric mortality. Available online at: https://gis.cdc.gov/GRASP/Fluview/PedFluDeath.html (accessed Jul 6, 2025).
4. Coates, BM, Staricha, KL, Wiese, KM, and Ridge, KM. Influenza a virus infection, innate immunity, and childhood. JAMA Pediatr. (2015) 169:956–63. doi: 10.1001/jamapediatrics.2015.1387,
5. AAP Committee on Infectious Diseases. Influenza. In: LK Pickering, CJ Baker, and DW Kimberlin, editors. Red book (2012): Report of the committee on infectious diseases. 29th ed. Elk Grove Village, IL: American Academy of Pediatrics (2012). 512–3.
6. Wong, KK, Jain, S, Blanton, L, Dhara, R, Brammer, L, Fry, AM, et al. Influenza-associated pediatric deaths in the United States, 2004-2012. Pediatrics. (2013) 132:796–804. doi: 10.1542/peds.2013-1493,
7. Li, CC, Wang, L, Eng, HL, You, HL, Chang, LS, Tang, KS, et al. Correlation of pandemic (H1N1) 2009 viral load with disease severity and prolonged viral shedding in children. Emerg Infect Dis. (2010) 16:1265–72. doi: 10.3201/eid1608.091918,
8. Clay, CC, Reader, JR, Gerriets, JE, Wang, TT, Harrod, KS, and Miller, LA. Enhanced viral replication and modulated innate immune responses in infant airway epithelium following H1N1 infection. J Virol. (2014) 88:7412–25. doi: 10.1128/JVI.00188-14,
9. Sun, S, Zhao, G, Xiao, W, Hu, J, Guo, Y, Yu, H, et al. Age-related sensitivity and pathological differences in infections by 2009 pandemic influenza a (H1N1) virus. Virol J. (2011) 8:52. doi: 10.1186/1743-422X-8-52
10. Coates, BM, Staricha, KL, Koch, CM, Cheng, Y, Shumaker, DK, Budinger, GRS, et al. Inflammatory monocytes drive influenza a virus–mediated lung injury in juvenile mice. J Immunol. (2018) 200:2391–404. doi: 10.4049/jimmunol.1701543,
11. Cowling, BJ, Chan, KH, Fang, VJ, Lau, LLH, So, HC, Fung, ROP, et al. Comparative epidemiology of pandemic and seasonal influenza a in households. N Engl J Med. (2010) 362:2175–84. doi: 10.1056/NEJMoa0911530,
12. Hara, M, Morihara, M, Takao, S, Fukuda, S, Shimazu, Y, Tanizawa, Y, et al. Influenza viral load and rapid influenza diagnostic tests in children and adults. Diagn Microbiol Infect Dis. (2012) 73:99–100. doi: 10.1016/j.diagmicrobio.2012.01.018,
13. Loeb, M, Singh, PK, Fox, J, Russell, ML, Pabbaraju, K, Zarra, D, et al. Longitudinal study of influenza molecular viral shedding in hutterite communities. J Infect Dis. (2012) 206:1078–84. doi: 10.1093/infdis/jis450,
14. Oshansky, CM, Gartland, AJ, Wong, SS, Jeevan, T, Wang, D, Roddam, PL, et al. Mucosal immune responses predict clinical outcomes during influenza infection independently of age and viral load. Am J Respir Crit Care Med. (2014) 189:449–62. doi: 10.1164/rccm.201309-1616OC,
15. Levy, O. Innate immunity of the newborn: basic mechanisms and clinical correlates. Nat Rev Immunol. (2007) 7:379–90. doi: 10.1038/nri2075,
16. Krishnan, S, Craven, M, Welliver, RC, Ahmad, N, and Halonen, M. Differences in participation of innate and adaptive immunity to respiratory syncytial virus in adults and neonates. J Infect Dis. (2003) 188:433–9. doi: 10.1086/376530
17. You, D, Ripple, M, Balakrishna, S, Troxclair, D, Sandquist, D, Ding, L, et al. Inchoate CD8+ T cell responses in neonatal mice permit influenza induced persistent pulmonary dysfunction 1. J Immunol. (2008) 181:3486–94. doi: 10.4049/jimmunol.181.5.3486
18. Dienz, O, Rud, JG, Eaton, SM, Lanthier, PA, Burg, E, Drew, A, et al. Essential role of IL-6 in protection against H1N1 influenza virus by promoting neutrophil survival in the lung. Mucosal Immunol. (2012) 5:258–66. doi: 10.1038/mi.2012.2,
19. Kikkert, M. Innate immune evasion by human respiratory RNA viruses. J Innate Immun. (2020) 12:4–20. doi: 10.1159/000503030
20. Lambert, L, and Culley, FJ. Innate immunity to respiratory infection in early life. Front Immunol. (2017) 8:1570. doi: 10.3389/fimmu.2017.01570,
21. Schmolke, M, and García-Sastre, A. Evasion of innate and adaptive immune responses by influenza a virus. Cell Microbiol. (2010) 12:873–80. doi: 10.1111/j.1462-5822.2010.01475.x,
22. Epstein, SL, Lo, CY, Misplon, JA, and Bennink, JR. Mechanism of protective immunity against influenza virus infection in mice without antibodies. J Immunol (1998);160:322–327. Available online at: http://journals.aai.org/jimmunol/article-pdf/160/1/322/1089375/im019800322o.pdf
23. Svitek, N, Rudd, PA, Obojes, K, Pillet, S, and von Messling, V. Severe seasonal influenza in ferrets correlates with reduced interferon and increased IL-6 induction. Virology. (2008) 376:53–9. doi: 10.1016/j.virol.2008.02.035,
24. Prigge, AD, Ma, R, Coates, BM, Singer, BD, and Ridge, KM. Age-dependent differences in t-cell responses to influenza a virus. Am J Respir Cell Mol Biol. (2020) 63:415–23. doi: 10.1165/rcmb.2020-0169TR,
25. Davidson, S, Crotta, S, McCabe, TM, and Wack, A. Pathogenic potential of interferon αβ in acute influenza infection. Nat Commun. (2014) 5:3864. doi: 10.1038/ncomms4864,
26. Herold, S, Steinmueller, M, Von Wulffen, W, Cakarova, L, Pinto, R, Pleschka, S, et al. Lung epithelial apoptosis in influenza virus pneumonia: the role of macrophage-expressed TNF-related apoptosis-inducing ligand. J Exp Med. (2008) 205:3065–77. doi: 10.1084/jem.20080201,
27. Sun, J, Madan, R, Karp, CL, and Braciale, TJ. Effector T cells control lung inflammation during acute influenza virus infection by producing IL-10. Nat Med. (2009) 15:277–84. doi: 10.1038/nm.1929,
28. van der Sandt, CE, Kreijtz, JHCM, and Rimmelzwaan, GF. Evasion of influenza a viruses from innate and adaptive immune responses. Viruses. (2012) 4:1438–76. doi: 10.3390/v4091438,
29. Yasui, H, Kiyoshima, J, and Hori, T. Reduction of influenza virus titer and protection against influenza virus infection in infant mice fed Lactobacillus casei Shirota. Clin Diagn Lab Immunol. (2004) 11:675–9. doi: 10.1128/CDLI.11.4.675-679.2004,
30. Onufer, AP, Mell, JC, Cort, L, Rao, A, Mdluli, NV, and Carey, AJ. Influenza virus-induced type I interferons disrupt alveolar epithelial repair and tight junction integrity in the developing lung. Mucosal Immunol. (2025) 18:607–19. doi: 10.1016/j.mucimm.2025.02.002,
31. Kumova, OK, Galani, IE, Rao, A, Johnson, H, Triantafyllia, V, Matt, SM, et al. Severity of neonatal influenza infection is driven by type I interferon and oxidative stress. Mucosal Immunol. (2022) 15:1309–20. doi: 10.1038/s41385-022-00576-x,
32. Beauchemin, CAA, and Handel, A. A review of mathematical models of influenza a infections within a host or cell culture: lessons learned and challenges ahead. BMC Public Health. (2011) 11:S7. doi: 10.1186/1471-2458-11-S1-S7,
33. Boianelli, A, Nguyen, VK, Ebensen, T, Schulze, K, Wilk, E, Sharma, N, et al. Modeling influenza virus infection: a roadmap for influenza research. Viruses. (2015) 7:5274–304. doi: 10.3390/v7102875,
34. Mochan, E, Ackerman, EE, and Shoemaker, JE. A systems and treatment perspective of models of influenza virus-induced host responses. PRO. (2018) 6:138. doi: 10.3390/pr6090138
35. Dobrovolny, HM, Reddy, MB, Kamal, MA, Rayner, CR, and Beauchemin, CAA. Assessing mathematical models of influenza infections using features of the immune response. PLoS One. (2013) 8:e57088. doi: 10.1371/journal.pone.0057088,
36. Handel, A, Longini, IM, and Antia, R. Neuraminidase inhibitor resistance in influenza: assessing the danger of its generation and spread. PLoS Comput Biol. (2007) 3:2456–64. doi: 10.1371/journal.pcbi.0030240,
37. Dobrovolny, HM, Gieschke, R, Davies, BE, Jumbe, NL, and Beauchemin, CAA. Neuraminidase inhibitors for treatment of human and avian strain influenza: a comparative modeling study. J Theor Biol. (2011) 269:234–44. doi: 10.1016/j.jtbi.2010.10.017,
38. Beauchemin, CAA, McSharry, JJ, Drusano, GL, Nguyen, JT, Went, GT, Ribeiro, RM, et al. Modeling amantadine treatment of influenza a virus in vitro. J Theor Biol. (2008) 254:439–51. doi: 10.1016/j.jtbi.2008.05.031,
39. Weaver, JJA, and Shoemaker, JE. Mathematical modeling of RNA virus sensing pathways reveals paracrine signaling as the primary factor regulating excessive cytokine production. Processes. (2020) 8:1–16. doi: 10.3390/pr8060719
40. Gregg, RW, Shabnam, F, and Shoemaker, JE. Agent-based modeling reveals benefits of heterogeneous and stochastic cell populations during cGAS-mediated IFNβ production. Bioinformatics. (2021) 37:1428–34. doi: 10.1093/bioinformatics/btaa969,
41. Gregg, RW, Sarkar, SN, and Shoemaker, JE. Mathematical modeling of the cGAS pathway reveals robustness of DNA sensing to TREX1 feedback. J Theor Biol. (2019) 462:148–57. doi: 10.1016/j.jtbi.2018.11.001,
42. Aponte-Serrano, JO, Weaver, JJA, Sego, TJ, Glazier, JA, and Shoemaker, JE. Multicellular spatial model of RNA virus replication and interferon responses reveals factors controlling plaque growth dynamics. PLoS Comput Biol. (2021) 17:e1008874. doi: 10.1371/journal.pcbi.1008874,
43. Baccam, P, Beauchemin, C, Macken, CA, Hayden, FG, and Perelson, AS. Kinetics of influenza a virus infection in humans. J Virol. (2006) 80:7590–9. doi: 10.1128/JVI.01623-05,
44. Bocharov, G, and Romanyukha, A. Mathematical model of antiviral immune response. III. Influenza a virus infection. J Theor Biol. (1994) 167:323–60. doi: 10.1006/jtbi.1994.1074,
45. Hancioglu, B, Swigon, D, and Clermont, G. A dynamical model of human immune response to influenza a virus infection. J Theor Biol. (2007) 246:70–86. doi: 10.1016/j.jtbi.2006.12.015,
46. Lee, HY, Topham, DJ, Park, SY, Hollenbaugh, J, Treanor, J, Mosmann, TR, et al. Simulation and prediction of the adaptive immune response to influenza a virus infection. J Virol. (2009) 83:7151–65. doi: 10.1128/JVI.00098-09,
47. Miao, H, Hollenbaugh, JA, Zand, MS, Holden-Wiltse, J, Mosmann, TR, Perelson, AS, et al. Quantifying the early immune response and adaptive immune response kinetics in mice infected with influenza a virus. J Virol. (2010) 84:6687–98. doi: 10.1128/JVI.00266-10,
48. Pawelek, KA, Huynh, GT, Quinlivan, M, Cullinane, A, Rong, L, and Perelson, AS. Modeling within-host dynamics of influenza virus infection including immune responses. PLoS Comput Biol. (2012) 8:e1002588. doi: 10.1371/journal.pcbi.1002588,
49. Saenz, RA, Quinlivan, M, Elton, D, MacRae, S, Blunden, AS, Mumford, JA, et al. Dynamics of influenza virus infection and pathology. J Virol. (2010) 84:3974–83. doi: 10.1128/JVI.02078-09,
50. Ackerman, EE, Weaver, JJA, and Shoemaker, JE. Mathematical modeling finds disparate interferon production rates drive strain-specific Immunodynamics during deadly influenza infection. Viruses. (2022) 14:906. doi: 10.3390/v14050906,
51. Ackerman, EE, Mochan, E, and Shoemaker, JE. Strain-specific immune response to influenza virus infection. IFAC-PapersOnLine. (2019) 52:101–6. doi: 10.1016/j.ifacol.2019.12.243
52. Hernandez-Vargas, EA, Wilk, E, Canini, L, Toapanta, FR, Binder, SC, Uvarovskii, A, et al. Effects of aging on influenza virus infection dynamics. J Virol. (2014) 88:4123–31. doi: 10.1128/JVI.03644-13,
53. Keef, E, Zhang, LA, Swigon, D, Urbano, A, Ermentrout, GB, Matuszewski, M, et al. Discrete dynamical modeling of influenza virus infection suggests age-dependent differences in immunity. J Virol. (2017) 91:e00395-17. doi: 10.1128/JVI.00395-17,
54. Mochan, E, Sego, TJ, and Ermentrout, B. Age-related changes to the immune system exacerbate the inflammatory response to pandemic H1N1 infection. Bull Math Biol. (2022) 84:88. doi: 10.1007/s11538-022-01045-z,
55. Liparulo, TS, and Shoemaker, JE. Mathematical modeling suggests that monocyte activity may drive sex disparities during influenza infection. Viruses. (2024) 16:837. doi: 10.3390/v16060837,
56. Whipple, B, Miura, TA, and Hernandez-Vargas, EA. Modeling the CD8+ T cell immune response to influenza infection in adult and aged mice. J Theor Biol. (2024) 593:111898. doi: 10.1016/j.jtbi.2024.111898,
57. Minucci, SB, Heise, RL, and Reynolds, AM. Review of mathematical modeling of the inflammatory response in lung infections and injuries. Front Appl Math Stat. (2020) 6:36. doi: 10.3389/fams.2020.00036
58. Karamanis, M, Beutler, F, Peacock, JA, Nabergoj, D, and Seljak, U. Accelerating astronomical and cosmological inference with preconditioned Monte Carlo. Mon Not R Astron Soc. (2022) 516:1644–53. doi: 10.1093/mnras/stac2272
59. Tamura, SI, and Kurata, T. Defense mechanisms against influenza virus infection in the respiratory tract mucosa. Jpn J Infect Dis. (2004) 57:236–47. doi: 10.7883/yoken.JJID.2004.236
60. Tamura, SI, Tanimoto, T, and Kurata, T. Mechanisms of broad cross-protection provided by influenza virus infection and their application to vaccines. Jpn J Infect Dis. (2005) 58:195–207. doi: 10.7883/yoken.JJID.2005.195,
61. de Veer, MJ, Holko, M, Frevel, M, Walker, E, Der, S, Paranjape, JM, et al. Functional classification of interferon-stimulated genes identified using microarrays. J Leukoc Biol. (2001) 69:912–20. doi: 10.1189/jlb.69.6.912
62. Julkunen, I, Melén, K, Nyqvist, M, Pirhonen, J, Sareneva, T, and Matikainen, S. Inflammatory responses in influenza a virus infection. Vaccine (2000);19:S32–S37. Available online at: www.elsevier.com/locate/vaccine
63. Koyama, S, Ishii, KJ, Coban, C, and Akira, S. Innate immune response to viral infection. Cytokine. (2008) 43:336–41. doi: 10.1016/j.cyto.2008.07.009,
64. Stegelmeier, AA, van Vloten, JP, Mould, RC, Klafuric, EM, Minott, JA, Wootton, SK, et al. Myeloid cells during viral infections and inflammation. Viruses. (2019) 11:168. doi: 10.3390/v11020168,
65. Wu, S, Metcalf, J, and Wu, W. Innate immune response to influenza virus. Curr Opin Infect Dis. (2011) 24:235–40. doi: 10.1097/QCO.0b013e328344c0e3,
66. Balachandran, S, Roberts, PC, Brown, LE, Truong, H, Pattnaik, AK, Archer, DR, et al. Essential role for the dsRNA-dependent protein kinase PKR in innate immunity to viral infection. Immunity. (2000) 13:129–41. doi: 10.1016/S1074-7613(00)00014-5,
67. Punt, J, Stranford, S, Jones, P, and Owen, J. Immunology. In: L Schultz, editor. North American. New York: W.H. Freeman (2019)
68. Ioannidis, I, McNally, B, Willette, M, Peeples, ME, Chaussabel, D, Durbin, JE, et al. Plasticity and virus specificity of the airway epithelial cell immune response during respiratory virus infection. J Virol. (2012) 86:5422–36. doi: 10.1128/JVI.06757-11,
69. Raftery, N, and Stevenson, NJ. Advances in anti-viral immune defence: revealing the importance of the IFN JAK/STAT pathway. Cell Mol Life Sci. (2017) 74:2525–35. doi: 10.1007/s00018-017-2520-2,
70. Au-Yeung, N, Mandhana, R, and Horvath, CM. Transcriptional regulation by STAT1 and STAT2 in the interferon JAK-STAT pathway. JAKSTAT. (2013) 2:e23931. doi: 10.4161/jkst.23931,
71. Horvath, CM. The Jak-STAT pathway stimulated by interferon γ. Sci STKE. (2004) 2004:tr8. doi: 10.1126/stke.2602004tr8
72. Horvath, CM. The Jak-STAT pathway stimulated by interferon α or interferon β. Sci STKE. (2004) 2004:tr9. doi: 10.1126/stke.2602004tr10,
73. Pascutti, MF, Erkelens, MN, and Nolte, MA. Impact of viral infections on hematopoiesis: from beneficial to detrimental effects on bone marrow output. Front Immunol. (2016) 7:364. doi: 10.3389/fimmu.2016.00364,
74. Gabay, C. Interleukin-6 and chronic inflammation. Arthritis Res Ther. (2006) 8:S3. doi: 10.1186/ar1917,
75. Kaplanski, G, Rie Marin, V, Lix Montero-Julian, F, Mantovani, A, and Farnarier, C. IL-6: a regulator of the transition from neutrophil to monocyte recruitment during inflammation. Trends Immunol. (2003) 24:25–9. doi: 10.1016/s1471-4906(02)00013-3
76. Seo, SU, Kwon, HJ, Ko, HJ, Byun, YH, Seong, BL, Uematsu, S, et al. Type I interferon signaling regulates Ly6Chi monocytes and neutrophils during acute viral pneumonia in mice. PLoS Pathog. (2011) 7:e1001304. doi: 10.1371/journal.ppat.1001304,
77. Delneste, Y, Charbonnier, P, Herbault, N, Magistrelli, G, Caron, G, Bonnefoy, JY, et al. Interferon-γ switches monocyte differentiation from dendritic cells to macrophages. Blood. (2003) 101:143–50. doi: 10.1182/blood-2002-04-1164,
78. Hashimoto, Y, Moki, T, Takizawa, T, Shiratsuchi, A, and Nakanishi, Y. Evidence for phagocytosis of influenza virus-infected, apoptotic cells by neutrophils and macrophages in mice. J Immunol. (2007) 178:2448–57. doi: 10.4049/jimmunol.178.4.2448
79. Tate, MD, Brooks, AG, and Reading, PC. The role of neutrophils in the upper and lower respiratory tract during influenza virus infection of mice. Respir Res. (2008) 9:57. doi: 10.1186/1465-9921-9-57,
80. George, ST, Lai, J, Ma, J, Stacey, HD, Miller, MS, and Mullarkey, CE. Neutrophils and influenza: a thin line between helpful and harmful. Vaccines (Basel). (2021) 9:597. doi: 10.3390/vaccines9060597
81. Taubenberger, JK, and Morens, DM. The pathology of influenza virus infections. Annu Rev Pathol. (2008) 3:499–522. doi: 10.1146/annurev.pathmechdis.3.121806.154316,
82. Möhler, L, Flockerzi, D, Sann, H, and Reichl, U. Mathematical model of influenza a virus production in large-scale microcarrier culture. Biotechnol Bioeng. (2005) 90:46–58. doi: 10.1002/bit.20363,
83. Pirhonen, J, Sareneva, T, Kurimoto, M, Julkunen, I, and Matikainen, S. Virus infection activates IL-1β and IL-18 production in human macrophages by a caspase-1-dependent pathway. J Immunol. (1999) 162:7322–9. doi: 10.4049/jimmunol.162.12.7322
84. Van Reeth, K, Van Gucht, S, and Pensaert, M. In vivo studies on cytokine involvement during acute viral respiratory disease of swine: troublesome but rewarding. Vet Immunol Immunopathol. (2002) 87:161–8. doi: 10.1016/s0165-2427(02)00047-8
85. Velazquez-Salinas, L, Verdugo-Rodriguez, A, Rodriguez, LL, and Borca, MV. The role of interleukin 6 during viral infections. Front Microbiol. (2019) 10:1057. doi: 10.3389/fmicb.2019.01057,
86. Price, I, Mochan-Keef, ED, Swigon, D, Ermentrout, GB, Lukens, S, Toapanta, FR, et al. The inflammatory response to influenza a virus (H1N1): an experimental and mathematical study. J Theor Biol. (2015) 374:83–93. doi: 10.1016/j.jtbi.2015.03.017,
87. Smith, AM, and Perelson, AS. Influenza a virus infection kinetics: quantitative data and models. Wiley Interdiscip Rev Syst Biol Med. (2011) 3:429–45. doi: 10.1002/wsbm.129,
89. Pawelek, KA, Dor, D, Salmeron, C, and Handel, A. Within-host models of high and low pathogenic influenza virus infections: the role of macrophages. PLoS One. (2016) 11:e0150568. doi: 10.1371/journal.pone.0150568,
90. Cao, P, Wang, Z, Yan, AWC, McVernon, J, Xu, J, Heffernan, JM, et al. On the role of CD8+ T cells in determining recovery time from influenza virus infection. Front Immunol. (2016) 7:7(DEC). doi: 10.3389/fimmu.2016.00611,
91. Brydon, EWA, Smith, H, and Sweet, C. Influenza a virus-induced apoptosis in bronchiolar epithelial (NCl-H292) cells limits pro-inflammatory cytokine release. J Gen Virol. (2003) 84:2389–400. doi: 10.1099/vir.0.18913-0
92. Hinshaw, VS, Olsen, CW, Dybdahl-Sissoko, N, and Evans, D. Apoptosis: a mechanism of cell killing by influenza a and B viruses. J Virol. (1994) 68:3667–73. doi: 10.1128/jvi.68.6.3667-3673.1994,
93. Horníčková, Z. Different progress of MDCK cell death after infection by two different influenza virus isolates. Cell Biochem Funct. (1997) 15:87–93. doi: 10.1002/(SICI)1099-0844(19970601)15:2<87::AID-CBF726>3.0.CO;2-6
94. Price, GE, Smith, H, and Sweet, C. Differential induction of cytotoxicity and apoptosis by influenza virus strains of differing virulence. J Gen Virol. (1997) 78:2821–9. doi: 10.1099/0022-1317-78-11-2821,
95. Stray, SJ, and Air, GM. Apoptosis by influenza viruses correlates with efficiency of viral mRNA synthesis. Virus Res. (2001) 77:3–17. doi: 10.1016/S0168-1702(01)00260-X,
96. Takizawa, T, Matsukawa, S, Higuchi, Y, Nakamura, S, Nakanishi, Y, and Fukuda, R. Induction of programmed cell death (apoptosis) by influenza virus infection in tissue culture cells. J Gen Virol. (1993) 74:2347–55. doi: 10.1099/0022-1317-74-11-2347
97. Zhirnov, OP, Konakova, TE, Wolff, T, and Klenk, HD. NS1 protein of influenza a virus Down-regulates apoptosis. J Virol. (2002) 76:1617–25. doi: 10.1128/JVI.76.4.1617-1625.2002,
98. Horsfall, F. Reproduction of influenza viruses; quantitative investigations with particle enumeration procedures on the dynamics of influenza a and B viruses reproduction. J Exp Med. (1955) 102:441–73.
99. Horsfall, FL. On the reproduction of influenza virus; quantitative studies with procedures which enumerate infective and hemagglutinating virus particles. J Exp Med. (1954) 100:135–61.
100. Hahon, N, Booth, JA, and Eckert, HL. Cell attachment and penetration by influenza virus. Infect Immun. (1973) 7:341–51. doi: 10.1128/iai.7.3.341-351.1973,
101. Choppin, PW. Multiplication of two kinds of influenza A2 virus particles in monkey kidney cells. Virology. (1963) 21:342–52. doi: 10.1016/0042-6822(63)90195-8,
102. Schuit, M, Gardner, S, Wood, S, Bower, K, Williams, G, Freeburger, D, et al. The influence of simulated sunlight on the inactivation of influenza virus in aerosols. J Infect Dis. (2021) 221:372–8. doi: 10.1093/infdis/jiz582
103. Harari, D, Abramovich, R, Zozulya, A, Smith, P, Pouly, S, Köster, M, et al. Bridging the species divide: transgenic mice humanized for type-I interferon response. PLoS One. (2014) 9:e84259. doi: 10.1371/journal.pone.0084259,
104. Patel, AA, Ginhoux, F, and Yona, S. Monocytes, macrophages, dendritic cells and neutrophils: an update on lifespan kinetics in health and disease. Immunology. (2021) 163:250–61. doi: 10.1111/imm.13320,
105. Summers, C, Rankin, SM, Condliffe, AM, Singh, N, Peters, AM, and Chilvers, ER. Neutrophil kinetics in health and disease. Trends Immunol. (2010) 31:318–24. doi: 10.1016/j.it.2010.05.006,
106. Karamanis, M, Nabergoj, D, Beutler, F, Peacock, JA, and Seljak, U. PocoMC: a Python package for accelerated Bayesian inference in astronomy and cosmology. arXiv Astrophysics (2022). Available online at: http://arxiv.org/abs/2207.05660.
107. Pedregosa, F, Varoquaux, G, Gramfort, A, Michel, V, Thirion, B, Grisel, O, et al. Scikit-learn: machine learning in Python. J Mach Learn Res (2011);12:2825–2830. Available online at: http://scikit-learn.sourceforge.net.
108. Myers, MA, Smith, AP, Lane, LC, Moquin, DJ, Aogo, RA, Woolard, S, et al. Dynamically linking influenza virus infection kinetics, lung injury, inflammation, and disease severity. eLife. (2021) 10:10. doi: 10.7554/eLife.68864,
109. Berchtold, A. Sequence analysis and transition models. In: MD Breed and J Moore, editors. The encyclopedia of animal behavior. London, UK : Academic Press (2010)
110. Beilharz, MW, Cummins, JM, and Bennett, AL. Protection from lethal influenza virus challenge by oral type 1 interferon. Biochem Biophys Res Commun. (2007) 355:740–4. doi: 10.1016/j.bbrc.2007.02.019,
111. Jefferson, T, Jones, MA, Doshi, P, Del Mar, CB, Hama, R, Thompson, MJ, et al. Neuraminidase inhibitors for preventing and treating influenza in adults and children. Cochrane Database Syst Rev. (2014) 132:256–7. doi: 10.1590/1516-3180.20141324T2,
112. Samui, P, Mondal, J, Ahmad, B, and Chatterjee, AN. Clinical effects of 2-DG drug restraining SARS-CoV-2 infection: a fractional order optimal control study. J Biol Phys. (2022) 48:415–38. doi: 10.1007/s10867-022-09617-9,
113. Roy, PK, Chatterjee, AN, Greenhalgh, D, and Khan, QJA. Long term dynamics in a mathematical model of HIV-1 infection with delay in different variants of the basic drug therapy model. Nonlinear Anal Real World Appl. (2013) 14:1621–33. doi: 10.1016/j.nonrwa.2012.10.021
114. Samui, P, Mondal, S, Mondal, J, and Chatterjee, AN. Effect of vaccination to control measles epidemic in light of economic progression. Int J Dyn Control. (2025) 13:359. doi: 10.1007/s40435-025-01861-w
115. Chatterjee, AN, and Ahmad, B. A fractional-order differential equation model of COVID-19 infection of epithelial cells. Chaos Solitons Fractals. (2021) 147:110952. doi: 10.1016/j.chaos.2021.110952
116. Kim, YH, Kim, JE, and Hyun, MC. Cytokine response in pediatric patients with pandemic influenza H1N1 2009 virus infection and pneumonia: comparison with pediatric pneumonia without H1N1 2009 infection. Pediatr Pulmonol. (2011) 46:1233–9. doi: 10.1002/ppul.21496,
117. Hall, MW, Geyer, SM, Guo, CY, Panoskaltsis-Mortari, A, Jouvet, P, Ferdinands, J, et al. Innate immune function and mortality in critically III children with influenza: a multicenter study. Crit Care Med. (2013) 41:224–36. doi: 10.1097/CCM.0b013e318267633c
118. Parameswaran, N, and Patial, S. Tumor necrosis factor-α signaling in macrophages. Crit Rev Eukaryot Gene Expr. (2010) 20:87–103. doi: 10.1615/critreveukargeneexpr.v20.i2.10,
119. Peschke, T, Bender, A, Nain, M, and Gemsa, D. Role of macrophage cytokines in influenza a virus lnfections. Immunobiology. (1993) 189:340–55. doi: 10.1016/S0171-2985(11)80365-7,
120. Nain, M, Hinder, F, Gong, JH, Schmidt, A, Bender, A, Sprenger, H, et al. TNF production of influenza a virus infected macrophages and potentiating effect of LPS. J Immunol. (1990). Available online at: https://www.researchgate.net/publication/20765518.
121. Corbett, NP, Blimkie, D, Ho, KC, Cai, B, Sutherland, DP, Kallos, A, et al. Ontogeny of toll-like receptor mediated cytokine responses of human blood mononuclear cells. PLoS One. (2010) 5:e15041. doi: 10.1371/journal.pone.0015041,
122. Kollmann, TR, Levy, O, Montgomery, RR, and Goriely, S. Innate immune function by toll-like receptors: distinct responses in newborns and the elderly. Immunity. (2012) 37:771–83. doi: 10.1016/j.immuni.2012.10.014,
123. Kollmann, TR, Crabtree, J, Rein-Weston, A, Blimkie, D, Thommai, F, Wang, XY, et al. Neonatal innate TLR-mediated responses are distinct from those of adults. J Immunol. (2009) 183:7150–60. doi: 10.4049/jimmunol.0901481,
Keywords: mathematical modeling, age-specific, lung immune data, Bayesian statistics, Monte Carlo, immunological mechanisms, ordinary differential equation, ODE model
Citation: Luciani LL, Nichols LM, Huckestein BR, Alcorn JF and Shoemaker JE (2025) Mathematical model of influenza infection suggests JAK–STAT activity drives severe pathologies in juvenile mice. Front. Appl. Math. Stat. 11:1694710. doi: 10.3389/fams.2025.1694710
Edited by:
Hana Maria Dobrovolny, Texas Christian University, United StatesReviewed by:
Esteban A. Hernandez-Vargas, University of Idaho, United StatesAhmed Elaiw, King Abdulaziz University, Saudi Arabia
Copyright © 2025 Luciani, Nichols, Huckestein, Alcorn and Shoemaker. This is an open-access article distributed under the terms of the Creative Commons Attribution License (CC BY). The use, distribution or reproduction in other forums is permitted, provided the original author(s) and the copyright owner(s) are credited and that the original publication in this journal is cited, in accordance with accepted academic practice. No use, distribution or reproduction is permitted which does not comply with these terms.
*Correspondence: Jason E. Shoemaker, amFzb24uc2hvZW1ha2VyQHBpdHQuZWR1