Abstract
The sizes of earthquakes are measured using well-defined, measurable quantities such as seismic moment and released or transformed elastic energy. No similar measures exist for the sizes of volcanic eruptions, making it difficult to compare the energies released in earthquakes and eruptions. Here I provide a new measure of the elastic energy (the potential mechanical energy) associated with magma chamber rupture and contraction (shrinkage) during an eruption. For earthquakes and eruptions, elastic energy derives from two sources: (1) the strain energy stored in the volcano/fault zone before rupture, and (2) the external applied load (force, pressure, stress, displacement) on the volcano/fault zone. From thermodynamic considerations it follows that the elastic energy released or transformed (dU) during an eruption is directly proportional to the excess pressure (pe) in the magma chamber at the time of rupture multiplied by the volume decrease (−dVc) of the chamber, so that dU = −pedVc. This formula can be used as a basis for a new eruption magnitude scale, based on elastic energy released, which can be related to the moment-magnitude scale for earthquakes. For very large eruptions (>100 km3), the volume of the feeder-dike is negligible. Then the decrease in chamber volume during the eruption corresponds roughly to the associated volume of erupted materials Ver and the elastic energy is Uer = peVer. Using a typical excess pressures of 5 MPa, it is shown that the largest known eruptions on Earth, such as the explosive La Garita Caldera eruption (27–28 million years ago) and largest single (effusive) Colombia River basalt lava flows (15–16 million years ago), both of which have estimated volumes of about 5000 km3, released elastic energy of the order of 1019 J. For comparison, the seismic moment of the largest earthquake ever recorded, the M9.5 1960 Chile earthquake, is estimated at 1023 J and the associated elastic energy release at 1019 J. Thus, the largest eruptions release elastic energy of the same order of magnitude as the largest earthquakes, suggesting that 1019 J may be close to the maximum elastic energy that is available for driving earthquakes and volcanic eruptions.
Introduction
Earthquake sizes have for a long time been calculated from well-established magnitude scales. The early scales were based on the logarithm of the amplitude (maximum displacement) of the wave trace (signal) on a seismogram. This is, for example, the basis for the scales using the Richter local-magnitude (ML), the surface-wave magnitude (Ms), and the body-wave magnitude (mb). These scales all relate to the effects of the energy transformed or released (both terms will be used here) during an earthquake on seismograms at a certain distance from the earthquake source or foci. These amplitude scales have, to a large degree and certainly for moderate to great earthquakes (larger than M4), been replaced by the moment-magnitude (Mw) scale (Kanamori, 1977; Hanks and Kanamori, 1979; Aki and Richards, 2009). This scale derives from the concept of a moment magnitude for earthquakes and measures the sizes of earthquakes in terms of seismic moment, which has the units of Nm.
The seismic moment and the elastic energy transformed during an earthquake are directly related to measureable parameters. For example, the seismic moment is related to the area of the fault rupture, the average displacement or slip during the rupture, and an elastic constant (Figure 1). All these factors have clear operational definitions and can normally be measured or estimated with modern technology. The rupture areas can also be inferred from palaeo-seismological studies so as to estimate the seismic moments of earthquakes that occurred before instrumental data became available (Kanamori and Brodsky, 2004). The elastic energy that is transformed during earthquakes into other types of energy, partly seismic waves (kinetic energy) and heat, can be calculated using well-tested formulas from fracture mechanics, as is explained below.
Figure 1
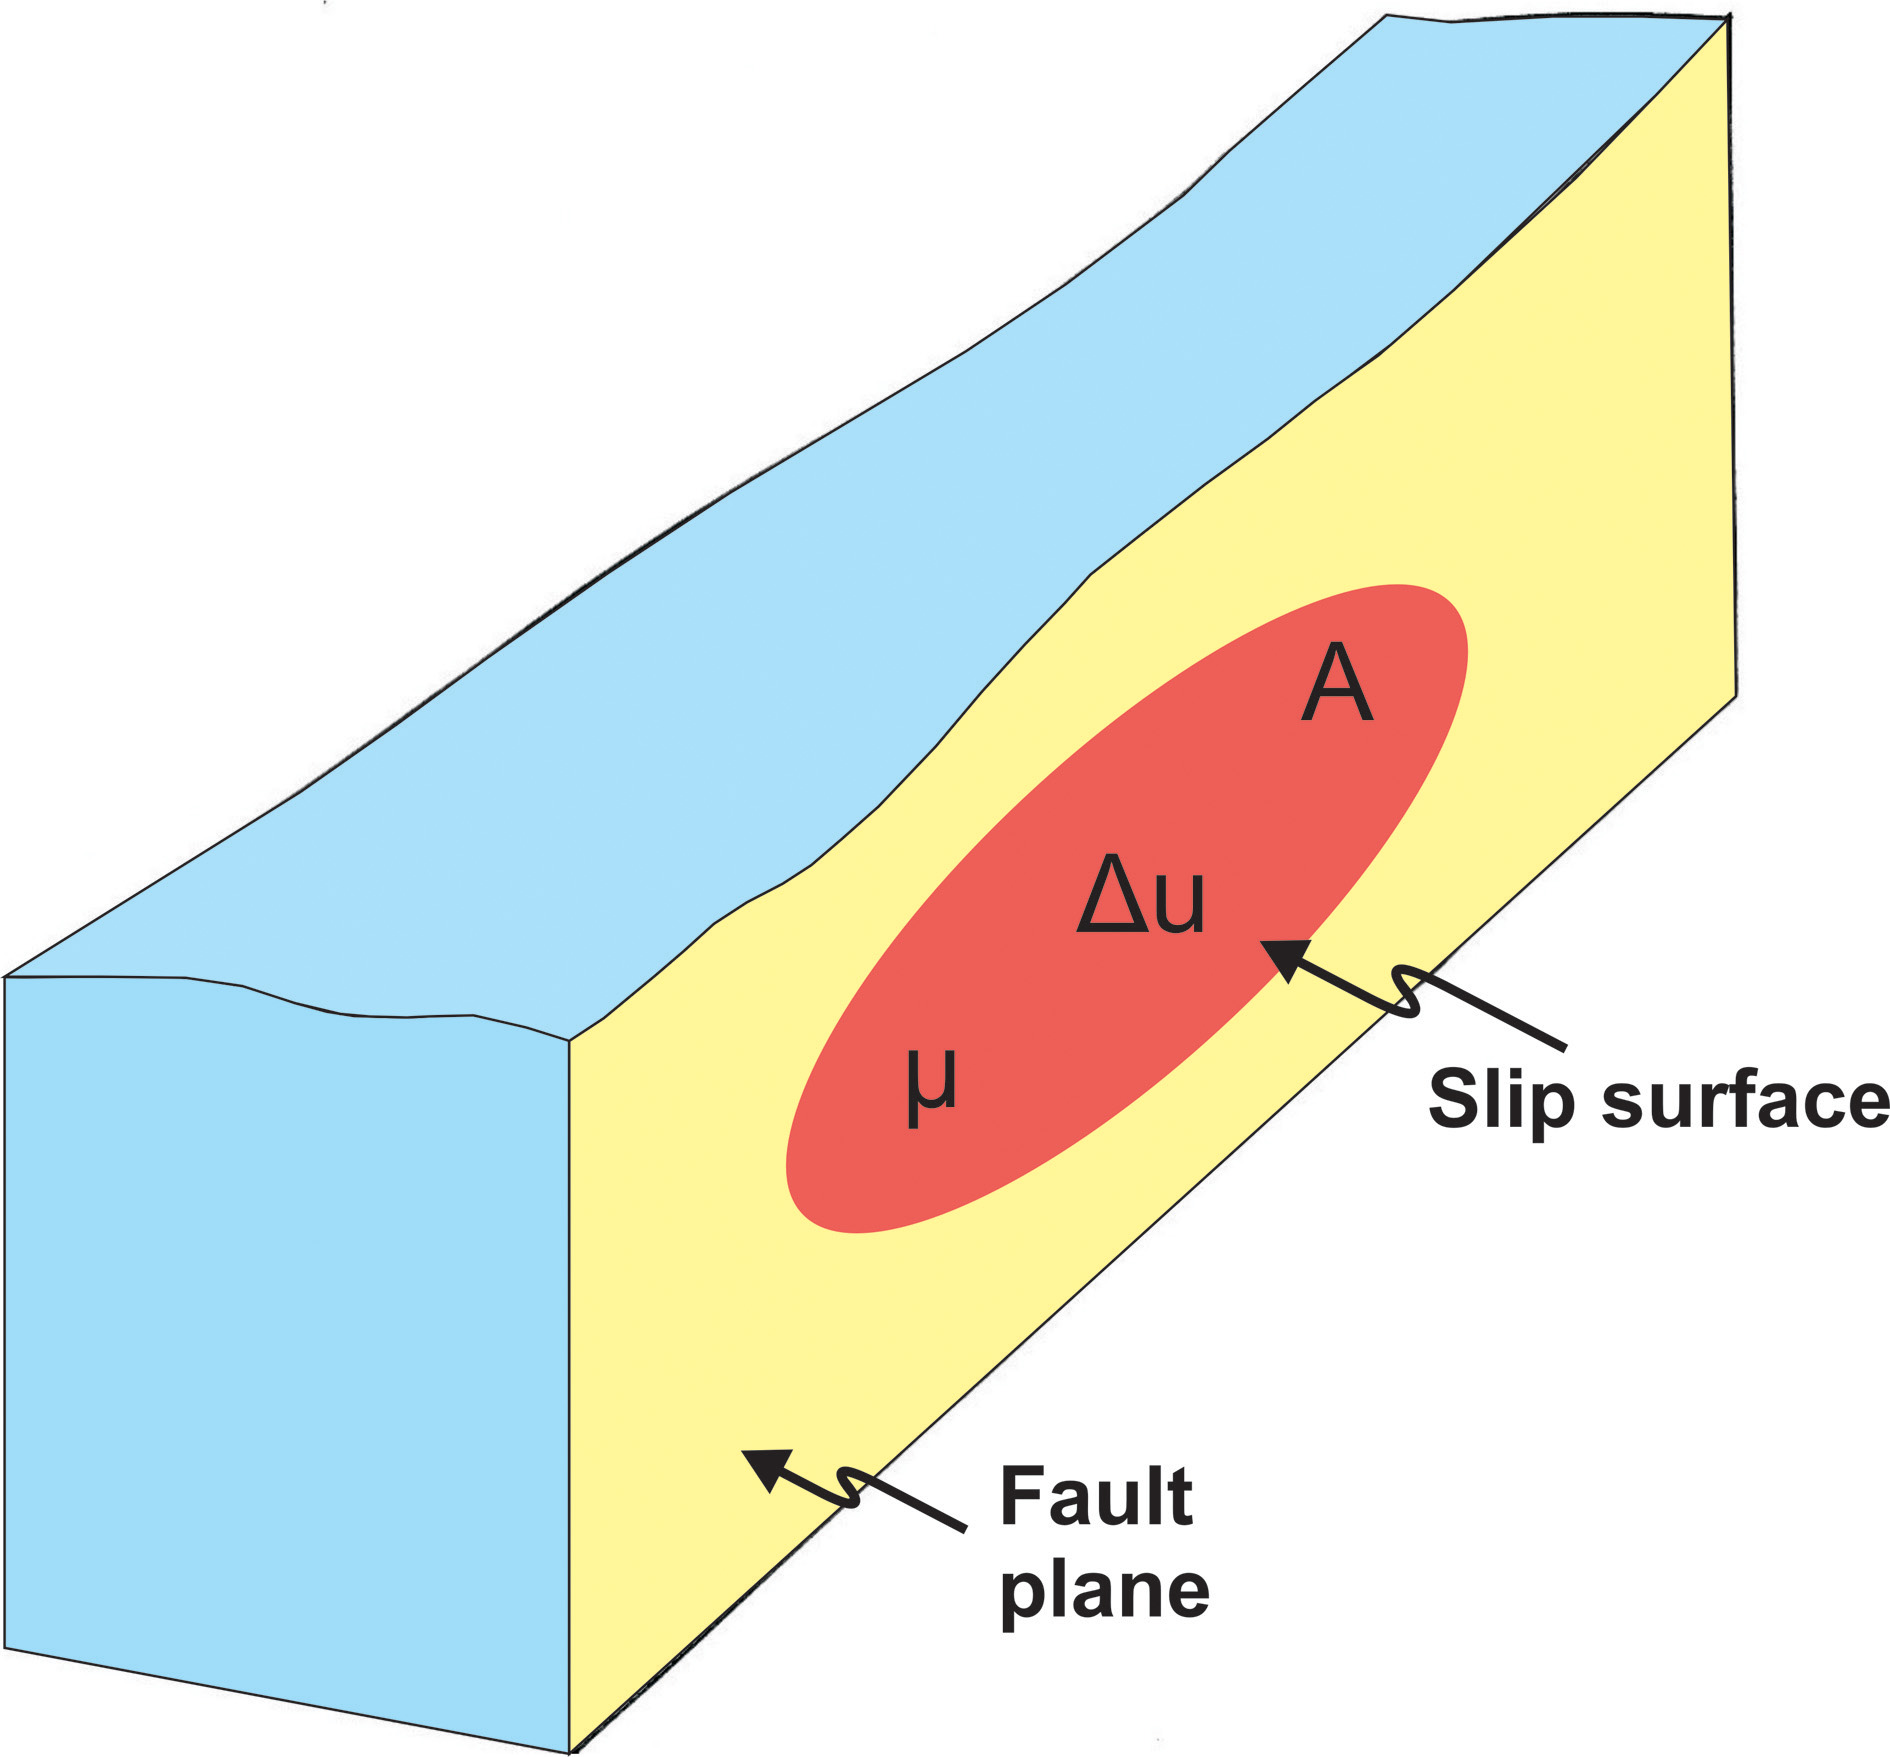
Schematic illustration to explain the seismic moment. Here the slip surface or rupture plane is shown as forming a part of the general and much larger fault plane. The slip surface itself for this particular earthquake does not reach to the surface. The slip surface/rupture plane has an area of size A. The slip is denoted by Δu and the shear modulus of the rock by μ.
No similar measures exist for the elastic energy released or transformed during volcanic eruptions. There have been several proposed measures of eruption sizes. The eruption-magnitude measures tend to focus on the amount of tephra produced during explosive eruptions (e.g., Tsuya, 1955; Hedervari, 1963; Pyle, 2000; Mason et al., 2004; Crosweller et al., 2012). Perhaps the best known of these magnitude measures is the Volcanic Explosivity Index (VEI) of Newhall and Self (1982) which, again, relates particularly to the amount or mass of tephra produced during an eruption, although other indicators are also used. A second measure of an eruption size is its intensity (Fedotov, 1985; Carey and Sigurdsson, 1989; Pyle, 2000). This measure relates to the mass eruption rate, that is, the mass of eruptive materials produced per unit time. Both these measures are logarithmic, using the common logarithm.
The third measure of eruption size, which relates directly to energy, is the thermal energy released or transformed during the eruption. This has been estimated by many (e.g., Yokoyama, 1957; Pyle, 1995, 2000). The thermal energy released in eruptions is normally several orders of magnitude larger than any other energy transformed during the eruption (e.g., Pyle, 2000; Smil, 2008). However, the total thermal energy released in eruptions each year is only a tiny fraction of the thermal energy released through the worldwide geothermal flux. Some estimates put the total thermal energy released in eruptions each year as 0.5–2% of the energy released through the general cooling of the Earth (Elder, 1976; Verhoogen, 1980).
The thermal energy released in an eruption is primarily related to the solidification and cooling of the erupted materials. Solidification of magma and the subsequent cooling of the volcanic rock to ambient temperatures is a continuous process in all volcanic areas, particularly in the shallow source magma chambers of individual polygenetic volcanoes. Thermal energy, however, is a “low-grade” energy since only a fraction of it can be transformed into other types of energy, such as mechanical energy, elastic energy, electric energy, and (mechanical) work. Some thermal energy may be transformed into work related to driving the upward movement of fine particles in a buoyant plume (Sparks et al., 1997; Mason et al., 2004). Generally, however, thermal energy has little, if any, role to play in magma-chamber rupture and feeder-dike formation, namely the processes that lead to an eruption and, subsequently, squeeze the magma out of the chamber.
None of the measures for an eruption size discussed above relate to the elastic energy released or transformed during the eruption. The principal aim of this paper is to propose such a measure and show that it can be directly compared with the energy released in earthquakes. Further development of this measure could include the thermal energy associated with eruptions and earthquakes, changes in the potential energy of the magma, and other forms of energy transformation, but here the focus is on the elastic energy. Using this new elastic-energy measure for volcanic eruptions, it is shown that the largest known eruptions release elastic energy that is comparable with that released in the largest recorded earthquakes.
Sizes of earthquakes and eruptions
The size distributions of earthquakes and volcanic eruptions follow power laws. Power laws are part of heavy-tailed distributions, but are characterized by their yielding straight-line plots when the data have been log-transformed on so-called log-log plots (Figure 2). More specifically, power-law size distributions are very common in various human-made and natural structures and processes (e.g., Newman, 2005; Mohajeri and Gudmundsson, 2012; Gudmundsson and Mohajeri, 2013). Such laws imply that the number of small events, processes, or objects in a given population is large in comparison with the number of large events, processes, or objects in the same population.
Figure 2
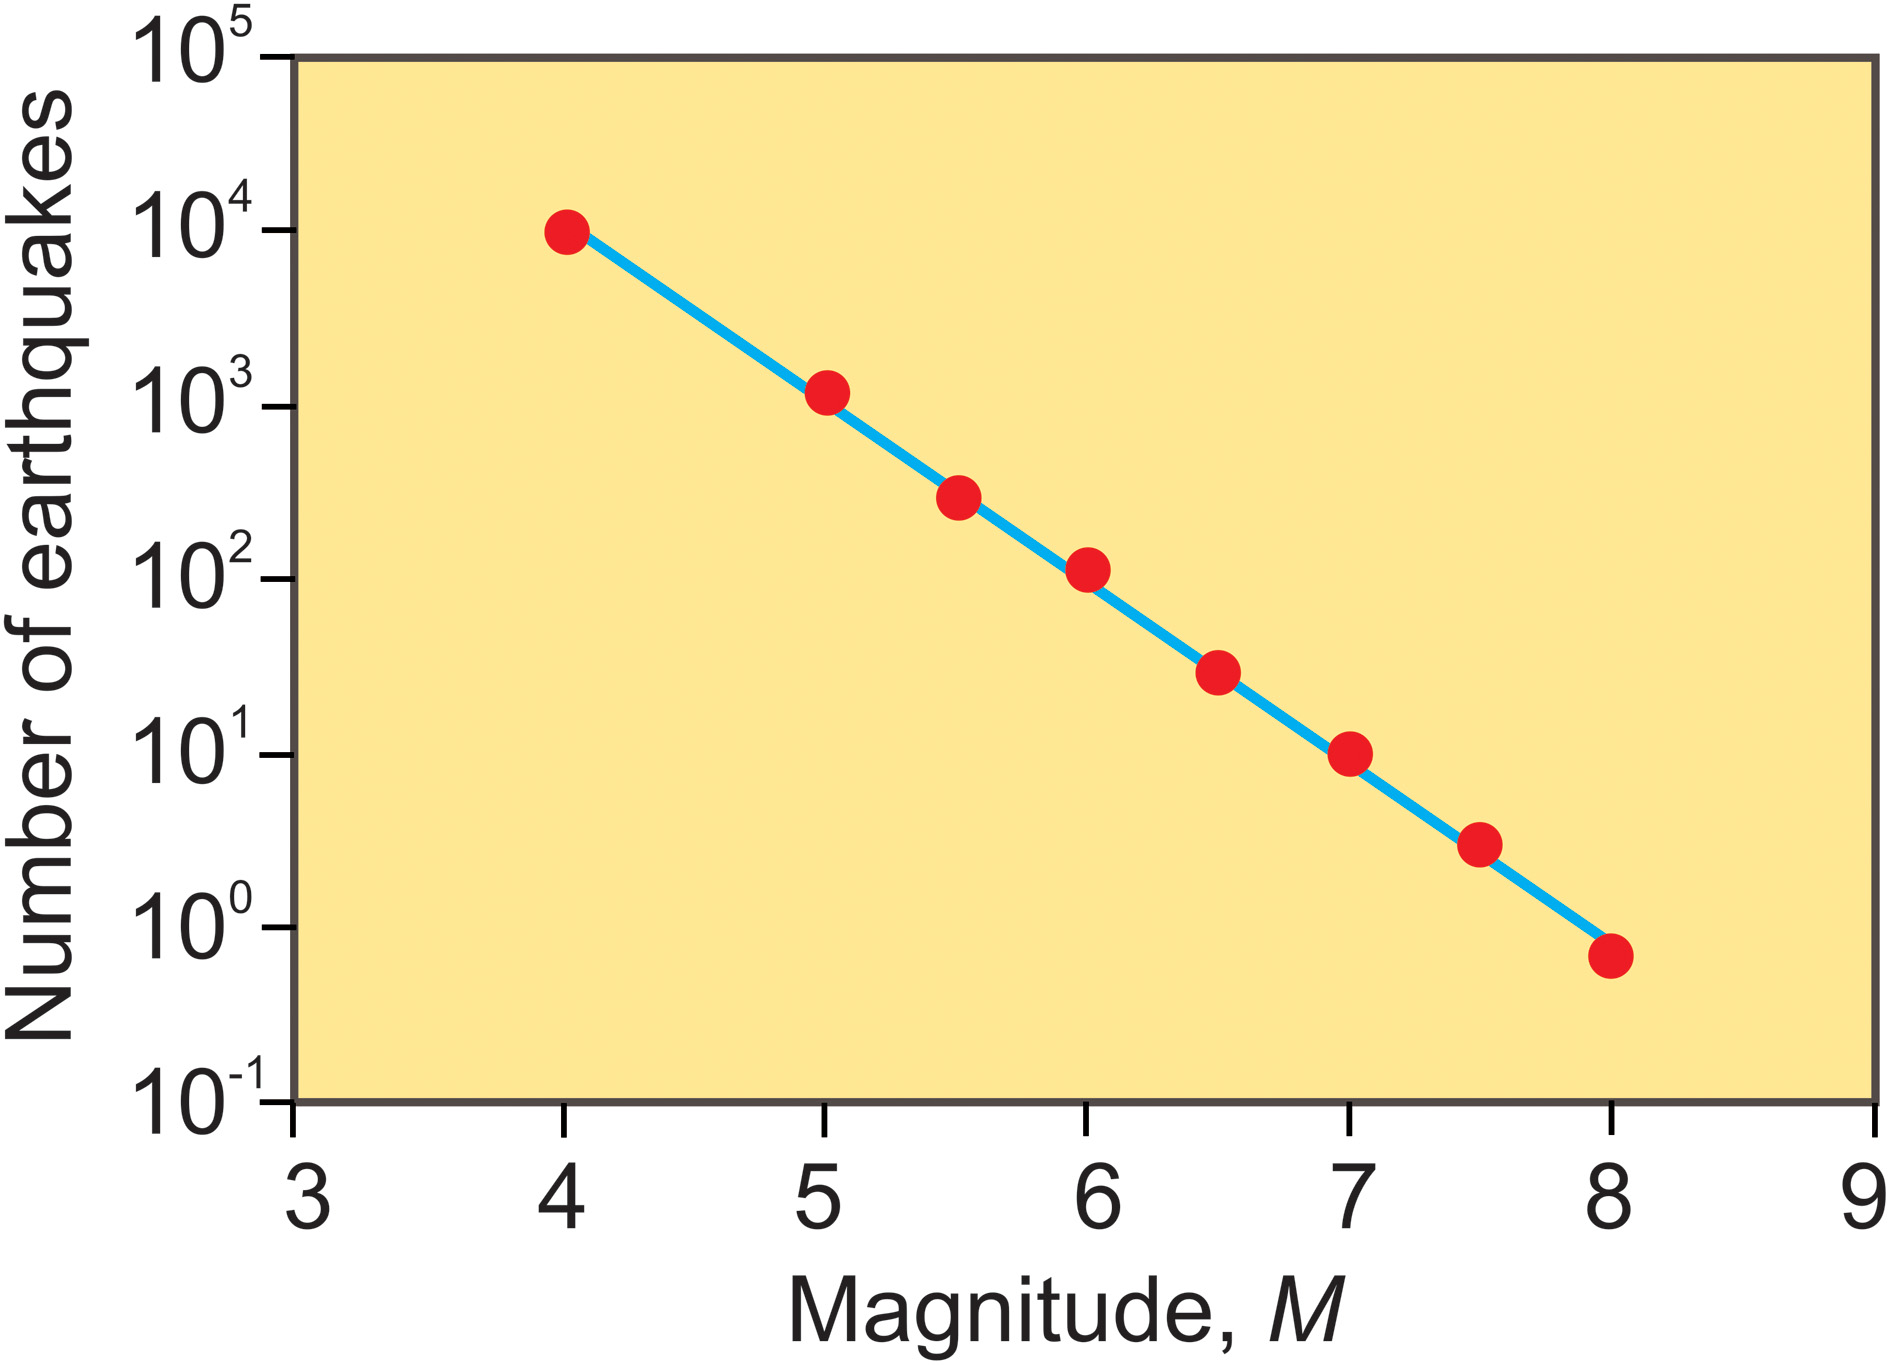
Number (frequency) of earthquakes per year vs. their magnitudes. The plot shows the earthquakes in the world during the period from 1904 to 1980 (modified from Kanamori and Brodsky, 2004). This is a semi-logarithmic plot with a slope of −1. For the Gutenberg-Richter law, log N = a − bM, where a and b are constants and M the magnitude (a logarithmic measure), the slope of −1 implies a b-value of 1.
For a cumulative frequency (probability) distribution, a power law has the form:
P(≥ x) is here the number or frequency of earthquakes or eruptions equal to or larger than x, C is a constant, and D is referred to as the scaling exponent. For a first check as to whether a size distribution is a power-law, one plots the logarithms of the value (x) and its probability P(x), namely log (P(x)) = log (C) − D log(x). When such as bi-logarithmic plot, referred to as log-log plot, yields a straight line then the distribution is commonly regarded as power law. More accurate test, however, are available and needed so as to compare the fit of the distribution to power laws in relation to other possible functions. The main tests are discussed by Clauset et al. (2009) and applied to geological populations by Mohajeri and Gudmundsson (2012) and Gudmundsson and Mohajeri (2013).
Here the focus is on large earthquakes and eruptions. Earthquakes are classified as moderate if their magnitude is in the range of 5–5.9, strong if the magnitude is in the range of 6–6.9, major if the magnitude is in the range of 7–7.9, and great if the magnitude is 8 or larger. For the earth as a whole, there are normally 800 moderate, 110 strong, 12 major, and 1 great earthquakes each year, in accordance with their power-law size distribution (Figure 2). The largest earthquake that has ever been instrumentally recorded is the M9.5 earthquake in Chile in 1960 (the Valdivia Earthquake). The estimated rupture length is between 800 km and 920 ± 100 km (Barrientos and Ward, 1990). The maximum slip is estimated at 25–30 m (Fujii and Satake, 2013), although one estimate reached 90 m, while the average slip is thought to be about 24 m (Kanamori and Cipar, 1974; Barrientos and Ward, 1990). Other large instrumentally recorded earthquakes include the 1964 earthquake in Alaska (M9.2), the 2004 Sumatra-Andaman Earthquake (M9.1), and the 2011 Tohoku-Oki Earthquake close to Japan (M9.0). The details of these earthquakes are widely reported (e.g., Kanamori, 1977; Park et al., 2005; Iinuma et al., 2012; Fulton et al., 2013; Gupta and Gahalaut, 2013). All these earthquakes released very great energies, as discussed in the next section.
Eruption sizes also follow power laws (Figure 3). The largest instrumentally monitored eruption is the one in Mount Pinatubo in the Philippines in 1991 (Newhall et al., 1998). This eruption produced some 10 km3 of eruptive materials and generated a collapse caldera with a diameter of roughly 2.5 km. Another eruption in the twentieth century was significantly larger, namely the 1912 eruption of Novarupta in Katmai, Alaska. This eruption produced some 28 km3 of eruptive materials, mainly acid and intermediate tephra (tuff) and resulted in the formation of a collapse caldera, not in Novarupta itself (the volcano was formed in the eruption, and thus a new volcano) but in the nearby Mount Katmai. The maximum diameter of the caldera is about 4 km. However, the Novarupta eruption occurred before the time of modern instrumentation. Both eruptions have VEI 6-6.5 (Pyle, 2000).
Figure 3
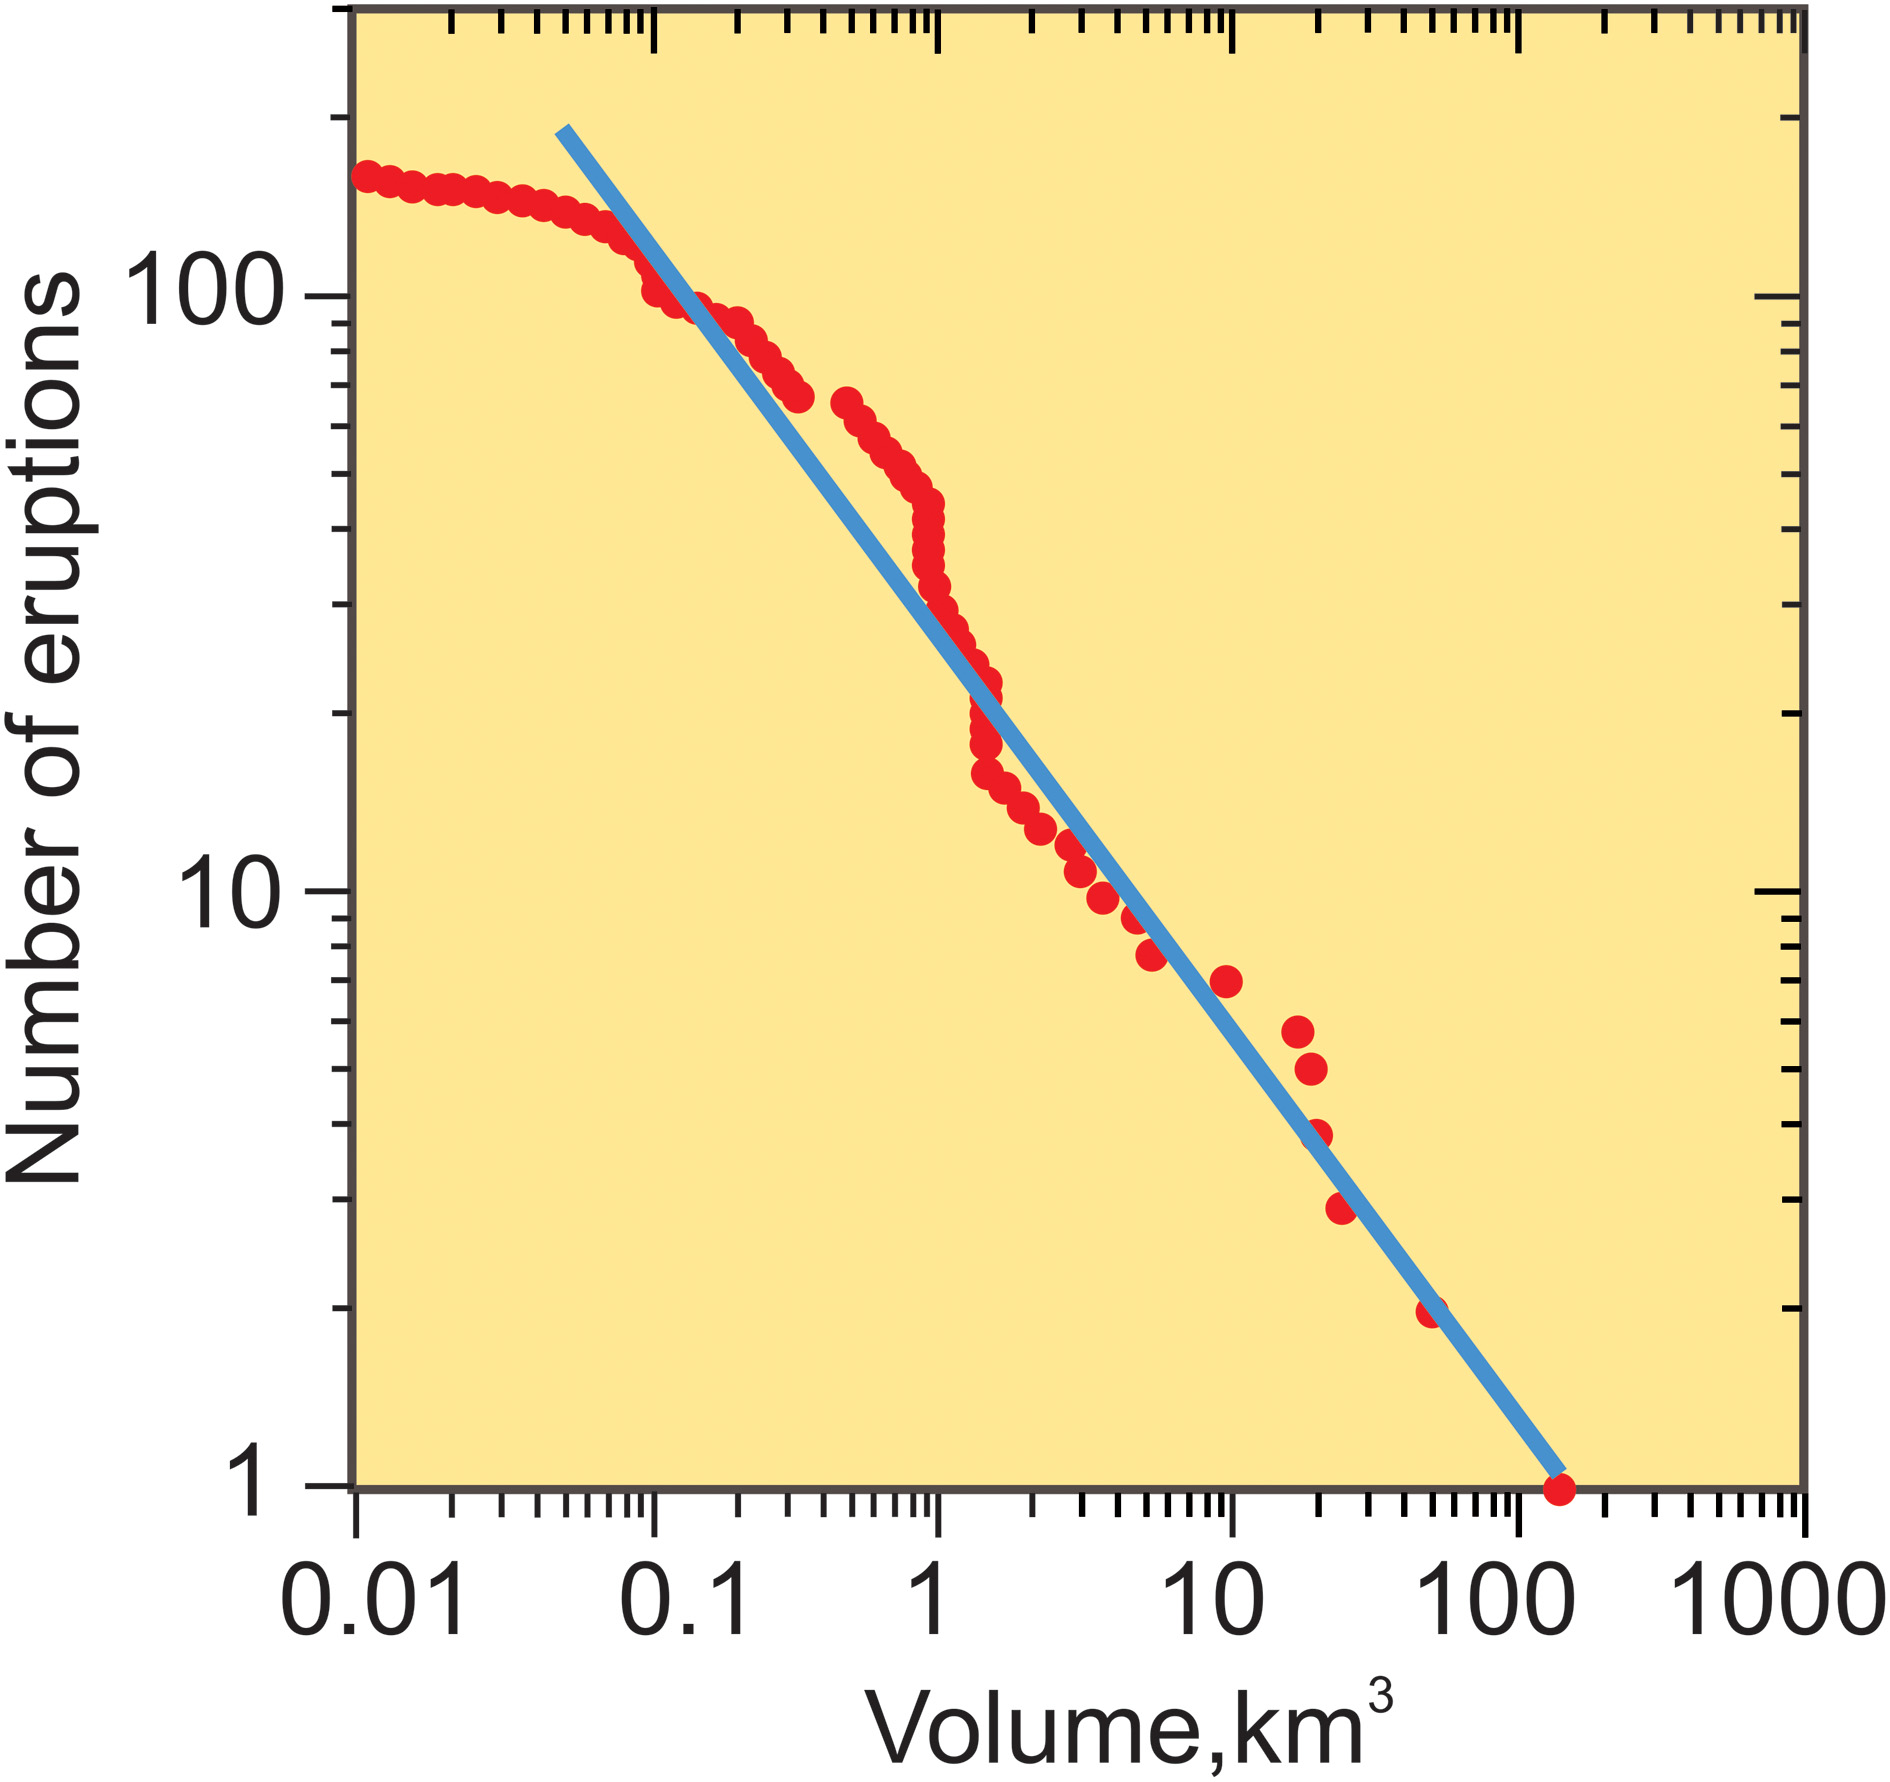
Size distribution of eruption volumes. Here the eruptive volumes are shown in cubic kilometers in relation to the number of eruptions with volumes above a certain size (modified from Pisarenko and Rodkin, 2010). The bi-logarithmic (log-log) plot shows that a straight (blue) line fits much of the distribution rather well, suggesting that the volume distribution of eruptive materials follows approximately a power law. There are various methods for testing how well a power law fits such a distribution in relation to other functions, and also whether more than one straight line (power law) fits the distribution better than a single law (Clauset et al., 2009; Mohajeri and Gudmundsson, 2012; Gudmundsson and Mohajeri, 2013).
It is unlikely that much larger earthquakes than the instrumentally recorded 1960 Chile earthquake have occurred in the past millions of years. This follows because for a large earthquake to occur a very large zone or volume of the brittle part of the earth's lithosphere must be stress-homogenized (Gudmundsson and Homberg, 1999). This implies that a large volume in the lithosphere must have essentially the same stress field at a particular time. So long as significant stress heterogeneities exist within a fault zone, they tend to generate stress barriers—layers or rock bodies with local stresses unfavorable to the propagation of a particularly type of fracture—and thus encourage arrest of the fault propagation (Gudmundsson, 2011). Since the rupture length (strike dimension) of the 1960 Chile earthquake was somewhere between 800 and 920 ± 100 km, the width (dip dimension) about 200 km, and the focus at a depth of about 33 km, it is clear that a fault zone of a very great size was stress homogenized prior to the earthquake rupture. The thickness of the fault zone (the thickness of damage zone, including the much thinner core) is unknown. Close to the surface (the uppermost few kilometers) the thicknesses of the damage zones of major fault zones may be hundreds of meters to several kilometers, as is observed in major transform faults and other large fault zone (e.g., Gudmundsson, 2007; Mooney et al., 2007). At greater depths, say at 5–10 km or more, however, many fault zones seem quite thin, less than 100 m thick (Furlong, 2007), while the “slip zone” for individual earthquakes may be much thinner, or of the order of centimeters or less (Mooney et al., 2007). For a major slip to occur, a significant fraction of the core/damage zone must have favorable stresses for that type of slip, so that, given the dimensions of the large fault zones such as for the 1960 Chile earthquake, very large volumes must be stress-homogenized. Because of the great variation in rock properties, hence in local stresses, in the lithosphere in general and in a fault zone in particular, it is not very likely that much larger active zones than these can be stress-homogenized at any particular time.
The largest instrumentally recorded volcanic eruptions, however, are much smaller than the largest eruptions that have occurred in the past several million years (e.g., Carey and Sigurdsson, 1989; Pyle, 2000; Mason et al., 2004; Crosweller et al., 2012). This applies even to the past hundred thousand years, of which the eruption of Toba eruption in Sumatra some 75,000 years ago is a good example. This eruption produced around 2800 km3 of eruptive materials (e.g., Pyle, 2000).
Going further back in time, there are even larger eruptions, both explosive and effusive. In what is presumably the most up-to-date listing (List of largest volcanic eruptions, Wikipedia, 2014), there are several explosive eruptions that reach volumes of 4000–5000 km3, including the La Garita Caldera eruption which generated the Fish Canyon Tuff some 27–28 million years ago (Lipman, 1997; Mason et al., 2004). The caldera itself is located in southwestern Colorado (the United States). It is an elliptical caldera, with a major axis of 75 km and a minor axis of 35 km, that gave rise to several large eruptions during its active period, but is now regarded as extinct. Several larger volumes generated in explosive eruptions are listed, but for most it is unclear if the volume estimates (reaching close to 7000 km3) are correct and if they were generated in single eruptions.
Some of the basaltic lava flows of the Columbia River Basalt Group (United States), which were generated in effusive eruptions 15–16 Ma ago, apparently reach volumes of up to 5000 km3. Many of the lavas identified as single flows (singe eruptions) range in volume between 1000 and 4000 km3 (List of the largest volcanic eruptions, Wikipedia, 2014), although volumes of several thousand cubic kilometers for these flows are disputed by some (Hooper, 2000). If these volume estimates are correct, these lava flows would be two orders of magnitude larger than the largest Holocene lava flows, such as the 1783 Laki eruption (15 km3), the 934 Eldgja eruption (18 km3), and the 25 km3 Thjorsarhraun eruption (about 8700 years ago), all of which are located in South Iceland. Because basaltic lava flows have higher densities than tuff layers, the mass of some of the lava flows may be greater than that of the Fish Canyon Tuff. These considerations indicate that the largest Colombia River eruptions are, in terms of volume, of a size similar to that of the largest explosive eruptions.
Elastic energy
Earthquakes
Seismic moment M0, which has the units of Nm, forms the basis of the moment-magnitude scale introduced by Kanamori (1977) and Hanks and Kanamori (1979; cf. Aki and Richards, 2009). Commonly, the seismic moment M0 is defined as (e.g., Madariaga, 1979; Figure 1):
where A is the total slip or rupture area or slip surface during the seismogenic faulting, μ is shear modulus, and Δu is the slip. This equation is a scalar and applies when the fault is a plane. For a curved fault and a fault composed of many segments, both of which are common, the seismic moment is given as the tensor (e.g., Madariaga, 1979; Scholz, 1990):
where is the unit normal, r the position vector on the fault, and Δu is the fault slip vector at the point r. In Equation (3) the fault surface may be curved or segmented, or composed of a set of smaller faults. There is, however, no opening or extension-fracture component in the slip, that is, the mode I component (cf. Gudmundsson, 2011) is zero (ΔuI = 0).
The seismic moment can also be expressed in terms of the driving stress or, roughly, the static stress drop associated with the fault slip. The static stress drop is a measure of the relaxation (drop) in shear stress on the rupture area or slip surface as a result of slip. The stress drop or driving stress τd may be defined as:
where τi is the initial shears stress on the rupture area or slip surface before slip and τf is the final shear stress on the plane after slip. For a constant stress drop τd and average slip Δua that is everywhere parallel on the slip surface (non-curving fault plane), the scalar moment may be given by:
where k is a constant that depends on the geometry of the fault plane—circular, rectangular; a through crack rupturing the surface, or buried interior crack—(e.g., Kanamori and Anderson, 1975). A single rupture plane or area A is not necessary because this equation can be generalized to many fault planes, or a segmented fault plane, as discussed above (e.g., Madariaga, 1979).
Using the symbol Δua to mean the average slip, then for a shear modulus μ and rupture area (slip surface) A, it follows from Equation (2) that the seismic scalar moment is:
Similarly, from Equation (5) the seismic scalar moment may be written as:
The seismic moment can also be expressed in forms where the average slip Δua is omitted, such as in the equation (cf. Kanamori and Brodsky, 2004):
Here q is a constant (depending, like k, on the fault geometry and other factors), and L is the characteristic dimension of the earthquake rupture area (slip surface), which is commonly defined as .
It follows from the above equations that the seismic scalar moment can be expressed either in terms of shear modulus or stress drop (driving shear stress). In terms of shear modulus [Equation (6)], the seismic moment is shear modulus [N m−2] × average slip during the rupture [m] × rupture area [m2], so that the units are Nm, as indicated above. In terms of stress drop [Equation (7)], the seismic moment is stress [N m−2] × average slip during rupture [m] × the rupture area [m2], so the units are, again, Nm. Although these are the same units as for energy, Nm, they are not strictly interchangeable (for they do not measure the same), and it is only the energy unit that is named joule [J]. For these reasons, the units for moment are sometimes given as mN rather than, as for energy, Nm (e.g., Radi and Rasmussen, 2013).
In seismology the relation between moment, fault geometry, size (area), slip, and stress drop (driving shear stress) is commonly written in a form similar to that in Equation (7). In fracture-mechanics formulation of seismogenic faulting, the equations used are different. This difference is partly because Young's modulus E and Poisson's ratio ν are more commonly used in fracture mechanics than shear modulus μ, where E = 2μ(1 + ν). But the difference is also because the fracture-mechanics equations are a direct measure of the elastic energy transformed or released during an earthquake, rather than its moment. Of the three main ideal fracture modes, I, II, and III (Figure 4), strike-slip faults are most commonly modeled as mode III, whereas dip-slip faults are commonly modeled as mode II. However, some strike-slip faults may be modeled as mode II; particularly large faults that rupture the entire seismogenic layer of a region where there is a free surface (implying a fluid reservoir) at the bottom of the fault in addition to the Earth's free surface.
Figure 4
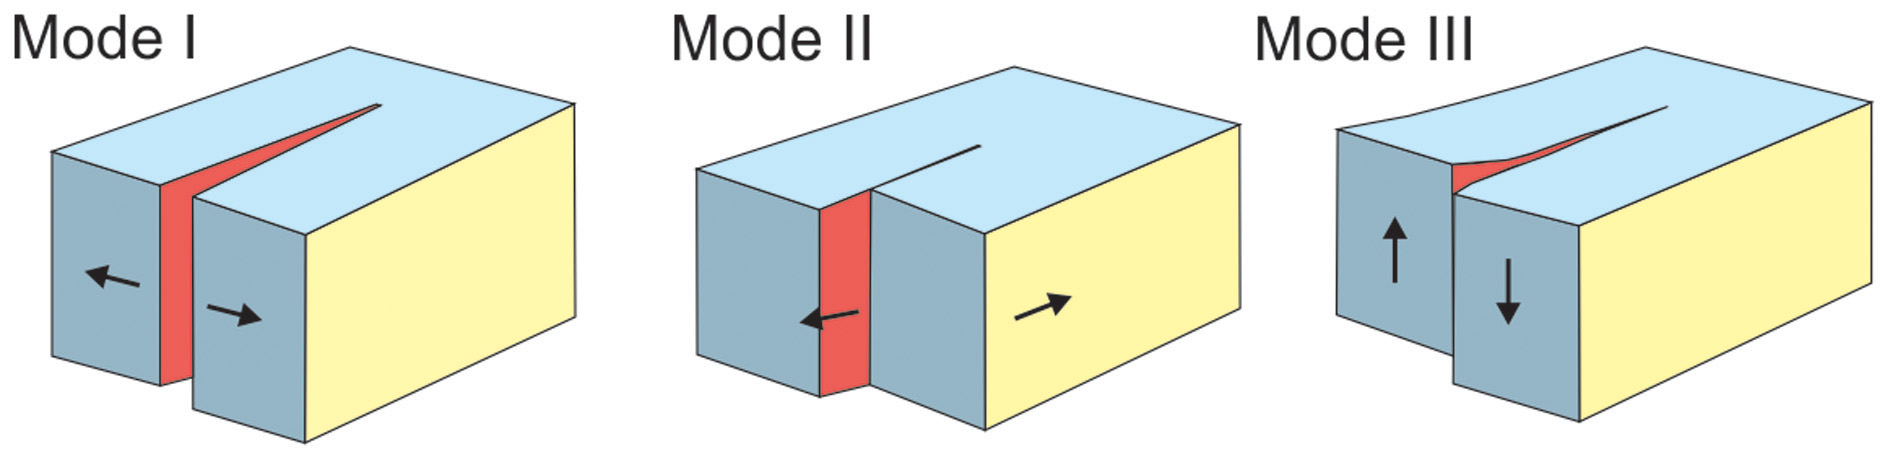
Three main ideal modes of rock fractures. These are mode I, mode II, and mode II cracks. For rock fractures, strike-slip faults are most commonly modeled as mode III (but as mode II if there is a magma chamber/reservoir at the bottom of a through-going fault), whereas dip-slip faults are commonly modeled as mode II (but as mode III if there is a magma chamber/reservoir at the bottom of a through-going fault). Extension fractures (dikes, tension fractures, most joints) are modeled as mode I cracks (cf. Gudmundsson, 2011).
When the fault is modeled as mode II crack, the energy transformed or released UII is given, in terms of stress drop or driving shear stress τd, by Gudmundsson (2011):
and in terms of slip Δu by:
where a is half the strike dimension (rupture length) of the slip surface. The slip Δu is strictly the maximum slip, but is often regarded as the average slip measured anywhere along the fault except near its tips or ends (Gudmundsson, 2011). Equations (9, 10) apply to plane strain conditions; in the case of plane stress conditions (appropriate when the lateral dimensions of the slip surface is much greater than its dip dimension) the term 1 − ν2 in both equations drops out (becomes equal to 1).
Similarly, when the fault is modeled as a mode III crack, the energy transformed or released is given, in terms of stress drop, by:
and in terms of slip Δu by:
Equations (9–12) can be used to calculate the energy released or transformed during an earthquake slip modeled either as a mode II or a mode III crack. Similar, but more complex, equations can also be derived for mixed-mode cracks (partly mode II and partly mode III, for example). The transformed energies calculated from Equations (9–12) can then be compared with the standard seismic moment calculations from Equations (6–8) and other similar equations (cf. Kanamori, 1977; Madariaga, 1979; Kanamori and Brodsky, 2004; Aki and Richards, 2009).
Eruptions
Elastic energy has not previously been used as a measure of eruption sizes. The eruption-size estimates have, up till now, focused almost exclusively on measures such as eruption volume, eruption mass, the mass eruption rate, volcanic plume (eruption column) height, and the amount of thermal energy released (e.g., Pyle, 2000; Mason et al., 2004; Crosweller et al., 2012). Using thermodynamic arguments, I shall show that the eruption volume can, however, be related to elastic energy.
The first law of thermodynamics states that the change in internal energy of a thermodynamic system is equal to the heat absorbed or received by the system plus the work done on the system. Here we regard the heat supplied by the surroundings to the system as positive; similarly, the work done by the surroundings on the system is regarded as positive. It follows from this definition that the change in internal energy of the system, ΔU, is equal to the sum of the heat, ΔQ, and work, ΔW, that the system has exchanged with its surroundings, namely:
When the internal energy change is attributable to very small (infinitesimal) changes in heat and work, the first law can be written in the familiar differential form as:
In Equation (14), dQ and dW are inexact differentials since they depend on the path taken from the initial to the final value, that is, they are path (rather than state) functions. Here dQ and dW are not denoted by special symbols, as is sometimes done, since their path dependence is supposed to be known (cf. Sommerfeld, 1964). By contrast, the internal energy dU is a state function and thus a proper or exact differential. More specifically, the values of a state function are independent of its path from the initial to the final stage, and depend only on the state or conditions of the system.
Here the thermodynamic system is the shallow crustal magma chamber in the volcano, and its surroundings are the volcano itself and the associated volcanic field or zone, including the deep-seated source reservoir (Figure 5). Since we focus on the (potential) elastic energy of the system, we consider the case of a magma chamber that is receiving heat through new magma at the same rate as heat is conducted away from the chamber (into the host rock and to the surface), so that there is no net gain of loss in heat for the chamber in the period prior to the eruption. Then we have dQ = 0, and Equation (14) becomes:
Figure 5
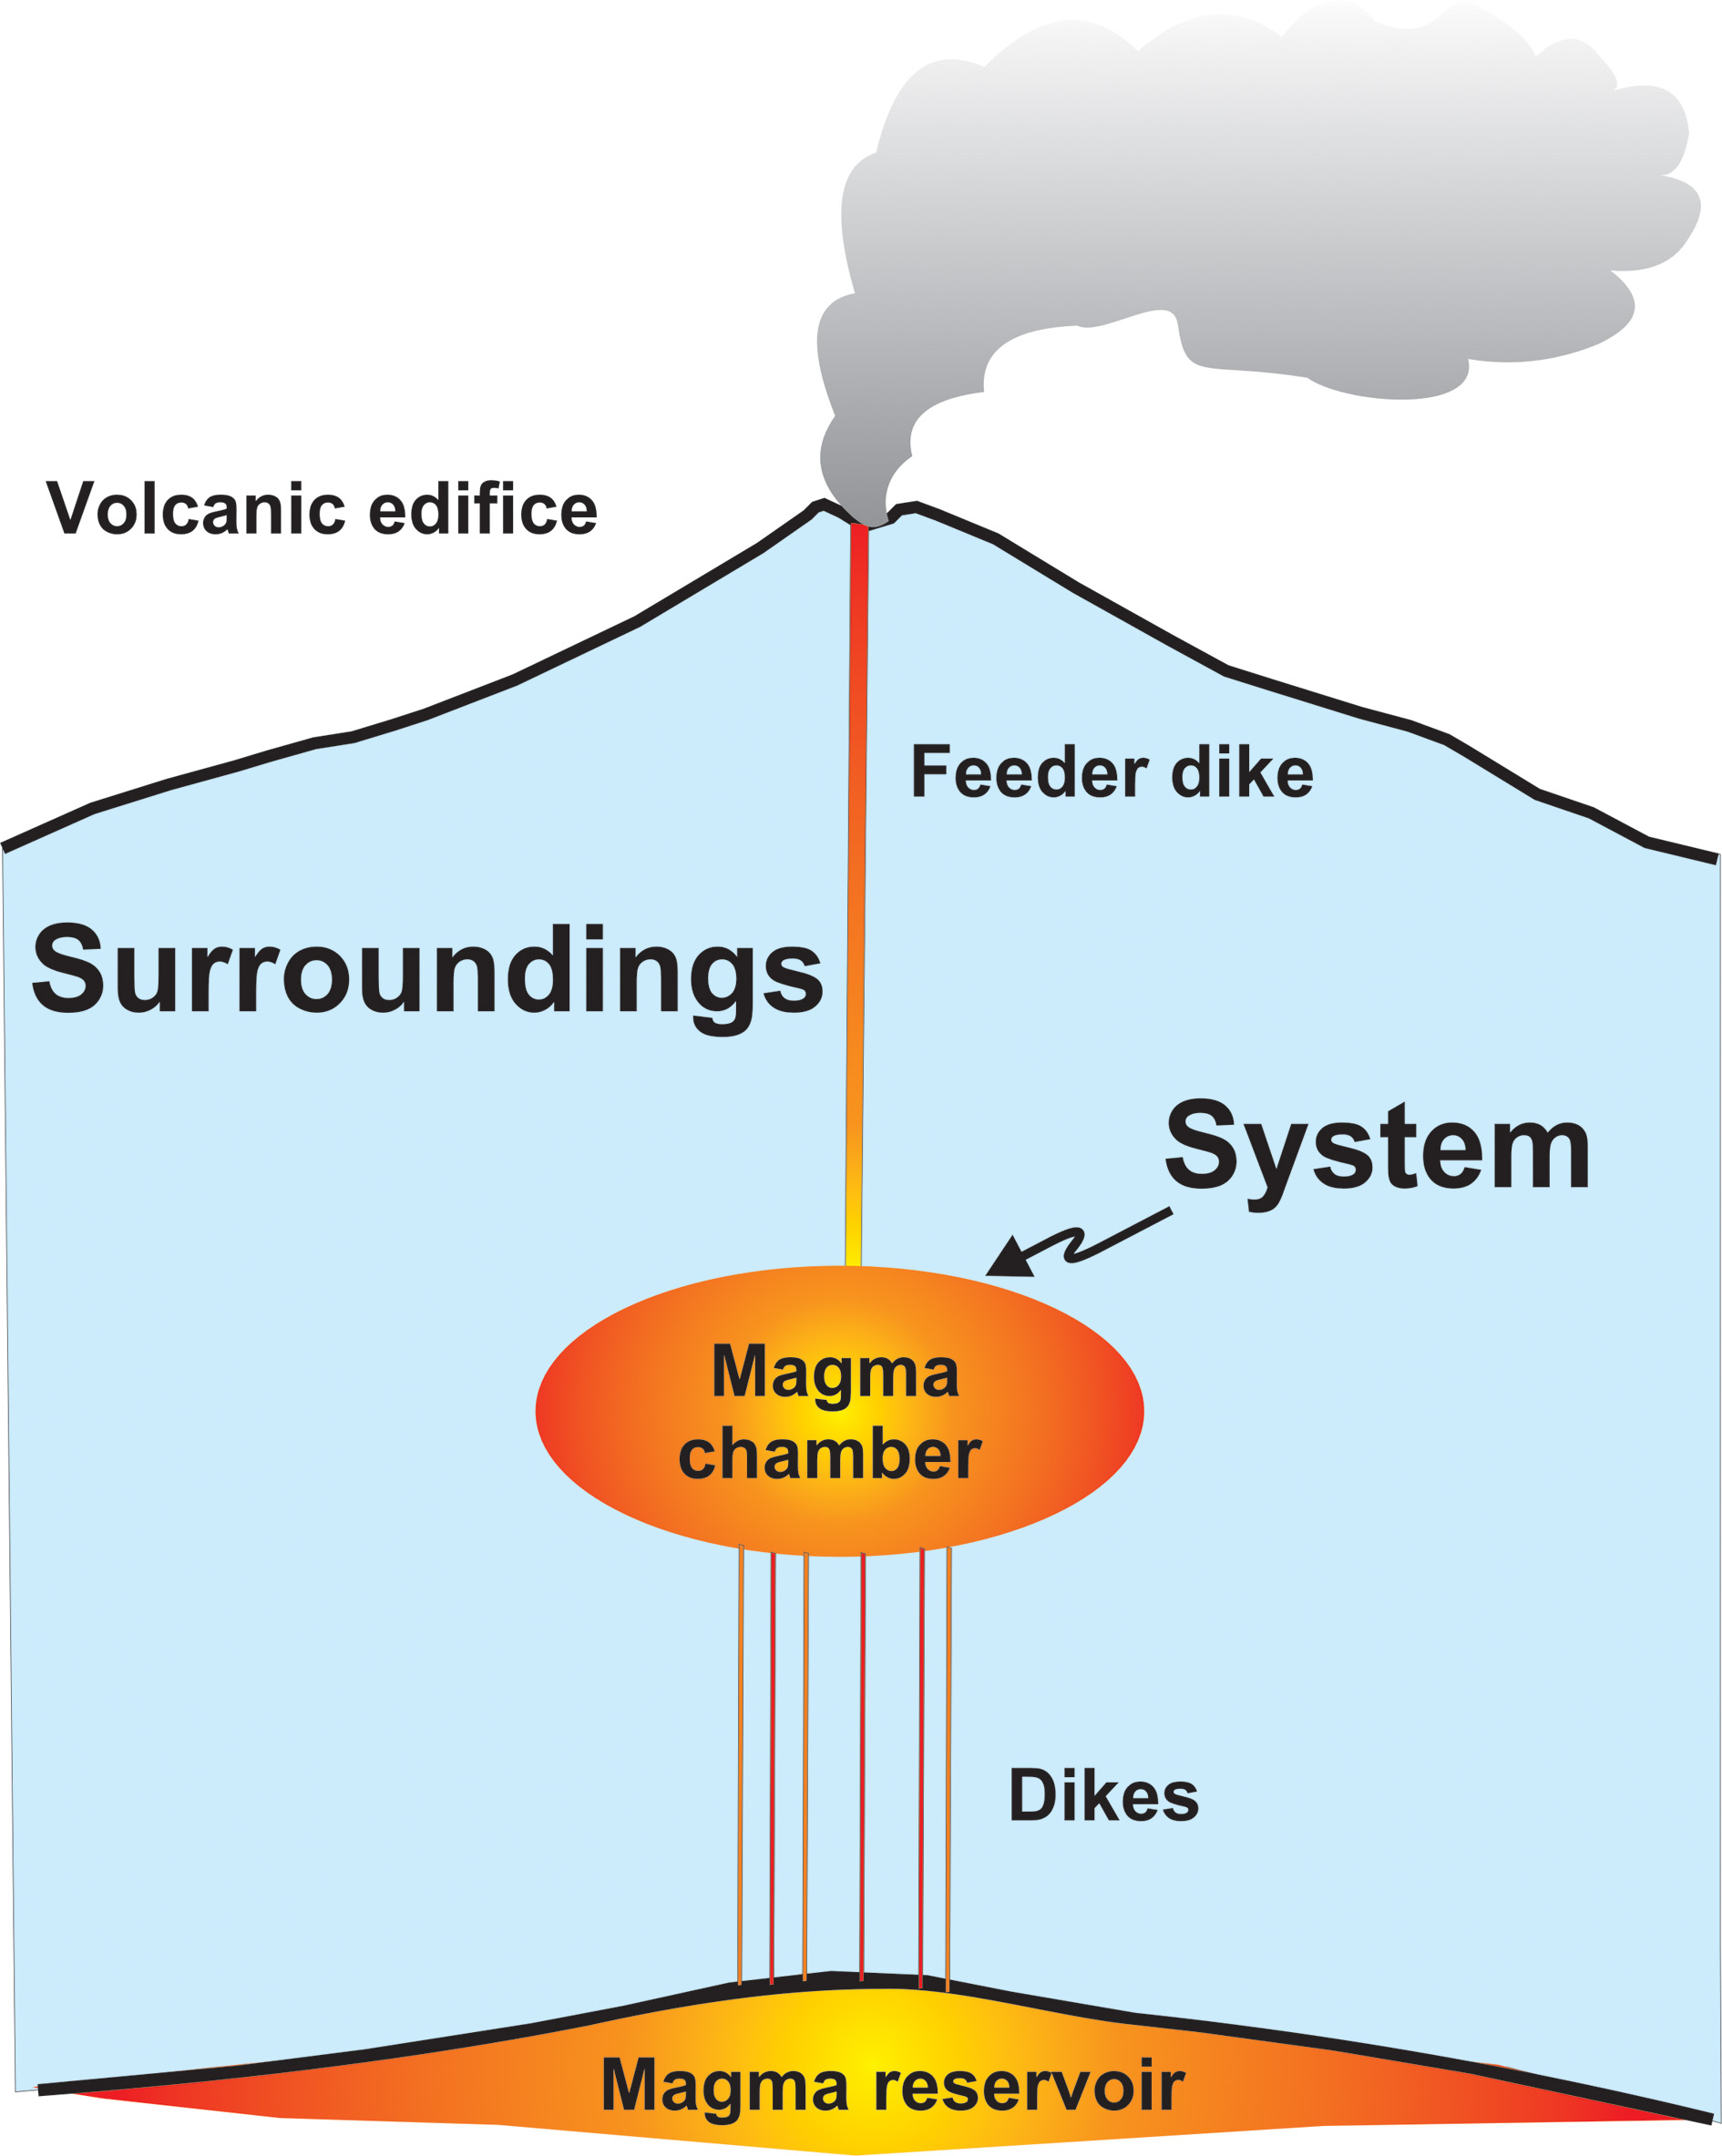
Magma chamber as a thermodynamic system. Here the magma chamber is the thermodynamic system. The hosting crustal segment, including the volcanic edifice for which the magma chamber is a source (it supplies magma to the volcano) as well as the deeper reservoir, for which the magma chamber acts as a sink (it receives magma from the reservoir), acts as the surroundings to the magma-chamber system. In the present notation, heat received by the magma chamber and work done on the magma chamber (by the surroundings) are regarded as positive.
Work is defined as force × displacement in the direction of the force, so that work is preformed when the force moves. The work done by the volcano and its surroundings in compressing a magma chamber during an eruption may, to a first approximation, be considered analogous to the work done in compressing fluid (say gas) by a piston in a cylinder. This analogy is particularly appropriate for piston-like caldera collapses (Figure 6).
Figure 6

Caldera subsidence largely maintains the excess pressure pe in the magma chamber during a caldera-forming eruption. The excess magma pressure pe in the chamber is equal to the average force F on the cross-sectional area A of the caldera. To reduce the volume of the chamber (to shrink or contract the chamber), the piston-like caldera roof has to move the differential distance dx. These considerations allow us to derive the general relation between the elastic energy associated with magma-chamber volume reduction or shrinkage [Equation (21)] and the elastic energy in terms of eruptive volume and excess magmatic pressure [Equation (23)].
Before an eruption starts, there is excess pressure pe in the magma chamber (Figure 5). This excess pressure causes magma-chamber rupture and dike (or inclined sheet) injection into the roof of the chamber. If the dike reaches the surface, then an eruption occurs. Some volcanoes apparently have a continuously open conduit to the surface, in which case no large excess pressure can build up in the magma chamber. These volcanoes are few but include Stromboli in Italy, Erta Ale in Ethiopia, and other volcanoes with lava lakes. For most volcanoes, however, the condition for an eruption is that a magma-filled fracture, normally a dike or an inclined sheet, is able to propagate from the chamber to the surface and supply magma. Even some cylindrical or elliptical conduits appear, to a large degree, to be composed of dikes (Nakada et al., 2005). Thus, the focus here is on eruptions fed by magma-filled fractures and the word “dike” will be used for any sheet-like intrusion.
The conditions for magma-chamber rupture and dike injection is as follows (Gudmundsson, 2011):
where pl is the lithostatic pressure (overburden pressure), pe is the excess magmatic pressure in the magma chamber at the time of rupture and dike injection, σ3 is the minimum compressive (maximum tensile) principal stress, and T0 is the in-situ tensile strength of the host rock (the roof). In the absence of unrest in the volcano (such as magma flow into the chamber, extension, or doming), the magmatic pressure in the chamber and the state of stress in the chamber roof are normally close to lithostatic, so that σ3 = pl and the excess pressure pe is zero. For a magma chamber to rupture and inject a dike, there must be positive excess pressure in the chamber and the condition to be satisfied is [from Equation (16)] pe = T0, that is, the excess pressure must reach the in-situ tensile strength of the roof at the location of rupture.
The in-situ tensile strength of rocks down to crustal depths of 9 km varies between 0.5 and 9 MPa, with most values between 2 and 5 MPa (Gudmundsson, 2011). From Equation (16) and the considerations above it follows that the excess pressure at the time of magma-chamber rupture is in the same range. To squeeze magma out of the chamber and supply magma to an eruption, some excess pressure has to be maintained in the chamber. The excess pressure tends to decrease exponentially during most eruptions (Woods and Huppert, 2003; Galindo and Gudmundsson, 2012). One likely exception to this exponential decrease is during a piston-like caldera collapse when the subsidence of the caldera floor (the piston)—commonly in many ring-fault slips—presumably maintains the excess pressure at close to constant until near the end of the eruption (Gudmundsson, 1998), at which state the excess pressure rapidly falls to zero. This and other similar mechanisms for maintaining the excess pressure encourage the generation of large eruptions. However, for all eruptions, large and small, it is primarily the elastic energy that drives the magma out of the chamber during the eruption.
The thermodynamic principles above can now be used to develop an expression for the elastic energy associated with eruptions from crustal magma chambers. Consider a magma chamber of total volume Vc that is initially in lithostatic equilibrium with the surrounding host rock. Let the volume of the magma chamber change by ΔVc, the change being either through expansion (inflation) or contraction (shrinkage, deflation). Since the chamber is regarded as the thermodynamic system (Figure 5), contraction or shrinkage is regarded as work done by the surroundings on the system and is thus considered positive. By contrast, magma-chamber expansion is work done by the chamber on its surroundings and is regarded as negative.
Consider the magma chamber in Figure 6. The illustrated scenario is most appropriate for a collapse caldera, the roof being the piston-like caldera floor. However, the analysis that follows applies to magma chambers of any shape. The excess pressure at the time of magma-chamber rupture and dike injection is pe. Work is defined as force × displacement in the direction of the force (or force component). The excess pressure is force F per unit area A of the boundary of the magma chamber or, in the case of an ideal piston-like collapse caldera (Figure 6), the average force on the cross-sectional area of the caldera. Thus we have:
To reduce the volume of the chamber (to shrink or contract the chamber), the piston-like caldera roof has to move the differential distance dx (Figure 6). The associated work done on the chamber is then:
The contraction or shrinkage of the magma chamber thus results in a volume change dVc given by:
Here the minus sign is because the chamber volume decreases during caldera collapse. The minus sign also ensures that the work done by the surrounding host rock (the volcano) on the magma chamber is positive when the chamber volume decreases. By contrast, during magma-chamber expansion, elastic energy is transferred from the chamber into the host rock and thus the volcanic edifice. From Equations (18, 19) it follows that the work done during the contraction or shrinkage of the chamber is:
where, again, the minus sign is to ensure that the work is positive when the volume of the chamber decreases. From Equation (15) it follows that the energy change during the contraction or volume decrease of the chamber associated with an eruption is:
Equation (21) provides a direct measure of the elastic potential energy dU transformed during an eruption in terms of the excess pressure pe in the source magma chamber and the contraction or shrinkage of the chamber dVc. The size of dVc can be assessed in several ways. Generally, for active volcanoes undergoing unrest periods in the past decades, an estimate of dVc can often be obtained from geodetic measurements of the surface deformation using, for example, GPS and InSAR data (e.g., Burgmann et al., 2000; Dzurisin, 2007; Masterlark, 2007; Kusumoto and Gudmundsson, 2009; Segall, 2010). Similarly, for piston-like collapse calderas (Figure 6), the size of dVc is indicated by the caldera volume.
There are several notable implications of Equation (21). First, the equation can be rewritten in the following form:
which shows that the magmatic pressure in the chamber (and pressure in general) can be interpreted as energy per unit volume or as energy density. This interpretation, however, assumes that no heat is added to the system—as is indicated in Equation (15). Since pressure is analogous to stress, it follows that stress may be similarly interpreted as energy per unit volume or as energy density. This relates to the energy release rate during dike and fault propagation and material toughness—energy per unit volume or unit area—both of which connect with the energy budget of volcanic and seismic zones (Gudmundsson, 2013).
The second implication follows from the essentially constant value of pe. As indicated above [Equation (21)], pe is roughly equal to the in-situ tensile strength T0 of the roof of the magma chamber. The in-situ tensile strength has been measured worldwide as between 0.5 and 9 MPa, with most values at 2–5 MPa (Gudmundsson, 2011). Thus, the in-situ tensile strength is essentially constant and, from Equation (16), so must be the excess pressure pe at chamber rupture and dike injection. This means, from Equation (21), that the elastic potential energy of an eruption is directly related to the volume change of the chamber during the eruption dVc times a constant pe.
The third implication relates to the interpretation of dVc. As discussed below, the details of the contraction of the magma chamber, its shrinkage, depends on the compressibility of the magma and other factors (Gudmundsson, 1987; Rivalta and Segall, 2008). For the order-of-magnitude calculations presented here, however, the contraction may be regarded as corresponding roughly to the volume of material the leaves the chamber during an eruption. This includes the erupted material but also the intruded material, the latter being primarily the volume of the feeder-dike. The feeder-dike volume may be a large part of dVc for small to medium eruptions, that is, eruptions with eruptive volumes of as much as several cubic kilometers. For the very large eruptions we focus on here, however, the feeder-dike volume is insignificant. For example, a very long feeder-dike would be 27 km, such as the one that supplied magma to the 1783 Laki eruption in Iceland. A feeder-dike with a strike dimension (length) of 27 km, dip dimension (height) of 20 km, and a thickness of 10 m—all dimensions similar to those estimated for the Laki feeder-dike (Thordarson and Self, 1993)—would have a volume of about 5 km3. Many of the large caldera-forming eruptions were presumably supplied with magma from much smaller dikes while the eruptive volumes reached hundreds of cubic kilometers and, in extreme cases, thousands of cubic kilometers. For such eruptions, as well as similar-sized effusive eruptions, the feeder-dike volume may be regarded as included in the total estimated eruptive volume (commonly with an uncertainty much larger than several cubic kilometers), as is done in the calculations below.
Elastic-energy scale for eruptions
Equation (21) is formally similar to the expressions for the seismic scalar moment in Equations (7, 8) and the elastic energy in Equations (9–12). The equations either express, or can be written in a form that expresses, moment and elastic energy (Nm) in terms of change in volume (m3) times driving stress/pressure (Nm−2). This similarity suggest a new magnitude scale for volcanic eruptions that is analogous to the moment-magnitude scale for earthquakes but relates directly to the elastic energy released or transformed during the eruption.
For the presentation of the new eruption magnitude scale, we denote the elastic energy of the eruption by Uer, the excess fluid pressure in the magma chamber by pe, and the volume of the eruptive materials issued during the eruption by Ver. In contrast to the chamber contraction or shrinkage, when there is a negative volume change (−dVc), the eruptive volume (Ver) is always a positive figure. It is known that estimated erupted volumes are normally larger than the estimated volume decrease of the associated magma chamber. This is partly related to magma compressibility (Rivalta and Segall, 2008), and partly because of density difference between the magma and its eruptive materials and related factors. These differences, however, are well within an order of magnitude and therefore within the error limits of the elastic energy release calculations for eruptions presented here. On the assumption that magma-chamber volume change corresponds roughly to the volume of eruptive (including intrusive) materials, it follows from Equation (21) that elastic energy can be written in terms of the eruptive volume as follows:
Equation (23) can now be used as a basis for the new magnitude scale for volcanic eruptions. Since it is the volume change of the chamber that is the initial measure of the elastic energy [Equation (21)], it follows that, for this scale, the volume of the eruptive (plus intrusive) materials generated during an eruption is used rather than the mass (in kg) of the eruptive materials. The estimated eruptive volumes have of course an uncertainty. However, the uncertainty is normally within a factor of 2–3, so that the estimated volume may be regarded as of the correct order of magnitude, which is normally all what is needed, particularly for large to great eruptions (namely, those of the greatest concern for mankind).
The general form of the new magnitude scale for volcanic eruptions is:
where Me is the eruption magnitude, Uer is the elastic potential energy, log is the common logarithm (to the base of 10), and A and B are empirically determined constants. When the constants have been determined, from empirical data (e.g., similar to those in Figure 3), the scale can be fine-tuned and applied to all volcanic eruptions for which the volumes are known or can be estimated. This is particularly fortunate because for most pre-instrumental eruptions, that is, eruptions earlier than last century—not to speak of eruptions dating back millions of years—the only quantitative information we have is a rough estimate of the volume of their erupted materials. The new magnitude scale for volcanic eruptions is, however, not the main focus of the present paper and will be elaborated and presented in detail in another publication.
Comparable energy releases in great earthquakes and eruptions
Consider first some of the largest recorded earthquakes. As indicated above, the largest earthquake ever recorded, the 1960 Chile earthquake, had a surface rupture (strike dimension) that is variously estimated at 800 km or at 920 ± 120 km; here we shall use the conservative estimate of 800 km. The width or a dip dimension of the slip plane of the earthquake is estimated at around 200 km. If the stress drop was 5 MPa (Barrientos and Ward, 1990) then, using a typical Young's modulus of 100 GPa, a Poisson's ratio of 0.25, the elastic energy released—the energy drop—during the earthquake is, from Equation (9), about 2.5 × 10¹⁹ J. Equation (9) is a mode II crack model, as is common to use for dip-slip earthquakes. However, a mode III crack model [Equation (11)] for the same earthquake yields a very similar result, or about 3.5 × 10¹⁹ J.
The fault slip of the 1960 Chile earthquake is not known accurately. In Equations (10, 12) the maximum slip is used; it is generally estimated as somewhere between 25 and 30 m (Fujii and Satake, 2013). Using the above values for Young's modulus and Poisson's ratio, a mode II model [Equation (10)] yields an energy release of about 1.0 × 10¹⁹ J for a 25 m slip and 1.5 × 10¹⁹ J for a 30 m slip. Similarly, a mode III model [Equation (12)] yields an energy release of about 7.9 × 10¹⁸ J for a 25 m slip and 1.1 × 10¹⁹ J for a 30 m slip.
As regards the seismic moment equations, we can use the relation E = 2μ(1 + ν) to estimate the shear modulus μ based on the values for Young's modulus and Poisson's ratio given above. The result, 40 GPa, can then be used in Equation (6) to calculate the seismic moment. Note, however, that while seismic moment [Equations (6–8)] and elastic energy release [Equations (9–12)] have the same units, namely Nm, the do not measure the same. The equations for elastic energy release and seismic moment are different but related. For example, the elastic energy U may be related to the seismic moment M0 and shear modulus μ through the equation (Kanamori, 1977):
This equation assumes a complete stress drop. In case there is only partial stress drop, Equation (25) becomes modified to (Kanamori, 1977):
where τf is the final stress on the fault plane, following the fault slip, as defined in Equation (4), Δua is the average slip, and A is the rupture area. Generally, Equation (25) gives the minimum elastic energy release or drop associated with the fault slip.
With the relation between seismic moment and elastic energy release clarified, we now proceed to calculate the seismic moment associated with the 1960 Chile earthquake. Using Equation (6) with the values above for the rupture area (A = 1.6 × 10¹¹ m2) and the shear modulus (μ = 40 GPa), then for an average slip of 24 m (Kanamori and Cipar, 1974; Barrientos and Ward, 1990) we obtain a seismic moment of about 1.5 × 10²³ J. This value is similar to many of those obtained previously, which are generally in the range of 0.7–2 × 10²³ J (Kanamori and Anderson, 1975; Kanamori, 1977; Barrientos and Ward, 1990; Fujii and Satake, 2013).
A total agreement as to the seismic moment value cannot be expected since the estimated rupture area, the estimated average slip, and the estimated shear modulus for the fault zone all vary to a certain degree. Nevertheless, the results indicate that a seismic moment of the order of 1–1.5 × 10²³ J is a very reasonable estimate. Assuming complete stress drop, the corresponding elastic energy release is, from Equation (25), 6.3–9.4 × 10¹⁸ J. This is very similar to the elastic energy release values obtained above for an assumed maximum slip of 25 m, namely 7.9 × 10¹⁸ and 1 × 10¹⁹ J, depending on which energy formula is used. We conclude that the largest earthquake ever recorded had a seismic moment of around 1 × 10²³ J and released or transformed elastic energy of close to 1 × 10¹⁹ J.
Let us now compare these results with the elastic energy released or transformed during the largest known eruptions on Earth. The largest explosive eruptions have produced volumes of the order of 4000–5000 km3. There is no doubt that all large explosive eruptions are associated with caldera collapses. In fact, what is perhaps the largest explosive eruption in the past several tens of millions of years, that of the Fish Canyon Tuff, with a volume of this order, is clearly associated with the La Garita Caldera (Lipman, 1997; Mason et al., 2004). A piston-like compression of the magma chamber is then a good model (Figure 6). Consider first the case where the volume of the eruptive material corresponds to the volume reduction, dVc, that is, the shrinkage (here largely due to the paving in of the caldera floor), of the magma chamber. The excess pressure at rupture is roughly the same as the in-situ tensile strength of the roof. The in-situ tensile strength of rocks is generally in the range of 0.5–9 MPa (Gudmundsson, 2011); here we use the value of 5 MPa, the same as for the estimated driving stress of the 1960 Chile earthquake. Using these values, from Equation (21) the change in elastic energy, energy release (or transformation), is 2.5 × 10¹⁹ J.
The total volume of eruptive materials may be somewhat larger than the corresponding volume of magma that leaves the chamber (and causes its volume reduction or shrinkage) during the eruption. This follows because of the magma compressibility factor (Rivalta and Segall, 2008) and because the density of eruptive materials, particularly pyroclastics, is normally less than that of the magma from which they derive. However, the “dry rock equivalent” of the eruptive materials of pyrolcastics such as the Fish Canyon Tuff is still 4500 km3 (Mason et al., 2004), suggesting that the estimated total volumes may be used as a crude measure of the magma-chamber volume change during the eruption. Also, the estimated volumes of large explosive eruptions are generally underestimates, since part of the volume of each eruption may be unrecorded. To a degree the unknown part includes the portion of the eruptive material that may have ended in the sea or been carried by rivers, subject to subsequent erosion, buried by younger formations (lava flows, sediments) and thus inaccessible for volume estimates. Furthermore, even a reduction by a factor of 2 would still yield an elastic energy release or transformation of the order of 1019 J, which is the same order of magnitude as that for the largest earthquakes.
There are, as indicated above, several known explosive eruptions of a volume similar to that of the Fish Canyon Tuff, that is, of the order of thousands of cubic kilometers. In addition, there are many effusive eruptions of volumes up to about 1000–5000 km3. But there are, at present, no accurately known volumes, either of explosive or effusive eruptions, that exceed 5000 km3 by a large margin. Thus, we do not know of any single eruptions producing, say, 15,000 km3 or 20,000 km3. Even if they existed, the elastic energy release would still be of the order of 1019 J. Similarly, we do not know of any earthquakes releasing elastic energy of the order of 1020 J, that is, with seismic moments of the order of 1024 J. The results thus indicate that the largest known eruptions and earthquakes on Earth both release elastic energies of a similar magnitude, that is, of the order of 1019 J.
Discussion
Earthquakes and volcanic eruptions both require energy to drive them, driving energy. Part of the energy is transformed into surface energy used for fracture propagation, and part into the displacement of the elastic crustal segment that hosts the seismogenic fault (for earthquakes) or the magma chamber (for eruptions). The focus in this paper is on the elastic energy released or transformed during earthquakes and eruptions.
Volcanoes release large amounts of thermal energy both during eruptions and non-eruptive periods. Magma in the source chamber is continuously loosing heat, which is then transported to the surface through convection (e.g., by geothermal circulation) and conduction. Similarly, recently erupted materials (such as lava flows and pyroclastic deposits and flows) and recent intrusions (such as dikes, inclined sheets, and sills) solidify and cool down and loose heat to the surrounding host rock and, eventually, to the surface. Thermal energy, however, is unlikely to play anything like the same role as elastic energy in squeezing magma out of the chamber during an eruption, a process which largely controls the size or magnitude of the eruption. Furthermore, for a direct comparison of the sizes or magnitudes of eruptions and earthquakes, elastic energy is preferable to thermal energy, the latter being poorly constrained for earthquakes.
There are three main new results in this paper that are likely to have significant impact on earthquake and eruption studies. These are (1) the new method presented to assess the size of an eruption through the elastic energy released or transformed, (2) the possibility of a direct comparison of the elastic energy transformed or released during eruptions and an earthquakes, and (3) the conclusion that the maximum elastic energy released in the largest recorded earthquakes is of the same order of magnitude as that released in the largest volcanic eruptions.
As to the first point, the method presented here to estimate the size of an eruption is analogous to that for estimating the size of an earthquake. Before an eruption or an earthquake occurs there must be energy input into the system, that is, the volcano hosting a magma chamber or the fault zone hosting a seismogenic fault [Equations (13, 14)]. When the thermal energy is neglected, and there are good reasons for doing so at this stage when assessing the main driving pressure/driving stress available for eruptions/earthquakes, the available energy that remains derives from the work done on the system—the magma chamber/fault zone [Equation (15)]. Simple analysis [Equations (17–21)] shows that, for volcanic eruptions, the elastic energy available to drive out the magma during an eruption is equal to the excess fluid pressure in the chamber multiplied by the volume change of the chamber as it contracts or shrinks [Equation (21)]. This analysis allows us, for the first time, to estimate directly the elastic energy associated with an eruption in terms of a measureable parameter, namely the eruptive volume, which is normally reasonable well known. And the volume is known not only for recent and instrumentally studied eruptions but can commonly be estimated for eruptions that date back to millions or tens of millions of years, thereby covering presumably the largest eruptions that can be expected on Earth.
As for the second point, a direct comparison between the elastic energy released in eruptions and earthquakes is of great value. Ultimately, volcanic eruptions and earthquakes relate to forces and stresses associated with plate-tectonic movements. These movements, to a large degree, furnish the energy input for maintaining active fault zones and volcanoes (e.g., Gudmundsson, 2013). It is thus important to be able to assess and compare the elastic energy transformed during eruptions and earthquakes, particularly in the largest eruptions and earthquakes. The elastic energy formulas used for these calculations for earthquakes [Equations (9–12)] and eruptions [Equations (18–21)] are analogous and make such a comparison possible. Furthermore, both can then be compared with the seismic moments of earthquakes [Equations (6–9)] and, through the seismic moments, with the moment magnitudes (Kanamori, 1977; Hanks and Kanamori, 1979; Aki and Richards, 2009).
The moment-magnitude scale for earthquakes is directly related to the moment, and can also be related to the elastic energy released (Kanamori, 1977; Kanamori and Brodsky, 2004). Here I suggest a similar scale for the sizes of volcanic eruptions [Equations (23, 24)]. This scale is a measure of the elastic energy released or transformed during volcanic eruptions and depends almost entirely on the change in magma-chamber volume—the chamber contraction or shrinkage—during the eruption. The magma-chamber volume change, in turn, can be related to the volume of eruptive (and intrusive) materials leaving the chamber during the eruption. This new scale, elaborated in a separate publication, is very simple to use, and applies to any eruption, recent or old, for which a reasonable estimate can be made as to the magma volume squeezed out of the chamber during the eruption. For medium to small eruptions, that volume, −dVc = Ver, must include the volume of the feeder (normally a dike) to the eruption. For larger eruptions, say in excess of 100 km3, the feeder-dike volume becomes gradually negligible (but can often be estimated crudely) and the volume of eruptive materials becomes the main measure of the magma-chamber volume reduction.
The third point may be the one of greatest interest and, perhaps, surprise. That the elastic strain energy released is of the same order of magnitude in the largest earthquakes and eruptions is perhaps an indication of certain limits as to the strain-energy storage capacity of the Earth's crust before failure. Alternatively, it shows the amount of strain energy that can be released from a crustal segment during a single volcanic or tectonic event. The similarities are perhaps less surprising when one takes into account that the driving stresses of earthquakes are very similar to the excess pressures of magma chambers before rupture and eruption. Theoretically, these should differ by a factor of about 2. This follows from the Modified Griffith Criterion for fault slip, given by (e.g., Gudmundsson, 2011):
where τd is the driving shear stress for fault slip, T0 is the in-situ tensile strength of the rock, μf is the coefficient of internal friction (not to be confused with the shear modulus, μ), and σn is the normal stress on the rupture (fault) plane. This equation is often used to describe the conditions for fault slip in laboratory experiments, and applies to dry conditions. In the crust, there are always fluids present, and it is widely thought that there are no major earthquakes without high fluid pressures in the associated fault zone. When there is total fluid pressure pt in the fault zone at the site of the potential earthquake rupture, then Equation (27) becomes modified to:
Except for very deep earthquakes, the driving shear stress or stress drop τd is normally in the range of 1–10MPa, and most commonly 2–6 MPa (Kanamori and Anderson, 1975; Kanamori, 1977). This suggests that during most earthquakes the term μf (σn − pt) is close to or actually zero (and possibly negative). Since μf is always positive, this implies that the term (σn − pt) is zero, so that the fluid pressure is equal to the normal stress on the slip surface (cf. Gudmundsson, 2011). Thus, for an earthquake the driving shear stress is commonly equal to twice the in-situ tensile strength, or 2T0, whereas for the rupture of a magma chamber and dike injection the excess pressure is equal to T0. Since the in-situ tensile strength of crustal rocks is most commonly a few mega-pascals, the excess pressure in the magma chamber and the driving shear stress are likely to be mostly in the range of about 2–6 MPa, as is, indeed, the common estimate.
While the volumes of rocks strained prior to large earthquakes is much larger than the volumes strained prior to large eruptions, the displacements and volume changes associated with eruptions such as caldera collapses are several orders of magnitude larger than those associated with large earthquakes. Thus, while the maximum displacement in the 1960 Chile earthquake was 25–30 m and that in the 2011 Japan earthquake perhaps 50 m, the displacements during large caldera collapses can reach kilometers. That is, the displacements during the contraction or shrinkage of a magma chamber can be two orders of a magnitude larger than the displacements in the largest earthquakes. The consequence is that the elastic energy released in the largest earthquakes and eruptions is essentially the same.
Conflict of interest statement
The author declares that the research was conducted in the absence of any commercial or financial relationships that could be construed as a potential conflict of interest.
Statements
Acknowledgments
I thank the reviewers and the associate editor for helpful comments.
Conflict of interest
The author declares that the research was conducted in the absence of any commercial or financial relationships that could be construed as a potential conflict of interest.
References
1
Aki K. Richards P. G. (2009). Quantitative Seismology, 2nd Edn. Herndon, VA: University Science Books.
2
Barrientos S. E. Ward S. N. (1990). The 1960 Chile earthquake: inversion for slip distribution from surface deformation. Geophys. J. Int. 103, 589–598. 10.1111/j.1365-246X.1990.tb05673.x
3
Burgmann R. Rosen P. A. Fielding E. J. (2000). Synthetic aperture radar interferometry to measure earth's surface topography and its deformation. Annu. Rev. Earth Planet Sci. 28, 169–209. 10.1146/annurev.earth.28.1.169
4
Carey S. N. Sigurdsson H. (1989). The intensity of plinian eruptions. Bull. Volcanol. 51, 28–40. 10.1007/BF01086759
5
Clauset A. Chalizi R. C. Newman M. E. J. (2009). Power-law distributions in empirical data. SIAM51, 661–703. 10.1137/070710111
6
Crosweller H. S. Arora B. Brown S. K. Cottrell E. Deligne N. I. Guerrero N. O. et al . (2012). Global database on large magnitude explosive volcanic eruptions (LaMEVE). J. Appl. Volcanol. 1:4. 10.1186/2191-5040-1-4
7
Dzurisin D. (2007). Volcano Deformation: New Geodetic Monitoring Technique. Berlin: Springer Verlag.
8
Elder J. W. (1976). The Bowels of the Earth. Oxford: Oxford University Press.
9
Fedotov S. A. (1985). Estimates of heat and pyroclast discharge by volcanic eruptions based upon the eruption cloud and steady plume observations. J. Geodynamics3, 275–302. 10.1016/0264-3707(85)90039-0
10
Fujii Y. Satake K. (2013). Slip distribution and seismic moment of the 2010 and 1960 Chilean earthquakes inferred from tsunami waveforms and coastal geodetic data. Pure Appl. Geophys. 170, 1493–1500. 10.1007/s00024-012-0524-2
11
Fulton P. M. Brodsky E. E. Kano Y. Chester F. Ishikawa T. Harris R. N. et al . (2013). Low coseismic friction on the Tohoku-Oki Fault determined from temperature measurements. Science342, 1214–1217. 10.1126/science.1243641
12
Furlong K. (2007). Group report: nucleation and growth of fault system, in Tectonic Faults: Agents of Change on a Dynamic Earth, eds HandyM. R.HirthG.HoviusN. (London: MIT Press), 79–98.
13
Galindo I. Gudmundsson A. (2012). Basaltic feeder dykes in rift zones: geometry, emplacement, and effusion rates. Nat. Hazards Earth Syst. Sci. 12, 3683–3700. 10.5194/nhess-12-3683-2012
14
Gudmundsson A. (1987). Formation and mechanics of magma reservoirs in Iceland. Geophy. J. R. Astron. Soc. 91, 27–41. 10.1111/j.1365-246X.1987.tb05211.x
15
Gudmundsson A. (1998). Formation and development of normal-fault calderas and the initiation of large explosive eruptions. Bull. Volcanol. 60, 160–170. 10.1007/s004450050224
16
Gudmundsson A. (2007). Infrastructure and evolution of ocean-ridge discontinuities in Iceland. J. Geodynamics43, 6–29. 10.1016/j.jog.2006.09.002
17
Gudmundsson A. (2011). Rock Fractures in Geological Processes. Cambridge: Cambridge University Press. 10.1017/CBO9780511975684
18
Gudmundsson A. (2013). Great challenges in structural geology and tectonics. Front. Earth Sci. 1:2. 10.3389/feart.2013.00002
19
Gudmundsson A. Homberg C. (1999). Evolution of stress fields and faulting in seismic zones. Pure Appl. Geophys. 154, 257–280. 10.1007/s000240050229
20
Gudmundsson A. Mohajeri N. (2013). Relations between the scaling exponents, entropies, and energies of fracture networks. Bull. Geol. Soc. France184, 377–387. 10.2113/gssgfbull.184.4-5.373
21
Gupta H. K. Gahalaut V. K. (2013). Three Great Tsunamis: Lisbon (1755), Sumatra-Andaman (2004) and Japan (2011). Berlin: Springer Verlag. 10.1007/978-94-007-6576-4
22
Hanks T. C. Kanamori H. (1979). A moment magnitude scale. J. Geophys. Res. 84, 2348–2050. 10.1029/JB084iB05p02348
23
Hedervari P. (1963). On the energy and magnitude of volcanic eruptions. Bull. Volcanol. 25, 374–385. 10.1007/BF02596568
24
Hooper P. R. (2000). Flood basalt provinces, in Encyclopedia of Volcanoes, eds SigurdssonH.HoughtonB. F.McNuttS. R.RymerH.StixJ. (New York, NY: Academic Press), 345–359.
25
Iinuma T. Hino R. Kido M. Inazu D. Osada Y. Ito Y. et al . (2012). Coseismic slip distribution of the 2011 off the Pacific coast of Tohoku Earthquake (M9.0) refined by means of seafloor geodetic data. J. Geophys. Res. 117, B07409. 10.1029/2012JB009186
26
Kanamori H. (1977). The energy release in great earthquakes. J. Geophys. Res. 82, 2981–2987. 10.1029/JB082i020p02981
27
Kanamori H. Anderson D. L. (1975). Theoretical basis of some empirical relations in seismology. Bull. Seismol. Soc. Am. 65, 1074–1095.
28
Kanamori H. Brodsky E. E. (2004). The physics of earthquakes. Rep. Prog. Phys. 67, 1429–1496. 10.1088/0034-4885/67/8/R03
29
Kanamori H. Cipar J. (1974). Focal process of the great Chilean earthquake May 22, 1960. Phys. Earth Planet. Inter. 9, 128–136. 10.1016/0031-9201(74)90029-6
30
Kusumoto S. Gudmundsson A. (2009). Magma-chamber volume changes associated with ring-fault initiation using a finite-sphere model: application to the Aira caldera, Japan. Tectonophysics471, 58–66. 10.1016/j.tecto.2008.09.001
31
Lipman P. W. (1997). Subsidence of ash-flow calderas: relation to caldera size and magma-chamber geometry. Bull. Volcanol. 59, 198–218. 10.1007/s004450050186
32
Madariaga R. (1979). On the relation between seismic moment and stress drop in the presence of stress and strength heterogeneity. J. Geophys. Res. 84, 2243–2250. 10.1029/JB084iB05p02243
33
Mason B. G. Pyle D. M. Oppenheimer C. (2004). The size and frequency of the largest explosive eruptions on Earth. Bull. Volcanol. 66, 735–748. 10.1007/s00445-004-0355-9
34
Masterlark T. (2007). Magma intrusion and deformation predictions: sensitivities to the Mogi assumptions. J. Geophys. Res. 112, B06419. 10.1029/2006JB004860
35
Mohajeri N. Gudmundsson A. (2012). Entropies and scaling exponents of street and fracture networks. Entropy14, 800–833. 10.3390/e14040800
36
Mooney W. D. Beroza G. C. Kind R. (2007). Fault zones from top to bottom, in Tectonic Faults: Agents of Change on a Dynamic Earth, M. R. Handy, G. Hirth, and N. Hovius (London: MIT Press), 9–46.
37
Nakada S. Uto K. Sakuma S. Eichelberger J. C. Shimizu H. (2005). Scientific results of conduit drilling in the Unzen Scientific Drilling Project (USDP). Sci. Drilling1, 18–22. 10.5194/sd-1-18-2005
38
Newhall C. G. Hendley J. W. II. Stauffer P. H. (1998). The Cataclysmic 1991 Eruption of Mount Pinatubo, Philippines. Vancouver: USGS Fact Sheet-113-97. 1–2.
39
Newhall C. G. Self S. (1982). The volcanic explosivity index (VEI)—an estimate of explosive magnitude for historical volcanism. J. Geophys. Res. 87, 1231–1238. 10.1029/JC087iC02p01231
40
Newman M. E. J. (2005). Power laws, Pareto distributions and Zipf's law. Contemp. Phys. 46, 323–351. 10.1080/00107510500052444
41
Park J. Song R. R. A. Okal E. Stein S. Roult G. Clevede E. et al . (2005). Earth's free oscillations excited by the 26 December 2004 Sumatra-Andaman Earthquake. Science308, 1139–1144. 10.1126/science.1112305
42
Pisarenko V. Rodkin M. (2010). Heavy-Tailed Distributions in Disaster Analysis. Berlin: Springer Verlag. 10.1007/978-90-481-9171-0
43
Pyle D. M. (1995). Mass and energy budgets of explosive volcanic eruptions. Geophys. Res. Lett. 22, 563–566. 10.1029/95GL00052
44
Pyle D. M. (2000). Sizes of volcanic eruptions, in Encyclopedia of Volcanoes, eds SigurdssonH.HoughtonB. F.McNuttS. R.RymerH.StixJ. (New York, NY: Academic Press), 263–269.
45
Radi H. A. Rasmussen J. O. (2013). Principles of Physics: For Scientists and Engineers. Berlin: Springer Verlag. 10.1007/978-3-642-23026-4
46
Rivalta E. Segall P. (2008). Magma compressibility and the missing source for some dike intrusions. Geophys. Res. Lett. 35:L04306. 10.1029/2007GL032521
47
Scholz C. H. (1990). The Mechanics of Earthquakes and Faulting. Cambridge: Cambridge University Press.
48
Segall P. (2010). Earthquake and Volcano Deformation. Princeton, NJ: Princeton University Press.
49
Smil V. (2008). Energy in Nature and Society: General Energetics of Complex Systems. London: MIT Press.
50
Sommerfeld A. (1964). Thermodynamics and Statistical Mechanics. London: Academic Press.
51
Sparks R. S. J. Bursik M. I. Carey S. N. Gilbert J. S. Glaze L. S. Sigurdsson H. et al . (1997). Volcanic Plumes. New York, NY: Wiley.
52
Thordarson T. Self S. (1993). The Laki (Skaftar Fires) and Grimsvotn eruptions in 1783–1785. Bull. Volcanol. 55, 233–263. 10.1007/BF00624353
53
Tsuya H. (1955). Geological and petrological studies of volcano Fuji, V. Bull. Earthquake Res. Inst. Tokyo33, 341–383.
54
Verhoogen J. (1980). Energetics of the Earth. Washington, DC: National Academy of Sciences.
55
Woods A. W. Huppert H. E. (2003). On magma chamber evolution during slow effusive eruptions. J. Geophys. Res. 108, 2403. 10.1029/2002JB002019
56
Yokoyama I. (1957). Energies in active volcanoes. Bull. Earthquake Res. Inst. Tokyo35, 75–97.
Summary
Keywords
fault zones, volcanoes, earthquakes, volcanic eruptions, thermodynamics, energy
Citation
Gudmundsson A (2014) Elastic energy release in great earthquakes and eruptions. Front. Earth Sci. 2:10. doi: 10.3389/feart.2014.00010
Received
21 April 2014
Accepted
11 May 2014
Published
27 May 2014
Volume
2 - 2014
Edited by
Valerio Acocella, Università Roma Tre, Italy
Reviewed by
Yosuke Aoki, University of Tokyo, Japan; Shigekazu Kusumoto, University of Toyama, Japan
Copyright
© 2014 Gudmundsson.
This is an open-access article distributed under the terms of the Creative Commons Attribution License (CC BY). The use, distribution or reproduction in other forums is permitted, provided the original author(s) or licensor are credited and that the original publication in this journal is cited, in accordance with accepted academic practice. No use, distribution or reproduction is permitted which does not comply with these terms.
*Correspondence: Agust Gudmundsson, Department of Earth Sciences, Royal Holloway University of London, Queen's Building, Egham TW20 0EX, UK e-mail: rock.fractures@googlemail.com
This article was submitted to Structural Geology and Tectonics, a section of the journal Frontiers in Earth Science.
Disclaimer
All claims expressed in this article are solely those of the authors and do not necessarily represent those of their affiliated organizations, or those of the publisher, the editors and the reviewers. Any product that may be evaluated in this article or claim that may be made by its manufacturer is not guaranteed or endorsed by the publisher.