 Greig A. Paterson
- Key Laboratory of Earth and Planetary Physics, Institute of Geology and Geophysics, Chinese Academy of Sciences, Beijing, China
Asserting the reliability of paleointensity estimates, or comparing relative reliabilities between vastly or subtly different results is a key challenge for paleointensity studies, which often leaves interpretations of these data rife with ambiguities. How we define reliable data is a concept that changes as our understanding of data and experiments advances. As a community we need to take steps to push this forward in an objective fashion that provides the most benefit, not just for paleointensity analysts, but also for those who ultimately wish to use the data to better understand deep Earth processes. However, in this ever-changing landscape, we must also ensure that the data we obtain do not lose their value as our advances threaten to make published data obsolete. It remains unknown exactly how our ability to assess the reliability of data will change and what information will become relevant. It is therefore essential for paleointensity studies to report as much data and meta-data as possible and, ideally, publically archive their measurement data for future reanalysis. Such practices are important, not only for paleointensity studies, but science in general and their implementation is vital to the future of paleomagnetism.
Introduction
Measurements of the absolute strength of the paleomagnetic field (archeo- and paleo-intensity data) have proven useful in a broad range of applications, from the dating of archeological artifacts (e.g., Pavón-Carrasco et al., 2011) to potential geomagnetic influences on climate (e.g., Courtillot et al., 2007), to identifying the earliest known geomagnetic field and its implications for early terrestrial life (e.g., Tarduno et al., 2014). Due to a several challenges, however, paleointensity data have yet to fulfill their full potential for understanding the details of how the geomagnetic field has evolved and what this implies about the behavior and evolution of Earth's deep interior.
Over recent decades a great number of advances have been made in better understanding the variety of effects that can influence paleointensity data and many new approaches to test for bad behavior have been developed. Only recently, however, have many of these begun to take root, and not always consistently. As a result, we are left with vast amounts of legacy data and, sadly, recently published studies, where common checks for reliability were not performed or where the data analysis is insufficient or too poorly documented to be accurately replicated. The single biggest challenge in using this diversity of data is asserting the reliability of a given estimate in a quantitative fashion that allows all studies to be compared fairly.
In this perspective, I firstly outline the basic stages of obtaining a paleointensity result to give non-paleointensity scientists an overview of the processes involved in order to give them a better understanding of what factors influence data reliability, which, in-turn, can influence their own analyses. This also serves as a simple demonstration for the need for more information from paleointensity studies. I then discuss some simple strategies that, if widely adopted, will help to maximize the immediate impact of paleointensity studies and make moves toward ensuring the future value and re-usability of the results.
The Stages of a Paleointensity Result
Although a great diversity of methods and materials have been proposed for obtaining paleointensities (reviewed by Tauxe and Yamazaki, 2007), the basic stages are generally the same for most approaches (Figure 1). The purpose of paleointensity studies is to estimate the strength of the Ancient Field, which is typically assumed to represent the dominant dipole, but may have contributions from non-dipole fields and local anomalies. The way in which geological or archeological materials record the Ancient Field is determined by Specimen Characteristics. This includes intrinsic properties such as the influence of magnetic domain state or anisotropy, which can be quantified independently of the paleointensity experiment. Specimen Characteristics also includes potential behavior, which may not be fully actualized until the experiment is performed (e.g., the propensity of a specimen to alter).
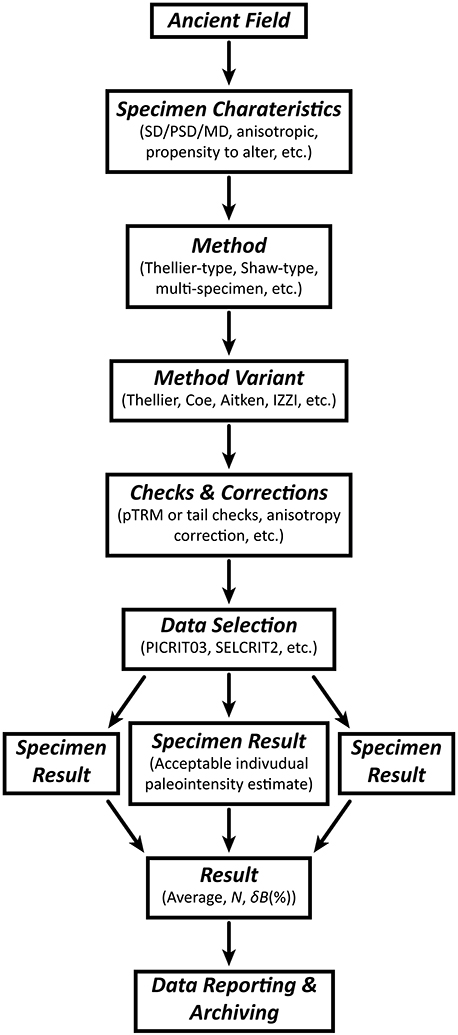
Figure 1. Simplified flow chart of the basic stages of obtaining a paleointensity result. This process can be viewed as a series of natural, technical, and data analysis filters that successively modify the signal of the Ancient Field and ultimately produce the final Result.
With specimens in hand, the paleointensity analyst must make choices about the experiment and analyses, which are often based on the likely behavior of the specimens, but are strongly influenced by user preference, general community trends, or availability of necessary equipment. The choice of Method broadly reflects the family of paleointensity methods that can be used, such as Thellier-type thermal methods (Thellier and Thellier, 1959) or Shaw-type alternating-field (AF) demagnetization methods (Shaw, 1974), among others. The Method Variant is the specific choice of experimental protocol and reflects the different style of experiments within a given Method family (e.g., Coe or IZZI protocols for the Thellier-type Method). For each Method Variant there is the option of incorporating Checks and Corrections for non-ideal behavior. Some checks, such as partial thermoremanent magnetization (pTRM), are adopted as standard, others, such as pTRM tail checks, are not. Similarly, correction methods (e.g., anisotropic or non-linear TRM) are variably applied depending on the type of materials used. For example, a typical pottery fragment has Specimen Characteristics that are distinct from a typical lava flow specimen; hence anisotropy corrections are much more frequently applied to pottery than lava flows. The choices of Method, Method Variant, and Checks and Corrections, combined with the analyst's choice of how many steps to perform (e.g., how many heating steps for a thermal experiment), dictate the details of the experiment performed and hence dictate the realization of potential Specimen Characteristics. For example, given a specimen with some unknown potential to alter during heating, the realization of this potential behavior will be different for an experiment that uses many heating steps compared to one that uses few.
Due to Specimen Characteristics that are known to be detrimental to our ability to recover an accurate paleointensity estimate, it is necessary to apply Data Selection, which is often based on specific Checks and Corrections designed to detect such Specimen Characteristics. At this stage various criteria are applied to try and preferentially isolate what are thought to be good results. Although a number of established criteria sets exist (e.g., PICRIT03; Kissel and Laj, 2004), in general, most studies use unique criteria sets. As a consequence there is a huge variety of Data Selection criteria.
The final stage for a given study is the Result. For a typical study this comes at two levels: Specimen Results and a site or cooling unit level Result, which is the average of multiple specimens (N.B. some archeomagnetic studies average specimens to get a sample level Result and then average the samples for a site Result). An average site level Result is what is reported in the majority of paleointensity databases and is typically reported as an arithmetic mean, the number of specimens averaged (N), and the standard deviations of the individual estimates, which is often reported as a percentage of the average (δB(%)).
What we observe in a paleointensity Result is not only a reflection of the Ancient Field, but of all the stages involved and how they interplay with each other. In this sense, the entire process can be viewed as a type of filtering process, with each stage influencing the information that is passed on. At present, however, most analyses consider only Method, Checks and Corrections, and the Result when identifying reliable data. When the stages of the entire process are carefully considered, however, it becomes immediately obvious that our final Result depends on many more aspects than we currently consider (Figure 1). It is now being increasingly recognized that different Specimen Characteristics manifest differently depending on the different Method Variants (Yu et al., 2004; Paterson, 2013). The same is also true for Data Selection, where the same statistics and thresholds can behave differently for different Method Variants, even under ideal conditions (Paterson et al., 2012).
To be able to provide reliability assessments of published paleointensity estimates, we therefore need to consider how the Method, the Method Variant, the Checks and Corrections, and the Data Selection interact with the Specimen Characteristics to produce the Result. How this will take form remains unknown, but will depend on the ultimate use of the data (high-resolution vs. long timescale). It is clear, however, that much more information is needed from paleointensity studies, so it seems only prudent to ensure that the studies we are undertaking now provide sufficient information to aid in this advancement and to ensure that they do not become prematurely obsolete. Data Reporting and Archiving are, therefore, essential for maintaining the longevity of our results.
Improving Current Practices
It is important that paleointensity studies report data with the clarity and depth required to ensure their longevity and ease of use. Assessment of recently published studies using a newly proposed paleointensity quality index found that may studies scored poorly in some indices simply because readily available information was not reported (Biggin and Paterson, 2014). A greater depth of information is possible through the growing use of online only supplementary material. Through such simple and easy to use outlets, providing Specimen Results is a common, but not yet universal, practice. Such data availability makes basic, but limited, re-analysis a possibility and greatly increases the potential longevity of the study. Improved reporting comes not only through presenting data, but also in consistency in how these data are reported, which is important for facilitating their use by those who are not paleointensity analysts themselves.
Reporting Results
The final paleointensity Result, taken to represent a geologically instantaneous time period, is the main aim of any study. For general consistency with the majority of studies, I recommend that an average Result should be reported as the unweighted mean ± one standard deviation along with the number of specimens averaged (e.g., 39.8 ± 2.1 μT, N = 6). Some studies prefer to determine a weighted mean. If so, then both weighted and unweighted results (along with the individual weights) should be reported. This is particularly important given that some weights can introduce unwanted bias—for example, weighting by the quality factor (q; or other weighting statistics), which is proportional to paleointensity estimate, can bias results to higher values.
Most studies report the Result in the above-described fashion, or the relevant information can be readily gleaned from the publication. The greatest diversity, which can often cause the greatest headaches, comes from how the uncertainty of the result is determined and described.
The error on a paleointensity is an important concept on which entire papers could be written, but at the simplest level, confusion arises in making the distinction between the standard deviation and the standard error (sometimes referred to as the standard deviation of the mean—for clarity the term “standard error” should always be used). Both measures have uses in a paleointensity study, but are frequently confused, which can lead to issues when incorporating the data into database and their subsequent use in developing geomagnetic field models.
The standard deviation is a measure of observation consistency, whereby greater scatter of observations indicates inconsistent results from specimens or samples that should be recording the same Ancient Field. The standard error on the other hand, is measure of how well we know the mean estimate and is typically used to determine a confidence interval. In this sense the standard deviations tells us about the behavior of our observations while the standard error tells us about the likely behavior of the average of these observations. For a more complete comparison of these two concepts and how to determine 95% confidence intervals (not simply twice the standard error) see Paterson et al. (2010). This confusion persists in many modern studies, despite this problem being a known issue. It therefore seems reasonable to call for a basic level of consistency in how we report such critical information. The above-described reporting recommendation (mean, standard deviation, N) provides all information needed (the standard error can be readily calculated) and should be adopted as the basic data-reporting unit for all studies.
All of these statistics used to quantify the Result rely on the assumption of normally distributed data, which, for most paleointensity studies, is a reasonable, but not always satisfied assumption (Paterson et al., 2010). It should be emphasized that these statistical concepts tell us about our data and not necessarily about the Ancient Field. How well they represent information pertaining to the true paleointensity relies on our ability to exclude unwanted biases from our data.
Data Selection
Data selection, the process of screening our data with the aim of isolating the best and, hopefully, the most accurate results, is a vital step for all paleointensity studies, but there is little consensus as to the best approach. At present there are over 40 statistics commonly used to select data and an important first step has been to standardized their definitions and calculations (Paterson et al., 2014).
When undertaking Data Selection, it is important that the process is reproducible (i.e., objectively quantified) and reported in detail. Unfortunately, selection criteria are often reported with insufficient detail to allow reproduction. Statements akin to “pTRM check were deemed as successful if less than 10%.” frequent the literature, old and new. There are no less than 9 ways of quantifying pTRM checks (and counting)—so 10% of what?
Similarly, it is common to see subjective criteria used to selected data. Such criteria are typically visually assessed. Common examples are that the natural remanent magnetization direction is tending to the origin on an orthogonal plot or curvature on an Arai plot. The challenge here is that such visual assessments can be somewhat subjective and cannot be consistently reproduced. For many of these subjective criteria, quantitative measures exist (e.g., Tanaka and Kobayashi, 2003; Tauxe and Staudigel, 2004; Paterson, 2011) and such quantifications are vital to ensure reproducibility—a fundamental cornerstone of all science.
Even in 2014, some 36 years since the birth of modern-day Data Selection (Coe et al., 1978), these short-comings are regular features of new publications, but only serve to hinder fair comparisons between different studies where acceptable data is in the eye of the beholder. The simple steps of making data analysis clear and reproducible are essential for maintaining the long-term value of paleointensity results.
Performing MagIC
Our understanding of paleointensity data is continually evolving along with our methods and techniques. Despite the measures outlined above, which only allow limited re-analyzes, this progress will inevitably lead to analyses becoming out of date. The ability to reanalyze old data in light of newfound understanding is the best possible way of ensuring long-term data value, but is only possible if the original measurement data are publically archived. For site level results the IAGA PINT database (Tanaka and Kono, 1994; Biggin et al., 2009), GEOMAGIA (Korhonen et al., 2008), and ArcheoInt (Genevey et al., 2008) compile published data. For specimen or original measurement data, the most comprehensive resource is the Magnetic Information Consortium (MagIC) paleo- and rock magnetic database.
Public availability of data is now of major importance, not just for paleomagnetism, but to the scientific community in general. Funding agencies now regularly require management plans for the data generated through research that they fund and this requires public dissemination of data. Earth science journals are also placing a stronger emphasis on data availability, although not always a requirement for publication. Both publishers and funding agencies will become stricter in their enforcement of data management policies to point where it becomes compulsory. Getting involved sooner, rather than later, will pay dividends in demonstrating to funding agencies researchers' commitment to sustainable and value-for-money science.
My own work has benefitted tremendously from MagIC: Several of my papers have used data from MagIC or have made new data publically available and I have cited numerous studies (sometimes more than once), simply because I have been able to access and use the data. In some cases the original authors were extremely generous in giving me data, which, with their permission, I have since archived on MagIC. This quid pro quo sees the authors' work used and widely disseminated and I take on the effort needed to make it available on MagIC, but reap the benefit of being able to reanalyze it for my own purposes.
More generally, and less anecdotally, Piwowar et al. (2007) illustrated that papers that made data publicly available were associated with a 69% increase in their citation rate (in the field of cancer microarray clinical trials). Moreover, this increase was independent of factors that may influence citations, such as date of publication or journal impact factor. Increasing data availability increases the impact of your work.
I view MagIC as a win-win-win scenario for the paleomagnetic community: (1) Researchers who release their data benefit from increased impact; (2) Current researchers will have access to a valuable and powerful resource that opens up new research opportunities; and (3) We safeguard our data for future generations of scientists so that they can undertake full retrospective analyses as our knowledge of the data progresses.
Such benefits are, of course, not without effort—data processing, formatting, and uploading are all required to make data available through MagIC. This has been an inhibiting factor for many, particularly when faced with the daunting task of processing years, or even decades worth of data. I have, and am continuing to make data available through MagIC, so I am intimately familiar with many of these challenges. The biggest challenges are getting to grips with the MagIC terminology and the often large-scale task of processing data into the MagIC format. However, once overcome for the first time, processing new studies and data becomes quicker and much easier. In fact, many of the formatting tools needed to prepare data for MagIC already exist through the PmagPy package (Tauxe, 2010; earthref.org/PmagPy/cookbook/) and if not, can readily be added, thus surmounting one of the main challenges. This is also combined with a friendly and helpful MagIC support team, who are able to help with all aspects of the database. In addition, new changes to the MagIC uploading interface, which are currently well into beta testing, greatly improving the ease with which data can be publically archived to preserve their future value.
Summary
Over the coming years I envisage big changes in how the reliability of paleointensity data is viewed and with it the ominous prospect of rapidly obsolete analyses and results. As individuals and as a community we need to adopt practices that will minimize the negative impacts of this necessary change. Failure to do so will only hinder our attempts to address fundamental Earth science questions. At the heart of this are improvements in how we report data and archive data for future reuse. Many of these ideas are already implemented in modern studies, but need to be more widely adopted. I urge our community to give serious thought and discussion to how we can implement the measures necessary to ensure the long-term viability of paleointensity data and its use.
Conflict of Interest Statement
The author declares that the research was conducted in the absence of any commercial or financial relationships that could be construed as a potential conflict of interest.
Acknowledgments
GAP would like to thank his many colleagues for their valuable and fruitful discussions, in particular Andrew Biggin, Shuhui Cai, Cathy Constable, Ron Shaar, Lisa Tauxe, and Yuhji Yamamoto, among many others. I also thank the two reviewers for their comments and suggestions. This acknowledgement does not signify endorsement of the views expressed here, which entirely that of the author. GAP acknowledges funding from the Key Laboratory of Earth's Deep Interior (IGGCAS) and National Science Foundation of China (NSFC) grant 41374072.
References
Biggin, A. J., and Paterson, G. A. (2014). A new set of qualitative reliability criteria to aid inferences on palaeomagnetic dipole moment variations through geological time. Front. Earth Sci. 2:24. doi: 10.3389/feart.2014.00024
Biggin, A. J., Strik, G. H. M. A., and Langereis, C. G. (2009). The intensity of the geomagnetic field in the late-Archaean: new measurements and an analysis of the updated IAGA palaeointensity database. Earth Planets Space 61, 9–22. doi: 10.1186/BF03352881
Coe, R. S., Grommé, S., and Mankinen, E. A. (1978). Geomagnetic paleointensities from radiocarbon-dated lava flows on Hawaii and the question of the Pacific nondipole low. J. Geophys. Res. 83, 1740–1756. doi: 10.1029/JB083iB04p01740
Pubmed Abstract | Pubmed Full Text | CrossRef Full Text | Google Scholar
Courtillot, V., Gallet, Y., Le Mouël, J.-L., Fluteau, F., and Genevey, A. (2007). Are there connections between the Earth's magnetic field and climate? Earth Planet. Sci. Lett. 253, 328–339. doi: 10.1016/j.epsl.2006.10.032
Genevey, A., Gallet, Y., Constable, C. G., Korte, M., and Hulot, G. (2008). ArcheoInt: an upgraded compilation of geomagnetic field intensity data for the past ten millennia and its application to the recovery of the past dipole moment. Geochem. Geophys. Geosyst. 9, Q04038. doi: 10.1029/2007GC001881
Kissel, C., and Laj, C. (2004). Improvements in procedure and paleointensity selection criteria (PICRIT-03) for Thellier and Thellier determinations: application to Hawaiian basaltic long cores. Phys. Earth Planet. Inter. 147, 155–169. doi: 10.1016/j.pepi.2004.06.010
Korhonen, K., Donadini, F., Riisager, P., and Pesonen, L. J. (2008). GEOMAGIA50: an archeointensity database with PHP and MySQL. Geochem. Geophys. Geosyst. 9, Q04029. doi: 10.1029/2007GC001893
Paterson, G. A. (2011). A simple test for the presence of multidomain behaviour during paleointensity experiments. J. Geophys. Res. 116, B10104. doi: 10.1029/2011JB008369
Paterson, G. A. (2013). The effects of anisotropic and non-linear thermoremanent magnetizations on Thellier-type paleointensity data. Geophys. J. Int. 193, 694–710. doi: 10.1093/gji/ggt033
Paterson, G. A., Biggin, A. J., Yamamoto, Y., and Pan, Y. (2012). Towards the robust selection of Thellier-type paleointensity data: the influence of experimental noise. Geochem. Geophys. Geosyst. 13, Q05Z43. doi: 10.1029/2012GC004046
Paterson, G. A., Heslop, D., and Muxworthy, A. R. (2010). Deriving confidence in paleointensity estimates. Geochem. Geophys. Geosyst. 11, Q07Z18. doi: 10.1029/2010GC003071
Paterson, G. A., Tauxe, L., Biggin, A. J., Shaar, R., and Jonestrask, L. C. (2014). On improving the selection of Thellier-type paleointensity data. Geochem. Geophys. Geosyst. 15, 1180–1192. doi: 10.1002/2013GC005135
Pavón-Carrasco, J., Rodríguez-González, J., Osete, M. L., and Torta, J. M. (2011). A Matlab tool for archaeomagnetic dating. J. Arch. Sci. 38, 408–419. doi: 10.1016/j.jas.2010.09.021
Piwowar, H. A., Day, R. S., and Fridsma, D. B. (2007). Sharing detailed research data is associated with increased citation rate. PLoS ONE 2:e308. doi: 10.1371/journal.pone.0000308
Pubmed Abstract | Pubmed Full Text | CrossRef Full Text | Google Scholar
Shaw, J. (1974). A new method of determining the magnitude of the palaeomagnetic field: application to five historic lavas and five archaeological samples. Geophys. J. R. Astr. Soc. 39, 133–141. doi: 10.1111/j.1365-246X.1974.tb05443.x
Tanaka, H., and Kobayashi, T. (2003). Paleomagnetism of the late Quaternary Ontake Volcano, Japan: directions, intensities, and excursions. Earth Planets Space 55, 189–202. doi: 10.1186/BF03351748
Tanaka, H., and Kono, M. (1994). Paleointensity database provides new resource. Eos Trans. AGU 75, 498–498. doi: 10.1029/94EO02003
Tarduno, J. A., Blackman, E. G., and Mamajek, E. E. (2014). Detecting the oldest geodynamo and attendant shielding from the solar wind: Implications for habitability. Phys. Earth Planet. Inter. 233, 68–87. doi: 10.1016/j.pepi.2014.05.007
Tauxe, L., and Staudigel, H. (2004). Strength of the geomagnetic field in the cretaceous normal superchron: new data from submarine basaltic glass of the Troodos Ophiolite. Geochem. Geophys. Geosyst. 5, Q02H06. doi: 10.1029/2003GC000635
Tauxe, L., and Yamazaki, T. (2007). “5.13 - Paleointensities,” in Treatise on Geophysics, ed S. Gerald (Amsterdam: Elsevier), 509–563.
Thellier, E., and Thellier, O. (1959). Sur l'intensité du champ magnétique terrestre dans le passé historique et géologique. Ann. Géophys. 15, 285–376.
Keywords: paleointensity, archeointensity, data management, data selection, geomagnetic field
Citation: Paterson GA (2014) The necessity of data availability in maintaining the value and longevity of paleointensity results. Front. Earth Sci. 2:33. doi: 10.3389/feart.2014.00033
Received: 24 September 2014; Accepted: 28 October 2014;
Published online: 12 November 2014.
Edited by:
Joshua M. Feinberg, University of Minnesota, USAReviewed by:
Peter Aaron Selkin, University of Washington, Tacoma, USANobutatsu Mochizuki, Kumamoto University, Japan
Copyright © 2014 Paterson. This is an open-access article distributed under the terms of the Creative Commons Attribution License (CC BY). The use, distribution or reproduction in other forums is permitted, provided the original author(s) or licensor are credited and that the original publication in this journal is cited, in accordance with accepted academic practice. No use, distribution or reproduction is permitted which does not comply with these terms.
*Correspondence: Greig A. Paterson, Key Laboratory of Earth and Planetary Physics, Institute of Geology and Geophysics, Chinese Academy of Sciences, 19 Bei Tu Cheng Xi Lu, Beijing 100029, China e-mail:Z3JlaWcucGF0ZXJzb25AbWFpbC5pZ2djYXMuYWMuY24=