 Danijel Belušić
 Željko Večenaj
 Margaret A. LeMone
- 1School of Earth, Atmosphere and Environment, Monash University, Melbourne, VIC, Australia
- 2Department of Geophysics, Faculty of Science, University of Zagreb, Zagreb, Croatia
- 3National Center for Atmospheric Research, Boulder, CO, USA
We report a possible occurrence of horizontal roll vortices over the Adriatic Sea during the bora wind. The National Center for Atmospheric Research Electra aircraft measured the turbulence structure above the Adriatic on 07 November 1999 during the Mesoscale Alpine Program. The data indicate that horizontal roll vortices are generated by the strong cold-air outbreak associated with bora. The rolls have a horizontal wavelength of about 1 km and an aspect ratio of approximately 1.5. There is no indication of the presence of cloud streets typically associated with the rolls, which is a consequence of the dry air advection in the lower troposphere resulting from the downslope flow.
Introduction
The bora wind has been studied for decades by many researchers (for a recent review, see Grisogono and Belušić, 2009). It is a canonical example of a downslope windstorm that is generated by flow over an almost two-dimensional mountain. The Dinaric Alps is a mountain range that extends along the eastern coast of the Adriatic Sea and forms a long barrier that forces the impinging cold north-easterly flow to rise and, to a first approximation, follow a typical two-dimensional hydraulic-like bora flow structure. This is particularly evident for the northern Adriatic bora, which is one of the first real flows that was characterized to a large extent using hydraulic theory of downslope windstorms (Smith, 1985, 1987).
Bora is most frequent in winter and at some locations blows more than 100 days per year (e.g., Yoshino, 1976). A number of complexities arise because of the terrain inhomogeneity, particularly the mountain gaps and peaks along the Dinaric Alps. The major gaps and peaks result in the formation of bora jets and wakes, respectively (e.g., Jiang and Doyle, 2005; Belušić and Klaić, 2006; Signell et al., 2010), which are then related to potential vorticity banners (e.g., Grubišić, 2004) and varying turbulence structure (Večenaj et al., 2012). A number of other features appear within the bora flow, such as lee rotors of different types (e.g., Gohm et al., 2008; Prtenjak and Belušić, 2009; Stiperski et al., 2012) and quasi-periodic pulsations (e.g., Belušić et al., 2007), but they mostly do not extend far over the sea.
Regardless of the large body of bora research studies, the possibility of occurrence of horizontal roll vortices in the bora flow has never been considered. This is rather surprising, since boras are usually strong and relatively cold winds that blow over the warmer Adriatic Sea, creating well-known conditions for generating roll vortices (e.g., Kelly, 1982; Atlas and Chou, 1983; Walter and Overland, 1984; Brummer, 1999). The most likely reason for this omission is in that the ubiquitous cloud streets associated with rolls do not seem to occur during bora.
Horizontal rolls are elongated quasi-two-dimensional vortices appearing in the convective atmospheric boundary layer (ABL) (e.g., LeMone, 1973). While they are usually recognized as cloud streets, particularly in satellite imagery (e.g., Young et al., 2002), they have been observed in clear air as well (e.g., Konrad, 1970; Kelly, 1984). They vertically extend to the top of the ABL and their horizontal wavelengths are typically more than two times larger than their vertical size, i.e., their aspect ratio (wavelength/ABL height) is two or larger. The rolls are frequently associated with cold-air outbreaks (e.g., Melfi and Palm, 2012), although they can be generated by a number of mechanisms, including inflection point instability, parallel instability, convective instability and interaction with gravity waves aloft (Etling and Brown, 1993).
Here, we present aircraft observations above the Adriatic Sea that suggest the existence of horizontal roll vortices in bora. We focus on a single bora episode observed during the Mesoscale Alpine Program (MAP) in 1999 (Bougeault et al., 2001).
Data
The aircraft data over the Adriatic Sea were collected on 7 November 1999 during the MAP Intensive Observation Period 15 (e.g., Bougeault et al., 2001). This was a cyclonic bora case topped by a temperature inversion and a critical level in the upstream wind profile, indicating a shallow bora flow, and one of the stronger and more persistent boras on record (Klaić et al., 2003; Grubišić, 2004). The U. S. National Center for Atmospheric Research (NCAR) Electra aircraft flew three vertically stacked straight and level flight legs from 1347 to 1539 UTC (Figure 1, Table 1). The legs were ~216 km long and oriented approximately perpendicular to the mean bora direction (e.g., Grubišić, 2004). Six dropsondes were released successfully from approximately 4200 m above sea level (ASL) along the first flight leg. The aircraft mean speed was 100 ms−1 and the data were sampled at a frequency of 25 Hz. In order to avoid noise at high frequencies, the aircraft data were block-averaged to 5 Hz prior to the analyses. Further details about the data are given in Večenaj et al. (2012). As a result of the persistence of this bora case, the flow conditions may to a good approximation be considered stationary during the 2 h period spanning the three flight legs (Klaić et al., 2003; Grubišić, 2004). The analysis of numerical model results corroborates this conclusion (Večenaj et al., 2012).
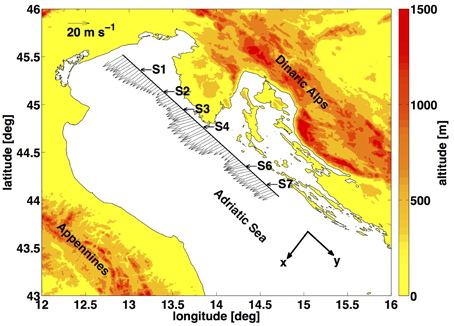
Figure 1. Wind vectors averaged over 1.6 km along the lower ABL flight leg (370 m ASL) with the release positions of successful dropsondes (S1–S7) indicated. Reference wind vector is shown in the top left corner, while the orientation of the coordinate system is denoted in the bottom right corner. The local topography is shaded.

Table 1. Seventh November 1999 flight legs.
A right-handed orthogonal coordinate system is chosen with the positive x-axis aligned perpendicular to the flight direction pointing toward the south-west, which is approximately parallel to the mean bora flow. If there are rolls, the x-axis also lies approximately along the roll axis.
Results
Figure 2 shows the wind components for the lower ABL flight leg (370 m ASL). A region with increased variability occurs around 45°N, where nearly regular oscillations seem to occur at scales of about 1 km (Figure 2B).
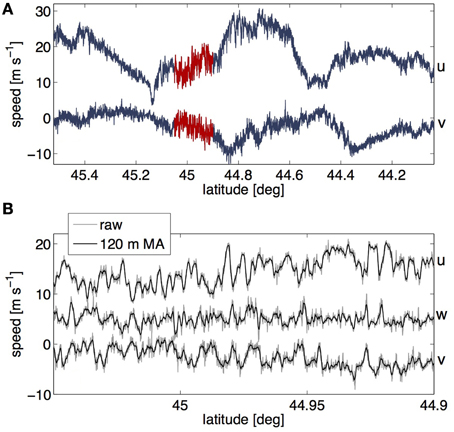
Figure 2. (A) Raw u and v components of the wind velocity along the lower ABL flight leg (370 m ASL) over the Adriatic. The segment chosen for the analysis of possible rolls (44.90–45.05°N) is shown in red. (B) The three wind components over the analyzed segment; shown are the raw and 120-m moving-average smoothed data. A 5 m s−1 offset has been added to w for presentation purposes.
Spectral analysis reveals peaks in the wind component spectra centered at 1 km, at several locations along the two lower flight legs (Figure 3). The dominant peak is evident in all wind components and at both heights for the segment chosen for the analysis (44.90–45.05°N). The strength and consistency of this peak indicates the most likely location of the roll vortices. Unlike for the lower ABL flight leg, the spectral peak at the upper ABL flight leg does not extend over the entire analyzed segment. The available spectra over the segment show that the peak at the upper ABL flight leg decreases and disappears south of about 44.96°N.
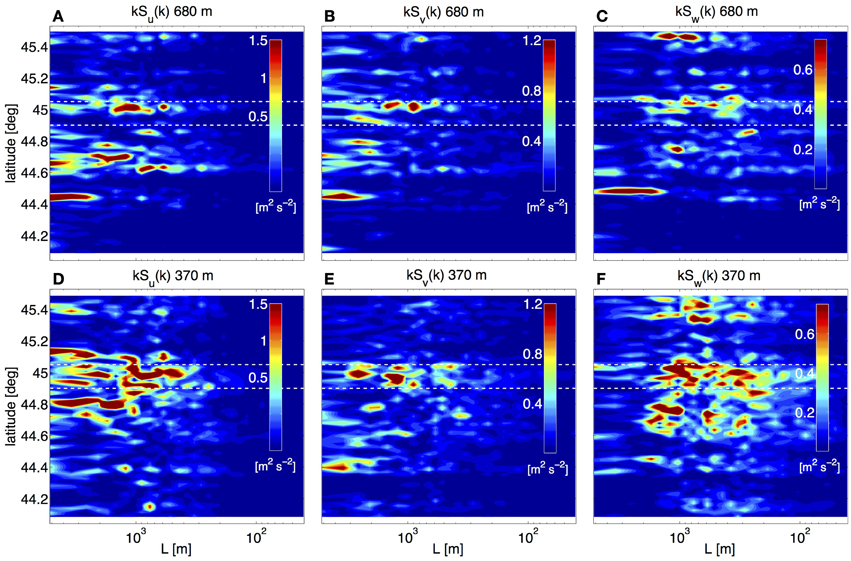
Figure 3. Spatial structure of the weighted energy spectra k*S(k) along the entire upper (A–C) and lower (D–F) ABL flight leg for u (A,D), v (B,E) and w (C, F) wind components. The two white horizontal dashed lines indicate the analyzed segment. A noticeable increase in energy at the horizontal scale of approximately 1 km is present in all plots around the latitude of 45°N. The spectra are calculated on overlapping subintervals of 512 data points (about 10 km long) which slide by 103 data points (about 2 km), thus obtaining 100 spectra over the 216-km long flight legs. The y-axis values correspond to the central latitudes of subintervals.
Data from the dropsonde S3, released closest to the chosen segment, are shown in Figure 4. According to the dropsonde, the ABL height, determined as the base of the low-level temperature inversion, is about 600 m deep. However, the data measured by the aircraft at the horizontal location of the dropsonde release show that the potential temperature at 680 m is lower than that recorded by the dropsonde, which probably results from the downwind drift of the dropsonde of approximately 8 km (estimated form the drift of dropsondes S1 and S2, because S3 did not return GPS data) and the time difference between the dropsonde release and the two ABL flight legs. This suggests that the ABL height decreases downwind, which is unusual for a cold-air outbreak and the development of a convective ABL over the sea. The reason for this is the downslope nature of bora, where the related dynamical subsidence manages to decrease the convective ABL height farther than 100 km offshore (e.g., Grubišić, 2004). The aircraft-measured potential temperatures at the two lower flight legs on the chosen segment are almost equal north of 44.96°N, but there is a gradual increase in stability south of 44.96°N (Figure 5 and Table 1). This means that the inversion base is most likely just above the upper ABL flight leg to the north of 44.96°N, and below to the south. The latter explains the disappearance of the spectral peak at the upper ABL flight leg south of 44.96°N, since the aircraft is above the ABL there. Hence we estimate the mean ABL height along the chosen segment as the height of the upper ABL flight leg, zi = 680 m. This leads to the roll aspect ratio of L/zi = 1.5, which is somewhat smaller than those usually reported in the literature (e.g., Young et al., 2002).
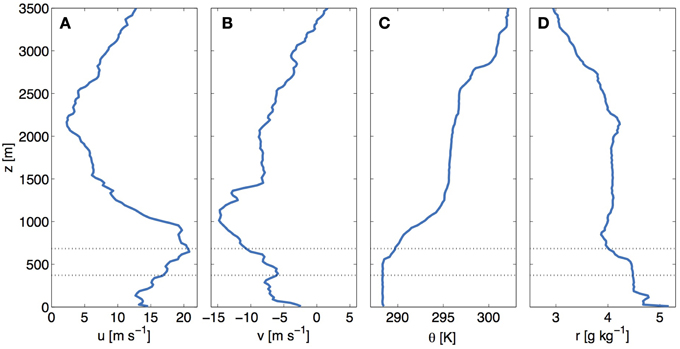
Figure 4. Vertical profiles of the (A) longitudinal u and (B) transverse v wind components, (C) potential temperature θ and (D) mixing ratio r from the dropsonde S3 released at (13.63°E, 44.96°N). Horizontal dotted lines denote the heights of the two lower flight legs (370 and 680 m).
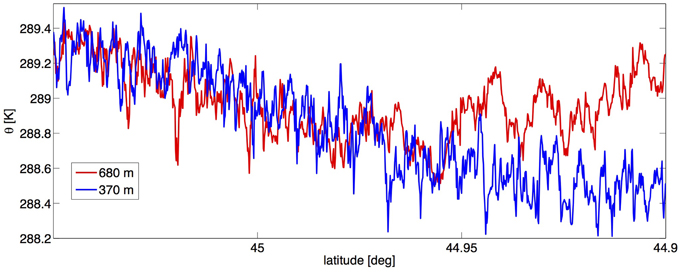
Figure 5. Potential temperature at the two lower flight legs along the analyzed segment.
The spatial structure of rolls yields specific phase relationships between different wind components (e.g., Hein and Brown, 1988; Alpers and Brummer, 1994). In an idealized system for vertically-upright rolls, the expected phase angles are ϕ(v,w) = ± 90° near the top and bottom, and ϕ(u,w) = ± 180° throughout (Chen et al., 2001; Hein and Brown, 1988). LeMone and Pennell (1976) also show that the longitudinal vortices can be tilted with height, which leads to v and w being in phase in the middle of the roll layer (alternatively, v and w could be 180 out of phase, if the tilt is in the opposite direction). The v- (across-roll) component should have maximum amplitude at the top and bottom of the layer, with w maximum near the middle of the roll layer.
Figures 6, 7 show the coherence and phase angle between the two horizontal wind components and the vertical wind component for our data at the two lower flight legs. The peak in coherence at the wavelength of 1 km is present for v and w at 680 m (Figure 6) and for all combinations of components at 370 m (Figure 7). At 370 m, which is approximately in the middle of the roll layer, u and w are 180° out of phase as expected, since u increases with height (Figure 4), while v and w are in phase (Figure 7). This indicates that the rolls are tilted in the crosswind direction. In accordance with the theory, the phase angle between v and w changes to 90° at 680 m (Figure 6), which is at the top of the roll layer.
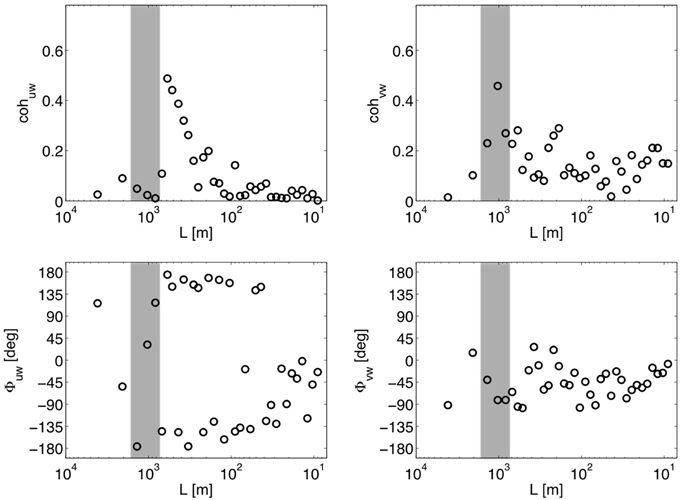
Figure 6. Spectral coherence (top) and phase angle (bottom) between u and w (left) and v and w (right) wind components over the analyzed segment (44.90–45.05°N) at the upper ABL flight leg (680 m).
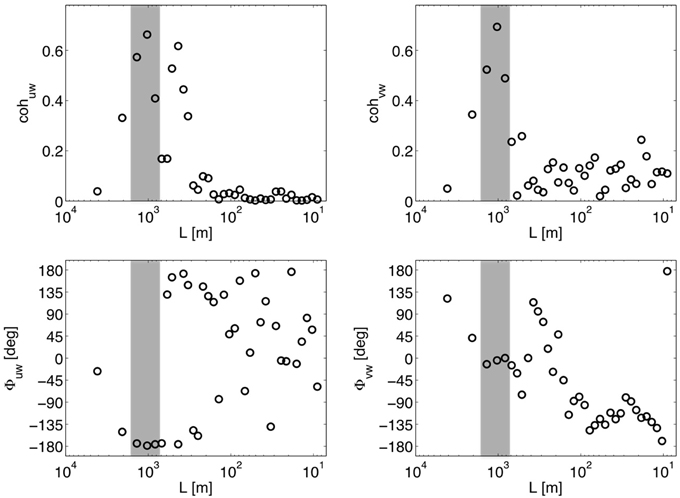
Figure 7. As in Figure 6, except for the lower ABL flight leg (370 m).
While the presented analysis indicates the existence of organized structures with persistent updrafts in the bora ABL, the fact that the related cloud streets have never been reported still calls for an explanation. First, we can use the data from dropsonde S3 (Figure 4) to estimate the lifting condensation level (LCL), which is a reasonable predictor of convective cloud base height. Applying the moistest possible ABL parcel with r = 5 g kg−1, along with the surface temperature T = 288 K and surface pressure p = 1000 hPa, the LCL is above 1.5 km, which is considerably greater than the ABL, and hence the roll, depth. The dropsonde data also show that the relative humidity remains close to 50% below 1.5 km, and then increases with height reaching its maximum value of 83% between 2.5 and 2.8 km. Such vertical distribution is consistent with the bora dynamics and is caused by the descending dry air that is governed by a large-amplitude or breaking mountain wave (e.g., Belušić and Klaić, 2006). The descending dry air usually influences a relatively shallow layer in the lee that does not extend much above 2 km, which is where the roll clouds would appear if sufficient moisture was present. The descending dry air sometimes creates clear areas even with preexisting deeper cloud layers (e.g., Grubišić, 2004).
Discussion and Conclusion
Aircraft measurements of the bora wind above the Adriatic Sea indicate the existence of horizontal roll vortices with horizontal wavelength of 1 km. The characteristics of the rolls are shown to agree with previous studies, although the wavelength of 1 km and the corresponding roll aspect ratio (horizontal wavelength/ABL height) of 1.5 are at the lower limit of the previous reports (e.g., Etling and Brown, 1993). There are several specific bora characteristics that could explain such small aspect ratio.
In a modeling study, Müller and Chlond (1996) showed that removing liquid water formation reduces the broadening of convective cells, leading to smaller aspect ratios. The majority of previous studies of rolls, where the aspect ratio is usually larger than two, are based on convective rolls that produced cloud streets, i.e., where liquid water formation was present (e.g., Miura, 1986). However, some studies based on radar or lidar observations, or modeling, of cloud-free rolls report considerably lower aspect ratios, sometimes as low as one (Kelly, 1984; Melfi et al., 1985; Miura, 1986; Mayor et al., 2002). There are no cloud streets in bora due to its downslope nature and the associated advection of dry air to low levels, so the aspect ratio is expected to be smaller. Additionally, it has been shown that the roll aspect ratio increases in the downwind direction on average by about 1 per 110 km (Miura, 1986). The current bora measurements were taken close to the coast, so larger aspect ratios could be expected further offshore. Interestingly, Melfi et al. (1985) found in their data that the cell sizes vary even when the PBL height remains almost constant regardless of the downwind distance.
While the evidence supports the presence of rolls, we cannot totally eliminate the possibility that the rolls coexisted with lines of cells (rolls+cells), as is commonly observed in clear-air radar patterns (e.g., Weckwerth et al., 1997), or that we are sampling random cells, although the last possibility is unlikely. The present analysis and the common presence of rolls in other cold-air outbreak studies suggests the presence of rolls or rolls+cells. Also, the strong winds and surface buoyancy flux combined with the unusually shallow ABL depth would likely put the present case in the ABL depth/Obukhov length regime associated with rolls+cells, or less likely, rolls, rather than pure cellular convection (Grossman, 1982). Note that roll-cell patterns are often referred to as rolls in the literature, because they produce well-defined cloud lines if the updrafts on the crosswind sides of the cells merge into clearly-defined bands of updraft air. Indeed, careful analysis of roll+cell radar signatures by Weckwerth et al. (1997) indicate strong two-dimensional signatures, justifying this characterization. The structure could be verified with a combination of cross-wind aircraft legs and legs at a small angle to the expected roll direction, the latter revealing either long-wavelength variation in wind direction (as in pure rolls), or, more likely, superposed long wavelengths (rolls) and short wavelengths (cells), as described for such structures being advected past a tower in LeMone (1973).
As shown by the running spectra (Figure 3), there is another segment with possible occurrence of rolls located around 44.75°N. However, we focus on the current segment because of the clearest roll-like signatures. Rolls could be present elsewhere, but their structure is masked—or modified—by the presence of gravity waves generated in the shear layers above the PBL. Note that the large shear above the PBL (Figure 4) is consistent with gravity-wave generation. Furthermore, the spatial bora structure in the along-coast direction is complex with several processes interacting at different, although on occasions overlapping scales (e.g., Signell et al., 2010). These processes result in the typical bora jets and wakes and include gap flows, gravity waves, and nonlinear processes such as wave breaking, hydraulic jumps, and the resulting potential vorticity banners. As a result, there are several other peaks in the crosswind wavenumber spectra that may overlap with that of the rolls. This complexity also hinders the determination of relevant scales for calculation of turbulence fluxes, as discussed in Večenaj et al. (2012). The bora jets and wakes, while basically being cold-air outbreaks resulting in a thermodynamically generated convective ABL over the warmer sea, are also dynamically generated phenomena that carry the signatures of their upstream generation mechanisms, particularly gravity waves and the resultant downwind variation of ABL height. Sampling such flow at a single distance from the mountain range does not provide sufficient information for analyzing all the effects of the ABL height and its development on the occurrence of rolls. It is therefore difficult to generalize the current results without additional measurements or high-resolution numerical simulations.
Conflict of Interest Statement
The authors declare that the research was conducted in the absence of any commercial or financial relationships that could be construed as a potential conflict of interest.
Acknowledgments
We would like to thank the two reviewers for their comments and suggestions. This work has been partially supported by the Croatian Science Foundation, project CATURBO, No. 09/151. LeMone's work is supported by the National Center for Atmospheric Research, which is funded by the U. S. National Science Foundation.
References
Alpers, W., and Brummer, B. (1994). Atmospheric boundary-layer rolls observed by the synthetic aperture radar aboard the ERS-1 satellite. J. Geophys. Res. 99, 12613–12621. doi: 10.1029/94JC00421
Atlas, D., and Chou, S. H. (1983). The influence of coastal shape on winter air-sea interactions. Mon. Weather Rev. 111, 245–252.
Belušić, D., and Klaić, Z. B. (2006). Mesoscale dynamics, structure and predictability of a severe Adriatic bora case. Meteor. Z. 15, 157–168. doi: 10.1127/0941-2948/2006/0116
Belušić, D., Žagar, M., and Grisogono, B. (2007). Numerical simulation of pulsations in the bora wind. Q. J. R. Meteor. Soc. 133, 1371–1388. doi: 10.1002/qj.129
Bougeault, P., Binder, P., Buzzi, A., Dirks, R., Houze, R., Volkert, J., et al. (2001). The MAP special observing period. Bull. Am. Meteor. Soc. 82, 433–462. doi: 10.1175/1520-0477(2001)082<0433:TMSOP>2.3.CO;2
Brummer, B. (1999). Roll and cell convection in winter-time arctic cold-air outbreaks. J. Atmos. Sci. 56, 2613–2636.
Chen, W., Banner, M. L., Walsh, E. J., Jensen, J. B., and Lee, S. (2001). The Southern Ocean Waves Experiment. Part II: sea surface response to wind speed and wind stress variations. J. Phys. Oceanogr. 31, 174–198. doi: 10.1175/1520-0485(2001)031<0174:TSOWEP>2.0.CO;2
Etling, D., and Brown, R. A. (1993). Roll vortices in the planetary boundary layer: a review. Boundary Layer Meteor. 65, 215–248. doi: 10.1007/BF00705527
Gohm, A., Mayr, G. J., Fix, A., and Giez, A. (2008). On the onset of bora and the formation of rotors and jumps near a mountain gap. Q. J. R. Meteor. Soc. 134, 21–46. doi: 10.1002/qj.206
Grisogono, B., and Belušić, D. (2009). A review of recent advances in understanding the meso- and microscale properties of the severe Bora wind. Tellus 61A, 1–16. doi: 10.1111/j.1600-0870.2008.00369.x
Grossman, R. L. (1982). An analysis of vertical velocity spectra obtained in the BOMEX fair-weather, trade-wind boundary layer. Bound Layer Meteor. 23, 323–357. doi: 10.1007/BF00121120
Grubišić, V. (2004). Bora-driven potential vorticity banners over the Adriatic. Q. J. R. Meteor. Soc. 130, 2571–2603. doi: 10.1256/qj.03.71
Hein, P. F., and Brown, R. A. (1988). Observations of longitudinal roll vortices during artic cold air outbreaks over open water. Bound Layer Meteor. 45, 177–199. doi: 10.1007/BF00120822
Jiang, Q. F., and Doyle, J. D. (2005). Wave breaking induced surface wakes and jets observed during a bora event. Geophys. Res. Lett. 32:L17807. doi: 10.1029/2005GL022398
Kelly, R. D. (1982). A single Doppler-radar study of horizontal roll convection in a lake-effect snow storm. J. Atmos. Sci. 39, 1521–1531.
Kelly, R. D. (1984). Horizontal roll and boundary-layer interrelationships observed over Lake Michigan. J. Atmos. Sci. 41, 1816–1826.
Klaić, Z. B., Belušić, D., Grubišić, V., Gabela, L., and Ćoso, L. (2003). Mesoscale airflow structure over the northern Croatian coast during MAP IOP 15 – a major bora event. Geofizika 20, 23–61.
Konrad, T. J. (1970). The dynamics of the convective process in clear air as seen by radar. J. Atmos. Sci. 27, 1138–1147.
LeMone, M. A. (1973). The structure and dynamics of horizontal roll vortices in the planetary boundary layer. J. Atmos. Sci. 30, 1077–1091.
LeMone, M. A., and Pennell, W. T. (1976). The relationship of trade wind cumulus distribution to subcloud layer fluxes and structure. Mon. Weather Rev. 104, 524–539.
Mayor, S. D., Spalart, P. R., and Tripoli, G. J. (2002). Application of a perturbation recycling method in the large-eddy simulation of a mesoscale convective internal boundary layer. J. Atmos. Sci. 59, 2385–2395.
Melfi, S. H., Spinhirne, J. D., Chou, S.-H., and Palm, S. P. (1985). Lidar observations of vertically organized convection in the planetary boundary layer over the ocean. J. Climate Appl. Meteor. 24, 806–821.
Melfi, S. H., and Palm, S. P. (2012). Estimating the orientation and spacing of midlatitude linear convective boundary layer features: cloud streets. J. Atmos. Sci. 69, 352–364. doi: 10.1175/JAS-D-11-070.1
Miura, Y. (1986). Aspect ratios of longitudinal rolls and convection cells observed during cold air outbreaks. J. Atmos. Sci. 43, 26–39.
Müller, G., and Chlond, A. (1996). Three-dimensional numerical study of cell broadening during cold-air outbreaks. Boundary Layer Meteor. 81, 289–323. doi: 10.1007/BF02430333
Prtenjak, M. T., and Belušić, D. (2009). Formation of reversed lee flow over the north-eastern Adriatic during bora. Geofizika 26, 145–155.
Signell, R. P., Chiggiato, J., Horstmann, J., Doyle, J. D., Pullen, J., Askari, F., et al. (2010). High-resolution mapping of Bora winds in the northern Adriatic Sea using synthetic aperture radar. J. Geophys. Res. 115:C04020. doi: 10.1029/2009JC005524
Stiperski, I., Ivančan-Picek, B., Grubišić, V., and Bajć, A. (2012). Complex bora flow in the lee of Southern Velebit. Q. J. R. Meteor. Soc. 138, 1490–1506. doi: 10.1002/qj.1901
Večenaj, Ž., Belušić, D., Grubišić, V., and Grisogono, B. (2012). Along-coast features of bora-related turbulence. Boundary Layer Meteor. 143, 527–545. doi: 10.1007/s10546-012-9697-6
Walter, B., and Overland, J. E. (1984). Observations of longitudinal rolls in a near-neutral atmosphere. Mon. Weather Rev. 112, 200–208.
Weckwerth, T. M., Wilson, J. W., Wakimoto, R. M., and Crook, N. A. (1997). Horizontal convective rolls: determining the environmental conditions supporting their existence and characteristics. Mon. Weather Rev. 125, 505–526.
Keywords: downslope windstorm, convection, atmospheric boundary layer, cold-air outbreak, turbulence
Citation: Belušić D, Večenaj Ž and LeMone MA (2015) Possible observation of horizontal roll vortices over the Adriatic Sea during bora. Front. Earth Sci. 3:23. doi: 10.3389/feart.2015.00023
Received: 26 March 2015; Accepted: 15 May 2015;
Published: 28 May 2015.
Edited by:
Ivana Stiperski, University of Innsbruck, AustriaReviewed by:
Peter F. Sheridan, Met Office, UKGert-Jan Steeneveld, Wageningen University, Netherlands
Copyright © 2015 Belušić, Večenaj and LeMone. This is an open-access article distributed under the terms of the Creative Commons Attribution License (CC BY). The use, distribution or reproduction in other forums is permitted, provided the original author(s) or licensor are credited and that the original publication in this journal is cited, in accordance with accepted academic practice. No use, distribution or reproduction is permitted which does not comply with these terms.
*Correspondence: Danijel Belušić, School of Earth, Atmosphere and Environment, Monash University, 9 Rainforest Walk, Clayton Campus, VIC 3800, Melbourne, Australia,ZGFuaWplbC5iZWx1c2ljQG1vbmFzaC5lZHU=