Abstract
The Neoproterozoic (1000–542 mol.yr ago) witnessed the dawn of Earth as we know it with modern-style plate tectonics, high levels of O2 in atmosphere and oceans and a thriving fauna. Yet, the processes leading to the fully oxygenation of the external envelopes, its exact timing and its link with the inner workings of the planet remain poorly understood. In some ways, it is a “chicken and egg” question: did the Neoproterozoic Oxygenation Event (NOE) cause life blooming, low-latitudes glaciations, and perturbations in geochemical cycles or is it a consequence of these phenomena? Here, we suggest that the NOE may have been triggered by multi-million years oxic volcanic emissions along a protracted period at the end of the Neoproterozoic when continents were assembled in the Rodinia supercontinent. We report a very oxidized magma source at the upper mantle beneath a ring of subducting margins around Rodinia, and detail here the evidence at the margin of the Arabian shield. We investigate the 780 Ma Biotite and Pink granites and associated rocks of the Socotra Island with rock magnetic and petrographic methods. Magnetic susceptibility and isothermal remanent magnetization acquisitions show that, in these granites, both magnetite and hematite are present. Hematite subdivides magnetite grains into small grains. Magnetite and hematite are found to be primary, and formed at the early magmatic evolution of the granite at very high oxygen fugacity. Massive degassing of these oxidized magmas would reduce the sink for oxygen, and consequently contribute to its rise in the atmosphere with a net O2 flux of at least 2.25 × 10⁷ Tmol. Our conceptual model provides a deep Earth link to the NOE and implies the oxygenation burst has occurred earlier than previously envisaged, paving the way for later changes in the outer envelopes of the planet epitomized on the extreme Neoproterozoic glaciations and the appearance of the first animals.
Introduction
The Neoproterozoic Oxygenation Event (NOE) (Och and Shields-Zhou, 2012) (Figure 1A) marks a turning point in the early Earth's history after which atmospheric free oxygen has reached the Present Atmospheric Level (PAL) as indicated by several different geochemical proxies (e.g., Canfield et al., 2007; Och and Shields-Zhou, 2012; Sahoo et al., 2012; Reinhard et al., 2013; Lyons et al., 2014). But the mechanism leading to the full oxygenation of Earth's external envelopes, its exact timing (Baldwin et al., 2013) and its link with the inner workings of the planet remain poorly understood. In some ways, it is a “chicken and egg” problem: did the NOE cause life blooming (Och and Shields-Zhou, 2012), low-latitude glaciations and perturbations in geochemical cycles or is it a consequence of these phenomena (Lenton et al., 2014)? But what if the Neoproterozoic oxygen burst was in fact a supercontinent legacy? Some authors have evoked the possible role of changes in global geodynamics on the increase of the oxygen content in atmosphere and oceans (Kump et al., 2001; Gaillard et al., 2011 and see a review in Kasting, 2013) but the topic remains poorly explored.
Figure 1

(A) Evolution of Earth's atmospheric oxygen content between 3.5 Ga and present (from Lyons et al., 2014). PO2 is the atmospheric partial pressure of O2 and PAL is the present atmospheric level. The green and blue curves depict a two-step evolution of atmospheric evolution (Kump, 2008) and a recent model (Lyons et al., 2014), respectively. In yellow are the classical time windows for the GOE (Great Oxydation Event) and NOE (Neoproterozoic Oxydation Event). (B) Model of Cryogenian Oxygen cycle and subduction zones in the frame of Rodinia. Green zones highlight the suspected hot and oxidized magma zone (OxMZ) under subductions.
Special geodynamical conditions prevailed during most of the Neoproterozoic. By the time the continents were assembled for the first time into a supercontinent the size of Pangea (Hawkesworth et al., 2013). The Rodinia supercontinent (1000–720 Ma) was the most long-lived supercontinent in Earth's history (Ernst et al., 2013; Li et al., 2013) (Figure 2). It was surrounded by subduction zones (Li et al., 2013) whose relics are now sparsely dispersed around the world as fossil magmatic arcs and ophiolites. Subduction-related magmatism likely surpassed in volume the large magmatic activity of collision and dispersal of continental fragments, well-preserved in the zircon record for this time period (Hawkesworth et al., 2013), thus corresponding to a peak in volcanic degassing between 850 and 750 millions of years ago.
Figure 2

Rodinia paleogeography model around 780 Ma (adapted and modified from Li et al. 2013 and using Paleomac software, Cogne, 2003). In red is the extension of presumed subductions around the supercontinent. Green zones highlight the suspected hot and oxidized magma zone under subductions. Green dots represent indian (ind) and arabic (soc) highly oxidized rocks related to subductions. Craton/terrane names abbreviations: IND, India; A, Amazonia; Si, Siberia; SC, South China; NA, Northern Australia; EA, East Antarctica; L, Laurentia; K, Kalahari; R, Rio de Plata; C, Congo; B, Baltica; WA, West-Africa; NC, North China.
Here, we explore the role of subductions and associated volcanic degassing on the redox state of the upper mantle, atmosphere and oceans at Rodinian times by investigating rock magnetic properties of the 840–780 Ma old rocks of the Socotra Island.
A new model for the oxygenation of the neoproterozoic atmosphere?
Nowadays, and probably, since the Archean, the redox state of the mantle is considered to be around the Fayalite–Magnetite–Quartz (FMQ) buffer as exemplified by modern MORB's fO2-values (ΔFMQ +0.5) (Frost and McCammon, 2008). Deeper into the mantle, spinel peridotites display a larger range of fO2-values between ΔFMQ −2 and +2. Given the long lifetime of Rodinia, the insulation effect due to the presence of a supercontinent must have been important (Grigne and Labrosse, 2001), increasing the temperature of the mantle beneath the continent (Lenardic et al., 2011). Furthermore, when a supercontinent is surrounded by subduction margins, this heating effect is enhanced since subducting plates prevent lateral thermal mixing of the mantle as shown by numerical and analogical experiments (Lenardic et al., 2011). Another consequence of the global temperature increase below the supercontinent is a possible enhancement of the large-scale convection by the reduced viscosity of the mantle, while small-scale convection will be almost absent preventing efficient mixing (Samuel and King, 2014). This would result in a hot and poorly mixed mantle beneath Rodinia. For the subduction zones, this would mean an increase in the melting of the oxidized rocks of the slab, resulting in a large zone of oxidized magmas, possibly further enhanced by thick arcs (Chiaradia, 2014), around the edges of Rodinia.
A large reservoir of oxidized magma beneath the fringe of Rodinia probably resulted in large emissions of oxidized volcanic gases (Burgisser and Scaillet, 2007) into the ocean-atmosphere system with an impact on the balance between sources and sinks for the free oxygen in the atmosphere. Indeed, the oxidation of reduced volcanic gases is one of the major sinks for various atmospheric oxidants, notably oxygen (Kump et al., 2001; Catling and Claire, 2005; Kasting, 2013) (Figure 1B). Today, with a total emission of 1.5 Tmol.yr−1, the volcanic sink for O2 is estimated to consume around 25% of the O2 generated by photosynthesis and subsequent organic carbon burial (Kump et al., 2001).
Below we detail the petrographic and magnetic evidence for these Neoproterozoic highly oxidized magma in Socotra Island (Yemen).
Geological setting
In order to test for the oxidation state of magmas across subduction zones surrounding Rodinia, and investigate their eventual role on the rise of atmospheric oxygen, we studied the Neoproterozoic basement outcropping at the Socotra Island (Yemen) in the Arabic peninsula. The Socotra Island belongs to the southern rifted margin of the Gulf of Aden (Figure 3), extending the tip of Somalia to the ENE (Figure 3). The island is about 135 km from east to west and 45 km wide from north to south and lies about 250 km of Somalian coast (longitude: 53′19° and 54′33° E; latitude: 12′18° and 12′42° N). Most of the island is covered by Mesozoic to Cenozoic pre- to syn-rift sedimentary rock successions affected by tilted-block tectonics linked to the Gulf of Aden opening (Leroy et al., 2012; Ahmed et al., 2014). Three main basement outcrops can be observed in the island (Denéle et al., 2012) (Figure 3), which corresponds to three basement highs located at the head of tilted blocks. To the west the Qalansya and Sherubrub areas represents respectively, 65 and 50 km2 of basement outcrop and to the east the Mont-Haggier basement outcrop represents 580 km2.
Figure 3

Geological map of Socotra (modified from Denéle et al., 2012), locating the different samples accross the Neoproterozoic basement.
The basement of the Socotra Island displays a variety of plutonic, volcanic and metamorphic rocks formed in an active margin between 840 and 780 Ma (Denéle et al., 2012). A voluminous highly potassic calc-alkaline granitic magmatism, comprising the Biotite granite and the Pink Haggier granite plutons, were emplaced in an Andean-type arc setting at 790 Ma (Denéle et al., 2012). Slightly before, mafic to intermediate intrusions as vertical sheets, a kilometer-scale gabbro laccolith, mafic dike swarms and lavas with a depleted arc signature were emplaced in the upper crust of the arc. Together, this assemblage represents a long-lived subduction-associated magmatism spanning up to 50 Ma.
Methods
Neoproterozoic basement rocks of Socotra were sampled with a gasoline-powered drill during a field trip realized in 2009–2010. The Biotite and Pink granites and the Haggier layered gabbro were sampled in the Haggier Mount domain. The geological map of Socotra shows the location of the analyzed samples.
Forty-nine samples were selected for magnetic mineralogy studies, 25 from the Biotite granite and others from the Pink Haggier granite, the Layered Gabbros and from Mafic to Intermediate Plutonic Sheets. Eight thin sections were analyzed with scanning electron microscope (SEM) and reflected light microscopy (Nikon Eclipse LV100POL). SEM observations were performed with a JEOL instrument (JSM-6360LV) at the GET laboratory (Toulouse, France) operating at 20 kV with an Electron Dispersive System (EDS) that allows a punctual qualitative characterization of the chemical composition.
Magnetic measurements consisted of thermomagnetic curves, isothermal remanent magnetization (IRM) acquisition curves, hysteresis loops, and first-order reversal curves (FORC) diagrams. Temperature dependent magnetic susceptibility curves from room temperature up to 700°C were obtained with a KLY2-CS2 (AGICO) at the GET laboratory on 12 powdered samples. IRM acquisitions (Kruiver et al., 2001; Heslop et al., 2002), hysteresis loops and first-order reversal curves (FORC) diagrams (Roberts et al., 2000; Harrison and Feinberg, 2008) were made using a Princeton Measurements Corporation Vibrating Sample Magnetometer (VSM: Micromag Model 3900) at the IPGP laboratory. IRM acquisition curves were performed non-linearly (with 150 points) up to +1.5 T. IRM acquisition curves were analyzed using the excel spreadsheet of Kruiver et al. (2001) based on cumulative log Gaussian analysis (see also Heslop et al., 2002). The magnetic components are characterized by saturation isothermal remanent magnetization (SIRM), a parameter that is proportional to the content of the mineral in a sample, the peak field (B1/2) at which half of the SIRM is reached, and the dispersion (DP) of its corresponding cumulative log-normal distribution (Kruiver et al., 2001). Magnetic hysteresis loops were measured on small size rectangular samples (< 5 mm in length; max. field = 1.0 T). Hysteresis loops are corrected for the dia/paramagnetic effect and normalized by mass. There are four major parameters obtained: Ms, saturation magnetization; Mrs, saturation remanent magnetization; Hc, coercive force or coercivity; Hcr, remanent coercivity (which is determined by operating back-field DC demagnetization up to -1.0 T after IRM acquisitions had been imparted up to +1.0 T). FORC diagrams were realized to model magnetic mixtures and magnetostatic interactions. FORC diagrams were realized to better constrain mixtures and magnetostatic interactions. For each formation, 80–100 FORCs were measured with an averaging time of 100 ms and a waiting time before successive measurements of 1 s. FORC diagrams were processed using the FORCinel software (Harrison and Feinberg, 2008) with an average smoothing factor (SF) of four (see Roberts et al., 2000) after correction of the paramagnetic slope. Paleogeographic map was drawn with paleomac software (Cogne, 2003).
Results
Determination of magnetic mineralogy
Magnetite and hematite are the main magnetic minerals in the samples as revealed by temperature dependent magnetic susceptibility curves (Figure 4) (n = 12). However, the presence and relative contribution of hematite are difficult to define on these experiments (they are represented by a second slight susceptibility decay above 580°C) because magnetite has a much higher intrinsic magnetic susceptibility (Kletetschka et al., 2000).
Figure 4
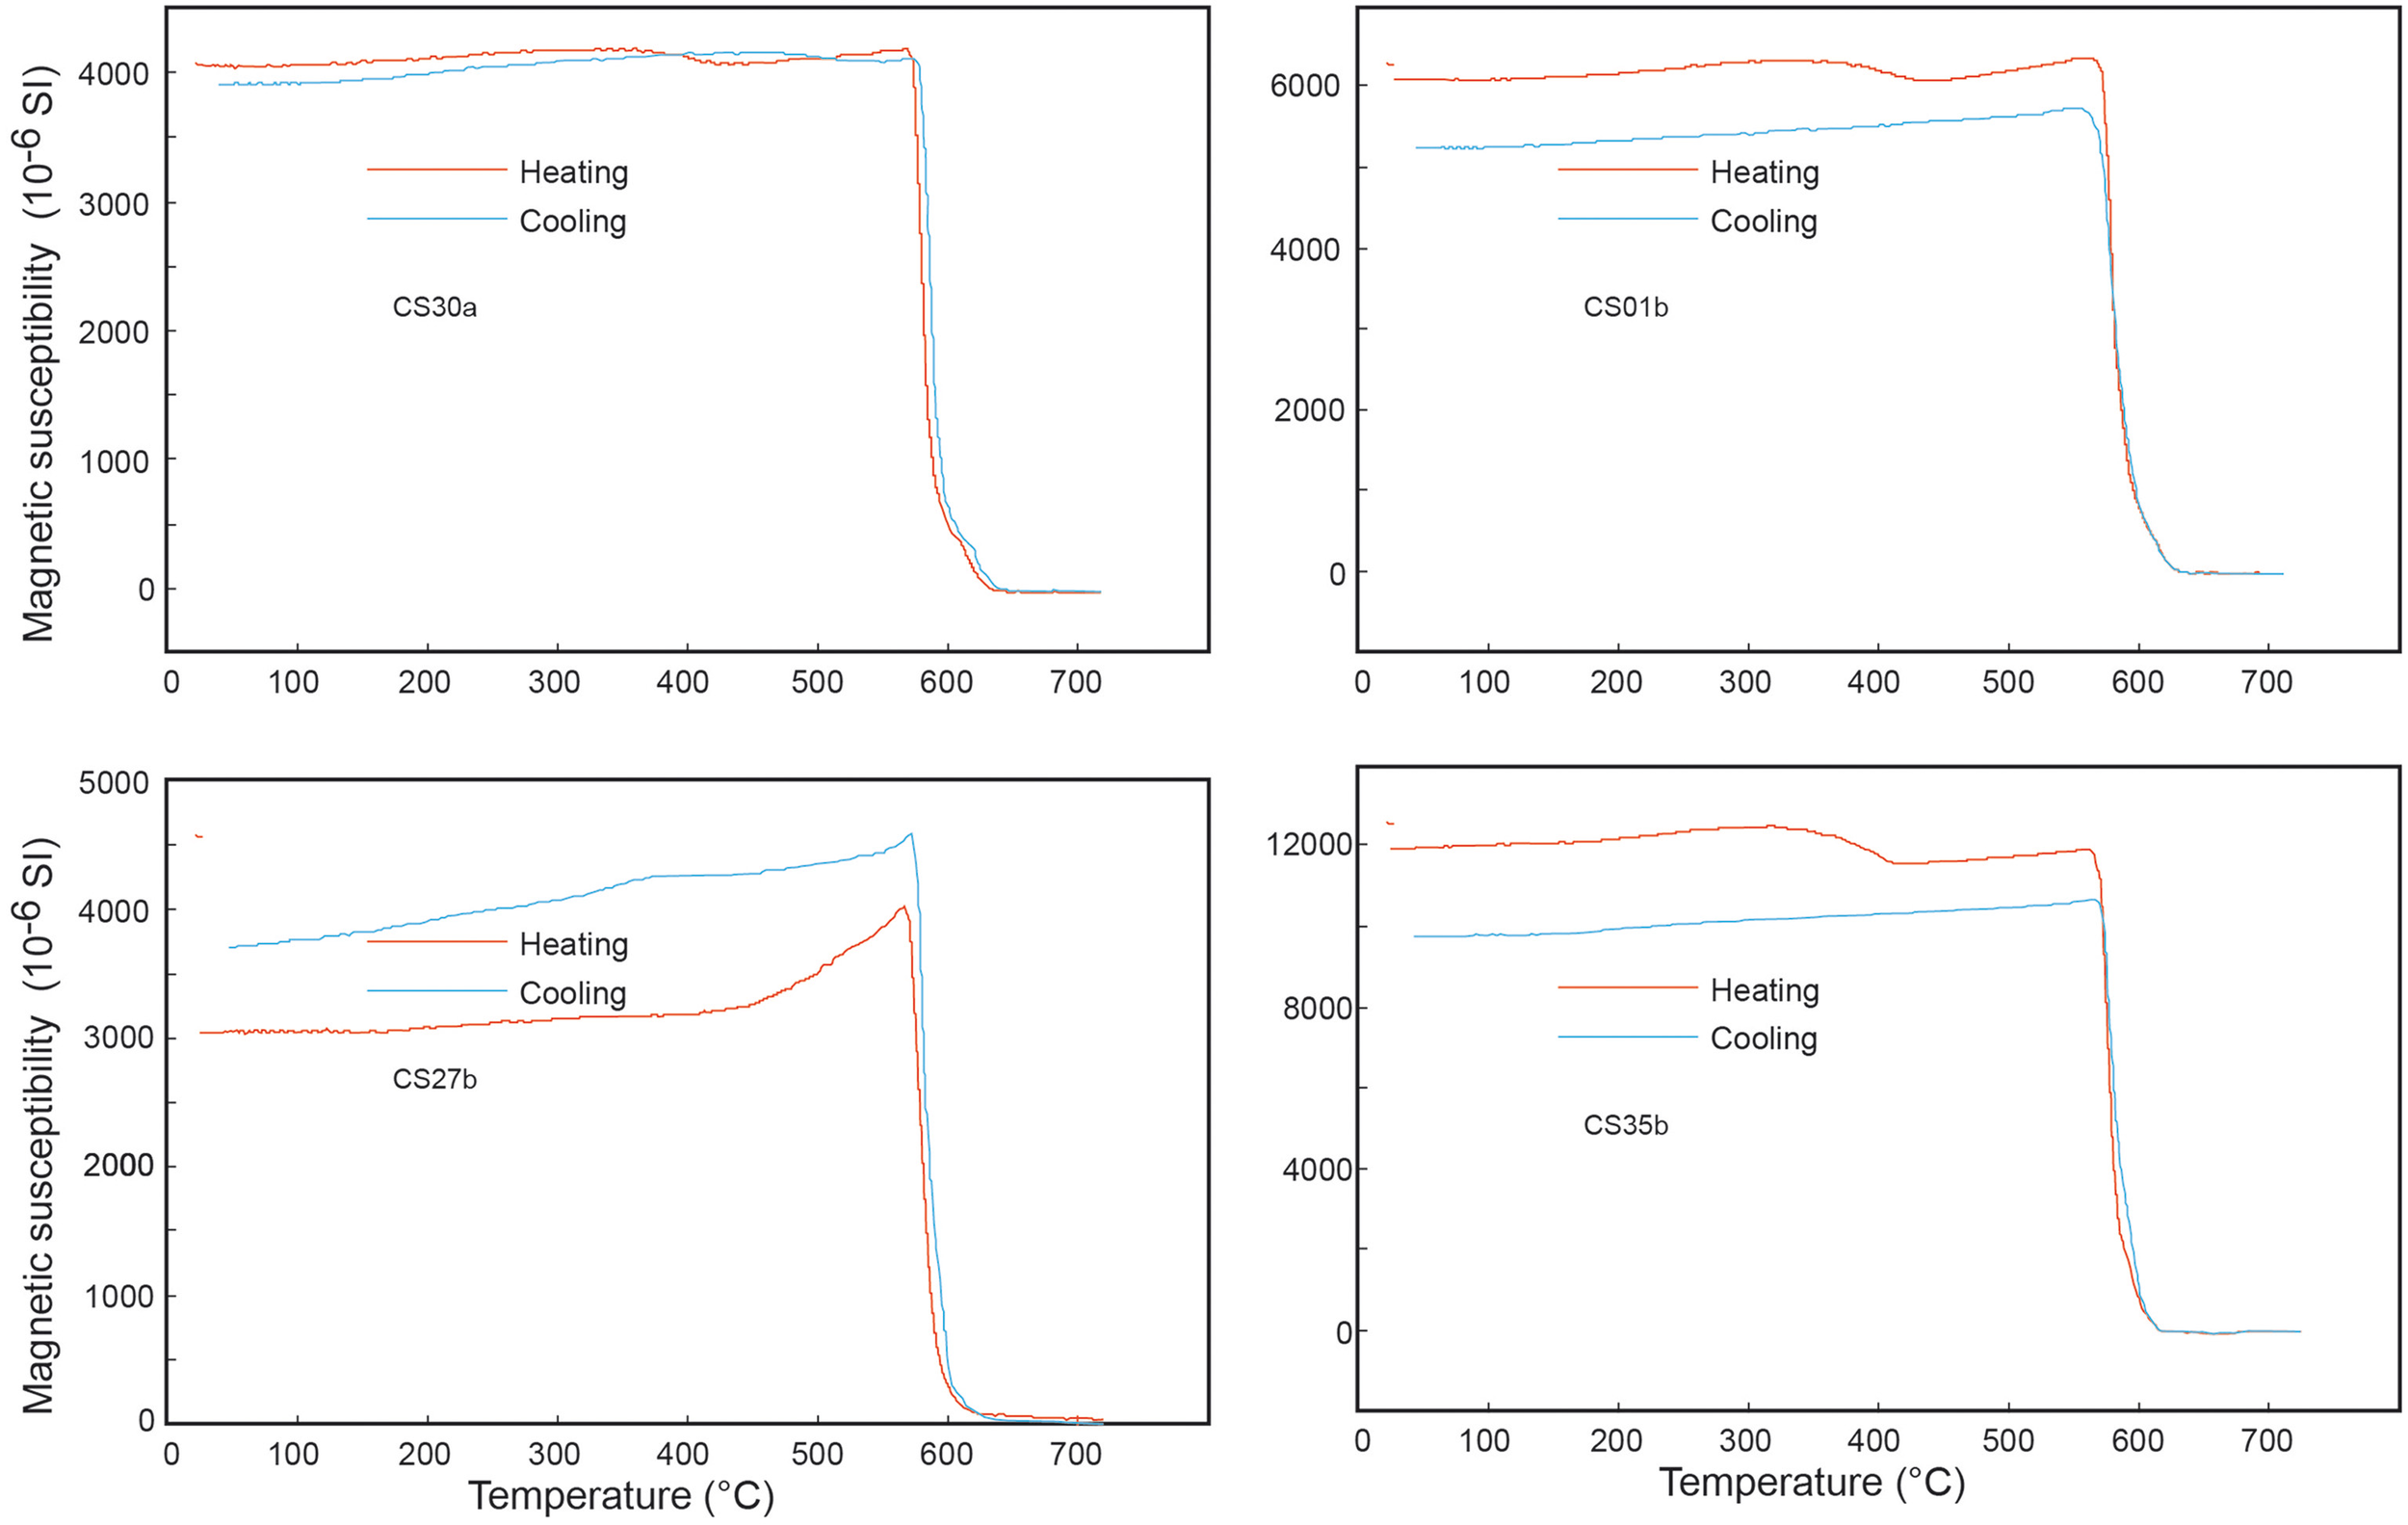
Variation of low-field magnetic susceptibility during a heating-cooling cycle (red and blue lines, respectively).
Magnetite also dominates the IRM acquisition curves (more than 80% of total magnetization) (Figure 5C). Magnetite can be divided into two populations, with variable proportions from one sample to another, identified by a statistical analysis (Kruiver et al., 2001). The more abundant magnetite population (called high coercivity magnetite component = CHMag) represents between 43 and 97% of the magnetization (Table S1 in Supplementary Material). This population is characterized by a medium coercivity (mean B1/2 = 63.2 mT) and a mean SIRM between 4.4 × 10⁻⁴ and 1.23 × 10⁻¹ A/m (mostly between 10−3 and 5 × 10⁻² A/m). The second magnetite-like population (medium coercivity magnetite component = CMMag) has a lower mean coercivity (mean B1/2 = 25.9 mT; Table S1 in Supplementary Material). It can represent up to 47% of the magnetization with SIRM varying between 7 × 10⁻⁴ and 5.3 × 10⁻² A/m.
Figure 5

Magnetic properties of the Biotite granite of Socotra. (A) Linear trend and PSD behavior on a Day-plot of Biotite granite samples. The diamonds, squares, and triangles, respectively correspond to the localization in Haggier Mont, Qalansya, and Sherebrub zones (see Figure 3) (B) IRM acquisition curves (linear and Gaussian cumulative treatment, respectively, showing magnetite dominance and hematite appearance with decreasing magnetic grain size. (C) FORC diagrams showing SD and PSD behavior disappearance to a MD-like behavior and increasing magnetic interactions with increasing magnetic grain size.
Hematite component (called high coercivity hematite = Chem) is represented by a higher coercivity, with a mean B1/2 = 490 mT (Table S1 in Supplementary Material). This component represents on average only 4% of the total magnetization, but it is not evenly distributed. In fact, hematite-like pattern corresponds to 1–2% of magnetization in the majority of samples, but for some samples, like CS6, it represents more than 20% of magnetization (Table S1 in Supplementary Material).
A low coercivity component (called low coercivity magnetite component = CLMag – mean B1/2 = 6.4 mT) represents 7% of the total magnetization on average (Table S1 in Supplementary Material). This component could be maghemite or coarse-grained magnetite.
Grain sizes and magnetic interactions
Hysteresis parameters (Table S2 in Supplementary Material) and their classical representation on a Day plot (where the ratio Mrs/Ms is plotted against the ratio Hcr/Hc) are used to determine magnetic grain size or to compare relative proportions of two or three populations (Carter-Stiglitz et al., 2001; Dunlop, 2002a,b; Heslop and Roberts, 2012). Here, we observed that magnetic parameters display a trend parallel to SD-MD mixing curves (Figure 5A), corresponding to a magnetic grain size ranging between 1 and 10 μm. Hysteresis loops (n = 27) are not distorted. We observed a thinning of loops with the branch that straightens up before saturation from high to lower Mrs/Ms ratio.
Inherent ambiguities in interpretation of the Day plot such as those induced by magnetostatic interactions (Muxworthy et al., 2003) and by mixtures could be deciphered using first-order reversal curve (FORC) diagrams (Pike et al., 1999; Carvallo et al., 2006). FORC diagrams (n = 14) (Figure 5B) obtained for the Biotite granite display the variability from PSD grain size to more MD grain size. They also clearly show the presence of two components for samples lying close to the SD region in the Day plot. An example is given by CS6 sample that presents a mixture between two components of relatively low to medium coercivity. The first component have a PSD-like pattern with a coercivity peak close to the vertical axis and the second component have a coercivity peak at about 20 mT, and it corresponds to a SD-like pattern with contours closing on the diagram. From the highest to the lower Mrs/Ms ratio, the SD-like component evolves from sample CS6 (coercivity peak = 20 mT) to sample CS45 (coercivity peak = 15 mT) and then disappear from sample CS46 (Figure 5). The PSD-like pattern tends to migrate to a MD-like pattern (from samples CS46 to CS31). We notice a negligible spreading parallel to the vertical axis of FORC diagram from sample CS5 to sample CS31 that indicates that no interactions occurred between magnetic grains. Moreover, in all FORC diagrams, we notice that coercivity peaks are slightly displaced above the horizontal axis that confirms the hypothesis of relative non-interactions between grains.
What is striking in the log–log Day Plot is the linear distribution of hysteresis parameters for both Biotite Granites and Vertical Plutonic Sheets formation. This trend is parallel to the SD-MD mixing curves as proposed by Dunlop (2002a) but has higher Hcr/Hc ratio. This strongly suggests a binary mixing solution between two magnetite populations that belongs to the SD domain for the small one and lies at the base of the PSD domain and near the MD domain for the larger one. Magnetostatic interactions can strongly affect the hysteresis parameters, shifting them toward the SD behavior for large grains (see Sprowl, 1990; Muxworthy et al., 2003) and therefore change the trend of a binary mixing solution. However, here we can discard this effect since few interactions are detected with the FORC measurements.
The trend on the Day plot (Figure 5A) can be interpreted in two ways: a mixing between two end-members (SD and MD grains) or a variability from PSD grains to more MD grains. We argue here that the hematite and ilmenite lamellae define subdivisions into magnetite grains, which result in smaller-domain magnetite (< 5 μm in average), explaining the PSD behavior observed. We discuss that the abundance and the increasing thickness of ilmenite–hematite lamellae result in tightening of the exsolution treillis. So, this treillis tightening is consistent with the decreasing of domain size in magnetic grains from a MD-behavior to a PSD-behavior.
Hematite was detected both by microscopic observations and by IRM analyses. The presence of hematite has an effect on hysteresis parameters. Indeed, hematite, even in quite large grain sizes, has Mrs/Ms-values of 0.5–0.6 and Hcr/Hc-values of 1.5–2 that mimic those of SD magnetite (Dunlop, 1971; Dankers, 1977). This corresponds to values of granitic samples with higher Mrs/Ms. Nevertheless, hematite is known to display “square” hysteresis curves (Tauxe et al., 1996; Brownlee et al., 2011). This type of shape and its influence on hysteresis curves, are not detected in our results. As well, no shapes characteristic of mixtures like potbellied or wasp-waisted curves are identified in our samples. The occurrence of hematite in magnetic parameters (hysteresis curves and FORC diagram in particular) is observable only from 88% of hematite (Carvallo et al., 2006) recorded in the total magnetization in magnetic mixtures with magnetite. However, according to microscopic observations, content of hematite in the Socotra samples never reach more than about 20% of the samples. Thus, there is no surprise that the presence of hematite is not detectable with these methods in the Socotra samples. Nevertheless, comparison between the IRM data and the Day-plot help to demonstrate that the increase in hematite proportion in the total magnetization is associated with decreasing magnetic grain size of samples. In addition, it also applies to the lamellae of ilmenite. According to our microscopic observations, ilmenite having a paramagnetic behavior, their thickness and their number increases in concert with the decrease of magnetite grain size.
SEM-light reflected microscopy
To establish the relationship between magnetic oxide populations and their relation to magnetic parameters of the Biotite granite, we performed microscopic observations on eight thin sections (Figures 6, 7). Magnetic oxides present in the Biotite granite of Socotra were found to be associated with two mineral assemblages: (1) ferromagnesian minerals (biotite and amphibole) that represent the most common association and (2) feldspars (perthite and zoned plagioclase). Both associations are marked by magnetite with both ilmenite and hematite exsolutions representing the Fe–Ti oxides (sometimes with some amount of Mn) that dominate the Biotite granite oxide mineralogy.
Figure 6

Photomicrographs under reflected light microscopy of subhedral crystals of magnetite (Mt) with hematite (He) and ilmenite (Il) from the Neoproterozoic terrains of Socotra (Oman).
Figure 7

Photomicrographs of magnetite. (A) Photomicrographs of subhedral crystals of magnetite (black minerals) trapped in a poikiloblast crystal of biotite (brown mineral) from the Neoproterozoic terrains of Socotra (Oman). (B) Recognition of treillis-like shaped hematite within the crystal of magnetite under reflected light microscopy. (C) Back-scattered electron imaging on the internal structure of oxide, using a scanning electron microscope (SEM), reveals multiple grains of magnetite-hematite separated by elongated crystals of ilmenite. (D) Oriented needles or patches of ilmenite outline the contact with biotite. (E,F) Interpreted chronology of magmatic events depicted from microscopic and SEM observations: (1) treillis-like shaped hematite developed early along cleavage planes of magnetite, due to magmatic oxy-exsolution processes; (2) magnetite was further fractured and divided into several grains; (3) Cracks were subsequently filled with ilmenite growing in equilibrium with the large magmatic biotite.
Magnetites with exsolutions associated with ferromagnesian minerals are subhedral to anhedral crystals of large size (>100 μm). They are disseminated into biotite and amphibole zones either in isolated grains or in the form of grain clusters or in the form of large zone of oxides in close association to the ferromagnesian minerals. Magnetites associated to feldspars are finer (mean size about 30 μm). Their crystal's shapes range from euhedral to subhedral and seldom anhedral. They are disseminated into zonated plagioclase and perthites. Individual ilmenite grains with variable Mn content, mainly associated with feldspar grains, can be found in few samples.
Microtextures of Fe–Ti oxide minerals in Biotite granite were observed closely with SEM and light-reflected microscopy. According to Buddington and Lindsley (1964) and Haggerty (1991), degrees of oxidation and diffusion result in series of exsolutions in titanomagnetite varying in morphology, size and in abundance. Using their terminology, ilmenite–hematite intergrowths occur as Treillis, Sandwich and Composite types exsolution lamellae in the host Ti-poor magnetite from the Biotite granite. Following this classification, oxide grains observed in Biotite granite samples can be classified between C2 stage and C4 stage of oxidation. It should be noted that C1 stage, which corresponds to homogeneous Ti-rich magnetite has not been identified in our samples of the Biotite granite. The oxidation index of all samples always reaches the C4 stage, which corresponds to the beginning of titanomagnetite-ilmenite intergrowths oxidation. It is superimposed most often into C2 and C3 stages previously formed. This stage results in formation of hematite in Ti-poor magnetite host and normally in formation of rutile in ilmenite lamellae. Textural forms of hematite are characterized by Trellis types (lamellae between < 1 and 2 μm) and by internal or external Composites types (Haggerty, 1991). Rutile lenses and indistinct mottling in ilmenite lamellae (Haggerty, 1991) were not observed in the Biotite granite. These elements denote the very high oxidation state of the Biotite granite.
Discussion
Coexistence of magnetite and hematite
The crystallization of magnetic minerals (iron oxides and sulfides) is strongly dependent on the oxygen fugacity of the host magma (Haggerty, 1991). Moderate to high oxidation states correspond to the Fayalite–Magnetite–Quartz (FMQ) buffer of the present-day mantle. A very high oxidation state would correspond to the Magnetite-Hematite (MH) buffer, and would imply the synchronous crystallization of these two iron oxides. But the coexistence of primary hematite and magnetite in magmatic rocks is rare; extremely oxidized magmatic rocks being only found in some Phanerozoic copper porphyries–granitoids (Sun et al., 2013; Zhang et al., 2013). In Socotra, magnetite and hematite coexist, and are intertwined in trellis, sandwich, and composite textures (Figures 6, 7). In this configuration, hematite divides the large oxide grains (>10 μm) into smaller ones producing a pseudo-single domain (PSD) behavior for magnetite (Figure 5). Hematite and magnetite were formed at the beginning of magma crystallization and ilmenite appeared after all of them, occurring as inclusions in magmatic biotite (Figure 7). Both petrographic and magnetic parameters indicate that hematite is primary, and formed at the early magmatic evolution of the granite at very high oxygen fugacity and does not result from hydrothermalism or subsequent alteration.
Implications for the NOE
The intergrowth of hematite and magnetite observed in the Socotra granites indicates a very high oxygen fugacity (fO2) for the magmas at this margin of Rodinia, around the MH buffer (ΔFMQ between +4 and +5). Rocks in subduction settings are known to be oxidized (Parkinson and Arculus, 1999; Evans et al., 2012), with fO2-values of most subduction-related igneous rocks at ΔFMQ +2. The mechanisms invoked to explain their high oxidation are H2O incorporation from the subducting plate and subduction of oxidized materials like carbonates, aseismic ridges (Sun et al., 2013) among others. Yet, these values remain well below the values found for Socotra Island granites. Interestingly, even if the database remains up to now too sparse and more detailed investigations on the fO2 for other Neoproterozoic magmatic rocks are needed, other examples of highly oxidized igneous rocks of similar age have been reported for the Eastern Desert of Egypt (Ahmed, 2013; Khedr and Arai, 2013), and the Indian craton granites of Malani suites (Ashwal et al., 2013), all of them emplaced across the margin of Rodinia (Figure 2). Another occurrence may be suspected in South China (Liu et al., 2012; Zhang et al., 2013). The high apparent fO2 at the Arabian–Nubian shield in Egypt and Socotra, NW Indian, and perhaps in South China, imply a significant reservoir of oxidized magma in the upper mantle between at least between 800 and 750 Ma on the magmatic arcs at the western hinge of Rodinia.
Now we can estimate the impact of volcanic oxidized gases from Rodinian magmatic arcs on the atmospheric composition. In steady state, the O2 budget can be described following Catling and Claire (2005) and Claire et al. (2006) (Equation 1): where source fluxes correspond, respectively, to the escape of hydrogen to the space (Fe) and the total O2 released from organic matter and pyrite burial (Fb). The sink fluxes are the O2 consumed by reaction with reduced volcanic gases (Fv), reduced metamorphic gases (Fm), and reduced material on the continents Fw (Catling and Claire, 2005). Following Claire et al. (2006), we consider Fv and Fm to be around 1.5 Tmol.yr−1 of equivalent O2 consumption each. In this way, a first estimation on the impact of oxidized to very oxidized emissions to Fv can be provided. For that, we used the estimation given by Gerlach (2011) where the proportion of emitted gases (CO2) from arc volcanoes nowadays is at 30–34% of the total amount of gases on Earth. Using the conservative estimate of 30%, that would represent 0.45 Tmol.yr−1 of the 1.5 Tmol.yr−1 emitted by volcanic fluxes and considering a minimum time of 50 Ma for the duration of oxidized emissions in subduction zones, this would correspond to a net flux of O2 of at least 2.25 × 10⁷ Tmol.
The rough estimation obtained above corresponds to oxygen concentrations of at around 0.5 PAL (Lasaga and Ohmoto, 2002). Such a burst of oxygen, due to a decrease in one of the most important sinks of O2 during the lifetime of Rodinia (of at least 50 mol.yr) would be large enough to increase significantly the oxygen content of the atmosphere (Laakso and Schrag, 2014). Our findings have two additional implications. First, they imply that the NOE may have started earlier than generally thought (Sahoo et al., 2012), and before the Neoproterozoic low-latitude glaciations, in line with most recent findings (Sahoo et al., 2012; Baldwin et al., 2013; Ader et al., 2014). Second, by starting atmospheric oxygenation earlier (Figure 1A), our conceptual model also provides an explanation for the Neoproterozoic glaciations themselves. If the NOE occurred prior to the first glaciation, it would have likely resulted from the oxidation of a methane-rich atmosphere (Pavlov et al., 2003) as previously evocated by Claire et al. (2006). In this case, the drop in methane and ethane (which are both greenhouse gases) would have caused the drop in surface temperature promoting the onset of severe glacial episodes at the end of the Proterozoic.
Conflict of interest statement
The authors declare that the research was conducted in the absence of any commercial or financial relationships that could be construed as a potential conflict of interest.
Statements
Acknowledgments
The study is supported by the Syster and Marges programs of the INSU-CNRS and by the OMP-AO1 program. MM benefited from three months of invitation to stay at IAG, Brazil supported by grant 2013/08862-1, São Paulo Research Foundation (FAPESP).
Conflict of interest
The authors declare that the research was conducted in the absence of any commercial or financial relationships that could be construed as a potential conflict of interest.
Supplementary material
The Supplementary Material for this article can be found online at: http://journal.frontiersin.org/article/10.3389/feart.2015.00044
Table S1Isothermal remanent magnetization (IRM) acquisition data showing the repartition of magnetic components for each rock formation of Socotra.
Table S2Hysteresis parameters, susceptibility and remanent magnetization of each selected rocks of Socotra basement. Hcr is the coercivity of remanence, Hc the coercive force, Mr the saturation remanence, and Ms the saturation magnetization.
References
1
AderM.SansjofreP.HalversonG. P.BusignyV.TrindadeR. I. F.KunzmannM.et al. (2014). Ocean redox structure across the late Neoproterozoic oxygenation event: a nitrogen isotope perspective. Earth Planet. Sci. Lett.396, 1–13. 10.1016/j.epsl.2014.03.042
2
AhmedA. H. (2013). Highly depleted harzburgite-dunite-chromitite complexes from the Neoproterozoic ophiolite, south Eastern Desert, Egypt: a possible recycled upper mantle lithosphere. Precambrian Res.233, 173–192. 10.1016/j.precamres.2013.05.001
3
AhmedA. S.LeroyD.KeirF.KorostelevK.KhanbariF. Obrebskiet al. (2014). Crustal structure of the Gulf of Aden southern margin: evidence from receiver functions on Socotra Island (Yemen). Tectonophysics637, 251–267. 10.1016/j.tecto.2014.10.014
4
AshwalL. D.SolankiA. M.PanditM. K.CorfuF.HendriksB. W. H.BurkeK.et al. (2013). Geochronology and geochemistry of Neoproterozoic Mt. Abu granitoids, NW India: regional correlation and implications for Rodinia paleogeography. Precambrian Res.236, 265–281. 10.1016/j.precamres.2013.07.018
5
BaldwinG. J.NaglerT. F.GreberN. D.TurnerE. C.KamberB. S. (2013). Mo isotopic composition of the mid-Neoproterozoic ocean: an iron formation perspective. Precambrian Res.230, 168–178. 10.1016/j.precamres.2013.02.011
6
BrownleeS. J.FeinbergJ. M.KasamaT.HarrisonR. J.ScottG. R.RenneP. R. (2011). Magnetic properties of ilmenite-hematite single crystals from the Ecstall pluton near Prince Rupert, British Columbia. Geochem. Geophys. Geosyst.12. 10.1029/2011GC003622
7
BuddingtonA. F.LindsleyD. H. (1964). Iron-titanium oxide minerals and synthetic equivalents. J. Petrol.5, 310–357. 10.1093/petrology/5.2.310
8
BurgisserA.ScailletB. (2007). Redox evolution of a degassing magma rising to the surface. Nature445, 194–197. 10.1038/nature05509
9
CanfieldD. E.PoultonS. W.NarbonneG. M. (2007). Late-Neoproterozoic deep-ocean oxygenation and the rise of animal life. Science315, 92–95. 10.1126/science.1135013
10
Carter-StiglitzB.MoskowitzB.JacksonM. (2001). Unmixing magnetic assemblages and the magnetic behavior of bimodal mixtures. J. Geophys. Res. Solid Earth106, 26397–26411. 10.1029/2001JB000417
11
CarvalloC.RobertsA. P.LeonhardtR.LajC.KisselC.PerrinM.et al. (2006). Increasing the efficiency of paleointensity analyses by selection of samples using first-order reversal curve diagrams. J. Geophys. Res. Solid Earth111. 10.1029/2005JB004126
12
CatlingD. C.ClaireM. W. (2005). How Earth's atmosphere evolved to an oxic state: a status report. Earth Planet. Sci. Lett.237, 1–20. 10.1016/j.epsl.2005.06.013
13
ChiaradiaM. (2014). Copper enrichment in arc magmas controlled by overriding plate thickness. Nat. Geosci.7, 43–46. 10.1038/ngeo2028
14
ClaireM. W.CatlingD. C.ZahnleK. J. (2006). Biogeochemical modelling of the rise in atmospheric oxygen. Geobiology4, 239–269. 10.1111/j.1472-4669.2006.00084.x
15
CogneJ. P. (2003). PaleoMac: a Macintosh (TM) application for treating paleomagnetic data and making plate reconstructions. Geochem. Geophys. Geosyst.4. 10.1029/2001GC000227
16
DankersP. (1977). Grain-size dependence of some magnetic parameters for different magnetites and hematites. Trans. Am. Geophys. Union58, 897–897.
17
DenéleY.LeroyS.PelleterE.PikR.TalbotJ. Y.KhanbariK. (2012). The Cryogenian arc formation and successive high-K calc-alkaline plutons of Socotra Island (Yemen). Arabian J. Geosci.5, 903–924. 10.1007/s12517-011-0476-3
18
DunlopD. J. (1971). Magnetic properties of fine-particle hematite. Ann. Geophys.27, 269–293.
19
DunlopD. J. (2002a). Theory and application of the Day plot (Mrs/Ms versus Hcr/Hc) 1. theoretical curves and tests using titanomagnetite data. J. Geophys. Res. Solid Earth 107, EPM 4-1. 10.1029/2001JB000486
20
DunlopD. J. (2002b). Theory and application of the Day plot (M-rs/M-s versus H-cr/H-c) 2. Application to data for rocks, sediments, and soils. J. Geophys. Res. Solid Earth107, 15. 10.1029/2001JB000487
21
ErnstR. E.BleekerW.SoderlundU.KerrA. C. (2013). Large igneous provinces and supercontinents: toward completing the plate tectonic revolution. Lithos174, 1–14. 10.1016/j.lithos.2013.02.017
22
EvansK. A.ElburgM. A.KamenetskyV. S. (2012). Oxidation state of subarc mantle. Geology40, 783–786. 10.1130/G33037.1
23
FrostD. J.McCammonC. A. (2008). The redox state of Earth's mantle. Annu. Rev. Earth Planet. Sci.36, 389–420. 10.1146/annurev.earth.36.031207.124322
24
GaillardF.ScailletB.ArndtN. T. (2011). Atmospheric oxygenation caused by a change in volcanic degassing pressure. Nature478, 229–232. 10.1038/nature10460
25
GerlachT. (2011). Volcanic versus anthropogenic carbon dioxide. Eos Trans. AGU92, 201. 10.1029/2011EO240001
26
GrigneC.LabrosseS. (2001). Effects of continents on Earth cooling: thermal blanketing and depletion in radioactive elements. Geophys. Res. Lett.28, 2707–2710. 10.1029/2000GL012475
27
HaggertyS. E. (1991). Oxide textures-A mini-atlas, in Oxide Minerals: Petrologic and Magnetic Significance, Vol. 25, ed LindsleyD. H. (Washington: Mineralogical Society of America Reviews in Mineralogy), 129–219.
28
HarrisonR. J.FeinbergJ. M. (2008). FORCinel: an improved algorithm for calculating first-order reversal curve distributions using locally weighted regression smoothing. Geochem. Geophys. Geosyst.9:Q05016. 10.1029/2008GC001987
29
HawkesworthC.CawoodP.DhuimeB. (2013). Continental growth and the crustal record. Tectonophysics609, 651–660. 10.1016/j.tecto.2013.08.013
30
HeslopD.DekkersM. J.KruiverP. P.Van OorschotI. H. M. (2002). Analysis of isothermal remanent magnetization acquisition curves using the expectation-maximization algorithm. Geophys. J. Int.148, 58–64. 10.1046/j.0956-540x.2001.01558.x
31
HeslopD.RobertsA. P. (2012). A method for unmixing magnetic hysteresis loops. J. Geophys. Res. Solid Earth117:B03103. 10.1029/2011JB008859
32
KastingJ. F. (2013). What caused the rise of atmospheric O-2?Chem. Geol.362, 13–25. 10.1016/j.chemgeo.2013.05.039
33
KhedrM. Z.AraiS. (2013). Origin of Neoproterozoic ophiolitic peridotites in south Eastern Desert, Egypt, constrained from primary mantle mineral chemistry. Mineral. Petrol.107, 807–828. 10.1007/s00710-012-0213-y
34
KletetschkaG.WasilewskiP. J.TaylorP. T. (2000). Hematite vs. magnetite as the signature for planetary magnetic anomalies?Phys. Earth Planet. Inter.119, 259–267. 10.1016/S0031-9201(00)00141-2
35
KruiverP. P.DekkersM. J.HeslopD. (2001). Quantification of magnetic coercivity components by the analysis of acquisition curves of isothermal remanent magnetisation. Earth Planet. Sci. Lett.189, 269–276. 10.1016/S0012-821X(01)00367-3
36
KumpL. R.KastingJ. F.BarleyM. E. (2001). Rise of atmospheric oxygen and the “upside-down” Archean mantle. Geochem. Geophys. Geosyst.2, 1525–2027. 10.1029/2000GC000114
37
KumpL. R. (2008). The rise of atmospheric oxygen. Nature451, 277–278. 10.1038/nature06587
38
LaaksoT. A.SchragD. P. (2014). Regulation of atmospheric oxygen during the Proterozoic. Earth Planet. Sci. Lett.388, 81–91. 10.1016/j.epsl.2013.11.049
39
LasagaA. C.OhmotoH. (2002). The oxygen geochemical cycle: dynamics and stability. Geochim. Cosmochim. Acta66, 361–381. 10.1016/S0016-7037(01)00685-8
40
LenardicA.MoresiL.JellinekA. M.O'neillC. J.CooperC. M.LeeC. T. (2011). Continents, supercontinents, mantle thermal mixing, and mantle thermal isolation: theory, numerical simulations, and laboratory experiments. Geochem. Geophys. Geosyst.12:Q10016. 10.1029/2011GC003663
41
LentonT. M.BoyleR. A.PoultonS. W.Shields-ZhouG. A.ButterfieldN. J. (2014). Co-evolution of eukaryotes and ocean oxygenation in the Neoproterozoic era. Nat. Geosci.7, 257–265. 10.1038/ngeo2108
42
LeroyS.RazinP.AutinJ.BacheF.D'acremontE.WatremezL.et al. (2012). From rifting to oceanic spreading in the Gulf of Aden: a synthesis. Arabian J. Geosci.5, 859–901. 10.1007/s12517-011-0475-4
43
LiZ. X.EvansD. A. D.HalversonG. P. (2013). Neoproterozoic glaciations in a revised global palaeogeography from the breakup of Rodinia to the assembly of Gondwanaland. Sediment. Geol.294, 219–232. 10.1016/j.sedgeo.2013.05.016
44
LiuX.FanH. R.SantoshM.HuF. F.YangK. F.LiQ. L.et al. (2012). Remelting of Neoproterozoic relict volcanic arcs in the Middle Jurassic: implication for the formation of the Dexing porphyry copper deposit, Southeastern China. Lithos150, 85–100. 10.1016/j.lithos.2012.05.018
45
LyonsT. W.ReinhardC. T.PlanavskyN. J. (2014). The rise of oxygen in Earth's early ocean and atmosphere. Nature506, 307–315. 10.1038/nature13068
46
MuxworthyA.WilliamsW.VirdeeD. (2003). Effect of magnetostatic interactions on the hysteresis parameters of single-domain and pseudo-single-domain grains. J. Geophys. Res. Solid Earth108. 10.1029/2003JB002588
47
OchL. M.Shields-ZhouG. A. (2012). The Neoproterozoic oxygenation event: environmental perturbations and biogeochemical cycling. Earth Sci. Rev.110, 26–57. 10.1016/j.earscirev.2011.09.004
48
ParkinsonI. J.ArculusR. J. (1999). The redox state of subduction zones: insights from arc-peridotites. Chem. Geol.160, 409–423. 10.1016/S0009-2541(99)00110-2
49
PavlovA. A.HurtgenM. T.KastingJ. F.ArthurM. A. (2003). Methane-rich Proterozoic atmosphere?Geology31, 87–90. 10.1130/0091-7613(2003)031<0087:MRPA>2.0.CO;2
50
PikeC. R.RobertsA. P.VerosubK. L. (1999). Characterizing interactions in fine magnetic particle systems using first order reversal curves. J. Appl. Phys.85, 6660–6667. 10.1063/1.370176
51
ReinhardC. T.PlanavskyN. J.RobbinsL. J.PartinC. A.GillB. C.LalondeS. V.et al. (2013). Proterozoic ocean redox and biogeochemical stasis. Proc. Natl. Acad. Sci. U.S.A.110, 5357–5362. 10.1073/pnas.1208622110
52
RobertsA. P.PikeC. R.VerosubK. L. (2000). First-order reversal curve diagrams: a new tool for characterizing the magnetic properties of natural samples. J. Geophys. Res. Solid Earth105, 28461–28475. 10.1029/2000JB900326
53
SahooS. K.PlanavskyN. J.KendallB.WangX. Q.ShiX. Y.ScottC.et al. (2012). Ocean oxygenation in the wake of the Marinoan glaciation. Nature489, 546–549. 10.1038/nature11445
54
SamuelH.KingS. D. (2014). Mixing at mid-ocean ridges controlled by small-scale convection and plate motion. Nat. Geosci. 7, 602–605. 10.1038/ngeo2208
55
SprowlD. R. (1990). Numerical estimation of interactive effects in single-domain magnetite. Geophys. Res. Lett.17, 2009–2012. 10.1029/GL017i011p02009
56
SunW. D.LiangH. Y.LingM. X.ZhanM. Z.DingX.ZhangH.et al. (2013). The link between reduced porphyry copper deposits and oxidized magmas. Geochim. Cosmochim. Acta103, 263–275. 10.1016/j.gca.2012.10.054
57
TauxeL.MullenderT. A. T.PickT. (1996). Potbellies, wasp-waists, and superparamagnetism in magnetic hysteresis. J. Geophys. Res. Solid Earth101, 571–583. 10.1029/95JB03041
58
ZhangH.LingM. X.LiuY. L.TuX. L.WangF. Y.LiC. Y.et al. (2013). High oxygen fugacity and slab melting linked to cu mineralization: evidence from dexing porphyry copper deposits, Southeastern China. J. Geol.121, 289–305. 10.1086/669975
Summary
Keywords
rock magnetism, Neoproterozoic oxygenation event, hematite-magnetite buffer, Rodinia, Socotra
Citation
Macouin M, Roques D, Rousse S, Ganne J, Denèle Y and Trindade RIF (2015) Is the Neoproterozoic oxygen burst a supercontinent legacy?. Front. Earth Sci. 3:44. doi: 10.3389/feart.2015.00044
Received
27 January 2015
Accepted
24 July 2015
Published
01 September 2015
Volume
3 - 2015
Edited by
Eric Font, University of Lisbon, Portugal
Reviewed by
Alexandra Abrajevitch, Institute of Tectonics and Geophysics, Russia; Qingsong Liu, Chinese Academy of Sciences, China
Updates
Copyright
© 2015 Macouin, Roques, Rousse, Ganne, Denèle and Trindade.
This is an open-access article distributed under the terms of the Creative Commons Attribution License (CC BY). The use, distribution or reproduction in other forums is permitted, provided the original author(s) or licensor are credited and that the original publication in this journal is cited, in accordance with accepted academic practice. No use, distribution or reproduction is permitted which does not comply with these terms.
*Correspondence: Melina Macouin, Géosciences Environnement Toulouse, Centre National de Recherche Scientifique, UMR 5563, Université de Toulouse, 14 avenue E. Belin 31400 Toulouse, France melina.macouin@get.obs-mip.fr
This article was submitted to Geomagnetism and Paleomagnetism, a section of the journal Frontiers in Earth Science
Disclaimer
All claims expressed in this article are solely those of the authors and do not necessarily represent those of their affiliated organizations, or those of the publisher, the editors and the reviewers. Any product that may be evaluated in this article or claim that may be made by its manufacturer is not guaranteed or endorsed by the publisher.