 Christopher C. Sampson
 Andrew M. Smith
 Paul D. Bates
 Jeffrey C. Neal
- School of Geographical Sciences, University of Bristol, Bristol, UK
Global flood hazard models have recently become a reality thanks to the release of open access global digital elevation models, the development of simplified and highly efficient flow algorithms, and the steady increase in computational power. In this commentary we argue that although the availability of open access global terrain data has been critical in enabling the development of such models, the relatively poor resolution and precision of these data now limit significantly our ability to estimate flood inundation and risk for the majority of the planet's surface. The difficulty of deriving an accurate “bare-earth” terrain model due to the interaction of vegetation and urban structures with the satellite-based remote sensors means that global terrain data are often poorest in the areas where people, property (and thus vulnerability) are most concentrated. Furthermore, the current generation of open access global terrain models are over a decade old and many large floodplains, particularly those in developing countries, have undergone significant change in this time. There is therefore a pressing need for a new generation of high resolution and high vertical precision open access global digital elevation models to allow significantly improved global flood hazard models to be developed.
Around the turn of the millennium, high quality two dimensional hydraulic models capable of simulating the dynamics of flood inundation became a reality at the reach scale as a result of faster computers, improved algorithms (Bates and De Roo, 2000; Bradford and Sanders, 2002; Bradbrook et al., 2004), and new forms of rapidly-collected remotely sensed digital elevation models (DEMs; Marks and Bates, 2000; Cobby et al., 2001; Bates et al., 2003; Bates, 2004; Sanders, 2007). Of particular value to hydraulic modelers in developed countries was the commencement of routine LIDAR collection due to its high horizontal and vertical precision and accuracy, its ability to penetrate vegetation cover and its reduced susceptibility to scatter and shadowing relative to other forms of remotely sensed elevation data such as Interferometric Synthetic Aperture Radar (InSAR; Bates, 2004). These three key properties made it ideally suited to the creation of “bare-earth” Digital Terrain Models (DTMs), a type of DEM in which surface features such as vegetation and built structures are removed to leave, as the name suggests, a three dimensional representation of the bare-earth surface. Such data are ideally suited for the purposes of flood hazard simulation using hydraulic models, and form the basic datasets from which developed world flood hazard layers, such as the Federal Emergency Management Agency (FEMA) flood maps in the USA, and the Environment Agency Flood Maps in the UK, are produced.
Whilst there have been significant advances in the models and data available for relatively small scale modeling of flood inundation where high quality terrain data exist, the computational and data costs associated with such models tends to restrict their application to populated areas in wealthier nations. Furthermore, due to the potential impact on property prices and local economies, local or national authorities may be reluctant to release the results of such models even where they do exist. However, flood risk is very clearly a global problem and, consequentially, a number of research, and commercial groups are currently working on the development of flood hazard models at the global scale (Hallegatte et al., 2013; Hirabayashi et al., 2013; Winsemius et al., 2013; Sampson et al., 2015; Ward et al., 2015). Projections of rapidly escalating economic losses due to flooding (Hallegatte et al., 2013) and the United Nations (UN) adoption of both the Sendai Framework for Disaster Risk Reduction (United Nations General Assembly, 2015) and the Warsaw International Mechanism for Loss and Damage Associated with Climate Change Impacts (United Nations Framework Convention on Climate Change, 2013) provide clear motivation for the development of global flood risk assessments by both commercial and governmental purposes. Much like the earlier development of reach scale models, these new models are becoming tractable as a result of further increases in computational power and software parallelisation (Lamb et al., 2009; Neal et al., 2010), algorithmic improvements (Bates et al., 2010), and emerging global datasets (Elvidge et al., 2007; Jarvis et al., 2008; Lehner et al., 2008; Andreadis et al., 2013; Yamazaki et al., 2014; Smith et al., 2015). The data challenges are particularly onerous because, whereas at the reach scale most of the required “secondary” spatial data other than the DEM (such as river locations, channel geometries, and flood defenses) can viably be obtained using manual survey or are contained in the data produced by national mapping agencies, at the global scale all such data must be derived in an automated or semi-automated manner from remotely sensed data. The DEM is the core dataset from which many of these secondary datasets are derived and, as we argue in this perspective, it is the limited quality of the present generation of global DEMs that presents the greatest challenge to flood inundation modelers today.
Although a number of free and commercial global DEMs exist, two in particular have received the majority of attention from flood modelers: the Shuttle Radar Topography Mission (SRTM; Rabus et al., 2003; Farr et al., 2007) DEM and the Advanced Spaceborne Thermal Emission and Reflection Radiometer (ASTER; Abrams, 2000) DEM, and their respective derivatives (Jarvis et al., 2008; Fujisada et al., 2012; Kobrick, 2013). These data sets are popular because they are open access and offer greater levels of detail than the previous generation of open access DEMs [such as ACE GDEM (Berry et al., 2000), GLOBE and GTOPO30] due to their greatly increased resolutions. For example, ASTER and SRTM have ground spatial resolutions of 1 arc-seconds (~30 m at the equator, respectively, compared to ~30 arc-seconds (~1 km) for the previous generation DEMs. A number of studies (Hirt et al., 2010; Jing et al., 2013; Rexer and Hirt, 2014; Jarihani et al., 2015) have compared the SRTM and ASTER DEMs across a range of locations globally to assess their applicability to hydraulic models (e.g., Sanders, 2007), and despite its lower nominal resolution it is SRTM—particularly the void-filled CGIAR-CSI version 4 variant (Jarvis et al., 2008)—that has emerged as the favored choice. This is due to SRTM's greater feature resolution, reduced number of artifacts and lower noise than ASTER, particularly in the flatter areas of concern to flood modelers (Jing et al., 2013; Rexer and Hirt, 2014). The prohibitive cost and restricted rights associated with commercial DEMs (such as the Intermap Nextmap® World 10™ and World 30™, and Airbus WorldDEM™, data sets) restricts significantly the application of such products. This results in limited (or no) public and independent validation of commercial DEMs, a lack of independent studies comparing them to other DEMs, and a lack of the types of derived datasets, such as global hydrography data, that have emerged from their open access counter-parts.
User generated “secondary” datasets derived from global topography offer a valuable resource for a range of activities and can been directly attributed to the production of open access global DEMs. From a flood modeling perspective perhaps the most valuable example is the Hydrosheds global hydrography dataset (Lehner et al., 2008). This dataset was produced by executing a number of hydrology-based GIS operations over a suitably void-filled SRTM dataset, and contains layers such as flow direction maps, river networks (with upstream accumulation areas) and catchment masks. The Hydrosheds data has been used as the basis for a number of large scale hydrology and river routing models (Gong et al., 2011; Wood et al., 2011; Alfieri et al., 2013; Schumann et al., 2013; Yamazaki et al., 2013; Sampson et al., 2015) because, in conjunction with the SRTM DEM, it provides a framework within which hydraulic model structures can be assembled. The availability of such datasets reduces significantly the total workload for groups attempting to construct global models, making previously intractable problems manageable for the first time and allowing developers the time to focus on other critical aspects such as efficient numerical schemes and automation.
However, significant as these achievements may be, the current generation of global DEMs have serious limitations that heavily restrict the skill of models developed around them. Taking SRTM as an example, the critical limitations of the dataset are: (a) poor vertical accuracy due to noise or “speckle” (Rodriguez et al., 2006); (b) the difficulty in obtaining a bare-earth DTM due to radar reflection from the top of the vegetation canopy; (c) the inability to resolve street-scale features in urban areas, resulting in large positive elevation biases in urban areas; (d) other systematic errors, such as “striping,” that are a result of the pitch and yaw of the spacecraft during the data collection phase (Rodriguez et al., 2006); and (e) the inability of SRTM to resolve the bathymetry of water bodies due to radar reflection from the water surface. These limitations have a highly detrimental effect on both derived hydrography datasets and the simulated flow dynamics of flood hazard models. There is a tendency amongst many users to fixate on the nominal horizontal resolution of DEMs, but for flood modeling it is the vertical accuracy and precision that is critical. This is because the dominant control on the flow of water in a hydraulic model, as in the real world, is the change in elevation of the topography; after all, it is gravity that moves water downslope. The five critical limitations of the SRTM dataset outlined above all concern the vertical accuracy and precision of the DEM, and all can affect simulated flow dynamics adversely. Vertical noise within a DEM will fundamentally affect the propagation of a floodwave because pixels will serve as blockages or sinks. Where noise is random, it can be reduced by resampling the DEM grid to a coarser resolution as the positive and negatively biased pixels cancel when aggregated onto the larger grid. This approach reduces noise, but also reduces the resolution of the DEM and limits its ability to represent small scale features. More challenging still are the elevation biases imparted by vegetation and urban areas. Such biases can be 10s of meters and, if left uncorrected, forests, and urban areas act as walls or islands that block the flow of water across a floodplain and (erroneously) never flood themselves within the model. As many flood hazard models are used to help assess flood risk, a model that identifies urban areas as always being safe is of little value. Finally, the systematic “striping” caused by the pitch and yaw of the Space Shuttle itself create false wave like artifacts on the DEM that can corrupt the modeled flow of water across the DEM. It also needs to be noted that SRTM is now quite old (the data were collected in February 2000) and many of the world's floodplains have undergone dramatic change since, mostly because of human development. This is particularly true in developing countries, and there is an increasingly pressing need for a new global topographic mapping mission producing open data.
The effects of systematic elevation errors on derived hydrography datasets are equally severe. When a flow direction map is calculated from the DEM, erroneously elevated surfaces caused by areas of vegetation or urbanization cause errors in the calculated flow directions. This in turn leads to incorrect flow accumulation calculations and stream network locations. The effect can be severe in the case of large forests and cities, leading to grossly misplaced river channels and even missing or invented connections between channels and resultant errors in catchment delineation. The most obvious of these errors can be rectified by painstaking manual editing, as was done for the Hydrosheds dataset (Lehner et al., 2008), but many errors remain that can be hard to identify in a systematic manner. These errors impart structural errors on models that rely upon them for their construction, compounding the DEM-induced errors in flow dynamics discussed above.
The errors discussed above have such a marked effect on flood hazard simulations that it has been necessary for practitioners to develop methods that attempt to reduce their severity. One example of this involves attempts to remove vegetation bias from SRTM to produce a bare-earth DTM in forested areas (Baugh et al., 2013). This poses a substantial challenge as the necessary data content is not present in the SRTM data itself, meaning that other datasets are required to quantify the height and location of the vegetation (Simard et al., 2011). Furthermore, because the extent to which the radar pulse penetrates the canopy depends on the density of the vegetation (it is not sufficient to assume the return is always from the top of the canopy), a spatial measure of vegetation density is required. Finally, elevation control points (e.g., ICESat laser altimeter data) are necessary for calibration and validation of the algorithm. Such algorithms can offer significant improvement, as demonstrated in Figure 1. However, their effectiveness is limited by the accuracy and precision of the vegetation datasets, which are themselves uncertain, and non-negligible residual errors in the resultant bare-earth DTM are unavoidable; examples of such errors are provided in Figure 2 below.
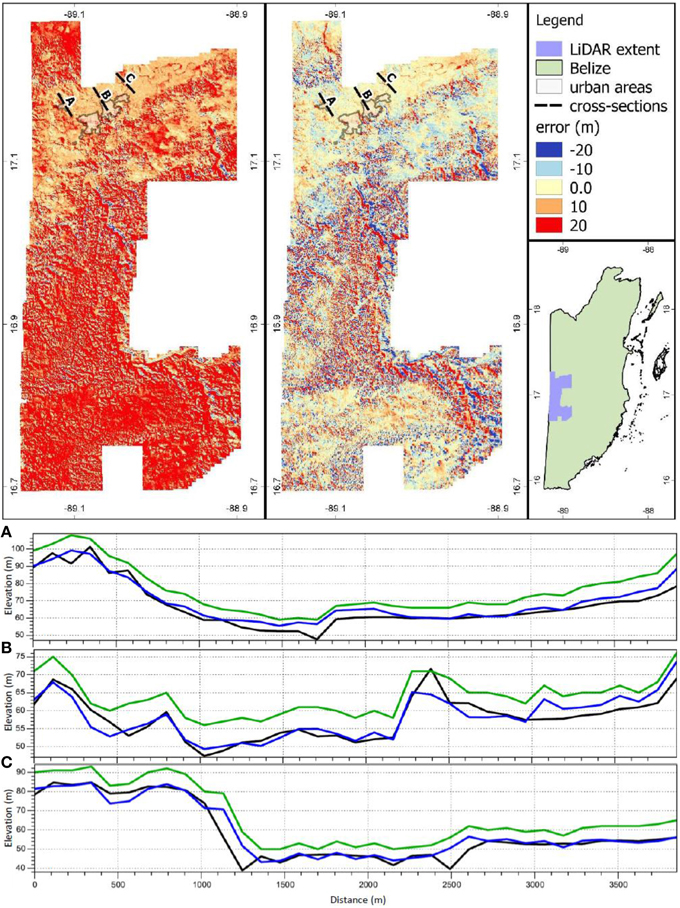
Figure 1. Comparison of raw SRTM DEM to LIDAR (top left) and corrected SRTM to LIDAR (top center) for Western Belize. Cross-sections (A), (B), and (C) transect the Belize River valley and compare the LIDAR elevation profile (black) to the uncorrected SRTM profile (green) and corrected SRTM profile (blue).
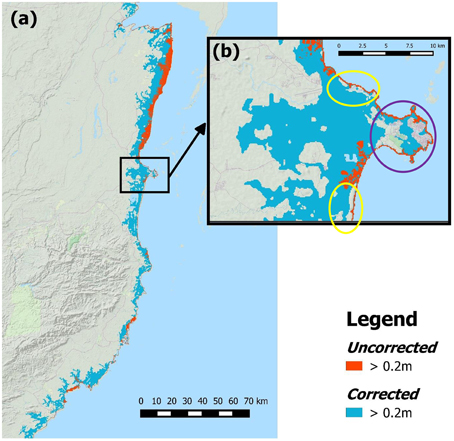
Figure 2. Differences in modeled flood extent (depth >20 cm) for a simulated category five hurricane storm surge along the Belizean coast using raw vs. vegetation bias corrected SRTM DEMs. (a) Shows the entire Belizean coast; (b) details the Belize City region.
Figure 1 shows reduced vertical error following the systematic removal of vegetation bias by comparing corrected and uncorrected SRTM DEMs to a high precision bare-earth DTM produced using 1 m aerial LIDAR data resampled to SRTM resolution. The algorithm employs satellite vegetation height and density datasets (Schwarz et al., 2004; Simard et al., 2011) that estimate vegetation location, height and density to produce an estimated bias layer which is then removed from the SRTM DEM and yields a change in bias from 15.8 to –0.1 m. (Sampson et al., 2015). Figure 2 demonstrates the effect of this correction on a simulation of a category five storm surge event along the Belize coast. In the uncorrected DEM, the vegetation acts as a virtual “sea wall,” preventing the surge waters from penetrating inland to flood areas known to be at risk such as the Belizean coastal mangroves. With the vegetation removed, the coastal wetlands flood, providing a far more plausible realization of the inundation that one would expect for an event of this magnitude. However, while the improvement is obvious, the transects in Figure 1 shows that significant differences still exist between the corrected SRTM DEM and the LIDAR-derived DEM at the local scale due to limitations in the correction method. One key limitation is the resolution of the vegetation datasets (~1 km for the vegetation heights and ~250 m for the vegetation density). The yellow circles in Figure 2 show areas where the vegetation removal tool failed to resolve and remove ~100 m wide strips of mangroves from the SRTM DEM. While the overall removal still allowed water behind the mangrove “wall,” this is an example of typical residual vegetation artifacts. It is also known that most of Belize City should be flooded (Belize government engineers and planners, personal communication); however, dry areas remain due to the residual urban artifacts even after the urban filter is applied to the SRTM DEM (purple circle in Figure 2).
There is therefore a clear need for an improved open-access global DEM for global flood hazard modeling. The value of high resolution terrain data with good vertical precision has long been recognized at the local scale by the hydraulic modeling community (Marks and Bates, 2000; Horritt and Bates, 2001; Bates et al., 2003; Yu and Lane, 2006, 2011; Fewtrell et al., 2008), and the benefits for global scale models may be even greater. This is because reach scale models often rely upon manual correction of the DEM using secondary data sources such as surveyed river cross sections; such corrections are not possible on a systematic basis at the global scale because suitable secondary data does not exist for most rivers, and because the scale of the task would render it unfeasible. The DEM is therefore the only source of data used to determine river locations and river bank elevations for most locations within a global model, and it is reasonable to expect any improvements to this dataset to yield substantial improvements to model performance. For example, the representation of flood defenses within flood hazard models is known to be critically important (te Linde et al., 2011; Brandimarte and Di Baldassarre, 2012; Wesselink et al., 2013), but current large scale models are either forced to assume total failure of defenses, or adopt heavily simplified approaches such as masking off urban areas for event scales below a “defense standard” inferred from socioeconomic data (Feyen et al., 2012) A global DEM of increased horizontal resolution and vertical precision would offer improved representation of micro-topography; if the quality is able to approach that of an aerial LIDAR DEM (>5 m spatial resolution and 1 m vertical precision), features such as large river levees could be resolved directly. This would lead to the explicit representation of major defense features in large scale models, allowing an improved representation of the flood hazard in protected areas. As even the finest aerial LIDAR DEMs fail to completely capture smaller defense features such as narrow defense walls it is unlikely that any foreseeable global DEM could capture all of the detail necessary for ultra-fine models (Gallien et al., 2014). However, a high quality global DEM could act as a “base layer” onto which local detail (potentially collected through crowd-sourced platforms such as OpenStreetMap) could be added. Defenses are not the only consideration either, as previous studies have shown a step change in model skill for urban areas when the DEM becomes able to resolve individual streets due to correct representation of floodplain connectivity (Fewtrell et al., 2008). A final topic that should be mentioned is cost. According to the Sampson et al. (2015) model, the African 1 in 100 year floodplain covers ~7% of the continental area. Scaled to the globe, this gives an approximate 1 in 100 year floodplain area of 35 million km2. Assuming some economies of scale, a collection cost of $200 per km2 is plausible and yields a global cost estimate of approximately $7 billion. As the benefit of the highest resolution data would be most strongly felt in cities, which constitute < 0.5% of the Earth's land area (Schneider et al., 2009) but a much larger proportion of the flood risk, one way to significantly reduce the cost of producing such a DEM would be to adopt a hybrid resolution approach where the highest resolution data are collected in urban areas and a lower resolution adopted for rural areas. However, in the context of future annual flood loss estimates that exceed a trillion dollars (Hallegatte et al., 2013), the cost of collecting a high quality global DEM may be justifiable on the basis of its applicability to flood risk modeling alone.
To conclude, high accuracy and precision DEM data are critical for skillful flood hazard modeling and the limitations with current open access DEM data sets limit significantly our ability to estimate flood inundation and risk for the majority of the planet's surface. There is a clear need (c.f. Schumann et al., 2014) for a concerted global effort to collect or collate a new open access DEM with ~10 m resolution and sub-meter scale vertical accuracy for use in a variety of applications. Flood modeling is one such task, but better global DEM data would have wide value for governments, humanitarian organizations, NGOs and industry.
Conflict of Interest Statement
The authors declare that the research was conducted in the absence of any commercial or financial relationships that could be construed as a potential conflict of interest.
Acknowledgments
We would like to thank John Weishampel, Christine Butterfield and Arlen Chase from the University of Central Florida for supplying the Belize LIDAR data. The work was supported through collaboration with SSBN Ltd, a process facilitated by NERC Impact funding to support the transfer of research between academia and industry (NE/M007766/1).
References
Abrams, M. (2000). The Advanced Spaceborne Thermal Emission and Reflection Radiometer (ASTER): data products for the high spatial resolution imager on NASA's Terra platform. Int. J. Remote Sens. 21, 847–859. doi: 10.1080/014311600210326
Alfieri, L., Burek, P., Dutra, E., Krzeminski, B., Muraro, D., Thielen, J., et al. (2013). GloFAS – global ensemble streamflow forecasting and flood early warning. Hydrol. Earth Syst. Sci. 17, 1161–1175. doi: 10.5194/hess-17-1161-2013
Andreadis, K. M., Schumann, G. J.-P., and Pavelsky, T. (2013). A simple global river bankfull width and depth database. Water Resour. Res. 49, 7164–7168. doi: 10.1002/wrcr.20440
Bates, P. D. (2004). Remote sensing and flood inundation modelling. Hydrol. Process. 18, 2593–2597. doi: 10.1002/hyp.5649
Bates, P. D., and De Roo, A. P. J. (2000). A simple raster-based model for flood inundation simulation. J. Hydrol. 236, 54–77. doi: 10.1016/S0022-1694(00)00278-X
Bates, P. D., Horritt, M. S., and Fewtrell, T. J. (2010). A simple inertial formulation of the shallow water equations for efficient two-dimensional flood inundation modelling. J. Hydrol. 387, 33–45. doi: 10.1016/j.jhydrol.2010.03.027
Bates, P. D., Marks, K. J., and Horritt, M. S. (2003). Optimal use of high-resolution topographic data in flood inundation models. Hydrol. Process. 17, 537–557. doi: 10.1002/hyp.1113
Baugh, C. A., Bates, P. D., Schumann, G., and Trigg, M. A. (2013). SRTM vegetation removal and hydrodynamic modeling accuracy. Water Resour. Res. 49, 5276–5289. doi: 10.1002/wrcr.20412
Berry, P. A. M., Pinnock, R. A., Hilton, R. D., and Johnson, C. P. D. (2000). “ACE: a new global digital elevation model incorporating satellite altimeter derived heights,” in ERS-Envisat Symposium (Noordwijk: ESA Publications Division).
Bradbrook, K. F., Lane, S. N., Waller, S. G., and Bates, P. D. (2004). Two dimensional diffusion wave modelling of flood inundation using a simplified channel representation. Int. J. River Basin Manag. 2, 211–223. doi: 10.1080/15715124.2004.9635233
Bradford, S. F., and Sanders, B. F. (2002). Finite-volume model for shallow-water flooding of arbitrary topography. J. Hydraul. Eng. 128, 289–298. doi: 10.1061/(asce)0733-9429(2002)128:3(289)
Brandimarte, L., and Di Baldassarre, G. (2012). Uncertainty in design flood profiles derived by hydraulic modelling. Hydrol. Res. 43, 753. doi: 10.2166/nh.2011.086
Cobby, D. M., Mason, D. C., and Davenport, I. J. (2001). Image processing of airborne scanning laser altimetry data for improved river flood modelling. ISPRS J. Photogramm. Remote Sens. 56, 121–138. doi: 10.1016/S0924-2716(01)00039-9
Elvidge, C. D., Tuttle, B. T., Sutton, P. C., Baugh, K. E., Howard, A. T., Milesi, C., et al. (2007). Global distribution and density of constructed impervious surfaces. Sensors 7, 1962–1979. doi: 10.3390/s7091962
Farr, T. G., Rosen, P. A., Caro, E., Crippen, R., Duren, R., Hensley, S., et al. (2007). The shuttle radar topography mission. Rev. Geophys. 45, RG2004. doi: 10.1029/2005RG000183
Fewtrell, T. J., Bates, P. D., Horritt, M., and Hunter, N. M. (2008). Evaluating the effect of scale in flood inundation modelling in urban environments. Hydrol. Process. 22, 5107–5118. doi: 10.1002/hyp.7148
Feyen, L., Dankers, R., Bódis, K., Salamon, P., and Barredo, J. I. (2012). Fluvial flood risk in Europe in present and future climates. Clim. Change 112, 47–62. doi: 10.1007/s10584-011-0339-7
Fujisada, H., Urai, M., and Iwasaki, A. (2012). Technical Methodology for ASTER Global DEM. IEEE Trans. Geosci. Remote Sens. 50, 3725–3736. doi: 10.1109/TGRS.2012.2187300
Gallien, T. W., Sanders, B. F., and Flick, R. E. (2014). Urban coastal flood prediction: Integrating wave overtopping, flood defenses and drainage. Coast. Eng. 91, 18–28. doi: 10.1016/j.coastaleng.2014.04.007
Gong, L., Halldin, S., and Xu, C.-Y. (2011). Global-scale river routing—an efficient time-delay algorithm based on HydroSHEDS high-resolution hydrography. Hydrol. Process. 25, 1114–1128. doi: 10.1002/hyp.7795
Hallegatte, S., Green, C., Nicholls, R. J., and Corfee-Morlot, J. (2013). Future flood losses in major coastal cities. Nat. Clim. Change 3, 802–806. doi: 10.1038/nclimate1979
Hirabayashi, Y., Mahendran, R., Koirala, S., Konoshima, L., Yamazaki, D., Watanabe, S., et al. (2013). Global flood risk under climate change. Nat. Clim. Change 3, 816–821. doi: 10.1038/nclimate1911
Hirt, C., Filmer, M. S., and Featherstone, W. E. (2010). Comparison and validation of the recent freely available ASTER-GDEM ver1, SRTM ver4.1 and GEODATA DEM-9S ver3 digital elevation models over Australia. Aust. J. Earth Sci. 57, 337–347. doi: 10.1080/08120091003677553
Horritt, M. S., and Bates, P. D. (2001). Effects of spatial resolution on a raster based model of flood flow. J. Hydrol. 253, 239–249. doi: 10.1016/S0022-1694(01)00490-5
Jarihani, A. A., Callow, J. N., McVicar, T. R., Van Niel, T. G., and Larsen, J. R. (2015). Satellite-derived Digital Elevation Model (DEM) selection, preparation and correction for hydrodynamic modelling in large, low-gradient and data-sparse catchments. J. Hydrol. 524, 489–506. doi: 10.1016/j.jhydrol.2015.02.049
Jarvis, A., Reuter, H. I., Nelson, A., and Guevara, E. (2008). Hole-Filled SRTM for the Globe Version 4 [WWW Document]. Available online at: http://srtm.csi.cgiar.org
Jing, C., Shortridge, A., Lin, S., and Wu, J. (2013). Comparison and validation of SRTM and ASTER GDEM for a subtropical landscape in Southeastern China. Int. J. Digit. Earth 7, 969–992. doi: 10.1080/17538947.2013.807307
Lamb, R., Crossley, M., and Waller, S. (2009). A fast two-dimensional floodplain inundation model. Proc. ICE - Water Manag. 162, 363–370. doi: 10.1680/wama.2009.162.6.363
Lehner, B., Verdin, K., and Jarvis, A. (2008). New global hydrography derived from spaceborne elevation data. Eos Trans. Am. Geophys. Union 89, 93–94. doi: 10.1029/2008EO100001
Marks, K., and Bates, P. (2000). Integration of high-resolution topographic data with floodplain flow models. Hydrol. Process. 14, 2109–2122. doi: 10.1002/1099-1085(20000815/30)14:11/123.0.CO;2-1
Neal, J. C., Fewtrell, T. J., Bates, P. D., and Wright, N. G. (2010). A comparison of three parallelisation methods for 2D flood inundation models. Environ. Model. Softw. 25, 398–411. doi: 10.1016/j.envsoft.2009.11.007
Rabus, B., Eineder, M., Roth, A., and Bamler, R. (2003). The shuttle radar topography mission—a new class of digital elevation models acquired by spaceborne radar. ISPRS J. Photogramm. Remote Sens. 57, 241–262. doi: 10.1016/S0924-2716(02)00124-7
Rexer, M., and Hirt, C. (2014). Comparison of free high resolution digital elevation data sets (ASTER GDEM2, SRTM v2.1/v4.1) and validation against accurate heights from the Australian National Gravity Database. Aust. J. Earth Sci. 61, 213–226. doi: 10.1080/08120099.2014.884983
Rodriguez, E., Morris, C. S., and Belz, J. E. (2006). A global assessment of the SRTM performance. Photogramm. Eng. Remote Sens. 72, 249–260. doi: 10.14358/PERS.72.3.249
Sampson, C. C., Smith, A. M., Bates, P. B., Neal, J. C., Alfieri, L., and Freer, J. E. (2015). A high-resolution global flood hazard model. Water Resour. Res. 51, 7358–7381. doi: 10.1002/2015WR016954
Sanders, B. F. (2007). Evaluation of on-line DEMs for flood inundation modeling. Adv. Water Resour. 30, 1831–1843. doi: 10.1016/j.advwatres.2007.02.005
Schneider, A., Friedl, M. A., and Potere, D. (2009). A new map of global urban extent from MODIS satellite data. Environ. Res. Lett. 4, 044003. doi: 10.1088/1748-9326/4/4/044003
Schumann, G. J.-P., Bates, P. D., Neal, J. C., and Andreadis, K. M. (2014). Technology: Fight floods on a global scale. Nature 507, 169–169. doi: 10.1038/507169e
Schumann, G. J.-P., Neal, J. C., Voisin, N., Andreadis, K. M., Pappenberger, F., Phanthuwongpakdee, N., et al. (2013). A first large-scale flood inundation forecasting model. Water Resour. Res. 49, 6248–6257. doi: 10.1002/wrcr.20521
Schwarz, M., Zimmermann, N. E., and Waser, L. T. (2004). “MODIS based continuous fields of tree cover using generalized linear models,” in Geoscience and Remote Sensing Symposium, (2004). IGARSS'04. Proceedings. 2004 IEEE International, Vol. 4 (Anchorage, AK), 2377–2380.
Simard, M., Pinto, N., Fisher, J. B., and Baccini, A. (2011). Mapping forest canopy height globally with spaceborne lidar. J. Geophys. Res. Biogeosci. 116, G04021. doi: 10.1029/2011jg001708
Smith, A., Sampson, C., and Bates, P. (2015). Regional flood frequency analysis at the global scale. Water Resour. Res. 51, 539–553. doi: 10.1002/2014WR015814
te Linde, A. H., Bubeck, P., Dekkers, J. E. C., de Moel, H., and Aerts, J. C. J. H. (2011). Future flood risk estimates along the river Rhine. Nat. Hazards Earth Syst. Sci. 11, 459–473. doi: 10.5194/nhess-11-459-2011
United Nations Framework Convention on Climate Change (2013). Warsaw International Mechanism for Loss and Damage Associated with Climate Change Impacts, 2/CP.19. Warsaw.
United Nations General Assembly (2015). Sendai Framework for Disaster Risk Reduction 2015–2030, A/RES/69/283. Sendai.
Ward, P. J., Jongman, B., Salamon, P., Simpson, A., Bates, P., De Groeve, T., et al. (2015). Usefulness and limitations of global flood risk models. Nat. Clim. Change 5, 712–715. doi: 10.1038/nclimate2742
Wesselink, A., Warner, J., and Kok, M. (2013). You gain some funding, you lose some freedom: the ironies of flood protection in Limburg (The Netherlands). Environ. Sci. Policy 30, 113–125. doi: 10.1016/j.envsci.2012.10.018
Winsemius, H. C., Van Beek, L. P. H., Jongman, B., Ward, P. J., and Bouwman, A. (2013). A framework for global river flood risk assessments. Hydrol. Earth Syst. Sci. 17, 1871–1892. doi: 10.5194/hess-17-1871-2013
Wood, E. F., Roundy, J. K., Troy, T. J., van Beek, L. P. H., Bierkens, M. F. P., Blyth, E., et al. (2011). Hyperresolution global land surface modeling: meeting a grand challenge for monitoring Earth's terrestrial water. Water Resour. Res. 47, W05301. doi: 10.1029/2010WR010090
Yamazaki, D., de Almeida, G. A. M., and Bates, P. D. (2013). Improving computational efficiency in global river models by implementing the local inertial flow equation and a vector-based river network map. Water Resour. Res. 49, 7221–7235. doi: 10.1002/wrcr.20552
Yamazaki, D., O'Loughlin, F., Trigg, M. A., Miller, Z. F., Pavelsky, T. M., and Bates, P. D. (2014). Development of the global width database for large rivers. Water Resour. Res. 50, 3467–3480. doi: 10.1002/2013WR014664
Yu, D., and Lane, S. N. (2006). Urban fluvial flood modelling using a two-dimensional diffusion-wave treatment, part 1: mesh resolution effects. Hydrol. Process. 20, 1541–1565. doi: 10.1002/hyp.5935
Keywords: global flood modeling, DEM, Hydraulic modeling, remote sensing of environment, hazard modeling
Citation: Sampson CC, Smith AM, Bates PD, Neal JC and Trigg MA (2016) Perspectives on Open Access High Resolution Digital Elevation Models to Produce Global Flood Hazard Layers. Front. Earth Sci. 3:85. doi: 10.3389/feart.2015.00085
Received: 27 August 2015; Accepted: 02 December 2015;
Published: 05 January 2016.
Edited by:
Wouter Buytaert, Imperial College London, UKReviewed by:
Joshua Larsen, University of Queensland, AustraliaTobias Krueger, Humboldt-Universität zu Berlin, Germany
Brett F. Sanders, University of California, Irvine, USA
Copyright © 2016 Sampson, Smith, Bates, Neal and Trigg. This is an open-access article distributed under the terms of the Creative Commons Attribution License (CC BY). The use, distribution or reproduction in other forums is permitted, provided the original author(s) or licensor are credited and that the original publication in this journal is cited, in accordance with accepted academic practice. No use, distribution or reproduction is permitted which does not comply with these terms.
*Correspondence: Christopher C. Sampson, Y2hyaXMuc2FtcHNvbkBicmlzdG9sLmFjLnVr