 Liping Liu
 Yuh-Lang Lin
 Shu-Hua Chen
- 1Department of Mathematics, North Carolina A&T State University, Greensboro, NC, USA
- 2Department of Physics, North Carolina A&T State University, Greensboro, NC, USA
- 3Department of Energy and Environmental Systems, North Carolina A&T State University, Greensboro, NC, USA
- 4Department of Land, Air and Water Resources, University of California, Davis, CA, USA
Effects of landfall location and approach angle on track deflection associated with a tropical cyclone (TC) passing over an idealized and Central Appalachian Mountain is investigated by a series of idealized numerical experiments. When the TC landfalls on the central portion of the mountain range, it is deflected to the south upstream, passes over the mountain anticyclonically, and then moves westward downstream. The TC motion is steered by the positive vorticity tendency (VT) which is dominated by horizontal vorticity advection upstream and downstream, but with additional influence from the stretching and residual terms, which are mainly associated with diabatic heating and frictional effects. The track deflection mechanism upstream and downstream is similar to the dry flow in previous study, but is very different in the vicinity of the mountain. When the TC landfalls near the northern (southern) tip, it experiences less (more) southward deflection due to stronger (weaker) vorticity advection around the tip. When the TC approaches the mountain range from the southeast and landfalls on the northern tip, center, or southern tip, the track deflections are similar to those embedded in an easterly flow but with weaker orographic blocking. These results are similar to the cases simulated in the dry flow in previous study, except that there is no track discontinuity due to the weaker orographic blocking associated with strong TC convection. When a TC moves along the north-south mountain range from the south, it tends to deflect toward the mountain and then crosses over to the other side at later time. In these cases, the positive VT is influenced by all horizontal vorticity advection, vorticity stretching (diabatic heating), and residual (friction) terms due to longer and stronger interaction with the mountain range. The vorticity stretching is mainly caused by diabatic heating in the moist flow, instead of by lee slope vorticity stretching in the previous study for dry flow.
Introduction
When a tropical cyclone (TC) passes over a mountain range, its steering flow and cyclonic circulation are often strongly modified by the orography. This tends to enhance the precipitation associated with the storm's rainbands (e.g., Lin, 2007 for a brief review). During the summer and fall seasons, floods over the Appalachians are often a product of enhanced heavy rainfall from hurricanes. This is analogous to flooding associated with the passage of typhoons over Taiwan's Central Mountain Range (CMR) (Lin, 2007). One example is Hurricane Camille (1969), which dumped up to 686 mm of rainfall at one location along the slopes of the Appalachian Mountains in central Virginia (Schwarz, 1970). Another example is Hurricane Ivan (2004) (Stewart, 2004). On September 16, 2004 in Macon County, North Carolina, Ivan produced a debris flow 3.6 km downslope along Peeks Creek to the Cullasaja River, causing five deaths and two injuries along with destruction of 16 buildings. The heavy rainfall areas are closely related to storm tracks, which tend to be strongly influenced by orography. Therefore, it is important to make accurate predictions of the orographic effects on track deflection and understand the underlying mechanisms.
TC track deflections due to orography have occurred over several mesoscale mountain ranges. In particular, deflections have been well documented for typhoons passing over Taiwan's CMR and the Cordillera Central of northern Luzon in the Philippines (e.g., Brand and Blelloch, 1974; Wang, 1980), TC's passing over Madagascar and La Reunion mountains (Rakotomavo et al., 2011), and hurricanes passing over the Cordillera Central of Hispañola (Bender et al., 1987) and the Sierra Madre Mountains of Mexico (Zehnder, 1993; Zehnder and Reeder, 1997). Similar track deflections have also been observed with mid-latitude cyclones passing over the Appalachians (e.g., O'Handley and Bosart, 1996). Effects of orography on TC tracks have been studied extensively for typhoons passing over Taiwan's CMR and the Cordillera Central of northern Luzon in the Philippines.
Due to complicated interactions between orographic and thermal forcing, both idealized numerical simulations (e.g., Chang, 1982; Bender et al., 1987; Yeh and Elsberry, 1993a,b; Lin et al., 1999, 2005, denoted as L05 hereafter, Lin and Savage, 2011; Tang and Chan, 2013, 2014; Wu et al., 2015), real-case simulations (e.g., Wu, 2001; Lin et al., 2006; Jian and Wu, 2008; Huang et al., 2011; Hsu et al., 2013; Wang et al., 2013; Wu et al., 2015), and observations (Brand and Blelloch, 1974; Wang, 1980; Hsu et al., 2013) have shown that when a typhoon approaches Taiwan's CMR, its track may deflect either to the north or south upstream of the mountain. It has been proposed that the track deflection may be due to mean cyclonic circulation (e.g., Chang, 1982; Bender et al., 1987), channeling mechanism (e.g., Lin et al., 1999; Jian and Wu, 2008; Huang et al., 2011), blocking effect (e.g., Yeh and Elsberry, 1993a,b, L05, Lin and Savage, 2011), latent heating (e.g., Hsu et al., 2013; Tang and Chan, 2013, 2014; Wang et al., 2013), terrain-induced gyes (Tang and Chan, 2013, 2014), approaching angle and landing location (Lin and Savage, 2011; Tang and Chan, 2014), and midtropospheric northerly asymmetric flow (Wu et al., 2015). Thus, the basic dynamics deserve further investigation. In this study, we will focus on the effects of landfall location and impinging angle on TC track deflection in an idealized environment.
In addition to the above mechanisms, the landfall location and approach angle also play important roles in the track deflection of a TC passing over Taiwan's CMR (Wang, 1980). Based on the 6-h Atlantic hurricane best track (HUDAT) of 28 landfalling TCs that impinged on the Appalachians during 1979 and 2006, Harville (2009) (denoted as H09 hereafter) classified the tracks into four types (Figure 1): (1) approximately perpendicular to the mountains from east to west (Type A), (2) parallel on the eastern side of the mountain (Type B), (3) parallel on the western side of the mountains (Type C), and (4) similar to Type A, but from west to east. From idealized simulations of a drifting vortex over an idealized version of Taiwan's CMR (Lin and Savage, 2011; denoted as LS11 hereafter), found that the local vorticity generation is dominated more by vorticity advection upstream of the mountain range, vorticity stretching over the lee side and its immediate downstream area, and vorticity advection again far downstream of the mountain as it steers the vortex back to its original direction of movement. The vorticity advection upstream of the mountain range is explained by the flow splitting associated with orographic blocking. Based on a vorticity budget analysis, it was found that jumps in the vortex path are largely governed by stretching on the lee side of the mountain, with the maximum stretching and associated track jump located on the faster side of the vortex. The present study is an extension of Lin and Savage (2011) by adding latent heating and the planetary boundary layer to the numerical simulations.
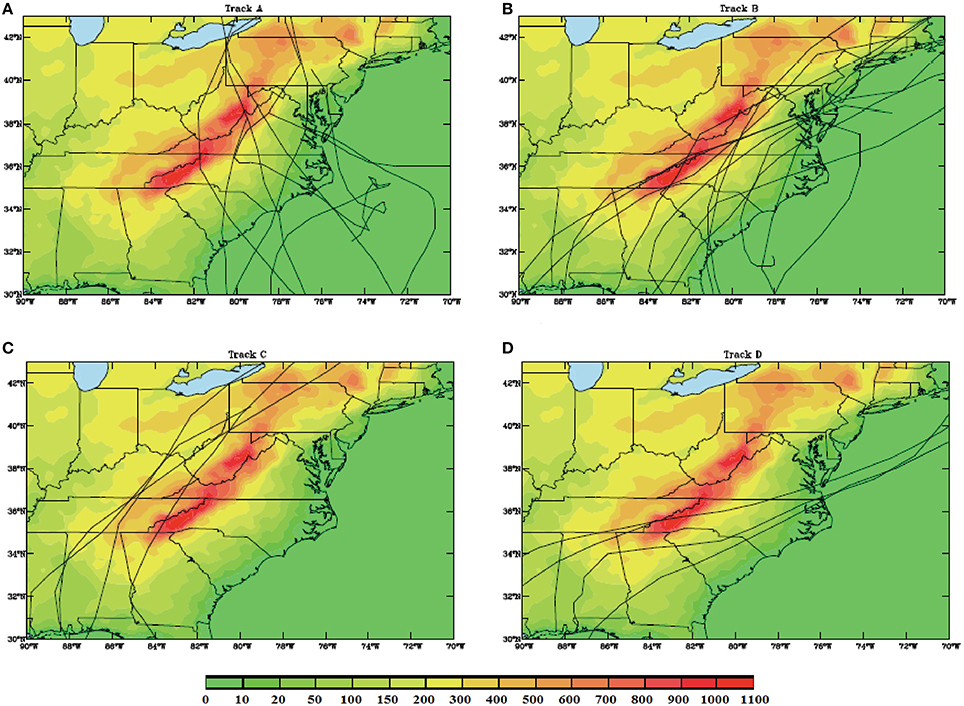
Figure 1. Classification of track categories (A–D) for hurricanes passing over the South-Central Appalachian (SCA) mountain range (Harville, 2009–H09).
In idealized simulations, Tang and Chan (2013) found that a pair of terrain-induced gyres is formed when an idealized TC moves closer to Taiwan's CMR. This pair of gyres rotates cyclonically around the TC and the gyre-associated flow near the TC center causes a northward deflection of the TC track prior to landfall. An examination of the potential vorticity tendencies (PVTs) suggests that, in addition to the PVT produced by this flow, the PVT from diabatic heating cannot be ignored in explaining the TC track during landfall. Topography also altered the asymmetric diabatic pattern of the TC by three major mechanisms: an incursion of dry air from the mountain, low-level convergence induced by the terrain-altered wind field in the southwestern part of the TC and the development of convergence cyclonically inward from the eastern side of the mountain to the TC core. In the second part of this series of studies, Tang and Chan (2014) examined the effects of Taiwan's CMR on the tracks of several TCs approaching Taiwan from southeast at different latitudes. They found that TCs approaching the south of Taiwan slow down and are first deflected southwestward and then northward. Moreover, a sharp northward deflection occurs for a TC passing further south of Taiwan, but the deflection is small for a TC passing further north of Taiwan. Although, Tang and Chan (2013, 2014) have advanced our understanding of orographic effects on TC tracks, the TCs inserted in their numerical simulations were steered by the pair of beta gyres far upstream, instead of advected by the southeasterly basic flow. In this study, we will be investigating the orographic effect on the basic flow and its impact on the TC track. In term of idealized simulations, our current study differs from Huang et al. (2011) and Wu et al. (2015) in focusing on effects of landing location and impinging angle and also including vorticity budget analysis.
In this paper we will extend the study of LS11 to simulate a TC over an idealized Southern and Central Appalachians (SCA) mountain range by using a more realistic, state-of-art numerical weather prediction model. In addition, unlike a dry cyclone vortex used in LS11 and L05, a more realistic bogus TC is initiated in a conditionally unstable atmosphere with land surface, moist and planetary boundary layer (PBL) processes included. A vorticity budget analysis is adopted to help understand the effects of combined forcing of orography and convection, instead of the potential vorticity tendency (PVT) diagnostic approach taken by some previous studies (e.g., Wu and Wang, 2000; Chan et al., 2002; Hsu et al., 2013; Tang and Chan, 2013, 2014; Wang et al., 2013). The direct diabatic heating effects will be investigated along with the rainfall distributions.
The numerical model and its experimental design will be described in Section The Numerical Model and Experimental Design. In Section The Mechanisms for Track Deflection, a vorticity budget analysis will be performed to help understand the fundamental dynamics of the track deflection associated with a numerically simulated TC traversing over an elongated mountain range. Sensitivity of the track deflection to landfall locations and approach angles will be presented in Section Effects of landfall Locations and approach Angles. The concluding remarks can be found in Section Concluding Remarks.
The Numerical Model and Experimental Design
The model used for this study is the Advanced Research Weather Research and Forecasting (ARW) model version 3.4.1 (Skamarock et al., 2008). The ARW model is a three-dimensional, fully compressible, non-hydrostatic model using terrain-following vertical coordinates. The governing equations for ARW are written in flux-form with conserved mass and dry entropy. In this study, the Runge-Kutta third-order time difference scheme is employed, and the fifth- and third-order advection schemes are used for the horizontal and vertical directions respectively.
The physics parameterization or representation schemes that are chosen for all simulations in this study include: Kain-Fritsch cumulus parameterization scheme (Kain and Fritsch, 1993; Kain, 2004), Purdue-Lin microphysics parameterization scheme (Lin et al., 1983; Chen and Sun, 2002), YSU PBL parameterization scheme (Hong and Pan, 1996), Monin-Obukov surface layer scheme, Unified NOAH land-surface processes scheme, Second-order diffusion term on coordinate surfaces for turbulence and mixing processes, and Horizontal Smagorinsky first-order closure for eddy coefficient option. The Purdue-Lin scheme (Lin et al., 1983; Chen and Sun, 2002) was chosen due to its capability in simulating mixed-phase microphysical processes for practical applications, recommended by Skamarock et al. (2008), as they can account for the interaction of water and ice particles. In idealized simulations, Fovell et al. (2009) found that the Purdue-Lin scheme (Chen and Sun, 2002) produced relatively better results. The Kain-Fritsch cumulus parameterization scheme (Kain and Fritsch, 1993; Kain, 2004) is chosen since it is CAPE based, thus is more suitable in triggering the deep convection in a conditionally unstable atmosphere, such as the one used in the current study. The YSU scheme (Hong and Pan, 1996) is chosen due to the non-local closure, which does not rely on or too sensitive to localized heat, moisture, and momentum fluxes. No longwave or shortwave radiation parameterizations are applied to any simulations. Details of these schemes and their relevant references can be found in the ARW user manual (Skamarock et al., 2008). An idealized “moist tropical sounding” of Dunion (2011) is given to provide the moisture (see Figure 2 of Nolan, 2011).
A preexisting, mid-level, bogus vortex with peak tangential wind speed of 20.8 ms−1 at a radius of maximum winds of 90 km is set at (5385 km, 3240 km). The vertical structure of the initial vortex is in the radiative-convective-equilibrium state (Nolan, 2011; Nolan et al., 2013). Rather than using the fairly narrow tangential wind profile generated by a Gaussian vorticity distribution, our simulations use a modified Rankine vortex with decay parameter as 0.4, which is more realistic for the development stage (Mallen et al., 2005). The SST is fixed to 28°C. The domain-wide wind profile is purely zonal, with U(p) = −5 ms−1 from the surface to 850 hPa, increasing with the shape of a cosine as a function of log-pressure height to 5 ms−1 at 200 hPa, then remaining at this value for all greater heights. The zonal wind is assumed to be in thermal wind balance. The model derives the geopotential height using iterative method and then calculates other fields.
All simulations use one single domain (6480 km, 6480 km) with a 15-km horizontal resolution. The number of the horizontal grid intervals is 433 in both the x and y directions. In the vertical, grids are stretched from the surface to the model top (20 km) with a total of 41 levels. The time interval is 45 s. A 4-km deep sponge layer is set from 16 to 20 km to reduce the wave reflection from the model top. The periodic lateral boundary condition is applied to the y-direction and the open boundary conditions are applied to both east and west side boundaries. The model is integrated for 12 days for all cases simulated in this study.
In the control case (CNTL or A2), the westward-moving bogus TC approaches the center of an idealized bell-shaped SCA mountain island from the east. This is the characteristic of track type A2 (see Figure 2A). The idealized mountain (see Figure 2B), which is oriented in the north-south direction, is approximately 1400 km long and 200 km wide, and the maximum mountain height (h) is 1 km, which mimics the SCA Mountains. The maximum tangential wind (Vmax) of the TC vortex is approximately 60 m/s after it is fully developed and the basic mean wind (U) is 5 m/s. The basic flow Froude number (U∕Nh) is approximately 0.5, which represents moderate orographic blocking on the basic flow. On the other hand, the vortex Froude number (Vmax ∕ Nh) is approximately 6, indicating weak orographic blocking on the outer circulation of the TC vortex (L05). The initial bogus vortex has Vmax = 20.8 m∕s and is located 1100 km from the eastern boundary in the x direction and centered in the y direction.
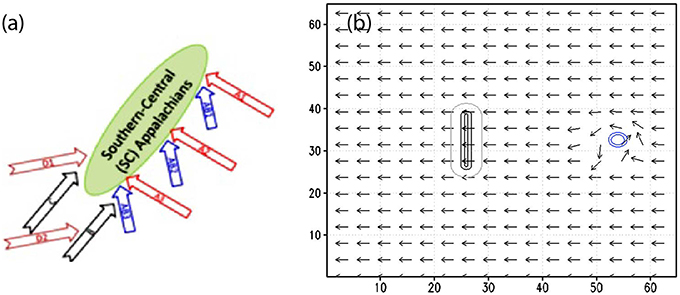
Figure 2. (A) Detailed classification of tropical cyclone (TC) track types over the South-Central Appalachian (SCA) mountain range. (B) The entire computation domain with the mountain range, the wind flow and the initial bogus vortex. The units of the coordinates in the x and y directions are 100 km. The mountain contours are 5, 400, and 600 m. The vorticity contours are 5 × 10⁻⁵s−1, and 1 × 10⁻⁴s−1.
The following is the formula for the geometry of the idealized SCA mountain range,
where h0 = 1km, x0 = 2600km, y0 = 3240km, a = 50km, b = 600km, yc = y0 + b for y ≥ y0 + b and yc = y0 − b for y ≤ y0 − b. The mountain is inserted in the beginning of the simulations, as part of the terrain-following coordinates.
The track types proposed by H09 are reclassified to track types A1-3, B, AB1-3, C, and D1-2, and used to study the sensitivity to landfall locations and approach angles (Figure 2A). Types A1-A3 are similar to Track A of H09 except with landfall locations on the northern, central, and southern part of the SCA differentiated. Types AB1-AB3 are similar to A1-A3 respectively, but from south-southeast. Types D1 and D2 are similar to Track D of H09 except the former crosses over the SCA, while the latter skirts around the southern tip of the mountains. Types B and C are the same as those of H09. This study focuses on track types A1-A3, AB1-AB3, B, and C. Their associated flow and orographic parameters are summarized in Table 1.
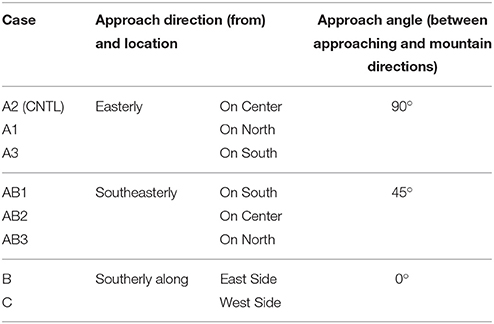
Table 1. Names, landfall locations, and approach angles of simulated cases.
The Mechanisms for Track Deflection
Figure 3A shows the 258 h accumulated rainfall for case CNTL (A2). Since the accumulated rainfall coincides with the TC track (Figure 3B), it can also be used as a proxy of the TC path. Note that the TC is deflected to the south upstream, passing over the mountain anticyclonically (clockwise) and westward downstream from the mountain at a latitude south of its original latitude. The continuous track and the southward deflection is similar to the behavior of a drifting TC vortex embedded in a dry, stably stratified fluid flow as found in Lin et al.'s previous studies (1999, 2005) and the typhoons observed and simulated by Jian and Wu (2008) and Huang et al. (2011). In a dry flow, they can be explained by the conservation of potential vorticity due to orographic blocking on a drifting vortex embedded in a dry, stably stratified fluid flow (Lin, 2007, Figure 5.36). The mechanisms which control the track deflection in the CNTL case are much more complicated due to the inclusion of moist and PBL processes. In the following, they will be explored by performing a vorticity budget analysis.
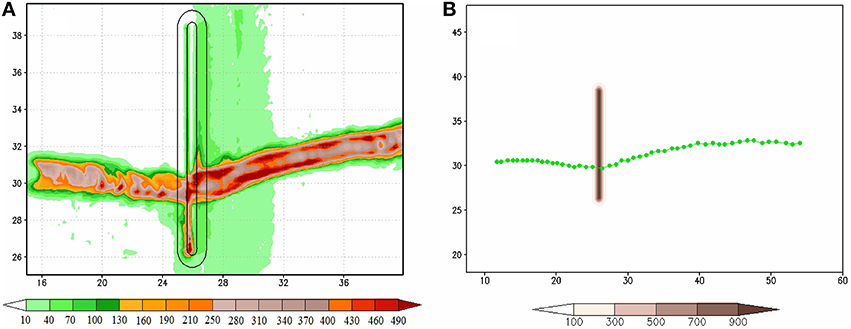
Figure 3. (A) Accumulated rainfall (shaded, in mm), and (B) TC track for every 6 h starting at 0 h. The units of the coordinates in the x and y directions are 100 km.
It is well-known that a TC tends to move toward an area with a positive vorticity tendency (VT) (i.e., ∂ζ∕∂t > 0; e.g., Holland, 1983, see Lin, 2007, for a brief review). Thus, a vorticity budget analysis of the individual terms of the vorticity equation provides an appropriate approach to reveal the mechanisms which control the track change. In order to do so, we analyze the individual terms of the following vorticity equation on an f -plane in the pressure vertical coordinates, which may be written as below.
Here VH is the horizontal wind vector (u, v), ω the omega vertical motion, f0 the constant Coriolis parameter (). The right-hand side of Equation (2) represents the horizontal vorticity advection (term 2), vertical vorticity advection (term 3), vorticity stretching associated with pre-existing relative vorticity (term 4), vorticity stretching associated with pre-existing planetary vorticity (term 5), tilting term (term 6), and residual term (term 7, mainly contributed by friction). The residual term is obtained by subtracting the VT (term 1) by terms 2–6. The 950–500 hPa layer-averaged VT, horizontal vorticity advection, vorticity stretching with pre-existing relative vorticity, and residual term (i.e., terms 1, 2, 4, and 7, respectively) and the flow and TC fields are shown when the TC is located upstream at 132 h (Figure 4), right before crossing the mountain at 168 h (Figure 5), just over the mountain at 183 h (Figure 6), and downstream from the mountain at 216 h (Figure 7). Other terms are not shown because they are insignificant compared to the above terms.
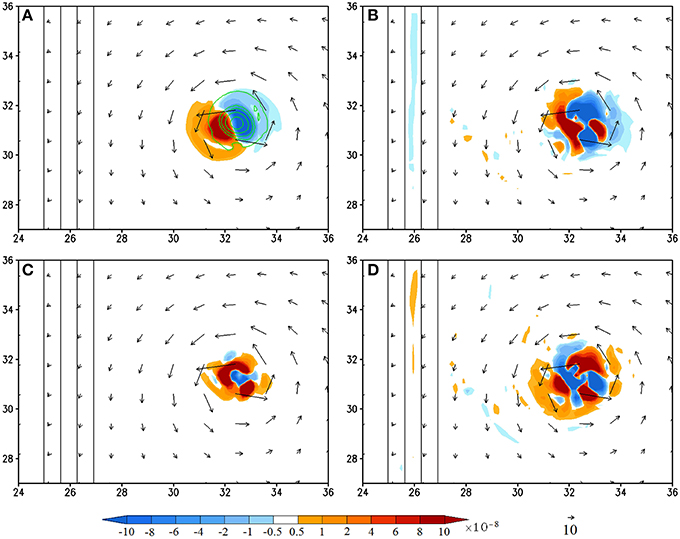
Figure 4. (CNTL/A2) Vorticity budget analysis averaged for the 950–500 hPa layer at 132 h (shaded): (A), vorticity tendency (VT); (B), horizontal vorticity advection; (C), relative vorticity stretching, and (D), residual term. The vertical vorticity field is depicted by contours (0.0001, 0.0005, 0.001, 0.002, 0.003 s−1) in (A). The residual term is obtained by subtracting (A) by the sum of (B,C), vertical advection, planetary vorticity stretching, and tilting terms. The last three terms are not shown since their magnitudes are negligible compared to terms (A–C). The units of the coordinates in the x and y directions are 100 km.
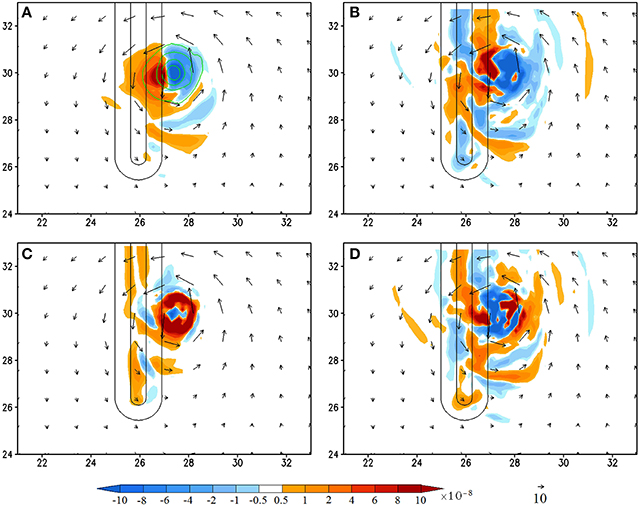
Figure 5. (CNTL/A2) Vorticity budget analysis averaged for the 950–500 hPa layer at 168 h (shaded): (A), vorticity tendency (VT); (B), horizontal vorticity advection; (C), relative vorticity stretching, and (D), residual term. The vertical vorticity field is depicted by contours (0.0001, 0.0005, 0.001, 0.002, 0.003 s−1) in (A). The residual term is obtained by subtracting (A) by the sum of (B,C), vertical advection, planetary vorticity stretching, and tilting terms. The last three terms are not shown since their magnitudes are negligible compared to terms (A–C). The units of the coordinates in the x and y directions are 100 km.
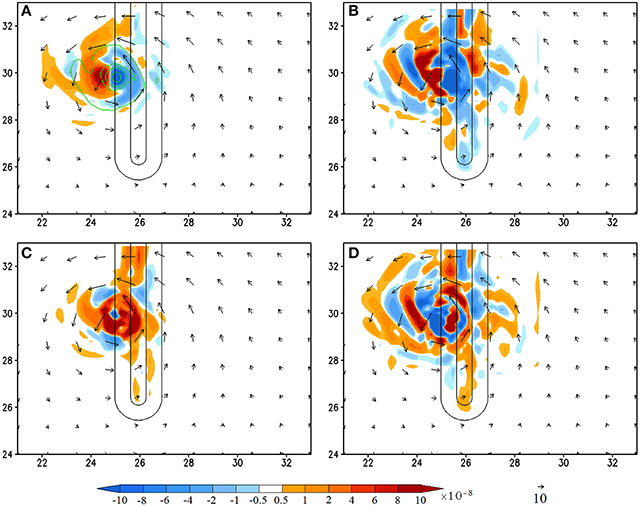
Figure 6. (CNTL/A2) Vorticity budget analysis averaged for the 950–500 hPa layer at 180 h (shaded): (A), vorticity tendency (VT); (B), horizontal vorticity advection; (C), relative vorticity stretching, and (D), residual term. The vertical vorticity field is depicted by contours (0.0001, 0.0005, 0.001, 0.002, 0.003 s−1) in (A). The residual term is obtained by subtracting (A) by the sum of (B,C), vertical advection, planetary vorticity stretching, and tilting terms. The last three terms are not shown since their magnitudes are negligible compared to terms (A–C). The units of the coordinates in the x and y directions are 100 km.
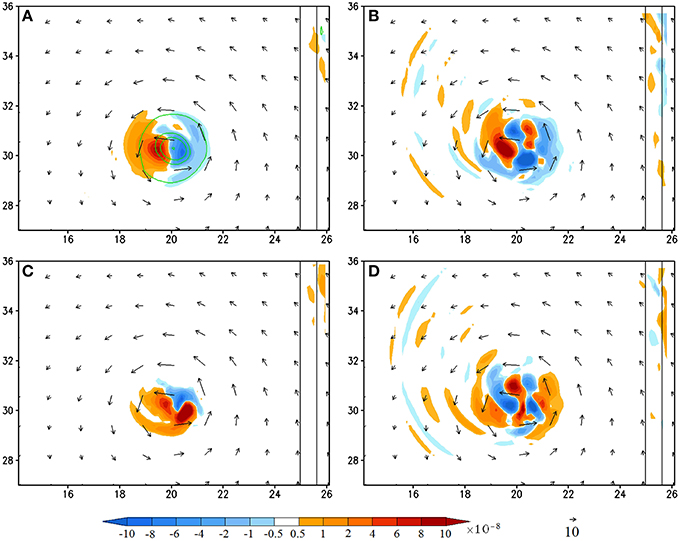
Figure 7. (CNTL/A2) Vorticity budget analysis averaged for the 950–500 hPa layer at 216 h (shaded): (A), vorticity tendency (VT); (B), horizontal vorticity advection; (C), relative vorticity stretching, and (D), residual term. The vertical vorticity field is depicted by contours (0.0001, 0.0005, 0.001, 0.002, 0.003 s−1) in (A). The residual term is obtained by subtracting (A) by the sum of (B,C), vertical advection, planetary vorticity stretching, and tilting terms. The last three terms are not shown since their magnitudes are negligible compared to terms (A–C). The units of the coordinates in the x and y directions are 100 km.
At 132 h, the TC is located at about 700 km upstream of the mountain ridge, it has already started moving southwestward (Figure 3) toward the area with maximum positive VT (Figure 4A). This area with positive VT is accompanied by an area with negative VT located to the northeast (Figure 4A). Compared to other significant terms (Figures 4B–D), the positive VT (Figure 4A) is mainly contributed by the horizontal vorticity advection (Figure 4B) with additional influence from vorticity stretching (Figure 4C) and residual terms (Figure 4D). The southwestward advection of the vorticity can be explained by the anticyclonic turning of a continuously stratified flow over a mesoscale mountain due to the generation of high pressure over the mountain (Smith, 1979), which forces the flow to turn southward upstream for an easterly basic flow (see Figure 5.36 of Lin, 2007). This southwestward basic flow then advects the vertical vorticity associated with the TC vortex to give a negative-positive VT dipole toward southwest as shown in Figure 4B. Note that in Figure 4B could be interpreted as a wavenumber-2 pattern if one takes into account of the small area of positive vorticity advection embedded in the much larger area of negative vorticity advection, however, the overall distribution is dominated by the negative-positive dipole.
The area with maximum vorticity stretching is dominated by the TC convection, especially the diabatic heating associated with the eyewall convection, thus it forms a ring collocated with the eyewall, as approximately represented by the rainfall distribution. The residual term (Figure 4D) has multiple (three more specifically) maxima of the same order of magnitude, located at different azimuthal angles, thus it is less certain about its contribution to the VT. Part of the reason is that the residual term may involve some complicated physical processes which are related to viscosity, planetary boundary layer parameterization, turbulent mixing, etc. and numerical smoothing or diffusion. These processes may influence the vorticity tendency differently. For example, viscosity tends to spin down the vertical vorticity, but on the other hand, turbulence mixing may cause turbulence dissipation leading to the generation of potential vorticity (e.g., Smith, 1989; Schär and Durran, 1997) and relative vorticity. This problem deserves further investigation, but is out of scope of the present study. In summary, we found that the upstream track deflection is dominated by the vorticity advection with additional contributions from vorticity stretching and viscosity. This is consistent with the studies with a dry flow except the effects of diabatic heating and viscosity (LS11). For real cases, this implies that a TC's motion is mainly steered by the orographically influenced basic flow but slightly modified by convective heating (mainly represented in the vorticity stretching term) and friction (mainly represented by the residual term).
At 168 h, the TC has moved to the foothill (Figure 5) and it turns slightly toward west-southwestward before passing over the mountain (Figure 3). Similar to that at 132 h, the VT field shows a positive VT area located to the west-southwest of the TC vortex center, accompanied by a negative VT area to the east-northeast (Figure 5A). The area of this VT couplet is expanded slightly larger and exhibits a banded structure to the south of the TC center. The positive VT is mainly contributed by the horizontal vorticity advection, vorticity stretching, and viscosity (residual term). The distribution of positive horizontal vorticity advection is also expanded to a larger area and exhibits a much more complicated pattern (Figure 5B) compared to that at 132 h (Figure 4B), which, apparently, is caused by orographic forcing. The positive vorticity stretching (Figure 5C) and residual term located near the maximum VT, i.e., near (x, y) = (2700, 3000 km) (Figure 5D), have made contributions to the positive VT (Figure 5A). Note that the residual term may play more essential contribution than the horizontal vorticity advection to local positive VT. Similar to those at 132 h (Figure 4), the vorticity stretching is associated with the eyewall convection (Figures 5C, 8B) and the positive residual term may be associated with viscosity and turbulence mixing. Thus, we may conclude that the maximum positive VT when the TC moves to the foothill is dominated by the horizontal vorticity advection but with additional contributions from vorticity stretching and viscosity.
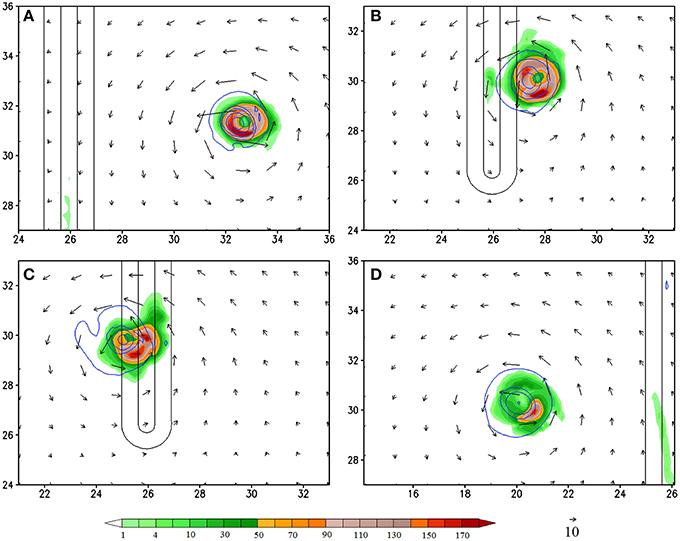
Figure 8. (CNTL/A2) Accumulated 3 h rainfall (shaded, in mm/3 h) at (A) 132 h, (B) 168 h, (C) 180 h, and (D) 216 h. The units of the coordinates in the x and y directions are 100 km. The relative vorticity fields are depicted by contours (0.0001, 0.0005, 0.001, 0.002, 0.003 s−1).
At 180 h when the TC passes over the mountain peak to lee side of the mountain (Figure 6), the area with maximum positive VT is shifted to the west. This indicates that the TC will be moving westward, which indeed is consistent with the simulated TC track (Figure 3B). This differs significantly from the dry simulations of L05 in which the TC resumes its westward movement at the same latitude of the initial bogus vortex. It appears that the anticyclonic (clockwise) turning over the mountain requires a longer period of time, which is not applicable for a relatively narrower mountain as adopted by the CTNL experiment. Unlike that at 132 and 168 h, the maximum positive VT is mainly contributed by the vorticity advection and stretching (Figures 6B,C). Specifically, the vorticity stretching contributing to the positive VT (or say, the TC movement) is the diabatic heating associated with the western portion of the eyewall convection, instead of the convection over the lee slope (upslope with respect to the TC circulation) induced by the orography (Figures 6C, 8C). The residual term makes a negative contribution to the VT (Figures 6A,D), indicating that the frictional effect is spinning down the vorticity over the lee slope. Note that, due to a relatively narrower mountain range, the TC track on the lee side is to the south of the original latitude. This differs significantly from the dry simulations of L05. The anticyclonic (clockwise) turning over the mountain area requires a substantial contribution from the TC convection, which produces strong vorticity stretching over a significant period of time.
At 216 h, the TC vortex moves far away from the mountain to about (x, y) = (2000, 3000 km) (Figure 7). At this time, the maximum positive VT is dominated by vorticity advection, enhanced slightly by vorticity stretching (Figures 7B,C), but with almost no contribution from the frictional effects (Figure 7D). Note that the diabatic heating does make significant contribution to the vorticity stretching to the southeast of the eyewall (Figures 7C, 8D), but not the area with maximum positive VT.
Effects of Landfall Locations and Approach Angles
In this section, the effects of landfall location on track deflection are investigated by performing sensitivity experiments with vorticity budget analyses of the TC making landfall at the northern tip (A1) and the southern tip (track A3) of the mountain. These results are then compared with those of track A2 (case CNTL). Figure 9 shows the simulated tracks A1, A2, and A3 (track A2 has been discussed and analyzed in the previous section). Note that compared to track A2 (Figure 3), track A1 (Figure 9) has less southward deflection when it passes over the mountain. Near the foothill, the maximum positive VT is dominated by the vorticity advection without much contribution from vorticity stretching and frictional effects (Figures 10A–D). This is mainly due to stronger vorticity advection toward the northwest induced by the basic easterly flow and the cyclonic TC circulation around the northern mountain tip. On the lee side, the maximum positive VT (Figure 10E) is dominated by the vorticity advection, enhanced slightly by vorticity stretching (Figures 10F,G), but has almost no contribution from the frictional effect (Figure 10H). The dominance of vorticity advection of the maximum positive VT and TC movement is similar to the dry flow (case N of LS11).
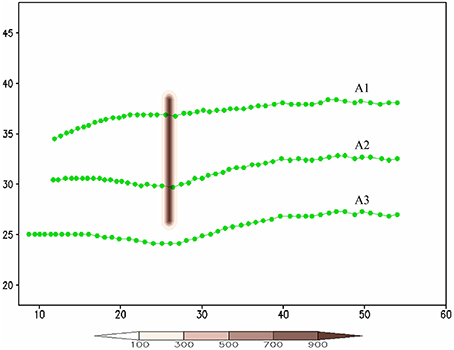
Figure 9. The TC tracks for Tracks A1, A2, and A3. The units of the coordinates in the x and y directions are 100 km.
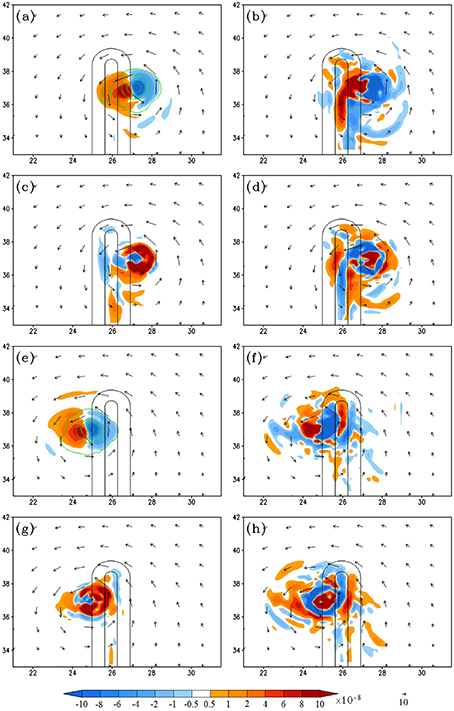
Figure 10. (Track A1) The vorticity budget analysis for Track A1: (A–D) are the 950–500 hPa layer-averaged vorticity tendency (VT), horizontal vorticity advection, relative vorticity stretching, and residual term, respectively, at 171 h. (E–H) Are the same as (A–D), respectively, but at 186 h. The units of the coordinates in the x and y directions are 100 km. The vertical vorticity fields are depicted by contours (0.0001, 0.0005, 0.001, 0.002, 0.003 s−1) in (A,E).
Figure 11 shows the vorticity budget analysis when the TC is passing over the southern tip (case A3). When the TC moves to the southeast tip of the mountain, the maximum positive VT (Figure 11A) is mainly contributed by the frictional effects (Figure 11D) and slightly contributed by the vorticity stretching (Figure 11C), but, unlike the above cases (cases A2 and A1), no contributions from vorticity advection. The frictional effects may be caused by stronger interaction of the northern part of the TC circulation and the southern mountain tip. After passing over the mountain, the track curves northwestward back to its original direction, which is dominated by the vorticity advection, like earlier cases.
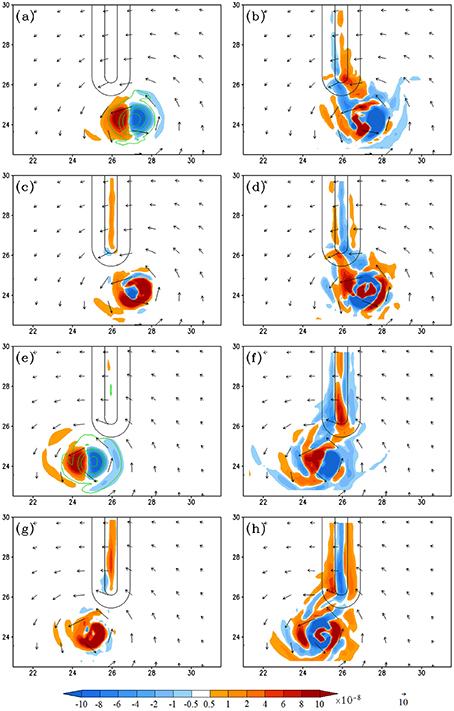
Figure 11. (Track A3) The vorticity budget analysis for Track A3: (A–D) are the 950–500 hPa layer-averaged vorticity tendency (VT), horizontal vorticity advection, relative vorticity stretching, and residual term, respectively, at 171 h. (E–H) Are the same as (A–D), respectively, but at 186 h. The units of the coordinates in the x and y directions are 100 km. The vertical vorticity fields are depicted by contours (0.0001, 0.0005, 0.001, 0.002, 0.003 s−1) in (A,E).
In order to investigate the effects of approach angle and landfall locations on track deflection, three sensitivity experiments mimicking track types AB1, AB2, and AB3 have been performed and the results are shown in Figure 12. All of the simulated TCs approach the south-north oriented mountain range from the southeast or 135°. The TC makes landfall near the northern tip, center, and southern tip in cases AB1, AB2, and AB3, respectively. The mechanisms of the track deflection for tracks AB1, AB2, and AB3 are similar to those for tracks A1, A2, and A3 as discussed above. Tracks AB2 and AB3 are less curvy compared to those of A2 an A3 due to less orographic blocking caused by approach angle. It is interesting to observe that track AB1 is curved opposite to tracks AB2 and AB3 (i.e., turning cyclonically when the TC is passing over the northern tip). This is consistent with that found in dry experiments of LS11 where the vorticity advection upstream of the mountain range is caused by the flow splitting of the basic flow. Track AB1 may be used to explain most of the cyclonic track over northern Taiwan experienced by typhoons (e.g., Wang, 1980; Chang, 1982; see Figure 1A of L05) since the Central Mountain Range of Taiwan has a relatively shorter scale in the north-south direction and most of the typhoons approached the CMR from the southeast, instead of east. Thus, a TC tends to go around the corner due to basic flow splitting and the dominant control of positive vorticity tendency (VT) by vorticity advection.
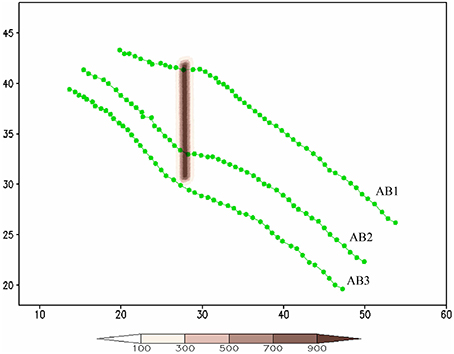
Figure 12. The TC tracks for AB1, AB2, and AB3. The units of the coordinates in the x and y directions are 100 km.
As classified by H09 and illustrated in Figure 2, hurricanes making landfall on the Gulf coast may transverse along the SCA to the east (type B) or west (type C). This means the approach angle is turned to 180° from the south (southwest) for a south-to-north (southwest-to-northwest) oriented mountain range. Figure 13 shows the TC tracks for sensitivity experiments B and C. These track deflections are quite interesting. For both tracks, the TC turns toward the mountain in the southern portion of the mountain range, crosses over the mountain peak to the foothill on the lee side near the center (track B) or the northern end (track C) of the mountain range, wobbles near the northern tip of the mountain range, and then resumes its original track parallel but to the west of the mountain.
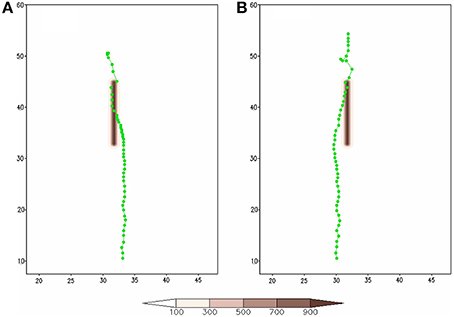
Figure 13. The TC tracks for (A) Track B and (B) Track C. The units of the coordinates in the x and y directions are 100 km.
The mechanisms of the track deflection in case B can also be explained by the vorticity budget analysis. Figure 13A shows the TC continuously moving northward along the mountain. When the TC moves along the eastern flank in the southern portion of the mountain range, the vorticity budget analysis at 150 h indicates that the positive VT is influenced by all major terms, including vorticity advection, vorticity stretching, and residual terms (Figures 14A–D). The vorticity stretching is mainly associated with the latent heat released by the eyewall convection, as evidenced by the 3-h rainfall field (Figure 14I). When the TC moves northward to y = 3300 km at 204 h (Figures 14E–H,J), it also moves westward simultaneously toward the eastern slope around x = 3000 km. During this period, the maximum positive VT is also influenced by the combined effects of vorticity advection, stretching and viscosity. Since the positive VT is located toward the northwest of the TC center, the TC is deflected toward northwest while it moves northward along the mountain ridge. This continues to be the case as the TC moves farther northward at later time (not shown).
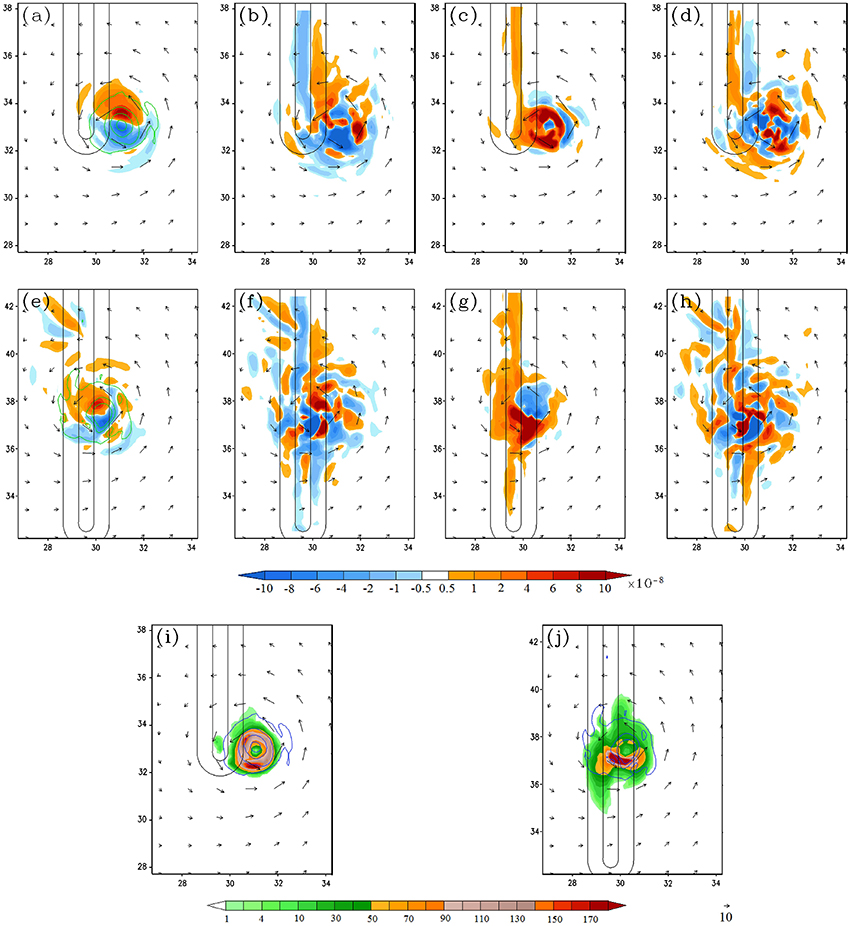
Figure 14. (Track B) The vorticity budge analysis for Track B: (A–D) are the 950–500 hPa layer-averaged vorticity tendency (VT), horizontal vorticity advection, relative vorticity stretching, and residual term, respectively, at 150 h. (E–H) Are the same as (A–D) respectively, but at 204 h. (I,J) Are the 3 h accumulated rainfall at 150 h and 204 h (in mm/3 h), respectively. The units of the coordinates in the x and y directions are 100 km. The vertical vorticity field is depicted by contours (0.0001, 0.0005, 0.001, 0.002, 0.003 s−1) in (A).
For track C, the track behavior, vorticity budget analysis, and mechanisms for track deflection are similar to those for track B. The simulated track C, which is deflected toward the mountain and crosses over the mountain peak, is similar to the track of Hurricane Ivan (2004) although Ivan's track might have also been influenced by its synoptic environment.
Concluding Remarks
In this study, a series of idealized numerical experiments are performed using the ARW model to investigate the effects of landfall location and approach angle on track deflection of a tropical cyclone (TC) passing over an idealized South-Central Appalachian (SCA) Mountain. A bogus TC is initialized with a climatological tropical sounding with land surface, moist and PBL processes. A series of sensitivity experiments and vorticity budget analysis are performed to help understand the effects of landfall locations and approach angles on the track deflection.
When the TC landfalls on the central portion of the mountain range (Track A2), it is deflected to the south upstream, passes over the mountain anticyclonically, and then moves westward downstream. The TC motion is steered by the positive vorticity tendency (VT). When the TC is away from the mountain, the positive VT is dominated by horizontal vorticity advection upstream and downstream, but with additional influence from the stretching and residual terms. Physically, the stretching and residual terms are mainly associated with diabatic heating and friction effects, respectively. Near the foothill, the TC turns slightly toward west-southwestward before passing over the mountain, contributed by horizontal vorticity advection, vorticity stretching, and residual terms. When the TC passes over the mountain peak to the lee (western) side, it resumes the westward movement. At this time, the area with maximum positive VT is dominated by the horizontal vorticity advection and stretching. When the TC moves farther away from the mountain, the maximum positive VT is dominated by vorticity advection, enhanced slightly by vorticity stretching. Note that the track deflection upstream and downstream of the mountain, which are dominated by vorticity advection, is similar to the dry flow. The present results are similar to that found in LS 11. However, it is very different in the vicinity of the mountain. In LS11, the vorticity stretching occurs mainly over the lee side and its immediate downstream area, while in this study it makes contribution to the VT over both the upslope and downslope of the mountain due to the diabatic heating associated with moist convection. In addition, the vorticity advection upstream of the mountain is mainly caused by the flow splitting in LS11, which is less significant in the moist flow as simulated in this study. This can be explained by the weaker orographic blocking associated with strong TC convection in the moist flow.
Effects of landfall location on track deflection are investigated by performing a series of sensitivity experiments of the TC making landfall at the northern tip (A1) and the southern tip (A3) of the mountain. When the TC landfalls near the northern (southern) tip (Track A1 (A3)), it experiences less (more) southward deflection due to stronger (weaker) vorticity advection around the tip. The track deflections in the present cases are similar to those in the dry flow (LS11), except that there exists no track discontinuity due to the weaker orographic blocking associated with strong TC convection. The combined effects of approach angle and landfall location on track deflection are investigated by performing three sensitivity experiments, AB1, AB2, and AB3, in which the TC approaches the south-north oriented mountain range from the southeast (or 135°) and makes landfall on the northern tip, center, and southern tip, respectively. The mechanisms of the track deflection for AB1-AB3 are similar to those for A1-A3, but are less curvy due to weaker orographic blocking. The track deflection of case AB2 is similar to that simulated in a dry flow (case SE) in LS11.
For TCs going along the mountain range along the eastern flank (track B) and the western flank (track C), both of them are deflected toward the mountain range, cross over the mountain peak to the other side of the mountain, and then resume their northward movement. In these cases, the positive VT is influenced by all horizontal vorticity advection, vorticity stretching, and residual terms, which are associated with diabatic heating and frictional effects, due to longer and stronger interaction with the mountain range. The major difference of this study from the dry flow is that the vorticity stretching is mainly caused by diabatic heating in the current moist flow, instead of by lee slope vorticity stretching in LS11.
Overall, the TC is steered by the maximum positive VT, which is dominated by the vorticity advection far away from the mountain. The vorticity stretching and residual terms, which are dominated by the diabatic heating and frictional effects, respectively, make additional influences on track deflection when the TC is near or over the mountain area. Note that in the present study, we found that the vorticity tendency (VT) approach is appropriate since the TC track is consistent with the VT, similar to that applied to TC motion, such as northwestward beta drift (e.g., Holland, 1983) and shear effects (e.g., Wu and Emanuel, 1993). The PV Tendency (PVT) diagnostic approach, as originally proposed by Wu and Wang (2000) and Chan et al. (2002) and applied to real-case simulations (e.g., Hsu et al., 2013; Tang and Chan, 2013, 2014; Wang et al., 2013), appears to be an attractive method and will be considered in our future research.
Author Contributions
LL: Design and simulate cases, analyze the simulated results, and write the paper. YL: Design the experiments, analyze the simulated results and write the paper. SC: Install the idealized TC model, help design the idealized experiments, run cases, and proofreading the paper.
Conflict of Interest Statement
The authors declare that the research was conducted in the absence of any commercial or financial relationships that could be construed as a potential conflict of interest.
Acknowledgments
The help from Dr. David S. Nolan's on idealized WRF modeling with a bogus vortex and the proofreading of the manuscript by Guy Oldaker IV are highly appreciated. The anonymous reviewers' comments have improved the quality of the paper significantly. The first two authors are supported by the NSF Award AGS-1265783, OCI-1126543, and CNS-1429464, while the third author is supported by NSF AGS-1015910.
References
Bender, M. A., Tuleya, R. E., and Kurihara, Y. (1987). A numerical study of the effect of island terrain on tropical cyclones. Mon. Wea. Rev. 115, 130–155. doi: 10.1175/1520-0493(1987)115<0130:ANSOTE>2.0.CO;2
Brand, S., and Blelloch, J. W. (1974). Changes in the characteristics of typhoons crossing the island of Taiwan. Mon. Wea. Rev. 102, 708–713.
Chan, J. C. L., Ko, F. M. F., and Lei, Y. M. (2002). Relationship between potential vorticity tendency and cyclone motion. J. Atmos. Sci. 59, 1317–1336. doi: 10.1175/1520-0469(2002)059<1317:RBPVTA>2.0.CO;2
Chang, S. W.-J. (1982). The orographic effects induced by an island mountain range on propagating tropical cyclones. Mon. Wea. Rev. 110, 1255–1270.
Chen, S.-H., and Sun, W.-Y. (2002). A one-dimensional time-dependent cloud model. J. Meteor. Soc. Japan 80, 99–118. doi: 10.2151/jmsj.80.99
Dunion, J. P. (2011). Re-writing the climatology of the Tropical North Atlantic and Caribbean Sea atmosphere. J. Clim. 24, 893–908. doi: 10.1175/2010JCLI3496.1
Fovell, R. G., Corbosiero, K. L., and Kuo, H.-C. (2009). Cloud microphysics impact on hurricane track as revealed in idealized experiments. J. Atmos. Sci. 66, 1764–1778. doi: 10.1175/2008JAS2874.1
Harville, S. L. (2009). (H09): Effects of Appalachian Topography on Precipitation from Landfalling Hurricanes. MS thesis, North Carolina State University. Available online at: http://repository.lib.ncsu.edu/ir/handle/1840.16/2849
Holland, G. J. (1983). Tropical cyclone motion: environmental interaction plus a beta effect. J. Atmos. Sci. 40, 328–342.
Hong, S.-Y., and Pan, H.-L. (1996). Non-local boundary layer vertical diffusion in Medium-Range Forecast model. Mon. Wea. Rev. 124, 1215–1238.
Hsu, L.-H., Kuo, H.-C., and Fovell, R. G. (2013). On the geographic asymmetry of typhoon translation speed across the mountainous island of Taiwan. J. Atmos. Sci. 70, 1006–1022. doi: 10.1175/JAS-D-12-0173.1
Huang, Y.-H., Wu, C.-C., and Wang, Y. (2011). The influence of island topography on typhoon track deflection. Mon. Wea. Rev. 139, 1708–1727. doi: 10.1175/2011MWR3560.1
Jian, G.-J., and Wu, C.-C. (2008). A numerical study of the track deflection of Super-Typhoon Haitang (2005) prior to its landfall in Taiwan. Mon. Wea. Rev. 136, 598–615. doi: 10.1175/2007MWR2134.1
Kain, J. S. (2004). The Kain-Fritsch convective parameterization: an update. J. Appl. Meteor. 43, 170–181. doi: 10.1175/1520-0450(2004)043<0170:TKCPAU>2.0.CO;2
Kain, J. S., and Fritsch, J. M. (1993). Convective parameterization for mesoscale models: the Kain-Fritsch scheme. Represent. Cumulus Conv. Numerical Models Meteor. Monogr. Amer. Meteor. Soc. 24, 165–170. doi: 10.1007/978-1-935704-13-3_16
Lin, Y.-L. (2007). Mesoscale Dynamics. Cambridge, UK: Cambridge University Press. doi: 10.1017/cbo9780511619649
Lin, Y.-L., Chen, S.-Y., Hill, C. M., and Huang, C.-Y. (2005). (L05): Control parameters for tropical cyclones passing over mesoscale mountains. J. Atmos. Sci. 62, 1849–1866. doi: 10.1175/JAS3439.1
Lin, Y.-L., Farley, R. D., and Orville, H. D. (1983). Bulk parameterization of the snow field in a cloud model. J. Clim. Appl. Meteor. 22, 1065–1092.
Lin, Y.-L., Han, J., Hamilton, D. W., and Huang, C.-Y. (1999). Orographic influence on a drifting cyclone. J. Atmos. Sci. 56, 534–562. doi: 10.1175/1520-0469(1999)056<0534:OIOADC>2.0.CO;2
Lin, Y.-L., and Savage, L. C. (2011). (LS11): Effects of landfall location and the approach angle of a cyclone vortex encountering a mesoscale mountain range. J. Atmos. Sci. 68, 2095–2106. doi: 10.1175/2011JAS3720.1
Lin, Y.-L., Witcraft, N. C., and Kuo, Y.-H. (2006). Dynamics of track deflection associated with the passage of tropical cyclones over a mesoscale mountain. Mon. Wea. Rev. 134, 3509–3538. doi: 10.1175/MWR3263.1
Mallen, K. J., Montgomery, M. T., and Wang, B. (2005). Reexamining the near-core radial structure of the tropical cyclone primary circulation: implications for vortex resiliency. J. Atmos. Sci. 62, 408–425. doi: 10.1175/JAS3377.1
Nolan, D. S. (2011). Evaluating environmental favorableness for tropical cyclone development with the method of point-downscaling. J. Adv. Model. Earth Syst. 3, M08001–M08028. doi: 10.1029/2011ms000063
Nolan, D. S., Atlas, R., Bhatia, K. T., and Bucci, L. R. (2013). Development and validation of a hurricane nature run using the Joint OSSE Nature Run and the WRF model. J. Adv. Earth. Model. Syst. 5, 1–24. doi: 10.1002/jame.20031
O'Handley, C., and Bosart, L. F. (1996). The impact of the Appalachian Mountains on cyclonic weather systems. Part I: A climatology. Mon. Wea. Rev. 124, 1353–1373. doi: 10.1175/1520-0493(1996)124<1353:TIOTAM>2.0.CO;2
Rakotomavo, Z. A. P. H., Raholijao, N., and Lin, Y.-L. (2011). Effects of Madagascar Mountain Range on tropical cyclone tracks. Part I: Classification of cylone tracks reaching the East Coast. 41. Available online at: http://mesolab.ncat.edu/publications%20%28web%29/2011_Rakotomavo%20et%20al._Effects%20of%20Madagascar%20mountains%20on%20TC%20tracks.pdf or http://mesolab.ncat.edu
Schär, C., and Durran, D. R. (1997). Vortex formation and vortex shedding in continuously stratified flows past isolated topography. J. Atmos. Sci. 54, 534–554.
Schwarz, F. K. (1970). The unprecedented rains in Virginia associated with the remnants of Hurricane Camille. Mon. Wea. Rev. 98, 851–859. doi: 10.1175/1520-0493(1970)098<0851:TURIVA>2.3.CO;2
Skamarock, W. C., Klemp, J. B., Dudhia, J., Gill, D. O., Barker, D. M., Duda, M. G., et al. (2008). A Description of the Advanced Research WRF version 3. NCAR technical note. Available online at: http://www2.mmm.ucar.edu/wrf/users/docs/arw_v3.pdf
Smith, R. B. (1979). The influence of mountains on the atmosphere. Adv. Geophys. 21, 87–230. doi: 10.1016/S0065-2687(08)60262-9
Smith, R. B. (1989). “Hydrostatic airflow over mountains,” in Advances in Geophysics, Vol. 31., ed B. Saltzman (New York, NY: Academic Press), 1–41.
Stewart, S. R. (2004). Hurricane Ivan, 2-24 September 2004. Tropical Cyclone Report, National Hurricane Center, NOAA, 1–44. Available online at: http://www.nhc.noaa.gov/data/tcr/AL092004_Ivan.pdf
Tang, C. K., and Chan, J. C. (2013). Idealized simulations of the effect of Taiwan and Philippines topographies on tropical cyclone tracks. Q. J. Roy. Meteor. Soc. 140, 1578–1589. doi: 10.1002/qj.2240
Tang, C. K., and Chan, J. C. (2014). Idealized simulations of the effect of local and remote topographies on tropical cyclone tracks. Q. J. Roy. Meteor. Soc. 141, 2045–2056. doi: 10.1002/qj.2498
Wang, C.-C., Chen, Y.-H., Kuo, H.-C., and Huang, S.-Y. (2013). Sensitivity of typhoon track to asymmetric latent heating/rainfall induced by Taiwan topography: a numerical study of Typhoon Fanapi (2010). J. Geophys. Res. Atmos. 118, 3292–3308. doi: 10.1002/jgrd.50351
Wang, S.-T. (1980). Prediction of the Movement and Strength of Typhoons in Taiwan and its Vicinity. Research Report, 108. Taipei: National Science Council.
Wu, C.-C. (2001). Numerical simulation of Typhoon Gladys (1994) and its interaction with Taiwan terrain using the GFDL hurricane model. Mon. Wea. Rev. 129, 1533–1549. doi: 10.1175/1520-0493(2001)129<1533:NSOTGA>2.0.CO;2
Wu, C.-C., and Emanuel, K. A. (1993). Interaction of a baroclinic vortex with background shear: application to hurricane movement. J. Atmos. Sci. 50, 62–76.
Wu, C.-C., Li, T.-H., and Huang, Y.-H. (2015). Influence of mesoscale topography on tropical cyclone tracks: further examination of the channeling effect. J. Atmos. Sci. 72, 3032–3050. doi: 10.1175/JAS-D-14-0168.1
Wu, L., and Wang, B. (2000). A potential vorticity tendency diagnostic approach for tropical cyclone motion. Mon. Wea. Rev. 128, 1899–1911. doi: 10.1175/1520-0493(2000)128<1899:APVTDA>2.0.CO;2
Yeh, T.-C., and Elsberry, R. L. (1993a). Interaction of typhoons with the Taiwan topography. Part I: upstream track deflection. Mon. Wea. Rev. 121, 3193–3212.
Yeh, T.-C., and Elsberry, R. L. (1993b). Interaction of typhoons with the Taiwan topography. Part II: continuous and discontinuous tracks across the island. Mon. Wea. Rev. 121, 3213–3233.
Zehnder, J. A. (1993). The influence of large-scale topography on barotropic vortex motion. J. Atmos. Sci. 50, 2519–2532. doi: 10.1175/1520-0469(1993)050<2519:TIOLST>2.0.CO;2
Keywords: tropical cyclones, orographic effects, TC track deflection, idealized simulations, approach angle, landfalling location
Citation: Liu L, Lin Y-L and Chen S-H (2016) Effects of Landfall Location and Approach Angle of an Idealized Tropical Cyclone over a Long Mountain Range. Front. Earth Sci. 4:14. doi: 10.3389/feart.2016.00014
Received: 08 September 2015; Accepted: 01 February 2016;
Published: 19 February 2016.
Edited by:
Daniel J. Kirshbaum, McGill University, CanadaReviewed by:
Ana María Durán-Quesada, University of Costa Rica, Costa RicaEric Hendricks, National Park Service, USA
Copyright © 2016 Liu, Lin and Chen. This is an open-access article distributed under the terms of the Creative Commons Attribution License (CC BY). The use, distribution or reproduction in other forums is permitted, provided the original author(s) or licensor are credited and that the original publication in this journal is cited, in accordance with accepted academic practice. No use, distribution or reproduction is permitted which does not comply with these terms.
*Correspondence: Yuh-Lang Lin, eWxpbkBuY2F0LmVkdQ==